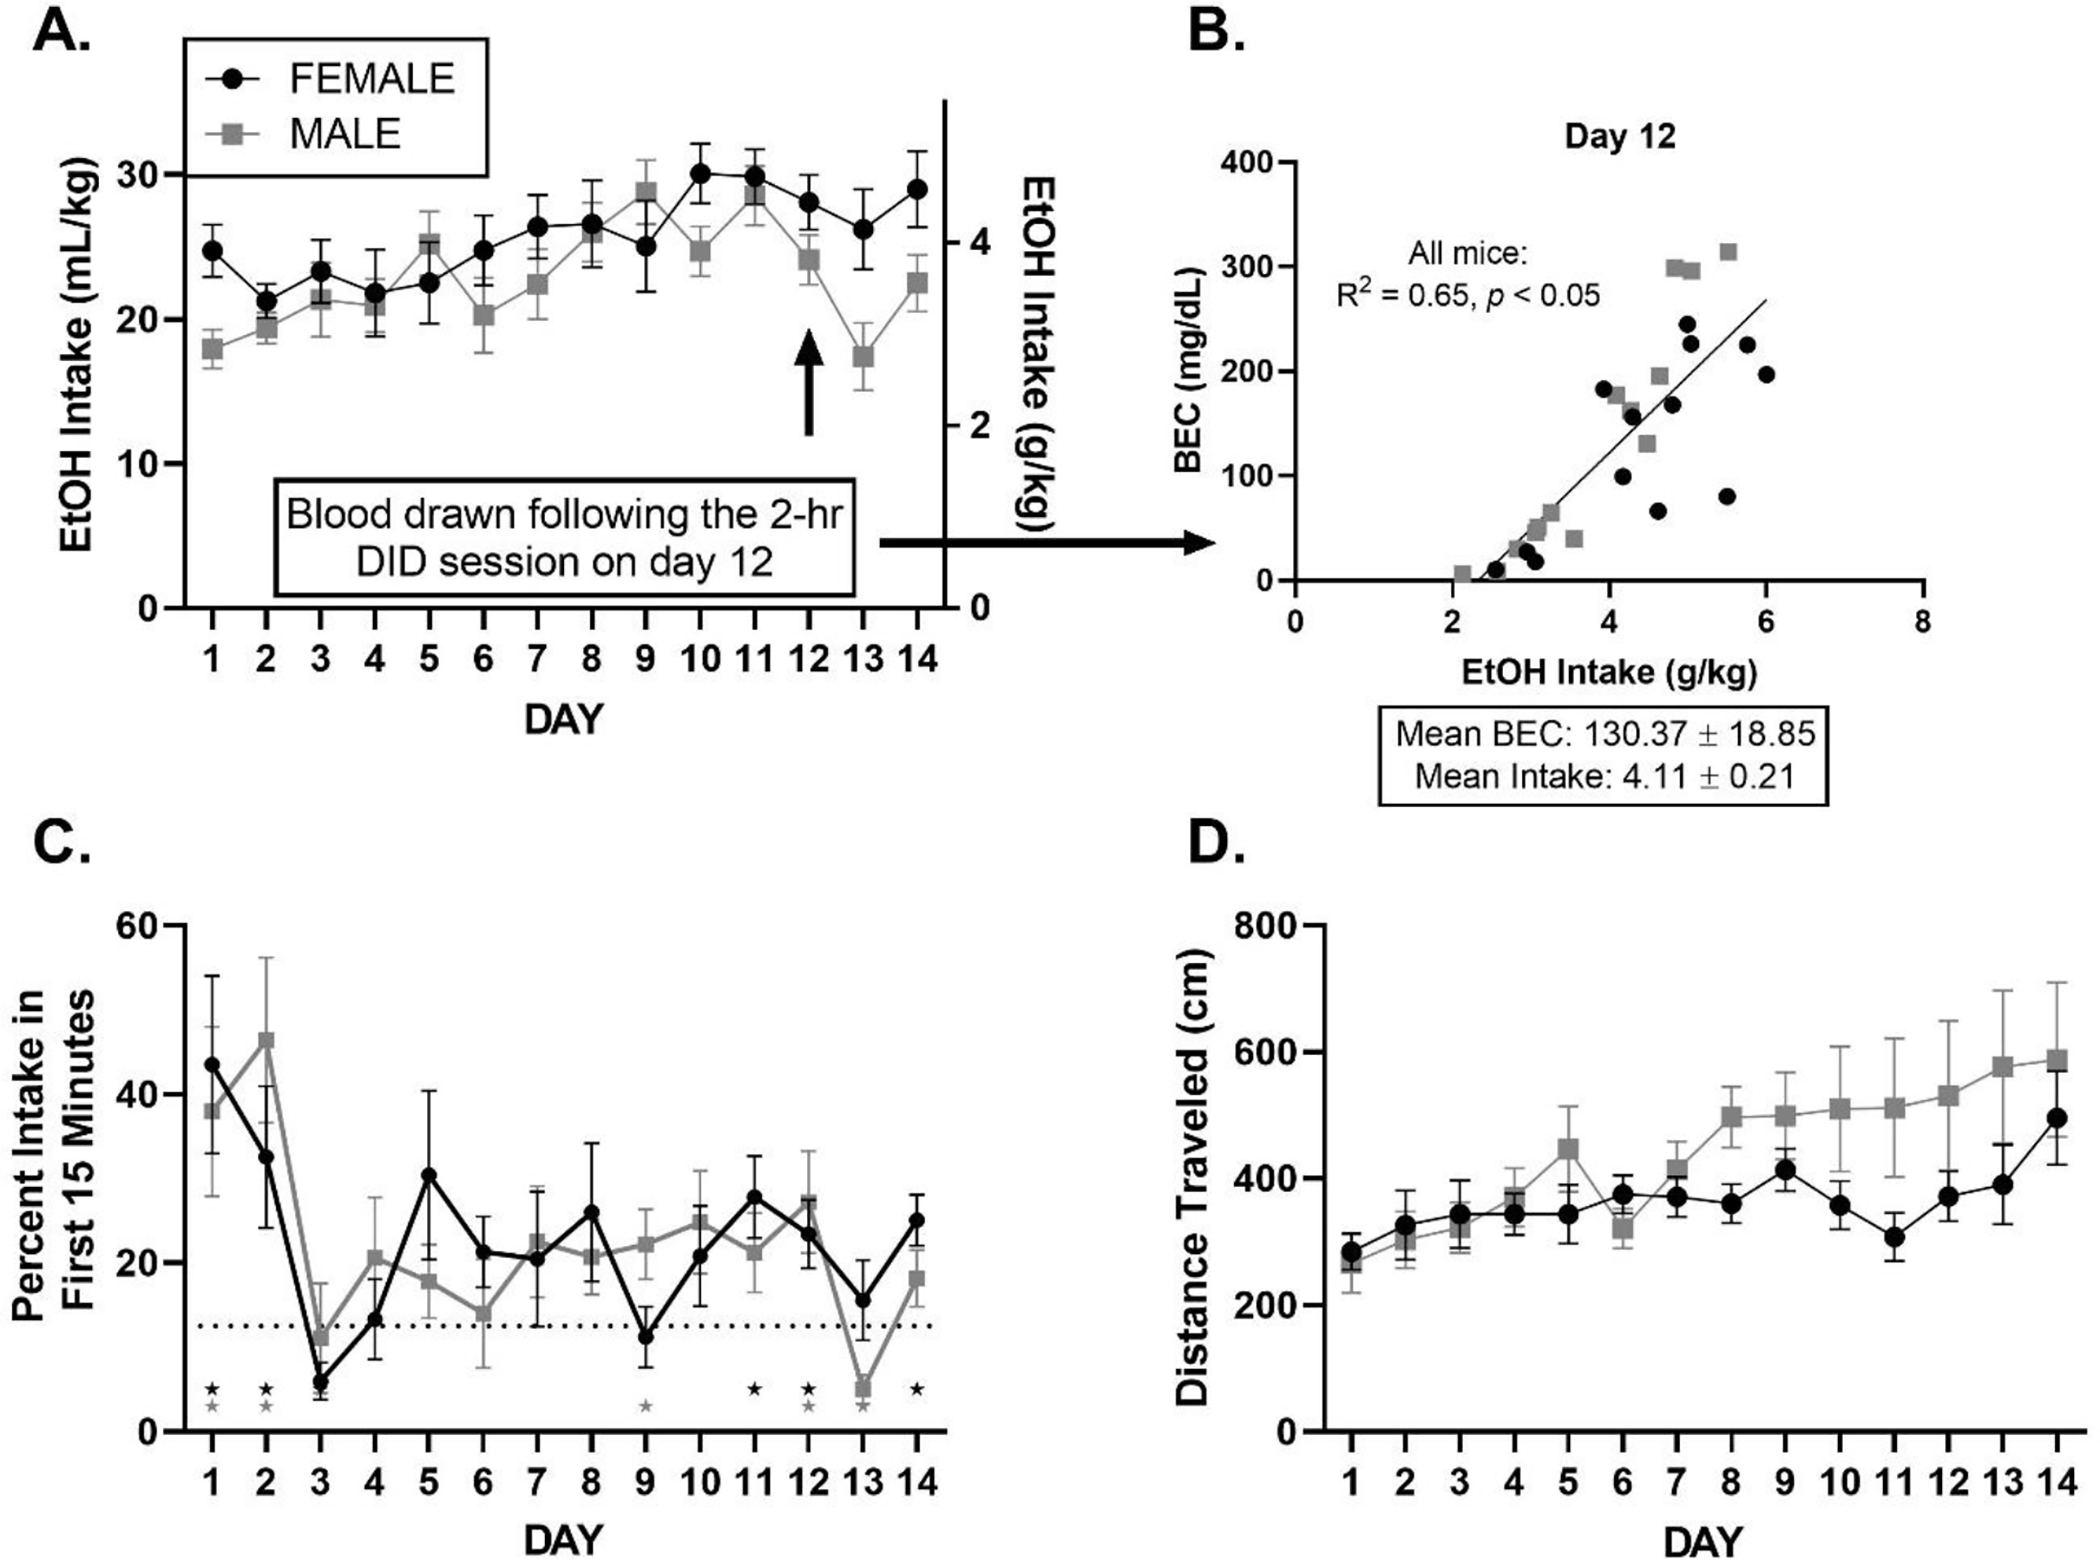
Figure 2.

All graphs are displayed as mean ± SEM over days of 2-hr DID prior to ketamine or saline treatment. A: EtOH Drinking History. Total 20% EtOH intake varies over days. B. BEC. There is a relationship between EtOH intake and BEC during the 2-week drinking history. Intake (g/kg) and BEC (mg/dL) mean ± SEM are presented. C: Frontloading: Percent of EtOH intake within the first 15 minutes. Stars indicate that mice consumed significantly higher than 12.5% (dashed line) of their total intake within the first 15 minutes of the DID session on a given day (12.5% represents the frontloading threshold, please see further description in Methods: Statistics). D: Locomotion varies over days.
