

Abstract
Many efforts targeting amyloid‐β (Aβ) plaques for the treatment of Alzheimer's Disease thus far have resulted in failures during clinical trials. Regional and temporal heterogeneity of efficacy and dependence on plaque maturity may have contributed to these disappointing outcomes. In this study, we mapped the regional and temporal specificity of various anti‐Aβ treatments through high‐resolution light‐sheet imaging of electrophoretically cleared brains. We assessed the effect on amyloid plaque formation and growth in Thy1‐APP/PS1 mice subjected to β‐secretase inhibitors, polythiophenes, or anti‐Aβ antibodies. Each treatment showed unique spatiotemporal Aβ clearance, with polythiophenes emerging as a potent anti‐Aβ compound. Furthermore, aligning with a spatial‐transcriptomic atlas revealed transcripts that correlate with the efficacy of each Aβ therapy. As observed in this study, there is a striking dependence of specific treatments on the location and maturity of Aβ plaques. This may also contribute to the clinical trial failures of Aβ‐therapies, suggesting that combinatorial regimens may be significantly more effective in clearing amyloid deposition.
Keywords: Alzheimer's disease, amyloid‐beta, brain, light‐sheet microscopy, tissue clearing
Subject Categories: Methods & Resources, Neuroscience
The brain is highly compartmentalized with many distinct regions. It is unknown how drugs for treating Alzheimer's Disease (AD) work across brain regions and disease stages. We developed a technology to quantify the effects of different AD drugs throughout the brain at different time points.
Introduction
Pathological protein aggregations typically occur in distinct neuroanatomical locations and give rise to specific clinical pictures (Lau et al, 2020; Shahnawaz et al, 2020), yet the determinants of this specificity are poorly understood. In Alzheimer's Disease (AD), the most prevalent neurodegenerative disorder (Fiest et al, 2016), deposition of amyloid‐β (Aβ) plaques occurs in a well‐characterized sequence (Braak et al, 1993; Hardy & Selkoe, 2002; Thal et al, 2002). This plaque load can be effectively reduced by either quenching Aβ production (De Strooper et al, 2010), reducing the propagation of Aβ aggregates (Jiang et al, 2013), or enhancing Aβ catabolism (Sevigny et al, 2016). However, the clinical efficacy of Aβ removal is still debated (Morris et al, 2018; Howard & Liu, 2020), perhaps because intervention is too late to be efficacious (Sperling et al, 2013). It is also conceivable that anti‐Aβ drugs remove plaques differentially in distinct CNS regions, some of which may not coincide with the areas that matter most to proper brain functioning.
To investigate this latter hypothesis, we developed a high‐throughput quantitative 3D histology (Q3D) platform for optically clarifying, staining, imaging, and quantifying Aβ plaques in whole brains of mice. Aβ plaques were electrophoretically stained in cleared brains and imaged with a mesoscale selective plane illumination microscope (mesoSPIM; Voigt et al, 2019). In APP/PS1 mice (Radde et al, 2006), we tested the effects of the polythiophene LIN5044, which intercalates with amyloids and is therapeutic in prion diseases (Margalith et al, 2012; Herrmann et al, 2015), the BACE1 inhibitor NB360 (Neumann et al, 2015, 2019), and a β1‐antibody (Paganetti & Schmitz, 1996). We found that each drug had differential efficacy on plaque formation, plaque growth, and plaque maturity, as well as a striking spatiotemporal dependence. We further found that the two most effective treatments for reducing plaque growth, BACE1 and LIN5044, acted onto distinct, largely non‐overlapping brain regions. Finally, the alignment of whole‐brain treatment maps to a spatial transcriptomics atlas allowed us to identify transcriptional signatures correlating with the effectiveness of each drug.
Results
Rapid tissue clearing and staining platform
Detergent‐mediated lipid extraction from hydrogel‐embedded tissues is facilitated by electrophoretic mobilization of detergent molecules (Chung et al, 2013; Tomer et al, 2014) in a buffer‐filled container. However, the electrical resistivity of 4% paraformaldehyde‐fixed PBS‐soaked brain tissue is fourfold higher than that of PBS (Appendix Fig S1E). Therefore, any buffer surrounding the specimen short‐circuits its electrophoresis. We resolved this issue by constructing a focused electrophoretic clearing (FEC) device that uncouples buffer recirculation in the anodic and cathodic circuits with an insulating layer (Fig 1A; Appendix Fig S1). By forcing the electrical current to traverse the tissue specimen (130 mA in constant‐current, 39.5°C), FEC reduced the clearing time from 48 to 120 with CLARITY to 6–14 h (Chung et al, 2013, Tomer et al, 2014) and resulted in homogeneous high‐quality clearing (Fig 1B and C; Appendix Fig S1G and H). Similar to other hydrogel‐based clearing methods, brain tissue showed some swelling during clearing, which was reversible upon PBS washing and refractive‐index matching.
Figure 1. Focused electrophoresis improves tissue clearing efficiency.
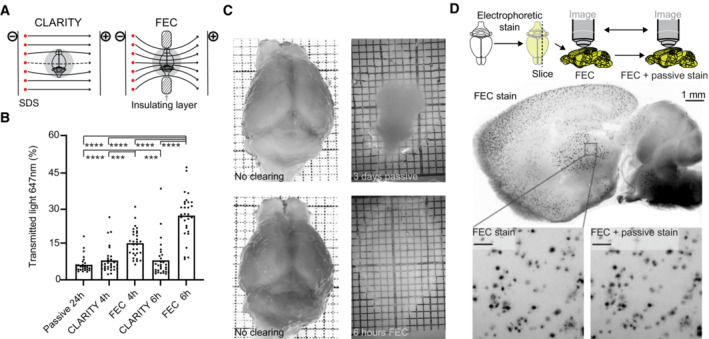
- Schematics of both CLARITY and focused electrophoretic clearing (FEC). An insulating layer constrains the electrical field through the tissue.
- Light transmittance of tissue increased more rapidly with FEC than with CLARITY. Each datapoint plotted is the mean from three neighboring transmittance readings (hence resulting in 10 datapoints from the 30 measurements/brain, technical replicates; One‐way ANOVA ***P < 0.001, ****P < 0.0001; n = 3 per group, biological replicates).
- Comparison of mouse brains cleared by FEC (6 h) and passive (3 days). Passive clearing was incomplete even after 3 days.
- After whole‐brain electrophoretic staining with polythiophenes, sagittal 500 μm slices were cut and plaques were counted. By passively re‐staining the same slice, no additional plaques were detected (“FEC + passive”). Focal shifts after slice reprocessing account for the slight differences between the images. One biological replicate. Scale bars: 100 μm.
Source data are available online for this figure.
For Aβ plaque staining of intact mouse brains by electrophoresis, we constructed buffer‐filled chambers hosting the electrodes. Their inner faces were cast with 10% polyacrylamide in tris‐tricine buffer and functioned as electrically conductive contact surfaces. The sample was mounted with a holder between the two polyacrylamide walls. This allowed electrophoresis to occur through the buffers, the gels, and the tissue specimen; spanning 10 cm between the two electrodes (Appendix Fig S2A and B). The electric resistance of the electrophoretic system (20 V, 20°C) increased from initially ~ 2 to ~ 20 kΩ after 2 h (Appendix Fig S2C).
We then ran native‐gel electrophoreses of proteins with various charges at different pH and ionic strengths. Tris‐tricine (50 mM each) at pH 8.5 yielded the best results (Appendix Fig S2D–G). As expected, the electrophoretic mobility of proteins was influenced by the charge of covalently coupled fluorophores (Appendix Fig S2D–G). The polythiophenes qFTAA (616.5 g/mol, m/z = 205.5) and hFTAA (948.9 g/mol, m/z = 237.125) were dissolved in agarose (600 μl, congealing temperature 26–30°C) and cast on the acrylamide‐tissue interface in order to confine them to the smallest possible volume. Under these conditions, the dye front traversed the entire brain within 2 h.
An uneven passage of the dye front through the brain may lead to local inhomogeneities of plaque detection, particularly at gel–liquid interfaces. To investigate this question, a hydrogel‐embedded and cleared APP/PS1 brain was electrophoretically stained with polythiophenes (2 h) and cut into 500‐μm sagittal sections with a vibratome. Free‐floating sections were imaged with a fluorescent stereomicroscope. Then, the sections were passively re‐stained with the same polythiophene dyes using a well‐established protocol (Nystrom et al, 2013; Rasmussen et al, 2017), and images were acquired again. The numbers of Aβ plaques were 3,085 and 3,061 plaques before and after re‐staining, respectively, and their morphology was very similar (Fig 1D; Appendix Fig S3). Hence, the sensitivity and spatial homogeneity of electrophoretic plaque staining of whole brains were not inferior to that of conventional histochemical slice staining. Slight differences in plaque counts and morphology were a result of physical distortions of the slices during passive staining and due to focal shifts during re‐imaging of the free‐floating slices.
Antibody Aβ17‐24 recognizes early plaques and stains their entire surface, whereas N3pE labels plaques that accumulate at later stages (Rijal Upadhaya et al, 2014). Likewise, the polythiophene hFTAA stains the entire area of early plaques, whereas qFTAA stains the cores of plaques in older mice. The qFTAA/hFTAA ratio correlates with plaque compactness (Nystrom et al, 2013) and is used as a proxy for their maturity. We stained histological sections (3 μm) from paraffin‐embedded APP/PS1 brains with Aβ17‐24 or N3pE, followed by staining with qFTAA and hFTAA. The hFTAA and Aβ17‐24 signals were largely superimposable and identified more plaques than qFTAA and N3pE, which stained selectively the cores of a subset of plaques (Fig EV1A). Most Aβ17‐24+ N3pE− plaques were hFTAA+ qFTAA−, suggesting that they contained less mature amyloid. We conclude that the qFTAA/hFTAA stain is a good proxy to plaque maturity and suitable for whole‐brain staining (Fig EV1B and C).
Figure EV1. Homogeneous whole‐brain Aβ plaque stain by electrophoretic infusion of qFTAA and hFTAA polythiophenes.
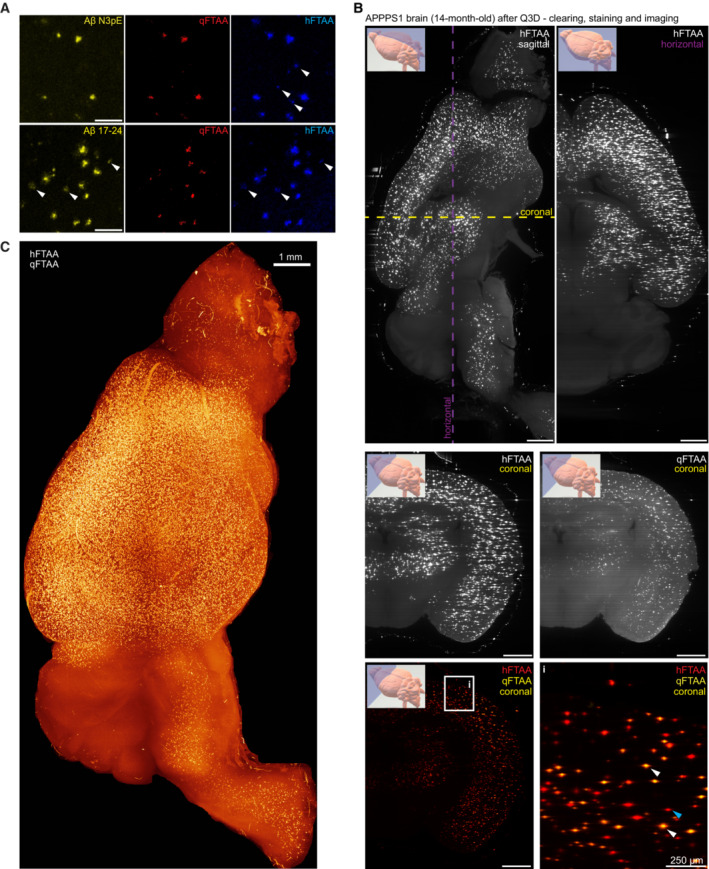
- Plaque maturation states determined with qFTAA vs hFTAA were compared to those identified by N3pE (pyroglutamylated Aβ) vs Aβ17‐24 (all Aβ moieties). APPPS1 brain sections from one mouse (paraffin, 10 μm) were stained with Aβ‐N3pE or Aβ17 24 followed by qFTAA+hFTAA staining. Aβ‐N3pE detected plaques similarly to qFTAA, while hFTAA highlighted additional plaques. Conversely, Aβ17‐24 labeled the entire plaque population similarly to hFTAA (white arrowheads). Scale bars: 100 μm.
- Lightsheet imaging and digital reslicing of cleared whole brains. Plaques were visible in the cortex and in deep diencephalic areas, indicative of homogeneous dye penetration and image acquisition. Plaque maturity was assessed with qFTAA+hFTAA co‐staining. As an example, hFTAA identified all plaques (blue arrows), whereas qFTAA stained the cores (white arrows) of more mature plaques. Scale bars: 1 mm.
- Whole‐brain hemisphere rendering of an APPPS1 mouse with hFTAA signal. The cerebellum, where the Thy1 promoter is inactive, was unaffected.
Source data are available online for this figure.
Evaluation of anti‐Aβ therapies by Q3D
Groups of 2‐month old or 11‐month old APP/PS1 mice (30 and 25 mice/group, henceforth referred to as “young” and “old,” respectively) were treated for 90 days with the BACE1 inhibitor NB360 (0.5 g inhibitor/kg chow, ~ 3 mg inhibitor/day/mouse), with β1 antibody against Aβ (0.5 mg in 200 μl PBS), 1×/week intraperitoneally, based on previous protocols (Pfeifer et al, 2002, Balakrishnan et al, 2015), or with the amyloid‐binding compound LIN5044 (0.4 mg in 100 μl PBS, 1×/week intraperitoneally; Table 1). Control treatments included control food chow and intraperitoneally injected recombinant pooled IgG or PBS, respectively (Fig 2A). Mice were sacrificed 1 week after the last administration of LIN5044 or β1; the NB360 chow was provided without interruption. Brains were subjected to clearing, staining, and imaging. Raw data volumes were transformed to the coordinate space of the Allen Brain Atlas (Wang et al, 2020) and anatomically registered (Appendix Fig S4A, D, and E). We then performed automated plaque segmentation and regional quantification of plaque pathology (Fig. 2B; Appendix Fig S4A–C; Table 2). Voxel‐level plaque counts, mean size, and maturity (qFTAA/hFTAA ratio) were determined for each treatment group (Fig 2C and D; Appendix Fig S5; Table 3). Corresponding voxels of brains treated with anti‐Aβ compounds and their respective controls were compared pairwise by inferential statistics (Fig 2E). This allowed us to identify “Significantly Altered Voxels” (SAV) across entire brain volumes. SAV heatmaps were presented as montages of coronal slices.
Table 1.
Number of mice in treatment cohorts.
| β1‐old | β1‐young | NB360‐old | NB360‐young | LIN5044‐old | LIN5044‐young | |
|---|---|---|---|---|---|---|
| Control | 5 | 4 | 4 | 5 | 4 | 6 |
| Treated | 3 | 6 | 5 | 3 | 4 | 6 |
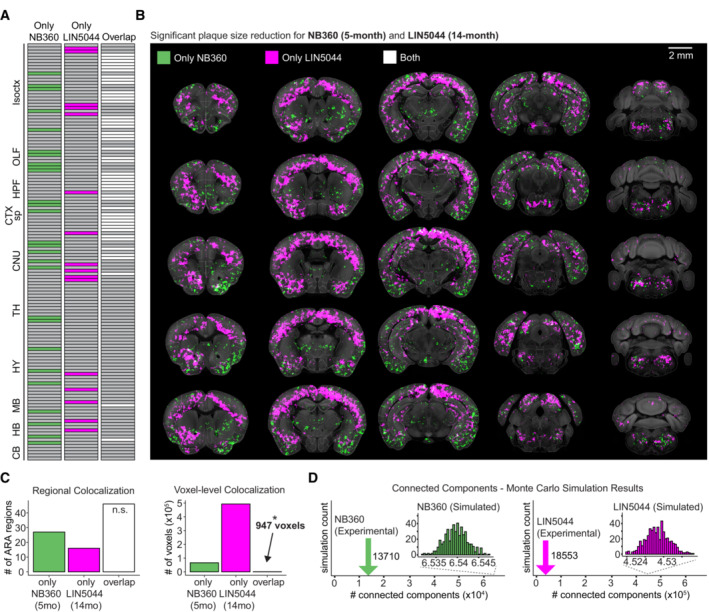
Figure 2. Region and age‐specific plaque clearing by various anti‐Aβ treatments.
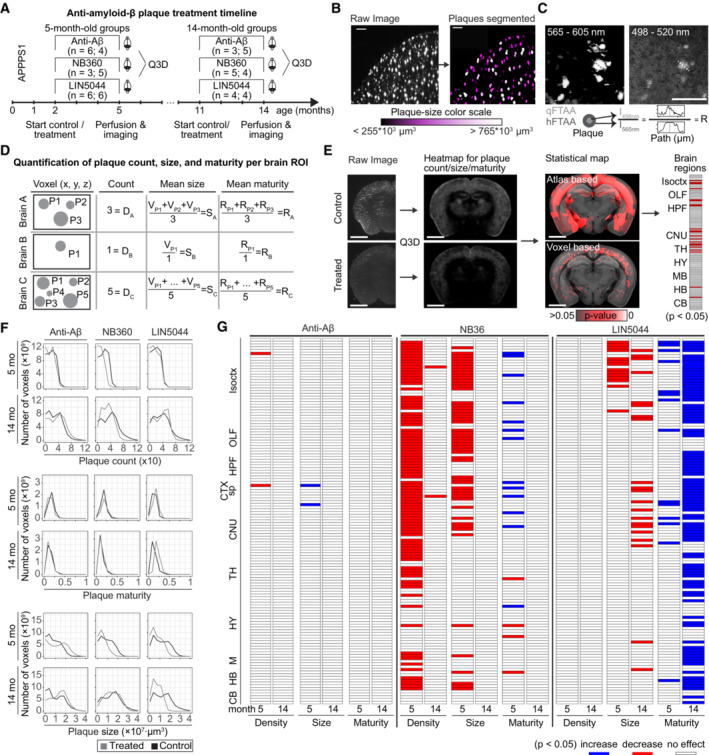
- APPPS1 mice were treated with antibodies, the BACE1 inhibitor NB360, the polythiophene LIN5044 or appropriate controls.
- We segmented the plaques and color‐coded them by plaque size (μm3). Scale bars: 250 μm.
- Intensity ratios were calculated by dividing the peak fluorescent emission in the qFTAA channel with the peak emission of the hFTAA channel in the center of each plaque. Scale bar: 100 μm.
- Descriptive statistics were calculated for every voxel of individual brains resulting in plaque counts, mean plaque size, and mean intensity ratio for each voxel (plaques: P1, P2 … Pn).
- After every brain was registered to a reference atlas, plaques were grouped by anatomical brain regions. The mean plaque density, size, and maturity was compared between control and treated brains for corresponding brain regions. Seeking an unbiased volume unit for spatial analysis we divided brain data into (25 μm)3 voxels. Atlas‐based anatomical normalization overestimates the volume of treatment‐affected brain compared to voxel‐level analysis. Scale bars: 2 mm.
- Histograms visualizing the changes in plaque size and maturity upon different treatments. For the β1 antibody treatment, there was a reduction in the number of smaller plaques, but there was no change in plaque density or maturity. NB360 and LIN5044 reduced the prevalence of large plaques in young mice; LIN5044 also reduced it in old mice. NB360 affected the plaque maturity of young but not of old mice, while LIN5044 increased plaque maturity primarily in old mice.
- Statistical tests resulted in heatmaps of significance by anatomical brain regions. The β1 antibody treatment showed very limited effects in all analyzed brain regions and across all analyzed metrics. NB360 reduced plaque density and mean size in brain regions in 5‐month but not in 14‐month‐old mice. Mean plaque‐core maturity increased in cortex but decreased in several subcortical structures. LIN5044 was effective in reducing mean plaque size and maturity in many brain areas at 14 months, and on mostly cortical areas at 5 months. Isoctx, isocortex; OLF, olfactory areas; HPF, hippocampal formation; CTX sp, cortical subplate; CNU, caudate nucleus; TH, thalamus; HY, hypothalamus; MB, midbrain; HB, hindbrain; CB, cerebellum.
Table 2.
Neuroanatomical areas used for Allen Reference Atlas registration.
| Region acronym | Region name |
|---|---|
| FRP | Frontal pole, cerebral cortex |
| MOp | Primary motor area |
| MOs | Secondary motor area |
| SSp | Primary somatosensory area |
| SSs | Supplemental somatosensory area |
| GU | Gustatory areas |
| VISC | Visceral area |
| AUDd | Dorsal auditory area |
| AUDp | Primary auditory area |
| AUDpo | Posterior auditory area |
| AUDv | Ventral auditory area |
| VISal | Anterolateral visual area |
| VISam | Anteromedial visual area |
| VISl | Lateral visual area |
| VISp | Primary visual area |
| VISpl | Posterolateral visual area |
| VISpm | posteromedial visual area |
| VISa | Anterior area |
| VISli | Laterointermediate area |
| ACA | Anterior cingulate area |
| PL | Prelimbic area |
| ILA | Infralimbic area |
| ORB | Orbital area |
| AI | Agranular insular area |
| RSP | Retrosplenial area |
| VISpor | Postrhinal area |
| VISrl | Rostrolateral visual area |
| TEa | Temporal association areas |
| PERI | Perirhinal area |
| ECT | Ectorhinal area |
| OLF | Olfactory areas |
| MOB | Main olfactory bulb |
| AOB | Accessory olfactory bulb |
| AON | Anterior olfactory nucleus |
| TT | Taenia tecta |
| DP | Dorsal peduncular area |
| PIR | Piriform area |
| NLOT | Nucleus of the lateral olfactory tract |
| COA | Cortical amygdalar area |
| PAA | Piriform‐amygdalar area |
| TR | Postpiriform transition area |
| HPF | Hippocampal formation |
| HIP | Hippocampal region |
| ENTl | Entorhinal area, lateral part |
| ENTm | Entorhinal area, medial part, dorsal zone |
| PAR | Parasubiculum |
| POST | Postsubiculum |
| PRE | Presubiculum |
| SUB | Subiculum |
| ProS | Prosubiculum |
| HATA | Hippocampo‐amygdalar transition area |
| APr | Area prostriata |
| CTXsp | Cortical subplate |
| CLA | Claustrum |
| EP | Endopiriform nucleus |
| LA | Lateral amygdalar nucleus |
| BLA | Basolateral amygdalar nucleus |
| BMA | Basomedial amygdalar nucleus |
| PA | Posterior amygdalar nucleus |
| STR | Striatum |
| CP | Caudoputamen |
| ACB | Nucleus accumbens |
| FS | Fundus of striatum |
| OT | Olfactory tubercle |
| LSX | Lateral septal complex |
| AAA | Anterior amygdalar area |
| BA | Bed nucleus of the accessory olfactory tract |
| CEA | Central amygdalar nucleus |
| IA | Intercalated amygdalar nucleus |
| MEA | Medial amygdalar nucleus |
| PAL | Pallidum |
| GPe | Globus pallidus, external segment |
| GPi | Globus pallidus, internal segment |
| SI | Substantia innominata |
| MA | Magnocellular nucleus |
| MSC | Medial septal complex |
| TRS | Triangular nucleus of septum |
| PALc | Pallidum, caudal region |
| TH | Thalamus |
| VENT | Ventral group of the dorsal thalamus |
| SPF | Subparafascicular nucleus |
| SPA | Subparafascicular area |
| PP | Peripeduncular nucleus |
| GENd | Geniculate group, dorsal thalamus |
| LAT | Lateral group of the dorsal thalamus |
| ATN | Anterior group of the dorsal thalamus |
| MED | Medial group of the dorsal thalamus |
| MTN | Midline group of the dorsal thalamus |
| ILM | Intralaminar nuclei of the dorsal thalamus |
| RT | Reticular nucleus of the thalamus |
| GENv | Geniculate group, ventral thalamus |
| MH | Medial habenula |
| LH | Lateral habenula |
| HY | Hypothalamus |
| PVZ | Periventricular zone |
| PVR | Periventricular region |
| AHN | Anterior hypothalamic nucleus |
| MBO | Mammillary body |
| MPN | Medial preoptic nucleus |
| PMd | Dorsal premammillary nucleus |
| PMv | Ventral premammillary nucleus |
| PVHd | Paraventricular hypothalamic nucleus, descending division |
| VMH | Ventromedial hypothalamic nucleus |
| PH | Posterior hypothalamic nucleus |
| LHA | Lateral hypothalamic area |
| LPO | Lateral preoptic area |
| PST | Preparasubthalamic nucleus |
| PSTN | Parasubthalamic nucleus |
| PeF | Perifornical nucleus |
| RCH | Retrochiasmatic area |
| STN | Subthalamic nucleus |
| TU | Tuberal nucleus |
| ZI | Zona incerta |
| ME | Median eminence |
| MB | Midbrain |
| MBsen | Midbrain, sensory related |
| MBmot | Midbrain, motor related |
| MBsta | Midbrain, behavioral state related |
| P | Pons |
| NLL | Nucleus of the lateral lemniscus |
| PSV | Principal sensory nucleus of the trigeminal |
| PB | Parabrachial nucleus |
| SOC | Superior olivary complex |
| P‐mot | Pons, motor related |
| P‐sat | Pons, behavioral state related |
| MY | Medulla |
| MY‐sen | Medulla, sensory related |
| MY‐mot | Medulla, motor related |
| MY‐sat | Medulla, behavioral state related |
| CB | Cerebellum |
| VERM | Vermal regions |
| HEM | Hemispheric regions |
| CBN | Cerebellar nuclei |
Table 3.
Plaque loads in control mice of each treatment cohort show low variability.
| Treatment | Age | Count Mean | Count SD | Count SE |
|---|---|---|---|---|
| Antibody | Old | 2,108,735 | 292,186 | 130,670 |
| Antibody | Young | 1,097,711 | 159,214 | 79,607 |
| BACE1 inhibitor | Old | 2,790,290 | 245,900 | 122,950 |
| BACE1 inhibitor | Young | 1,151,097 | 159,849 | 79,924 |
| Polythiophene | Old | 2,738,744 | 333,892 | 166,946 |
| Polythiophene | Young | 1,243,608 | 156,807 | 64,016 |
| <all> | Old | 2,512,293 | 426,799 | 118,373 |
| <all> | Young | 1,175,491 | 159,340 | 42,585 |
Local efficacy of therapies with neuroanatomical areas
The effects of the β1 antibody were surprisingly small. In young mice, the increase in plaque density was slightly reduced (gustatory areas and claustrum: P = 0.014), whereas size was marginally increased (claustrum: P = 0.044), and plaque maturity was unaffected. In old mice there was no significant effect (Figs 2G and EV2; Appendix Fig S6). In contrast, NB360 robustly quenched the increase in plaque density and (to a lesser extent) size in 5‐month‐old mice. The effect on plaque density was most pronounced in subcortical areas (claustrum: P = 0.004) and in ventral and posterior cortical areas including the perirhinal and posterolateral visual area (both P = 0.004), whereas the effect on plaque size was particularly strong in the amygdala and piriform area (both P = 0.024; Figs 2F and G and EV3). Plaque maturity (based on the qFTAA/hFTAA fluorescent ratio) was increased in superficial cortical areas (e.g., olfactory areas P = 0.011) but decreased in deep subcortical structures (e.g., amygdala P = 0.017). In old mice, NB360 had no significant effect on plaque density, size, and maturity.
Figure EV2. The β1 antibody has minimal to no effect on neuroanatomical plaque count, maturity, or size in 5‐month‐old and 14‐month‐old mice.
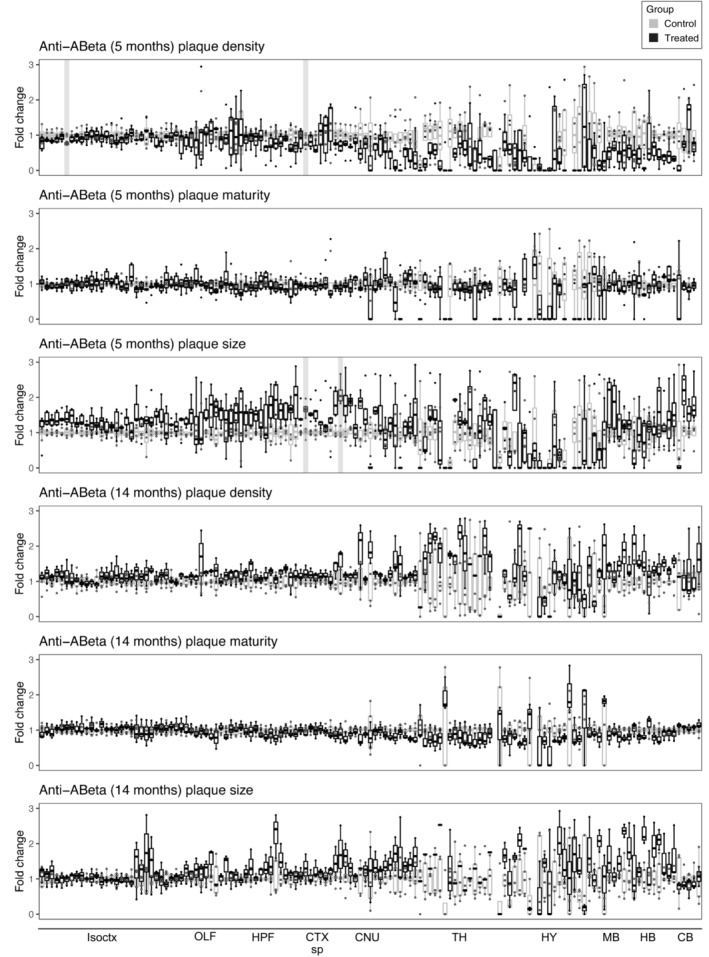
Fold‐change reduction in various plaque metrics across all brain regions in both 5‐month‐old and 14‐month‐old mice, compared with control. The β1 antibody has a minimal effect on plaque‐count increase in 5‐month‐old mice and has no effect in old mice. In 5‐month‐old mice, significant effects in plaque size reduction occurred mostly in the brainstem. The plaque‐maturity change induced by β1 antibody treatment in 5‐ and 14‐month‐old mice is very limited. The plaque‐size change induced by β1 antibody treatment in 5‐month‐old mice is very limited and absent in 14‐month‐old mice. The plaque‐maturity change induced by β1 antibody treatment in 5‐ and 14‐month‐old mice is very limited. Brain regions with a significant treatment effect (P < 0.05) are shaded gray. Isoctx, isocortex; OLF, olfactory areas; HPF, hippocampal formation; CTX sp, cortical subplate; CNU, caudate nucleus; TH, thalamus; HY, hypothalamus; MB, midbrain; HB, hindbrain; CB, cerebellum.
Figure EV3. BACE1‐inhibition induced conspicuous plaque count reduction in 5‐month‐old mice, but not in 14‐month‐old mice.
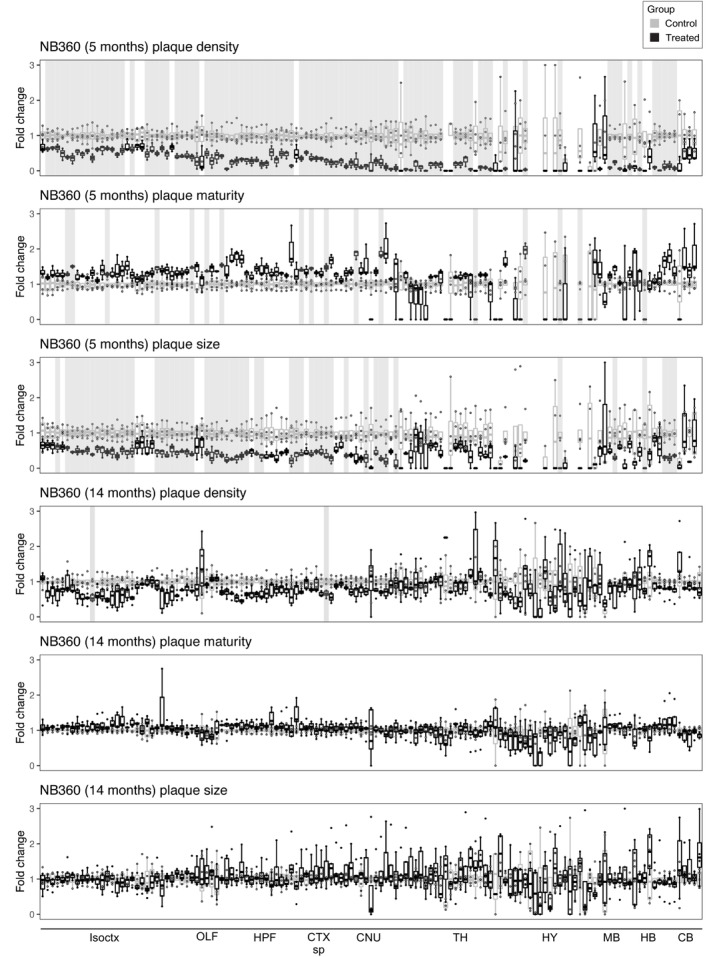
Fold‐change reduction in various plaque metrics across all brain regions in both 5‐month‐old and 14‐month‐old mice. BACE1‐inhibition induces considerable reduction in both plaque count and plaque size in many anatomical regions in 5‐month‐old mice, but not in 14‐month‐old mice. Plaque maturity change by BACE1‐inhibition in 5‐month‐old mice shows both region‐dependent maturity increase and decrease, while there is no effect at 14‐months. Brain regions with a significant treatment effect (P < 0.05) are shaded gray. Isoctx, isocortex; OLF, olfactory areas; HPF, hippocampal formation; CTX sp, cortical subplate; CNU, caudate nucleus; TH, thalamus; HY, hypothalamus; MB, midbrain; HB, hindbrain; CB, cerebellum.
LIN5044 acted primarily on plaque size, but only marginally on plaque density of old mice (Figs 2F and G and EV4B). Plaques were smaller in subcortical areas (medial septal complex and amygdala: P = 0.0048 and 0.012 respectively) and cortical areas with a rostro‐dorsal emphasis (supplemental somatosensory area: P = 0.0067). The effect of LIN5044 on mean plaque size was more pronounced in old mice, but the spatial distribution of the treatment effect was similar in young and old mice (Figs 2F and G, and EV4B). In contrast, the effect of LIN5044 on plaque density in young mice was less conspicuous.
Figure EV4. Trend in plaque‐count reduction in few anatomical regions after LIN5044 treatment in 5‐ and 14‐month‐old mice.
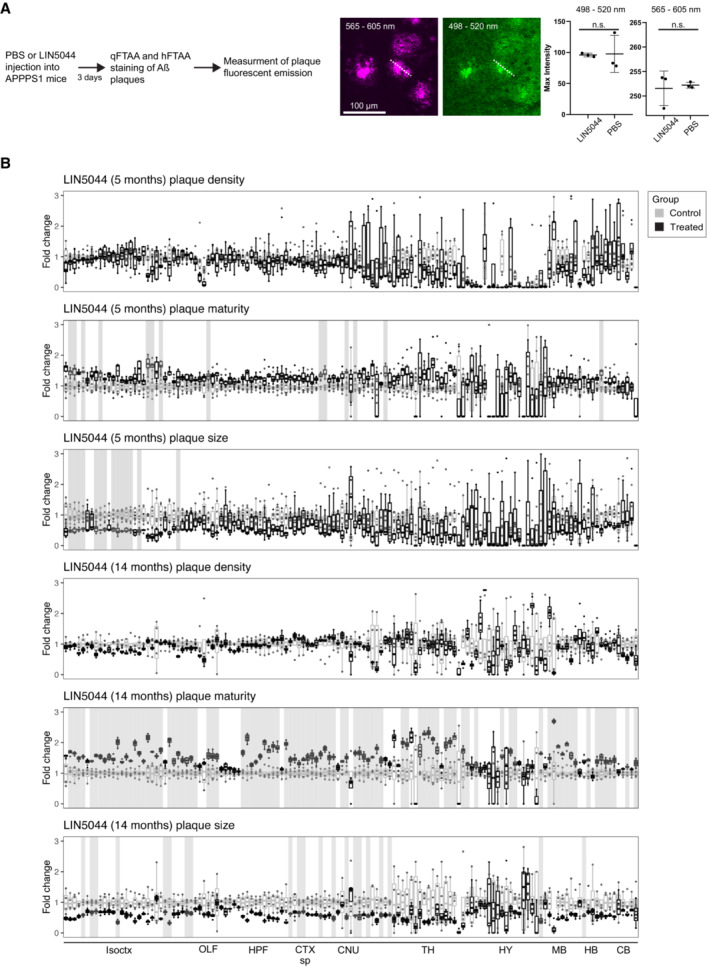
- To see whether LIN5044 induces artifacts into the plaque‐maturity analysis APPPS1 mice were injected with a single‐dose PBS (n = 1) or LIN5044 (0.4 mg in 100 μl PBS; n = 1). Next, emission intensities used for plaque maturity analysis (at wave lengths 498–520 and 565–605 nm) were measured in 10 plaques in 3 slices per animal with a confocal microscope. Plaques of LIN5044 and PBS injected mice showed no difference in fluorescent emissions.
- Fold‐change reduction in various plaque metrics across all brain regions in both 5‐month‐old and 14‐month‐old mice, compared with control. Plaque‐count reduction is not significant but shows a trend in 14‐month‐old mice. Mean plaque‐sizes are significantly reduced in some anatomical regions after LIN5044 treatment in 5‐month‐old mice, and in cortical areas of 14‐month‐old mice. Plaque maturity change by LIN5044 in 5‐month‐old mice shows some neuroanatomical regions with mean maturity increase, and a more widespread regional increase at 14‐months in cortical areas. Brain regions with a significant treatment effect (P < 0.05) are shaded gray. Isoctx, isocortex; OLF, olfactory areas; HPF, hippocampal formation; CTX sp, cortical subplate; CNU, caudate nucleus; TH, thalamus; HY, hypothalamus; MB, midbrain; HB, hindbrain; CB, cerebellum.
LIN5044 treatment may influence the fluorescent spectra of plaques and distort maturity analyses. We therefore measured plaque spectra of APP/PS1 mice 3 days after a single injection of LIN5044 or PBS. The emission spectra of plaques were not influenced (Fig EV4A). In contrast, the cohorts treated for 3 months with LIN5044 showed a massive shift toward increased plaque maturity in old mice (retrosplenial area: P = 0.0014) and to a lesser extent in young mice (supplemental somatosensory area: P = 0.026; Figs 2G and EV4B).
Regional drug – Effect analysis based on voxel‐level probability distribution
We decomposed atlas‐registered brains into spatially registered cubic voxels (15,625 μm3) and generated descriptive statistics of plaque density, size, and maturity for each voxel. We then assessed the effects of each treatment arm at the single‐voxel level (Fig 3; Appendix Figs S4 and S5). We found that the locales of treatment effectiveness did not coincide with neuroanatomically defined regions. Indeed, assignment by neuroanatomical boundaries failed to capture peaks of regiospecific therapeutic efficacy and overestimated the volume of treatment‐affected brain tissue (Fig 2E). Remarkably, voxel‐level heatmaps of P‐values showed that BACE1 inhibition reduced the increase in plaque counts most effectively in the posterior and ventral telencephalon (Fig 3), whereas LIN5044 reduced the increase in the size of plaques primarily in rostro‐dorsal areas (Fig 3). These effects were symmetric across the midline and showed sharp boundaries lining the deep cortical layers (LIN5044), the thalamus, and CA3 (NB360). The β1‐treated young mice showed patchy reduction in plaque count and size in the brainstem and some decrease in maturity (Fig EV2; Appendix Fig S6). However, these effects were marginal. The effects of β1 in old mice were even less significant (Fig EV2; Appendix Fig S6). Therefore, β1 was excluded from further analyses.
Figure 3. Voxel‐based brain analysis reveals temporally distinct anti‐Aβ treatment effects across various plaque metrics.
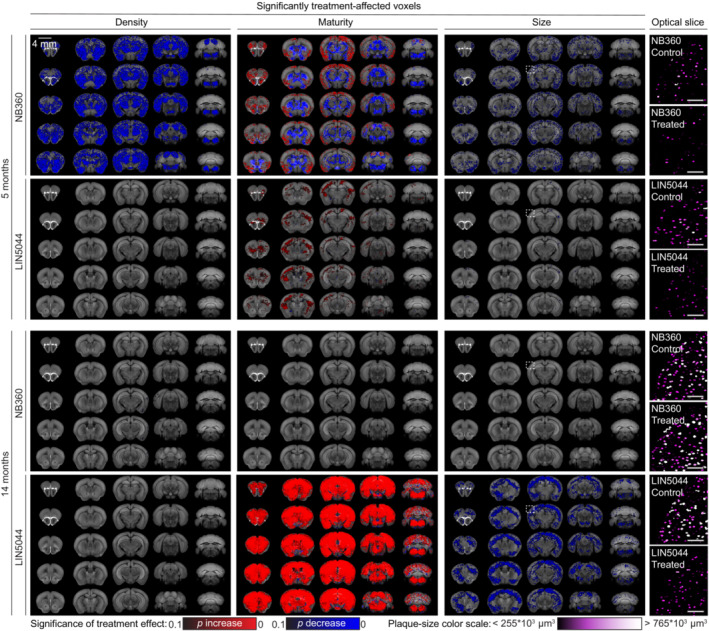
Each three‐dimensional map of SAVs summarizes all the treated and control samples within a cohort (8–12 samples). These maps reveal regiospecific efficacy unique to each treatment modality. NB360 reduced plaque count and mean size in both cortical and subcortical areas of young (5‐month) mice, with little to no effect in older mice (14‐month). NB360 also showed profoundly divergent effects on mean plaque maturity between cortical and subcortical regions, which showed increase and decrease, respectively. In older mice, LIN5044 treatment showed a widespread increase in mean plaque maturity, and a significant reduction in mean plaque size across the whole brain. The mean plaque size reduction suggested by the voxel maps was confirmed by looking at segmentations of randomly picked cortical optical slices (white inserts on heatmaps), color‐coded by plaque size. Scale bars: 500 μm.
The inferred effects of NB360 and LIN5044 rely on complex computations on terabyte‐sized datasets. To intuitively visualize these effects, we randomly selected single cortical mesoSPIM images of atlas‐registered brains from each treatment and control groups. Upon segmentation, we color‐coded plaques based on their size (Fig 2B; Appendix Fig S7). Fig 3 and Appendix Fig S7 confirm the reduced plaque density and plaque size in NB360‐treated young mice and LIN5044‐treated old mice, respectively.
Colocalization analysis reveals little overlap in the regiospecificity of therapies
As a global measure of regiospecific similarity, we counted the overlapping SAVs in all treatment pairs and metrics (plaque density, mean plaque size, and maturity; Table 4). Despite a strong colocalization within neuroanatomical boundaries, the LIN5044 and NB360 SAVs appeared to cluster in distinct patterns (Fig 4A). The maximal SAV overlap between pairs was < 1% or < 2.65% (P < 0.05 or P < 0.1, respectively) indicating that each treatment had a unique voxel‐specific fingerprint (Fig 4A–C, Table 4). Hypergeometric tests confirmed that the voxel‐level overlaps were not significant (P < 0.03).
Table 4.
Significantly affected voxels (SAV) after NB360, β1‐antibody or LIN5044 treatment.
| Young | Old | |||||
| NB360 | β1 | LIN5044 | NB360 | β1 | LIN5044 | |
| P < 0.05 | ||||||
| Density | ||||||
| NB360 | 2,649,191 | 435 | 2 | 46 | 0 | 0 |
| β1 | 435 | 4,625 | 0 | 0 | 40 | 0 |
| LIN5044 | 2 | 0 | 29 | 0 | 0 | 276 |
| Size | ||||||
| NB360 | 66,128 | 3 | 1 | 10 | 0 | 0 |
| β1 | 3 | 2,518 | 0 | 0 | 18 | 1 |
| LIN5044 | 1 | 0 | 80 | 0 | 1 | 492,779 |
| Maturity | ||||||
| NB360 | 1,593,392 | 9,542 | 136 | 0 | ||
| β1 | 9,542 | 52,893 | 0 | 639 | ||
| P < 0.1 | ||||||
| Density | ||||||
| NB360 | 7,185,540 | 5,443 | 30 | 16,304 | 0 | 0 |
| β1 | 5,443 | 21,359 | 0 | 0 | 69 | 0 |
| LIN5044 | 30 | 0 | 121 | 0 | 0 | 486 |
| Size | ||||||
| NB360 | 888,437 | 282 | 1,302 | 25 | 0 | 0 |
| β1 | 282 | 8,661 | 1 | 0 | 61 | 5 |
| LIN5044 | 1,302 | 1 | 20,530 | 0 | 5 | 2,941,884 |
| Maturity | ||||||
| NB360 | 2,181,488 | 19,777 | 221 | 0 | ||
| β1 | 19,777 | 84,862 | 0 | 1,432 | ||
After all the brain scans were registered to a brain atlas, the brains were deconstructed into standard voxels in a coordinate system. Then, for every treatment a “phantom” brain‐volume was generated where each voxel represented the P‐value of treatment effect. This was generated by two‐sided t‐testing all treated against all control brains (for a respective voxel). Voxels with P‐values either P < 0.1 or 0.05 were termed as SAV. Each treatment's phantom brain was thresholded to only contain SAVs (P < 0.1 or 0.05). The effect‐overlap between treatments was defined by the voxels, which were significantly affected in both of the compared treatments. Our results show that most SAVs are non‐overlapping. The overlap was <1% or <2.65% at P < 0.05 or P < 0.1, respectively.
Figure 4. Colocalization of LIN5044 and NB360 voxel‐based analysis reveals spatially distinct anti‐Aβ treatment effect on plaque size.
-
A, BThe distinct significant effect of each of the strongest treatments on plaque size cluster, NB360 5‐month and LIN5044 14‐month, as well as their overlap, using either (A) neuroanatomical boundaries, or (B) SAVs.
-
CThe two treatments demonstrate high colocalization based on neuroanatomical boundaries, while the SAVs for plaque‐size cluster separately with limited overlap (*P = 0.03; hypergeometric test: 32403808 total voxels, 66,128 NB360 voxels, 492,779 LIN5044 voxels, 947 overlapping voxels).
-
DTo demonstrate that these individual SAV‐clusters are non‐random, Monte‐Carlo simulations were run, which randomly distributed the experimentally measured number of voxels while the number of connected components was counted. LIN5044 and NB360 SAVs both show at least fivefold higher clustering than random.
To probe the randomness of such clusters, we measured the number of connected components (neighboring SAVs that are touching each other) in NB360 and LIN5044‐treated brains (13,710 and 18,553, respectively). We then generated 500 Monte Carlo simulations with the same number of SAVs than we measured experimentally, but without constraints on their spatial distribution. We found that the number of connected components in the experimental measurements was at least fivefold lower than in the simulations, indicating that the SAVs are grouped into distinct, spatially confined clusters (Fig 4D).
Regiospecificity is not due to pharmacokinetics or Aβ and BACE1 levels
To test if the regiospecificity was caused by differential penetration of therapeutic compounds, we determined the biodistribution of β1, NB360, and LIN5044 by dissecting brains into eight standard regions (Appendix Fig S8A). NB360 levels were measured 1 h after oral administration (Neumann et al, 2015). Since antibodies have long half‐lives (Vieira & Rajewsky, 1988) and limited blood–brain barrier penetration, brain levels were measured 6 and 24 h after intraperitoneal injection. As the pharmacokinetic properties of LIN5044 are unknown, we measured brain levels 2 and 6 h after intraperitoneal administration. There was no difference in regional NB360 levels. LIN5044‐treated brains showed higher levels in the brainstem and cerebellum (P < 0.034 and 0.024, respectively) after 2 h, but its distribution became homogeneous after 6 h (Appendix Fig S8B–D). β1 showed higher levels in the brainstem after 6 and in the brainstem and the cerebellum after 24 h (Appendix Fig S8E and F). However, there was no difference in antibody levels between diencephalic and telencephalic regions. Pooled nonspecific recombinant IgG was used for control and did not accumulate in any brain region at 24 h (Appendix Fig S8G). Hence, regional pharmacokinetic differences do not explain the region‐specific drug effects. We also tested the abundance of Aβ and BACE1 in eight brain regions (Appendix Fig S8A) biochemically (Appendix Fig S9). We could not differentiate between brain regions biochemically; however, both LIN5044 and NB360 reduced the amount of Aβ monomers compared with control mice (Appendix Fig S9).
Genetic markers revealed by aligning the Q3D output to gene‐expression atlases of the brain
The findings above suggested that the local heterogeneity of drug efficacy may be controlled by intrinsic properties of the host brain. We therefore compared the plaque‐size SAVs of NB360 and LIN5044 to a gene‐expression atlas reporting whole‐genome expression at > 30,000 spots of the mouse brain (Ortiz et al, 2020; Fig 5A). We calculated the mutual information (MI), a similarity metric describing the nonlinear interdependence of random variables. We also created an online application for browsing these data (https://fgcz‐shiny.uzh.ch/SPAGEDI/). As expected, most genes showed low MI scores with either treatment (Fig 5B). The MI of Thy1, whose promoter was used to drive APP/PS1 expression, ranked at the 99th percentile of 23,371 genes for both LIN5044 and NB360 (MI: 8.06 × 10⁻⁴; NB360 5.32 × 10⁻⁴, respectively). Similarly, Bace1 expression correlated highly with the efficacy of its inhibitor NB360 (MI: 2.22 × 10⁻⁴, 96th percentile), but not with LIN5044 (1.37 × 10⁻⁴, 81st percentile; Fig 5C). These results confirm that the morphological‐genetic analyses presented here identify sensitively and reliably the genetic networks controlling the efficacy of amyloid removal therapies.
Figure 5. Genetic markers may predict local drug responsiveness.
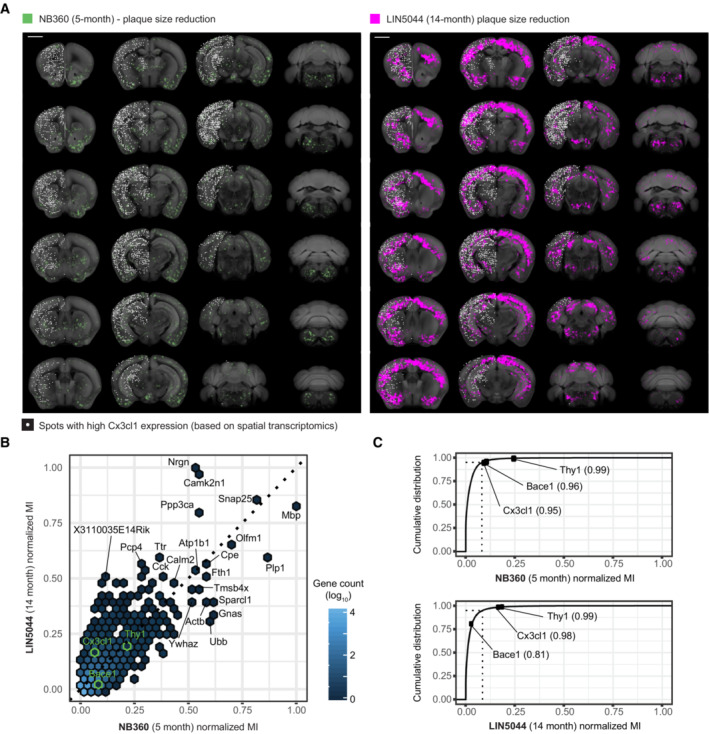
- SAV plaque‐size‐reduction maps for NB360‐5‐month and LIN5044‐14‐month effects overlaid with data from a spatial transcriptomics database, with the Cx3cl1 gene shown as an example. Spots with high Cx3cl1 expression (white) show more overlap with the LIN5044 effect than with NB360. Calculating the mutual information between each SAV and gene expression pair allows for the discovery of candidate genetic markers that predict each drug's responsiveness. Scale bars: 2 mm.
- Normalized Mutual Information (MI) of genes above the 95th percentile (ranked by MI, [n = 1,169]) for either NB360 or LIN5044.
- MI between SAV and gene expression ranked cumulatively by MI (23,371 genes). Cx3cl1, a neuron‐borne microglia chemoattractant, is a higher ranked genetic marker for LIN5044 responsiveness. Dashed line: genes above the 95th percentile of MI.
The effect of LIN5044 showed a high MI (7.23 × 10⁻⁴, 98th percentile) with Cx3cl1, a microglial chemoattractant mostly expressed by neurons (Tarozzo et al, 2003; NB360, Cx3cl1 MI: 1.95 × 10⁻⁴, 95th percentile; Fig 5), potentially suggesting that the effects of LIN5044 are stronger in areas of high microglia recruitment. To test this, we quantified Iba1+ microglia in cortical areas with strong or weak LIN5044 effects. Regions strongly affected by LIN5044 showed significantly higher microglia counts (Fig EV5).
Figure EV5. Histological sectioning and Iba1 labeling validates increased microglia density in regions where LIN5044 was more effective in reducing plaque size.
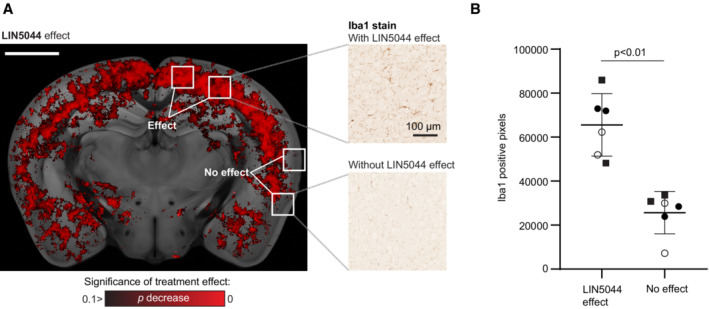
- Regions of interest were selected based on voxel‐based statistics of LIN5044 efficacy in reducing plaque size in 14‐month‐old mice. Microglia density was measured in regions displaying both strong or absent LIN5044 efficacy (3 three wild‐type mice, 3 slices/mouse). Scale bar: 2 mm
- Regions showing strong LIN5044 effects contained more microglia (each distinct symbol represents one mouse).
Discussion
Brain‐wide analysis of Aβ plaque load, as shown previously (Liebmann et al, 2016), requires reliable brain clearing and amyloid staining (Richardson et al, 2021). However, current hydrogel‐based methods for whole‐brain clearing are slow and often inhomogeneous. We have solved these limitations by insulating the anodic from the cathodic detergent reservoir, thereby constraining the lipid‐clearing ion flow through the sample. This design enabled whole‐brain clearing within 14 h (Chung et al, 2013; Tomer et al, 2014; Richardson & Lichtman, 2015), and electrophoresis of qFTAA/hFTAA resulted in homogenous plaque staining within 2 h. Comparisons between the Q3D pipeline, including light‐sheet acquisition (3.26 × 3.26 × 6.5 μm resolution), with conventional staining of histological sections showed that Q3D reliably visualizes Aβ plaques within mouse brains. The precision of Q3D resulted in highly consistent plaque counts among age‐matched APP/PS1 mice (standard deviation: 2.5–3.3%).
The β1 antibody showed only marginal effects in young APP/PS1 mice and no effect in old mice, consistent with previous reports (Pfeifer et al, 2002; Balakrishnan et al, 2015). The marginal effect was primarily visible in the brainstem, where higher β1 antibody drug concentrations were measured (Appendix Fig S8). It was shown that peripheral β1 injections result in significant Aβ reduction in the brain and Aβ epitope masking (Pfeifer et al, 2002, Balakrishnan et al, 2015). Furthermore, the β1 antibody was shown to bind Aβ plaques in the brain and to retain Aβ in the blood after peripheral administration (Winkler et al, 2010). However, the limited effect of the β1 antibody may be explained by its low bioavailability relative to the high abundance of Aβ. In contrast, both LIN5044 and NB360 reduced amyloid load more effectively. This provided the first evidence that polythiophenes can be efficacious against Aβ. However, we unexpectedly found that the activities of LIN5044 and NB360 were highly divergent in many ways. As our colocalization analysis revealed, the spatial efficacies of LIN5044 and NB360 were almost mutually exclusive, being more effective against either rostro‐dorsal or ventrocaudal amyloid deposits, respectively. Moreover, LIN5044 was more effective in reducing the growth of existing plaques, rather than their total number. LIN5044 was also more effective in aged mice than in younger mice. In contrast, BACE1 inhibition was most effective in reducing plaque numbers in young mice, yet affected their growth to a lesser extent. The reduction in plaque burden showed steep ventrocaudal (NB360) and dorsorostral (LIN5044) gradients whose boundaries did not correspond to defined neuroanatomical areas or vascular territories. Thus, the voxel‐level analysis was crucial in finding clusters of treatment significance beyond conventional anatomical boundaries.
The strong Aβ‐monomer reducing effect of BACE1 decreases plaque loads in young, but not in old mice, suggesting that distinct amyloid species are contributing to plaques at different ages. While primary nucleation is mainly dependent on Aβ concentration (Hellstrand et al, 2010; Burgold et al, 2014) and is highly sensitive to BACE1 inhibition (Brendel et al, 2018; Peters et al, 2018), secondary nucleation (Cohen et al, 2013) may become more important in aged mice. In prion diseases, polythiophenes (including LIN5044) slow disease progression by reducing the number of seeds for secondary nucleation. This is achieved by polythiophenes binding and stabilizing amyloid fibrils, resulting in reduced fibril fragmentation as a source of seeds (Margalith et al, 2012; Herrmann et al, 2015). Similarly, Aβ fibril hyper‐stabilization could explain the effect of LIN5044 in APP/PS1 mice. The remarkable efficacy of LIN5044 in aged mice may relate to the dependency of secondary nucleation onto the concentration of seeds, which increases with age. Accordingly, LIN5044 in older mice primarily reduced mean plaque sizes (Fig 2G), all while increasing the number of smaller plaques (Fig 2F), providing further evidence that LIN5044 reduces additive plaque growth. Potentially, smaller plaques might be a consequence of an increase in plaque compaction upon LIN5044. The stronger effect of LIN5044 in old mice suggests that it preferentially targets tightly packed plaques, which become more abundant with time.
Pharmacokinetic analyses did not support the notion that differential bioavailability may account for the regiospecific activities of NB360 and LIN5044 (Appendix Fig S8). Also, we did not detect regional differences in endogenous Aβ and BACE1 levels. Because of its inherent fluorescence, LIN5044 might also influence the spectral properties of plaques. We therefore compared plaque spectra in a mouse injected i.p. with LIN5044 (0.4 mg) and one injected with PBS. No differences were detected, suggesting that the effect of LIN5044 on plaque maturity is not artefactual (Fig EV4A).
By aligning SAV heatmaps to a spatial transcriptomic atlas (Ortiz et al, 2020), we identified a strong spatial similarity between Bace1 expression and the regiospecific efficacy of NB360, but not of LIN5044. Thy1, the promoter driving the APP/PS1 mouse model, ranked highly for both treatments, providing validation for the unsupervised approach chosen here. LIN5044 efficacy showed high spatial similarity with transcription maps of CX3CL1, a neuron‐borne microglial chemoattractant (Szepesi et al, 2018). The regional variation of CX3CL1 expression may result in differential recruitment of microglia, thereby contributing to the clearance of LIN5044‐intercalated amyloid. Indeed, follow‐up experiments confirmed that the areas where LIN5044 had a stronger effect also harbored more microglia in APP/PS1 mice. The cognate microglial receptor CX3CR1 is highly expressed at late AD stages (Chen et al, 2020), which may partly explain the potency of LIN5044 in old mice. As shown here, correlating spatial transcriptomic atlases to therapy atlases can be used as a tool to generate hypotheses for treating Aβ pathology. However, when using such an approach, one needs to take into consideration that gene expression and protein localization might not coincide. In the future, such spatial analyses could benefit from incorporating proteomic data.
Our results suggest that the regional variation and age dependence of anti‐amyloid drug efficacy could considerably influence clinical trial efficacy. However, to what extent regional variation in the effects of CNS drugs translates from mouse to human is unclear. Systematic regional neuropathological analysis after AD clinical trials could shed light on regional differences in drug response. Since LIN5044 and NB360 affect mostly non‐overlapping areas of the brain, combinatorial regimens may synergistically protect larger brain volumes from amyloid deposition. Notably, the computational methods developed for Aβ amyloid quantification can enhance the statistical power of the in vivo assessment of anti‐Aβ drugs and can be adapted to a broad range of protein aggregation diseases.
Materials and Methods
Animal treatments and tissue preparation
All animal experiments were carried out in strict accordance with the Rules and Regulations for the Protection of Animal Rights (Tierschutzgesetz and Tierschutzverordnung) of the Swiss Bundesamt für Lebensmittelsicherheit und Veterinärwesen at the animal facility of the University Hospital Zurich, Switzerland, and were preemptively approved by the Animal Welfare Committee of the Canton of Zürich (permit 040/2015). APP/PS1 (Radde et al, 2006; KOESLER, Rottenburg, Germany) male and female mice were either treated with NB‐360 (Neumann et al, 2015) BACE1‐inhibitor (Novartis) orally (0.5 g inhibitor/kg chow, ~ 6 g chow/day/mouse = 3 mg inhibitor/day/mouse), with the β1 monoclonal IgG2a antibody recognizing the human‐specific EFRH tetrapeptide of amino acids 3–6 of Aβ (Paganetti et al, 1996; Pfeifer et al, 2002; Balakrishnan et al, 2015; Novartis; 0.5 mg/week, once/week in 200 μl phosphate‐buffered saline (PBS) intraperitoneally), or with the amyloid intercalator LIN5044 (0.4 mg/week, once/week in 100 μl PBS) based on previous reports. Because the pharmacokinetics of LIN5044 was unknown, the dose was selected based on previous work (Herrmann et al, 2015). Control mice were treated with control chow, pooled recombinant nonspecific IgG, and PBS, respectively. The ages of NB‐360, β1 antibody, and LIN5044‐treated mice were 353 ± 21, 313 ± 9, and 308 ± 7 days, respectively (groups of old mice), as well as 61 ± 3 days, 59 ± 2, and 65 ± 2 days, respectively (groups of young mice; Table 1). After treatments were completed, mice were deeply anesthetized with ketamine and xylazine, then transcardially perfused with ice‐cold phosphate‐buffered saline (PBS) followed by a hydrogel monomer mixture of 4% acrylamide, 0.05% bisacrylamide, and 1% paraformaldehyde (Yang et al, 2014). Brains were harvested and further incubated passively in the hydrogel mixture for 24 h. The hydrogel was degassed and purged with nitrogen, followed by polymerization at 37°C for 2.5 h. Samples were either stored in PBS or clearing solution until Q3D clearing.
For generating the whole‐brain vascular images (Appendix Fig S1H), Claudin5‐GFP (Gensat.org. Tg(Cldn5‐GFP)) mice were processed as described above.
Tissue clearing
Brains were cleared with focused electrophoretic tissue clearing (FEC) in a custom‐built chamber in 8% clearing solution (8% w/w sodium dodecyl sulphate in 200 mM boric acid, pH 8.5). Standard settings were 130 mA current‐clamped at a voltage limit of 60 V, at 39.5°C. Clearing time varied between 6 and 14 h for a whole mouse brain. Tissue clarity was determined by visual inspection. The polarity of the electrodes was switched after approximately 50% of the total clearing time. Transparency was assessed by visual inspection. The clearing solution was circulated from a buffer reservoir of 250 ml. After clearing a brain, 60 ml of clearing buffer was exchanged with fresh buffer before starting to clear the next sample. Q3D‐clearing chambers were 3D‐printed, and clearing was done in an incubator at 39.5°C. For details on the chamber design, see supplementary material and model repository (Appendix Fig S1).
Relative electrical resistivity measurement between brain tissue and buffer
For electrical resistivity measurements comparisons, mouse brains were first fixed in 4% paraformaldehyde, then measured in PBS. Platinum electrodes (1.5 × 0.2 mm) were mounted at a distance of 2 mm, and a constant voltage of 30 V was applied. Current measurements were used to calculate the resistance between the electrodes. Brain tissue resistance was measured by sticking the electrode pair into the brain at three different locations (frontal cortex, occipital cortex, and brainstem). At each location, current values were measured three times. The resistivity in the buffer was measured nine times. These measurements resulted in a ~ 1,200‐Ohm resistance in the brain and ~ 300‐Ohm resistance in the buffer. As the electrode setup and the voltages were constant for every measurement, the relative resistivity was calculated as the ratio of the two resistivity measurements, resulting in a resistivity ratio of 1:4 (buffer:brain).
Comparison between Q3D and CLARITY
Hydrogel‐embedded brains from 3‐month‐old mice were either passively cleared with 8% clearing solution for 24 h at 39°C (n = 3) or for 4–6 h with either Q3D or CLARITY (Chung et al, 2013) clamped at 130 mA at 60 V at 39°C (four active clearing groups, each n = 3). After clearing, brains were washed with PBS, followed by refractive index‐matching and mounting in quartz cuvettes. Samples were illuminated with a ~ 4–5 μm wide 647‐nm laser beam, calibrated to 0.35‐mW power. Each brain was illuminated stereotypically from the dorsal end at 10 aligned points with 0.5 mm spacing along the rostro‐caudal axis, with the same incumbent laser power (as measured through the imaging medium and cuvette). This was done in three parallel lines (one in the midline, and a line 2 mm left and right from it), resulting in 3 × 10 measurement points per brain (Appendix Fig S1F). The point pattern was defined by starting from the lambdoid fossa. The transmitted light was measured at each point with a digital optical power meter (Thorlabs, PM100D, Compact Power and Energy Meter Console, Digital 4″ LCD; Thorlabs S130C photodiode sensor). The mean and standard error of the mean for all points for each sample were plotted (Appendix Fig S1F and G). We also plotted the mean transmitted light on every rostro‐caudal level, resulting in 10 datapoints summarizing the three parallel lines (two hemispheres and the midline; 0.35 mW input power, 647 nm wavelength, 3 brains/group, 30 measurement points/brain, Fig 1B and Appendix Fig S1). These 10 points per sample were submitted to a one‐way ANOVA (α = 0.05), which was corrected with Tukey's test for multiple comparisons.
Electrophoretic staining with Q3D
Histochemistry by iontophoretic tissue staining was initially done by layering paraffin and agarose around the sample in order to limit current flow to the tissue. Later, Q3D staining chambers were 3D‐printed (Appendix Fig S2A and B). In total, 50 mM tris and 50 mM tricine at a pH of 8.5 were used as the electrophoresis buffer. Tests in native polyacrylamide gel electrophoresis were followed by silver staining (Thermo Scientific Pierce Silver Stain Kit, #24612) that showed, as expected, that electrophoretic mobility is highly dependent on the pH and buffer (Appendix Fig S2D–G). Amyloid plaques were stained with a combination of luminescent conjugated polythiophenes (LCP), heptamer‐formyl thiophene acetic acid (hFTAA), and quadro‐formyl thiophene acetic acid (qFTAA). The combination of these dyes was used for the discrimination of neuritic plaques (Nystrom et al, 2013) at different maturation states (Rasmussen et al, 2017).
Refractive index matching
Brains that were cleared and stained with Q3D were refractive index (RI) ‐matched to 1.46 with a modified version of the refractive index matching solution (Yang et al, 2014) by including triethanolamine (tRIMS). tRIMS was made by mixing Histodenz (Sigma #D2158; 100 mg), phosphate‐buffered saline (75 ml), sodium azide (10% w/v, 500 μl), tween‐20 (75 μl), and triethanolamine (42 ml). tRIMS maintained the RI while reducing the amount of Histodenz required and improving transparency. After prolonged air and light exposure, tRIMS tends to undergo browning; however, in air‐tight tubes at 4°C, samples remain stable for at least 2 years.
Antibody and polythiophene staining
Slices from formalin fixed and paraffin‐embedded brain tissue from a 13‐month‐old APP/PS1 mouse were stained for Aβ plaques. Slices were stained with mouse anti‐human Aβ17‐24 antibody (4G8, AB2734547 Biolegend Cat. No. 800708) after antigen retrieval with 10% formic acid. Slices were blocked with M.O.M. Kit (BMK‐2202), and the primary antibody was detected with Alexa‐594 conjugated goat anti‐mouse IgG (Invitrogen A‐11005, 1:1,000 dilution). Alternatively, slices were stained with Aβ N3pE rabbit anti‐human antibody (IBL 10045, Clone 82E1, 1:50 dilution) after 10% formic acid antigen retrieval, followed by blocking with 10% goat serum, detected with Alexa‐594 conjugated goat anti‐rabbit IgG (Invitrogen A‐11037, 1:500 dilution). Both antibody stainings were followed by staining with qFTAA (0.75 μM in PBS) and hFTAA (3 μM in PBS) for 30 min, followed by diamidino‐phenylindole (DAPI) staining. Slices were imaged with a Leica SP5 confocal microscope with a 10× air objective (numerical aperture 0.4). The qFTAA and hFTAA stainings were imaged by exciting both at 488 nm and collecting emission between 493–510 nm and 530–579 nm, respectively. The dynamic range of images was adjusted consistently across stainings, and images (3.57 μm/pixel) were median filtered with ImageJ (pixel radius 0.5).
To test the effect of the LIN5044 treatment on the qFTAA+hFTAA plaque maturity analysis, 12‐month‐old APP/PS1 mice (n = 2) were injected i.p. with LIN5044 (0.4 mg in 100 μl PBS; n = 1) and PBS (100 μl; n = 1). After 3 days mice were deeply anesthetized with ketamine and xylazine and transcardially perfused first with ice cold PBS, followed by 4% paraformaldehyde. Brains were harvested and were further incubated in the paraformaldehyde solution for 24 h. Brains were then incubated in 30% sucrose in PBS for 2 days at 4°C. Next, brains were snap‐frozen and stored at −80°C overnight. Brains were embedded in tissue freezing medium (Leica biosystems), and 20 μm coronal slices were cut with a cryostat and mounted on Super‐frost micro‐slides. Tissue slices were fixed in 10% formalin overnight and rehydrated by dipping them in consecutive baths of 99% ethanol, 70% ethanol, dH2O, and PBS, 10 min in each. The tissue sections were allowed to dry under ambient conditions. For polythiophene staining, 200 μl of hFTAA and qFTAA solution (20 μM) were added onto the tissue sections to cover them and slices were incubated for 30 min at room temperature. Sections were rinsed in a PBS bath for 10 min, followed by nuclear staining with DAPI. Tissue sections were dried under ambient conditions, followed by mounting with fluorescence mounting medium (DAKO). Slides were imaged with a Leica SP5 Confocal microscope. Nuclei and plaques were imaged with a 10×/0.25 NA dry objective, using the following settings: 405/30 nm excitation/emission filters for DAPI (nuclei) and 498–520 nm (compact amyloid) and 565‐605 nm (looser amyloid) for LCPs. Laser power was set on 10% for all the conditions and a line average of 96 was used for acquisition. Three 8‐bit images were recorded from each sample. Ten plaques per image were measured for their fluorescent intensity by quantifying the maximum intensity of a line drawn through each individual plaque with Fiji. The mean intensity of 10 plaques per image was compared with a two‐tailed T‐test between the two conditions (LIN5044 or PBS treated).
For microglia immunohistochemistry, fixed brains of LIN5044‐treated transgene‐negative littermates from APP/PS1 nests (n = 3) were embedded in paraffin. 4‐μm‐thick paraffin sections (three sections per mouse) were deparaffinized through a decreasing alcohol series. Slices were stained with Iba‐1 antibody (1:1,000; Wako Chemicals GmbH, Germany) and detected using an IVIEW DAB Detection Kit (Ventana). Sections were imaged using a Zeiss Axiophot light microscope. For the quantification of the Iba‐1 staining, in every slice, two regions of interest were selected in the cortex. The four regions of interest were selected representing 2–2 cortical areas with either high or no LIN5044 therapeutic effect (Figs 3A and EV5A). Pixels in the regions of interest were classified and counted as microglia (Iba‐1 positive) or background (Iba‐1 negative) with a manually trained (trained on three images) pixel classifier in ILASTIK (https://www.ilastik.org/), and ImageJ. Hypothesis testing was done with a two‐tailed T‐test.
Drug distribution measurements
NB360 was administered orally in three male C57BL/6 black mice at 5 mg/kg body‐weight dose level at 0.5 mg/ml in water with 0.5% methylcellulose and 0.1% Tween‐80. Based on preceding pharmacokinetic studies (Neumann et al, 2015), brains were harvested 1 h later, followed by homogenization in water and acetonitrile precipitation. NB360 levels were measured with tandem mass spectrometry with electrospray ionization. LIN5044 was administered intraperitoneally into male C57BL/6 black mice at 16 mg/kg body‐weight dose level at 4 mg/ml in PBS. As preceding pharmacokinetic studies were not available, 2‐ and 6‐h incubation timepoints were chosen, each with three mice. Brains were homogenized in water and precipitated with methanol. LIN5044 levels were measured with high pressure liquid chromatography–tandem fluorescence detection. Brain regions' drug levels were compared with one‐way ANOVA (α = 0.05) for each compound and timepoint separately (NB360, LIN5044 2 h, LIN5044 6 h); multiple comparisons were corrected for with Tukey's test.
Antibody brain‐distribution measurements
C57BL/6 mice were injected one‐time with either β1 antibody (n = 6), as a control with pooled recombinant nonspecific IgG (n = 2; 0.5 mg in 200 μl intraperitoneally), or with no injection (n = 1). β1‐injected mice were sacrificed after 6 (n = 3) or 24 h (n = 3), while control mice were sacrificed 24 h after injection. Amyloid β Protein Fragment 1–42 (A9810, Sigma) was diluted at 1 μg/ml in PBS and passively absorbed on multiwell plates (SpectraPlate‐384 HB, Perkin Elmer) overnight at 4°C. Plates were washed three times in 0.1% PBS‐Tween 20 (PBS‐T) and blocked with 80 μl per well of 5% skim milk (Migros) in 0.1% PBS‐T, for 2 h at room temperature. β1‐antibody and pooled recombinant IgG were used as positive and negative controls, respectively. Blocking buffer was discarded, and both samples and controls were dissolved in 1% skim milk in 0.1% PBS‐T for 1 h at 37°C. Twofold dilutions of β1‐antibody, starting at a dilution of 1,000 ng/ml in 1% skim milk and in 0.1% PBS‐T, were used for a calibration curve. Goat polyclonal anti‐mouse antibody (1:1,000, 115‐035‐062, Jackson ImmunoResearch) was used to detect murine antibodies. Chromogenic reaction was induced by addition of TMB Stabilized Chromogen (SB02, Thermo Fisher Scientific) and stopped by addition of 0.5 M H2SO4. Absorbance was read at λ = 450 nm. Unknown β1‐antibody concentrations were interpolated from the linear range of the calibration curve using linear regression (GraphPad Prism, GraphPad Software).
Western blots of Aβ and BACE1
Brain hemispheres from mice treated with LIN5044 (0.4 mg/week, once/week in 100 μl PBS; n = 1) or PBS (n = 1) intraperitoneally, or with NB360 chow (0.5 g inhibitor/kg chow, ~ 6 g chow/day/mouse = 3 mg inhibitor/day/mouse; n = 1) or control chow (n = 1) for 3 months, were dissected into eight anatomical regions: rostro dorsal, rostro ventral, medio dorsal, medio ventral, caudo dorsal, caudo ventral, brain stem, cerebellum (Appendix Fig S8A). Each region was homogenized using Ribolyser for 5 min in 500 μl lysis buffer (140 mM NaCl, 20 mM TrisHCl, pH 7.5, protease inhibitors [complete Mini, Roche], phosphatase inhibitors [PhosphoSTOP, Roche] in PBS), and centrifuged at 15,000 g for 30 min at 4°C. Subsequently, the supernatant of each sample was isolated, and the pellet was resuspended in 200 μl of lysis buffer with the addition of 0.5% SDS to obtain the insoluble fraction. In total, 2 μl of Dithiothreitol (DTT) was added to 20 μl of each fraction. Samples were loaded on a SDS‐PAGE (Novex NuPAGE 4–12% Bis‐Tris Gels). After electrophoresis, gel was transferred to iBlot I (Invitrogen) and transferred onto polyvinylidene difluoride (PVDF) membrane. Membranes were blocked in 5% Sureblock for 1 h at room temperature followed by incubation at 4°C overnight with 1:1,000 dilution of the following primary antibodies: mouse monoclonal to human amyloid beta 1–16, clone 6E10 (Sigma) or rabbit polyclonal to BACE1 (abcam ab2077). Membranes were washed 3× (10 min each) with PBS‐Tween (0.1%) followed by incubation with HRP‐tagged secondary antibody (Peroxidase‐Goat Anti‐Mouse IgG (H+L; #62‐6520) or Peroxidase‐Goat Anti‐Rabbit IgG (H+L; #111.035.045); 1 h at room temperature) and further washes (3×, 10 min). Membranes were developed with Luminata Crescendo (Millipore), and images were acquired using Fusion Solo S (Vilber).
Whole‐brain imaging
Whole brain images were recorded with a custom‐made selective plane illumination microscope (mesoSPIM; Voigt et al, 2019). SPIM imaging was done after clearing and refractive index matching. The laser/filter combinations for mesoSPIM imaging were as follows: for qFTAA at 488 nm excitation, a 498–520 nm bandpass filter (BrightLine 509/22 HC, Semrock/AHF) was used as the emission filter; for hFTAA at 488 nm excitation, a 565–605 nm bandpass filter (585/40 BrightLine HC, Semrock/AHF) was used. Transparent whole brains were imaged at a voxel size of 3.26 × 3.26 × 3 μm3 (X × Y × Z). For scanning a whole brain, 16 tiles per channel were imaged (eight tiles per brain hemisphere). After the acquisition of one hemisphere, the sample was rotated, and the other hemisphere was then acquired. The entire process resulted in typical acquisition times of 2–3 h, followed by stitching (Bria & Iannello, 2012). Data accumulated from one brain ranged around 600 GB in size. Further technical details of the mesoSPIM have been previously reported (Voigt et al, 2019). The scientist imaging the brains was not blinded to the experimental ID of the mice.
Computational and statistical analysis
The following computations were performed using custom scripts written in Python and R as well as existing third‐party libraries (Table 2). The two‐channel (498–520 nm and 565–605 nm) substacks for each brain hemisphere were first stitched together with Terastitcher (Bria & Iannello, 2012). The result was downsampled from the acquired resolution (3.26 μm lateral, 3 μm depth) to an isotropic 25 μm resolution and then registered to the Allen Institute 25 μm average anatomical template atlas (Wang et al, 2020). This was performed automatically using a combination of affine and b‐spline transformation registrations with a mutual information similarity metric, using parameters influenced from a previous study performing mouse whole‐brain fluorescence quantification (Renier et al, 2016). The resulting pairs of transformations were used in subsequent steps to transform coordinates in the raw data space to the template atlas space (Appendix Fig S4).
The 565–605 nm channel at its original resolution was used to determine the locations of aggregates of amyloid‐β stained with qFTAA and hFTAA. A random forest classifier was used to classify each voxel as either “belonging to a plaque” or “background.” This classifier was generated using the open‐source Ilastik framework (Berg et al, 2019) and trained on a random subset of data (random stacks, three stacks [187 × 176 × 1242 pixels] picked from every experimental group) that was separately annotated by two neuropathologists. Amyloid‐β aggregates were considered to be the individually connected components from this binarized volume. The three‐dimensional center of mass and total volume were then calculated for each component. Connected components with a volume below a global threshold were considered noise and ignored. The centers of mass were used to look up the peak fluorescent intensity of each plaque in the 498–520 nm (qFTAA) channel. Plaque maturity was calculated for each plaque as its peak intensity in the 498–520 nm (qFTAA) channel divided by its peak intensity in the 565–605 nm (hFTAA) channel (Nystrom et al, 2013; Fig 2C).
After downsampling each aggregate center to 25‐μm resolution and applying the optimized registration transformation, the number of aggregates were counted at each voxel in this atlas space (Appendix Fig S4E and F). Smoothed heatmaps were generated by placing a spherical ROI with 15‐voxel diameter (= 375 μm) at each voxel and summing the plaque counts within the ROI. This ROI diameter was set to match the mean spatial Jacobian‐matrix determinant of the previously registered b‐spline transformation across all samples. This method for smoothing and accounting for variable registration quality has also been described in a previous whole‐brain study (Renier et al, 2016). Voxel‐level statistics across treated and control brains involved running a two‐sided t‐test at each heatmap voxel across the two groups. Each voxel P‐value was adjusted using the Benjamini–Hochberg method (Benjamini et al, 2001). These adjusted P‐value maps were then binarized with a threshold of 0.05 or 0.10 for subsequent analysis or visualization.
The transformed locations of each plaque were also further grouped into 134 different anatomically segmented regions in the Allen Reference Atlas (Wang et al, 2020) for further statistical analysis between longitudinal groups (Appendix Figs S4G and S10). Similar heatmap generation, voxel statistics, and regional statistics were performed for two other metrics: the mean plaque volume and the mean plaque maturity. For all statistical tests, no sample size estimation methods were used.
The voxel‐level statistical map for each treatment group was also compared against a spatially resolved transcriptomics database consisting of 23,371 genes across 34,103 locations throughout the brain (Ortiz et al, 2020). Since the data from this study and the spatial transcriptomic database were both in the ARA coordinate space, it was possible to spatially compare each gene's expression map with each treatment group's binarized P‐value map using a similarity metric. In this case, mutual information was used as the similarity metric since it will detect any sort of linear or nonlinear relationship between these two discrete datasets. In order to rank the relevancy of genes in contributing to the spatial map of plaque removal efficacy for a particular compound, we generated a ranked list of genes for each treatment group, sorted by their corresponding mutual information score. We also created an online browser for the MI database (https://fgcz‐shiny.uzh.ch/SPAGEDI/).
Key Resources are summarized in supplemental table 2 (Table 5). See also References (Bradski, 2000; Klein et al, 2010; Millman & Aivazis, 2011; Furth et al, 2018 ).
Table 5.
Third‐party libraries used for the computational pipeline.
| Software and algorithms | Source |
|---|---|
| ClearMap | Renier, N et al (2016) Mapping of Brain Activity by Automated Volume Analysis of Immediate Early Genes. Cell 165: 1789–1802 10.1016/j.cell.2016.05.007 |
| Python | Python Software Foundation. Python Language Reference, version 2.7 (http://www.python.org) |
| FIJI | Schindelin J et al (2012) Fiji: an open‐source platform for biological‐image analysis. Nat Methods 9: 676–682 |
| R | R Core Team (2013) R: a language and environment for statistical computing. R Foundation for Statistical Computing, Vienna, Austria (http://www.R‐project.org) |
Author contributions
Daniel Kirschenbaum: Conceptualization; data curation; validation; investigation; visualization; methodology; writing—original draft; writing—review and editing. Ehsan Dadgar‐Kiani: Data curation; software; formal analysis; validation; visualization; methodology; writing—original draft; writing—review and editing. Francesca Catto: Data curation; validation; investigation. Fabian F Voigt: Methodology. Chiara Trevisan: Investigation. Oliver Bichsel: Investigation. Hamid Shirani: Resources. Peter R Nilsson: Resources. Karl J Frontzek: Investigation. Paolo Paganetti: Resources. Fritjof Helmchen: Methodology. Jin Hyung Lee: Conceptualization; supervision; funding acquisition; writing—original draft; project administration; writing—review and editing. Adriano Aguzzi: Conceptualization; supervision; funding acquisition; writing—original draft; project administration; writing—review and editing.
Disclosure and competing interests statement
J.H.L. is a founder, consultant, and shareholder of LVIS. The University of Zurich has filed a patent protecting certain aspects of the rapid‐clarification technology described here. Prof. Adriano Aguzzi is a member of the EMM Editorial Board. This has no bearing on the editorial consideration of this article for publication.
For more information
Correlations between spatial transcriptomic data and drug efficacy: https://fgcz‐shiny.uzh.ch/SPAGEDI/.
The paper explained.
Problem
Alzheimer's disease (AD) is an incurable neurodegenerative brain disease. The amyloid beta protein, mainly produced by nerve cells, is considered to play a major role in the development of AD. Many compounds were shown to reduce amyloid beta in the brain of mice leading to improved cognition. While amyloid beta reduction in humans was successful in some clinical trials, the improvement in brain function has been less convincing. There are several reasons why this might be the case. For example, amyloid beta might play a smaller role in AD than previously thought, or AD is a result of a combination of factors. Alternatively, reducing amyloid beta is important, but the treatment must happen in the right time and in the relevant areas of the brain. Therefore, we need to understand when & where amyloid beta drugs target the brain.
Results
To test when & where AD drugs target amyloid beta in the brain, we developed a novel technology, termed Q3D, to microscopically measure changes in amyloid beta across the entire brain of mice. The development of Q3D included the development of protocols that turn mouse brains transparent while staining amyloid beta aggregates. Next, we scanned the brain samples with a selective plane illumination microscope (SPIM). The SPIM scans provide entire mouse brain scans at a microscopic resolution. At this resolution, we can count all the amyloid beta aggregates, called plaques, in the brain. We quantified amyloid beta plaques in the entire brain and used it as a proxy to measure when & where AD drugs change amyloid beta. Our results show that two compounds we tested, an amyloid beta production inhibitor (NB360) and an amyloid stabilizer polythiophene (LIN5044), affect plaques at different times in different brain regions.
Impact
Our experiments revealed that when & where NB360 and LIN5044 target amyloid beta is very distinct. This shows that when testing AD drugs in clinical trials, scientists must take into consideration the potential brain‐region and disease‐stage‐specific effects of drugs. These effects may have a major influence on the outcome of clinical trials. AD drugs should be tested when & where they impact the brain, both in preclinical and clinical trials.
Supporting information
Appendix
Expanded View Figures PDF
Source Data for Expanded View and Appendix
PDF+
Source Data for Figure 1
Acknowledgments
We thank Dr. Giulia Miracca, Dr. Todd E Golde, and Dr. Soyon Hong for critical reading of the manuscript, Dr. Ulf Neumann for providing NB360 and β1, Dr. Michael B. Smith for help with designing 3D‐printed parts, and Dr. Asvin Lakkaraju for help with biochemical measurements. Scientific sketches were used from SciDraw.io 10.5281/zenodo.3925971, 10.5281/zenodo.3925911, doi.org/10.5281/zenodo.3926119. Funding: AA is the recipient of an Advanced Grant of the European Research Council and grants from the Swiss National Research Foundation (grant ID 179040 and grant ID 207872, Sinergia grant ID 183563), the Gelu Foundation, the Nomis Foundation, the Swiss Personalized Health Network (SPHN, 2017DRI17), the USZ Foundation, and a donation from the estate of Dr. Hans Salvisberg. KPRN is the recipient of a Consolidator Grant from the Swedish Research Council (Grant 2016‐00748). FH is a recipient of an Advanced Grant of the European Research Council (BRAINCOMPATH, project no. 670757). JHL and EDK were funded by NIH/NINDS R01NS087159, NIH/NINDS R01NS091461, NIH/NIA RF1AG047666, and NIH/NIMH RF1MH114227.
EMBO Mol Med (2023) 15: e16789
Contributor Information
Jin Hyung Lee, Email: ljinhy@stanford.edu.
Adriano Aguzzi, Email: adriano.aguzzi@usz.ch.
Data availability
All data needed to evaluate the conclusions in the paper are present in the paper and/or the Supplementary Materials. The extensive imaging data are available upon request.
3D designs used for 3D printing tissue clearing and staining chambers (https://grabcad.com/library/electrophoretic‐tissue‐clearing‐and‐staining‐chamber‐1)
The computational code for browsing the correlations between spatial transcriptomic data and regional drug efficacy (https://github.com/dadgarki/alz‐drug‐3d‐browser)
Spatial transcriptomic data (Ortiz et al, 2020, DOI: 10.1126/sciadv.abb3446)
Lightsheet scans are archived in the Institute of Neuropathology, University Hospital Zurich, and are available upon request.
References
- Balakrishnan K, Rijal Upadhaya A, Steinmetz J, Reichwald J, Abramowski D, Fandrich M, Kumar S, Yamaguchi H, Walter J, Staufenbiel M et al (2015) Impact of amyloid beta aggregate maturation on antibody treatment in APP23 mice. Acta Neuropathol Commun 3: 41 [DOI] [PMC free article] [PubMed] [Google Scholar]
- Benjamini Y, Drai D, Elmer G, Kafkafi N, Golani I (2001) Controlling the false discovery rate in behavior genetics research. Behav Brain Res 125: 279–284 [DOI] [PubMed] [Google Scholar]
- Berg S, Kutra D, Kroeger T, Straehle CN, Kausler BX, Haubold C, Schiegg M, Ales J, Beier T, Rudy M et al (2019) Ilastik: interactive machine learning for (bio)image analysis. Nat Methods 16: 1226–1232 [DOI] [PubMed] [Google Scholar]
- Braak H, Braak E, Bohl J (1993) Staging of Alzheimer‐related cortical destruction. Eur Neurol 33: 403–408 [DOI] [PubMed] [Google Scholar]
- Bradski G (2000) The OpenCV library. Dr Dobbs J 120: 122–125 [Google Scholar]
- Brendel M, Jaworska A, Overhoff F, Blume T, Probst F, Gildehaus FJ, Bartenstein P, Haass C, Bohrmann B, Herms J et al (2018) Efficacy of chronic BACE1 inhibition in PS2APP mice depends on the regional a beta deposition rate and plaque burden at treatment initiation. Theranostics 8: 4957–4968 [DOI] [PMC free article] [PubMed] [Google Scholar]
- Bria A, Iannello G (2012) TeraStitcher ‐ a tool for fast automatic 3D‐stitching of teravoxel‐sized microscopy images. BMC Bioinformatics 13: 316 [DOI] [PMC free article] [PubMed] [Google Scholar]
- Burgold S, Filser S, Dorostkar MM, Schmidt B, Herms J (2014) In vivo imaging reveals sigmoidal growth kinetic of beta‐amyloid plaques. Acta Neuropathol Commun 2: 30 [DOI] [PMC free article] [PubMed] [Google Scholar]
- Chen WT, Lu A, Craessaerts K, Pavie B, Sala Frigerio C, Corthout N, Qian X, Lalakova J, Kuhnemund M, Voytyuk I et al (2020) Spatial transcriptomics and In situ sequencing to study Alzheimer's disease. Cell 182: 976–991.e19 [DOI] [PubMed] [Google Scholar]
- Chung K, Wallace J, Kim SY, Kalyanasundaram S, Andalman AS, Davidson TJ, Mirzabekov JJ, Zalocusky KA, Mattis J, Denisin AK et al (2013) Structural and molecular interrogation of intact biological systems. Nature 497: 332–337 [DOI] [PMC free article] [PubMed] [Google Scholar]
- Cohen SI, Linse S, Luheshi LM, Hellstrand E, White DA, Rajah L, Otzen DE, Vendruscolo M, Dobson CM, Knowles TP (2013) Proliferation of amyloid‐beta42 aggregates occurs through a secondary nucleation mechanism. Proc Natl Acad Sci U S A 110: 9758–9763 [DOI] [PMC free article] [PubMed] [Google Scholar]
- De Strooper B, Vassar R, Golde T (2010) The secretases: enzymes with therapeutic potential in Alzheimer disease. Nat Rev Neurol 6: 99–107 [DOI] [PMC free article] [PubMed] [Google Scholar]
- Fiest KM, Roberts JI, Maxwell CJ, Hogan DB, Smith EE, Frolkis A, Cohen A, Kirk A, Pearson D, Pringsheim T et al (2016) The prevalence and incidence of dementia due to Alzheimer's disease: a systematic review and meta‐analysis. Can J Neurol Sci 43: S51–S82 [DOI] [PubMed] [Google Scholar]
- Furth D, Vaissiere T, Tzortzi O, Xuan Y, Martin A, Lazaridis I, Spigolon G, Fisone G, Tomer R, Deisseroth K et al (2018) An interactive framework for whole‐brain maps at cellular resolution. Nat Neurosci 21: 139–149 [DOI] [PMC free article] [PubMed] [Google Scholar]
- Hardy J, Selkoe DJ (2002) The amyloid hypothesis of Alzheimer's disease: progress and problems on the road to therapeutics. Science 297: 353–356 [DOI] [PubMed] [Google Scholar]
- Hellstrand E, Boland B, Walsh DM, Linse S (2010) Amyloid beta‐protein aggregation produces highly reproducible kinetic data and occurs by a two‐phase process. ACS Chem Nerosci 1: 13–18 [DOI] [PMC free article] [PubMed] [Google Scholar]
- Herrmann US, Schutz AK, Shirani H, Huang D, Saban D, Nuvolone M, Li B, Ballmer B, Aslund AK, Mason JJ et al (2015) Structure‐based drug design identifies polythiophenes as antiprion compounds. Sci Transl Med 7: 299ra123 [DOI] [PubMed] [Google Scholar]
- Howard R, Liu KY (2020) Questions EMERGE as biogen claims aducanumab turnaround. Nat Rev Neurol 16: 63–64 [DOI] [PubMed] [Google Scholar]
- Jiang L, Liu C, Leibly D, Landau M, Zhao M, Hughes MP, Eisenberg DS (2013) Structure‐based discovery of fiber‐binding compounds that reduce the cytotoxicity of amyloid beta. Elife 2: e00857 [DOI] [PMC free article] [PubMed] [Google Scholar]
- Klein S, Staring M, Murphy K, Viergever MA, Pluim JPW (2010) Elastix: a toolbox for intensity‐based medical image registration. IEEE Trans Med Imaging 29: 196–205 [DOI] [PubMed] [Google Scholar]
- Lau A, So RWL, Lau HHC, Sang JC, Ruiz‐Riquelme A, Fleck SC, Stuart E, Menon S, Visanji NP, Meisl G et al (2020) Alpha‐synuclein strains target distinct brain regions and cell types. Nat Neurosci 23: 21–31 [DOI] [PMC free article] [PubMed] [Google Scholar]
- Liebmann T, Renier N, Bettayeb K, Greengard P, Tessier‐Lavigne M, Flajolet M (2016) Three‐dimensional study of Alzheimer's disease hallmarks using the iDISCO clearing method. Cell Rep 16: 1138–1152 [DOI] [PMC free article] [PubMed] [Google Scholar]
- Margalith I, Suter C, Ballmer B, Schwarz P, Tiberi C, Sonati T, Falsig J, Nystrom S, Hammarstrom P, Aslund A et al (2012) Polythiophenes inhibit prion propagation by stabilizing prion protein (PrP) aggregates. J Biol Chem 287: 18872–18887 [DOI] [PMC free article] [PubMed] [Google Scholar]
- Millman KJ, Aivazis M (2011) Python for scientists and engineers. Comp Sci Eng 13: 9–12 [Google Scholar]
- Morris GP, Clark IA, Vissel B (2018) Questions concerning the role of amyloid‐beta in the definition, aetiology and diagnosis of Alzheimer's disease. Acta Neuropathol 136: 663–689 [DOI] [PMC free article] [PubMed] [Google Scholar]
- Neumann U, Rueeger H, Machauer R, Veenstra SJ, Lueoend RM, Tintelnot‐Blomley M, Laue G, Beltz K, Vogg B, Schmid P et al (2015) A novel BACE inhibitor NB‐360 shows a superior pharmacological profile and robust reduction of amyloid‐beta and neuroinflammation in APP transgenic mice. Mol Neurodegener 10: 44 [DOI] [PMC free article] [PubMed] [Google Scholar]
- Neumann U, Machauer R, Shimshek DR (2019) The beta‐secretase (BACE) inhibitor NB‐360 in preclinical models: from amyloid‐beta reduction to downstream disease‐relevant effects. Br J Pharmacol 176: 3435–3446 [DOI] [PMC free article] [PubMed] [Google Scholar]
- Nystrom S, Psonka‐Antonczyk KM, Ellingsen PG, Johansson LB, Reitan N, Handrick S, Prokop S, Heppner FL, Wegenast‐Braun BM, Jucker M et al (2013) Evidence for age‐dependent in vivo conformational rearrangement within Abeta amyloid deposits. ACS Chem Biol 8: 1128–1133 [DOI] [PubMed] [Google Scholar]
- Ortiz C, Navarro JF, Jurek A, Martin A, Lundeberg J, Meletis K (2020) Molecular atlas of the adult mouse brain. Sci Adv 6: eabb3446 [DOI] [PMC free article] [PubMed] [Google Scholar]
- Paganetti H, Schmitz T (1996) The influence of the beam modulation technique on dose and RBE in proton radiation therapy. Phys Med Biol 41: 1649–1663 [DOI] [PubMed] [Google Scholar]
- Paganetti PA, Lis M, Klafki HW, Staufenbiel M (1996) Amyloid precursor protein truncated at any of the gamma‐secretase sites is not cleaved to beta‐amyloid. J Neurosci Res 46: 283–293 [DOI] [PubMed] [Google Scholar]
- Peters F, Salihoglu H, Rodrigues E, Herzog E, Blume T, Filser S, Dorostkar M, Shimshek DR, Brose N, Neumann U et al (2018) BACE1 inhibition more effectively suppresses initiation than progression of beta‐amyloid pathology. Acta Neuropathol 135: 695–710 [DOI] [PMC free article] [PubMed] [Google Scholar]
- Pfeifer M, Boncristiano S, Bondolfi L, Stalder A, Deller T, Staufenbiel M, Mathews PM, Jucker M (2002) Cerebral hemorrhage after passive anti‐Abeta immunotherapy. Science 298: 1379 [DOI] [PubMed] [Google Scholar]
- Radde R, Bolmont T, Kaeser SA, Coomaraswamy J, Lindau D, Stoltze L, Calhoun ME, Jaggi F, Wolburg H, Gengler S et al (2006) Abeta42‐driven cerebral amyloidosis in transgenic mice reveals early and robust pathology. EMBO Rep 7: 940–946 [DOI] [PMC free article] [PubMed] [Google Scholar]
- Rasmussen J, Mahler J, Beschorner N, Kaeser SA, Hasler LM, Baumann F, Nystrom S, Portelius E, Blennow K, Lashley T et al (2017) Amyloid polymorphisms constitute distinct clouds of conformational variants in different etiological subtypes of Alzheimer's disease. Proc Natl Acad Sci U S A 114: 13018–13023 [DOI] [PMC free article] [PubMed] [Google Scholar]
- Renier N, Adams EL, Kirst C, Wu Z, Azevedo R, Kohl J, Autry AE, Kadiri L, Umadevi Venkataraju K, Zhou Y et al (2016) Mapping of brain activity by automated volume analysis of immediate early genes. Cell 165: 1789–1802 [DOI] [PMC free article] [PubMed] [Google Scholar]
- Richardson DS, Lichtman JW (2015) Clarifying tissue clearing. Cell 162: 246–257 [DOI] [PMC free article] [PubMed] [Google Scholar]
- Richardson DS, Guan W, Matsumoto K, Pan C, Chung K, Erturk A, Ueda HR, Lichtman JW (2021) Tissue clearing. Nat Rev Methods Primers 1: 84 [DOI] [PMC free article] [PubMed] [Google Scholar]
- Rijal Upadhaya A, Kosterin I, Kumar S, von Arnim CA, Yamaguchi H, Fandrich M, Walter J, Thal DR (2014) Biochemical stages of amyloid‐beta peptide aggregation and accumulation in the human brain and their association with symptomatic and pathologically preclinical Alzheimer's disease. Brain 137: 887–903 [DOI] [PubMed] [Google Scholar]
- Sevigny J, Chiao P, Bussiere T, Weinreb PH, Williams L, Maier M, Dunstan R, Salloway S, Chen T, Ling Y et al (2016) The antibody aducanumab reduces Abeta plaques in Alzheimer's disease. Nature 537: 50–56 [DOI] [PubMed] [Google Scholar]
- Shahnawaz M, Mukherjee A, Pritzkow S, Mendez N, Rabadia P, Liu X, Hu B, Schmeichel A, Singer W, Wu G et al (2020) Discriminating alpha‐synuclein strains in Parkinson's disease and multiple system atrophy. Nature 578: 273–277 [DOI] [PMC free article] [PubMed] [Google Scholar]
- Sperling RA, Karlawish J, Johnson KA (2013) Preclinical Alzheimer disease‐the challenges ahead. Nat Rev Neurol 9: 54–58 [DOI] [PMC free article] [PubMed] [Google Scholar]
- Szepesi Z, Manouchehrian O, Bachiller S, Deierborg T (2018) Bidirectional microglia‐neuron communication in health and disease. Front Cell Neurosci 12: 323 [DOI] [PMC free article] [PubMed] [Google Scholar]
- Tarozzo G, Bortolazzi S, Crochemore C, Chen SC, Lira AS, Abrams JS, Beltramo M (2003) Fractalkine protein localization and gene expression in mouse brain. J Neurosci Res 73: 81–88 [DOI] [PubMed] [Google Scholar]
- Thal DR, Rub U, Orantes M, Braak H (2002) Phases of a beta‐deposition in the human brain and its relevance for the development of AD. Neurology 58: 1791–1800 [DOI] [PubMed] [Google Scholar]
- Tomer R, Ye L, Hsueh B, Deisseroth K (2014) Advanced CLARITY for rapid and high‐resolution imaging of intact tissues. Nat Protoc 9: 1682–1697 [DOI] [PMC free article] [PubMed] [Google Scholar]
- Vieira P, Rajewsky K (1988) The half‐lives of serum immunoglobulins in adult mice. Eur J Immunol 18: 313–316 [DOI] [PubMed] [Google Scholar]
- Voigt FF, Kirschenbaum D, Platonova E, Pagès S, Campbell RA, Kastli R, Schaettin M, Egolf L, Van Der Bourg A, Bethge P (2019) The mesoSPIM initiative: open‐source light‐sheet microscopes for imaging cleared tissue. Nat Methods 16: 1105–1108 [DOI] [PMC free article] [PubMed] [Google Scholar]
- Wang Q, Ding SL, Li Y, Royall J, Feng D, Lesnar P, Graddis N, Naeemi M, Facer B, Ho A et al (2020) The Allen mouse brain common coordinate framework: a 3D reference atlas. Cell 181: 936–953.e920 [DOI] [PMC free article] [PubMed] [Google Scholar]
- Winkler DT, Abramowski D, Danner S, Zurini M, Paganetti P, Tolnay M, Staufenbiel M (2010) Rapid cerebral amyloid binding by Abeta antibodies infused into beta‐amyloid precursor protein transgenic mice. Biol Psychiatry 68: 971–974 [DOI] [PubMed] [Google Scholar]
- Yang B, Treweek JB, Kulkarni RP, Deverman BE, Chen CK, Lubeck E, Shah S, Cai L, Gradinaru V (2014) Single‐cell phenotyping within transparent intact tissue through whole‐body clearing. Cell 158: 945–958 [DOI] [PMC free article] [PubMed] [Google Scholar]