Abstract
If a patient can be discharged from an intensive care unit (ICU) is usually decided by the treating physicians based on their clinical experience. However, nowadays limited capacities and growing socioeconomic burden of our health systems increase the pressure to discharge patients as early as possible, which may lead to higher readmission rates and potentially fatal consequences for the patients. Therefore, here we present a long short-term memory-based deep learning model (LSTM) trained on time series data from Medical Information Mart for Intensive Care (MIMIC-III) dataset to assist physicians in making decisions if patients can be safely discharged from cardiovascular ICUs. To underline the strengths of our LSTM we compare its performance with a logistic regression model, a random forest, extra trees, a feedforward neural network and with an already known, more complex LSTM as well as an LSTM combined with a convolutional neural network. The results of our evaluation show that our LSTM outperforms most of the above models in terms of area under receiver operating characteristic curve. Moreover, our LSTM shows the best performance with respect to the area under precision-recall curve. The deep learning solution presented in this article can help physicians decide on patient discharge from the ICU. This may not only help to increase the quality of patient care, but may also help to reduce costs and to optimize ICU resources. Further, the presented LSTM-based approach may help to improve existing and develop new medical machine learning prediction models.
Keywords: Digital health, deep learning, intensive care unit, readmission prediction, time-series analysis
Introduction
In many medical disciplines, such as cardiac surgery, patients have to stay in intensive care unit (ICU) after surgical treatment. As soon as their condition is stabilized, they are typically transferred to the intermediate care unit (IMC), and later to the normal ward. This is the case for both elective and emergency cases. However, ICUs are wards with very limited capacity and implicitly define the number of patients that can receive specialized treatment. Thus, patients must be regularly discharged from the ICU so that new patients can be admitted to the ward. As a consequence, physicians are under pressure to decide if a patient is stable enough to be transferred to the next ward. When a patient is discharged too early, the clinical condition after transfer may worsen and he will have to return to the ICU affecting planned and emergency treatments. Thus, when choosing the time of discharge, the possible consequences must be taken into account. On the one hand, a delayed discharge may lead to a lack of the availability of ICU beds which can result in the cancellation of surgeries and higher mortality in general.1 On the other hand, several studies show that premature transfers from the ICU may lead to a higher number of readmissions.2–4In general, patients who are readmitted to the ICU have a higher length of stay (LOS) and mortality in hospital.5,6 Our study has several goals. On the one hand, this study aimed at providing a proof of concept for an artificial intelligence (AI)-based clinical decision support tool for predicting patient readmission to cardiovascular ICUs by analyzing the performance of a deep learning model with recurrent architecture as applied to clinical time-series data. As a result, the proposed predictive model which is capable of capturing temporal dependencies in the vital parameters can be used to support the decision-making process regarding the discharge of patients explicitly from cardiovascular ICUs. On the other hand, this study aims to demonstrate that, compared to for example, Lin et al.7 simpler deep learning-based methods can provide comparable or even better results.
The open access Medical Information Mart for Intensive Care (MIMIC-III) dataset includes data from many ICU stays for patients suffering from different types of diseases or injuries. However, the target dataset from our cardiovascular department, which will be used for upcoming research comes from our cardiovascular ICU. Most patients who visit the cardiovascular ICUs have undergone cardiovascular surgery beforehand. Since cardiovascular surgeries tend to be more invasive than other types of operations, the patients require special kinds of care and treatment with longer ICU stay times up to 14 days.8,9 In addition, as data-driven machine learning (ML) based models are sensitive to differences and characteristics shifts between train and held-out test cohorts, we hypothesize that a model which is trained on a subset of MIMIC-III database with cardiovascular stays would generalize better to an unseen cohort from our facilities.
Related work
Several deep learning methods have already been published to assist physicians in making decisions regarding patient discharge.10,11,7 However, these deep learning methods focus on general ICU discharges with no regard to the specific needs of cardiovascular patients. Models that are specialized for the transfer of patients from all ICUs show either results that need improvement or an increased complexity, due to a combination of different deep learning layers and other mechanisms. In some cases, however, this complexity can be avoided by choosing alternative features and a different procedure for preprocessing.
Time-series analysis has been applied in various medical domains such as hospital admission prediction12 and ICU readmission prediction.7,13 Furthermore, a variety of deep learning methods have been used for readmission prediction.14,15One methodically similar approach comes from Lin et al.7 It relies on the same database as the solution presented in this study, but it combines two different deep learning models to approve the classification results. Beside the more complex model than is used in this study, the method of Lin et al. includes patients from all types of ICUs. While this approach results in more data available for training and so may improve the deep learning models, it does not allow to focus on features or methods that may only be useful for a subset of patients. This also makes it more difficult to integrate knowledge from clinical experts into the study.
The vital parameters and patient information which are used in this study are chosen by experienced cardiac surgeons and intensivists at our department and are also compliant with related work.7
Materials and methods
Data
The models presented in this study are trained, validated, and evaluated on data from the MIMIC-III dataset which contains 61,532 ICU stays with demographics, vital signs, laboratory tests, medications, and additional clinical data for all 46,620 patients.16 In our study, we focus on patients with cardiac pathologies, therefore, only patients who had a stay at an ICU related to cardiac treatments are considered. In the MIMIC-III dataset, those are the cardiac surgery recovery unit (CSRU) and the coronary care unit (CCU). This reduces the number of selected ICU stays to 16,222, of which 3425 are eliminated due to insufficient data (Table 1).
Table 1.
Data overview.
| Property | Value |
|---|---|
| Features used | 14 |
| Minimum features available for ICU stay | 9 |
| Total ICU stays in the MIMIC-III dataset | 61,532 |
| Stays on CSRU and CCU | 16,222 |
| ICU stays used for analysis | 12,797 |
| ICU stays with returning patients | 1023 |
CSRU: cardiac surgery recovery unit; CCU: coronary care unit; MIMIC-III: Medical Information Mart for Intensive Care; ICU: intensive care unit.
Labeling
As described earlier, the goal of this study is to classify patients according to their transferability to a downstream clinical unit, such as IMC or normal ward, without the need to be readmitted to the ICU within 48 hours. Since this is a binary classification, the corresponding labels are “returning” and “not returning.” In total, there are three possible outcomes on which the labeling depends:
Patient dies during the hospital stay. Since dead or dying patients should not be transferred from the ICU to the intermediate care unit, they are referred to as “returning.”
Patient is transferred from ICU and then leaves the hospital alive. This is the case for the last stay at the ICU during a hospital stay. These patients are labeled as “not returning.”
Patients is transferred from the ICU and then returned to the ICU. Patients whose first ICU stay was less than 24 h are excluded due to possible logistical reasons. Readmitted patients are labeled as “returning.”
Preprocessing
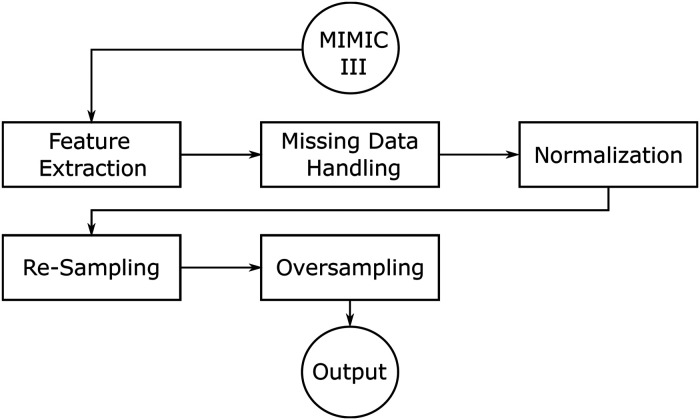
The preprocessing pipeline consists of several sequential steps, illustrated in Figure 1. The procedure is as follows: first, the required features are obtained from the MIMIC-III dataset. Then the feature values are normalized and missing data is filled. Finally, the data is both resampled and oversampled and passed to the model. The components are explained in more detail in the subsections of this chapter.
Figure 1.
Preprocessing pipeline.
The features are selected according to medical expertise in a direct collaboration with cardiac surgeons and intersivists of the University Hospital D’sseldorf (UKD). As a result, 14 medical features recorded in cardiovascular intensive care units are used for all models (Table 2).
Table 2.
Used features.
| Lab values | Vital signs | Profile information |
|---|---|---|
| Creatinine | Temperature | Weight |
| Blood pH | ABP | Age |
| Potassium | Heart rate | |
| Sodium | Oxygenation | |
| Hematocrit | ||
| White blood cell counts | ||
| Bicarbonate | ||
| Bilirubin |
ABP: ambulatory blood pressure.
Feature extraction
Several required features have multiple labels assigned to multiple IDs inside the MIMIC-III dataset (Table 3). This results in more than 12,000 IDs for all features in the database and the IDs for required features must be found via a manual search.
Table 3.
Used features with corresponding MIMIC-III IDs.
| Feature | Itemid |
|---|---|
| Creatinine | 1525, 220615 |
| Blood pH | 50820, 50831 |
| Potassium | 50971 |
| Sodium | 50983 |
| Hematocrit | 51221, 51221 |
| White blood cell counts | 51301 |
| Bicarbonate | 50882 |
| Bilirubin | 50885, 51464 |
| Temperature | 676, 677, 678, 679, 223762, 223761 |
| ABP | 51, 220050, 220179 |
| Heart rate | 220045 |
| Oxygenation | 646, 220277 |
| Weight | 580, 581, 763, 226512, 226531 |
| Age | Inferred from date of birth and admission time |
ABP: ambulatory blood pressure; MIMIC-III : Medical Information Mart for Intensive Care.
Particularly to mention is the age of the patients which is inferred using the date of birth and hospital admission time. The exact age of patients older than 89 years is not available for anonymization reasons and is set to 89 years.
Missing data handling
As not every feature is recorded for every patient, part of the data is missing. The input to the models needs to have a constant size so missing features either need to be replaced or data of ICU stays that miss some features could not be used which would not leave enough data in the dataset. If there is no data available for a feature, the value is set to 0. This approach assumes that missing data would not have been significantly different from the mean, as it would have been recorded otherwise.
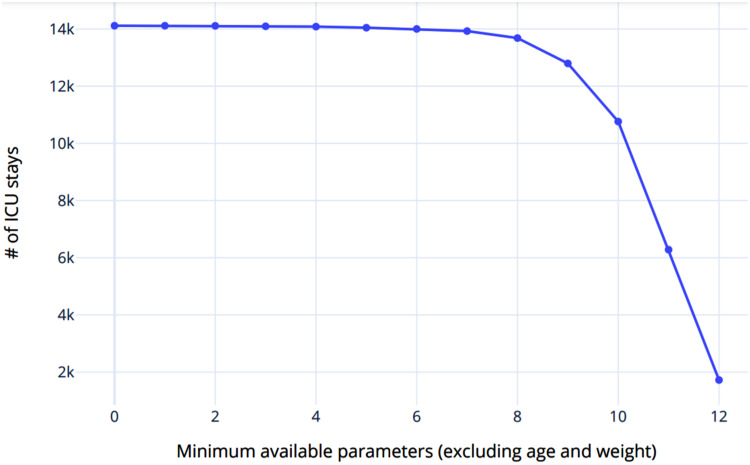
In addition, a threshold was introduced, which specifies the number of given features, from which a patient is included in the training/test data. When choosing the threshold, the relation between the minimum number of features per data point and the number of data points must be taken into account. This relationship is shown graphically in Figure 2. Thus, while an increasing threshold leads to each patient having an increasing number of relevant features in the training and testing data, the number of data sets for training and evaluating the model decreases exponentially. In contrast, a decreasing value for the threshold causes the number of data sets to increase, but each of the data sets contains progressively fewer relevant features.
Figure 2.
Relation between number of features and number of intensive care unit (ICU) stays.
Due to the assumption that missing data does not differ significantly from the mean of the data set, the number of features calculated as the mean increases in this case. This in turn may cause an increase of the average deviation from the assumption and accordingly inferior classification results. On this basis, the value for the threshold was chosen in such a way that as much data as possible remains available for training and testing the model, but at the same time, the number of available features is as high as possible. Figure 2 shows that a threshold higher than nine reduces the number of data points by more than 15% so this is chosen as the threshold.
Normalization
In the context of this work, the term normalization encompasses two different meanings. On the one hand, some features may be recorded in different units for different IDs in the MIMIC-III dataset (e.g. weight), so the values have to be converted accordingly before further processing the data. On the other hand, to increase the numerical stability of the deep learning models, each data point for a time series is normalized according to
where is the normalized value, is the mean of the feature over the whole dataset , and is the standard deviation over .
Re-sampling
Medical data is either at time steps of about 1 h or daily for laboratory data, but for usage with the models implemented in this study, uniform time series are necessary. To achieve this, vital parameters and laboratory values are re-sampled to a frequency of one entry per hour. If there is more than one value recorded per hour, the mean of each hour is used as the value. The mean over the whole dataset is used if there is no record for a time step.
Additionally, both age and weight are converted to a time series with the same frequency as the medical and laboratory data, but with the initial value at every time step.
Oversampling
The MIMIC-III database contains only a small number of patients who have returned to the ICU compared to the number of patients who were admitted to the ICU only once during their hospital stay (Table 1). Training a deep learning model on data with a significant skew of the class labels may result in a model that is not able to make accurate predictions on the minority class,17 thus we oversampled the data for training the deep learning models in order to achieve evenly distributed classes.
Classification methods
The goal of the methods presented here is to assign two class probabilities to each ICU stay to make the decision if the patient is able to be transferred from the ICU without medical complications.
A deep learning model that is able to capture time-dependencies in the data is compared to four other simpler models, a feedforward neural net and a logistic regression model as well as decision tree-based models (Random Forest and Extra Trees).
Logistic regression
To establish a baseline for comparison with the deep learning models, logistic regression is used. This statistical model has already been applied to similar tasks in medicine.18,19 In detail, logistic regression can be used as a binary classifier which models the relation between two discrete dependent variables and multiple independent variables.
In the context of this study, the two dependent variables are the labels “returning” and not “not returning” and the independent variables are the features. To reduce the number of values for each ICU stay, the time dimension is removed from the data as follows: for each time series, a linear fit is done. Slope and intercept of the resulting functions are then used as features. The procedure results in 28 features that are used for the prediction via logistic regression. To avoid overfitting, weight decay regularization is used with a value of 1.0.
No information about the time series is passed to the logistic regression, only the trend, so this approach will not be able to capture more complex time dependencies.
Feedforward neural network
The simplest form of a neural network is the feedforward neural network (FNN).20 In contrast to other network types like the recurrent neural networks (RNNs), the FNN does not have any kind of feedback connections. Each input is passed through the same neuron and layer only once.
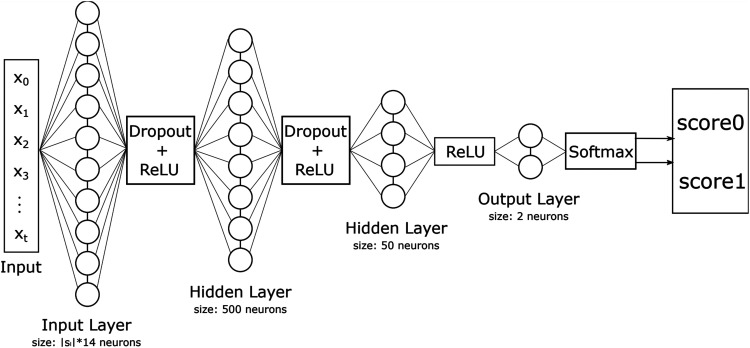
The architecture of the FNN used in this study is shown in Figure 3. It has neurons where is the longest time series in the dataset. Because the length of a time series may vary, every time series where is padded at its beginning with zeros to the length of .
Figure 3.
Feedforward neural network (FNN) architecture.
Since the relation between the classes and parameters is likely to be non-linear, hidden layers are used.20 The first hidden layer has a size of neurons and the second one of . Rectified linear unit (ReLU) is used as the activation function and a dropout layer with a value of for regularization.
The last layer has two output neurons, which are then passed through to the softmax function which assigns a probability to each class.
Besides the hyperparameters related to the network structure, there are also some parameters related to the training algorithm. For the FNN, we used Adam optimizer21 with as the optimization algorithm with the learning rate of 0.003 and cross-entropy as the loss function (Table 4).
Table 4.
Training related hyperparameters.
| Hyperparameters | Values |
|---|---|
| Optimization algorithm | Adam |
| Learning rate | 0.003 |
| Loss function | Cross-entropy |
| Batchsize | 32 |
| Epochs | Early stopping |
Random forest and extra trees
To provide further baselines for comparison to long short-term memory (LSTM), a random forest (RF)22 and an extra tree (ET)23 model have been analyzed using the last measurements available from each time-series variable. The hyperparameters and of both models are tuned within the five-fold cross-validation.
Long short-term memory
An LSTM is a special kind of RNNs, which is able to learn long-term dependencies. The input to the LSTM is a batch of arrays, each with all the time series for all features. While the LSTM can have inputs of varying lengths, the length of the input needs to be equal inside each batch. A possible solution to this is to pad each time series with zeros until they have equal length, but instead, a PyTorch object is used that solves this problem.
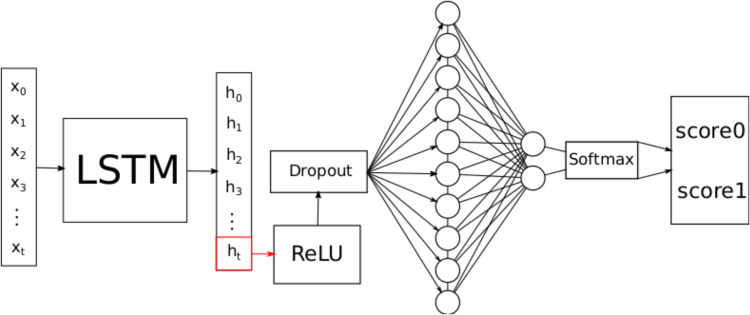
The architecture of the LSTM-based model used in this study is shown in Figure 4. The training-related hyperparameters for the model are the same as for the FNN (Table 4). of the input in Figure 4 denotes the i-th time step of all time series.
Figure 4.
Long short-term memory (LSTM) architecture.
The number of hidden units per state is chosen such that the model is capable to capture complex patterns but will not overfit. The chosen number of hidden units is 50.
The last hidden state is then passed through the ReLU function to introduce a non-linearity between the features of the hidden state. Before the fully connected layer, a dropout layer (with a value of 0.3) is used for regularization, as weight decay should not be used here because this may stop the model from recognizing time-dependent patterns.24 The fully connected layer has two output neurons, which are then passed through the softmax function to assign a probability to each class.
Validation
To validate the models, the data is split into a training- and test set with 80% of the data being used for training. The data is split such that the distribution of classes is the same for both splits. Choosing a larger training set could improve model performance, but would lead to a higher variation during evaluation.
Five-fold cross-validation is used for model selection as described by Zhang25 with random folds. The deep learning models are trained until the area under the precision–recall curve (AUCPR) stops increasing.
The model that achieves the highest AUCPR value during cross-validation is evaluated on the test set.
Evaluation results for training and testing on data from heart-related ICUs have some variation due to the limited amount of data, so this process is repeated five times and the mean is used as the final result.
Explainability
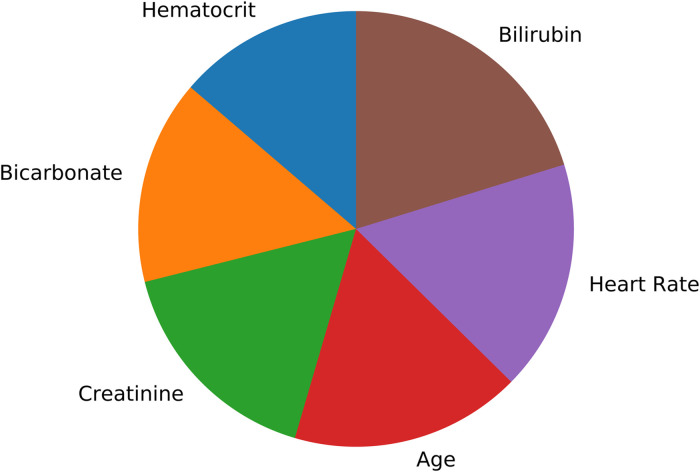
Providing transparent declarations on how AI algorithms draw conclusions is a critical factor for clinical decision support tools. For simpler classifiers such as support vector machines (SVMs) with linear kernels and decision tree-based methods, it is possible to provide an importance metrics in terms of coefficients for each input parameter. However, for most of the deep learning-based algorithms, it is an open research question how the underlying non-linear dependencies should be described. For the current study, we used feature importance parameter from the random forest classifier to identify the features which were most relevant in predicting the target label. This feature importance metrics quantifies the Gini importance of the features depending on how frequently a single feature is used in the ensembles of trees which form the forest of trees, as the sum over the splits that include the feature, proportional to the samples it splits.26
Results
Two datasets with the designations A and B are used for the evaluation. The dataset A contains only ICU stays of CCU and CSRU. The dataset B contains ICU stays of all ICUs. All the five models are evaluated on the dataset A. Additionally, the LSTM is evaluated on the dataset B to compare the results to the model of Lin et al.7 Both datasets are unbalanced, which makes commonly used evaluation metrics like the area under the receiver operating characteristic curve (AUCROC)27 and accuracy not providing enough information to accurately evaluate the models.28 Therefore, additional metrics such as the AUCPR, balanced accuracy, and F1-score are included.
CCU and CSRU
After the preprocessing steps, the dataset that only includes ICU stays on the CCU and CSRU contains 12,797 ICU stays, with 2560 stays used for evaluation. Only 8% of the training and test dataset are labeled as “returning.”
While a correct detection of true positives and negatives may more often assist physicians in their decision making, misclassification may lead to a premature ICU discharge of a patient. Therefore, false positives and negatives are just as important as true positives and negatives. For this reason, the models presented here are evaluated using both balanced accuracy and the F1-score.
These metrics are first computed using a decision threshold of 0.5 for each model. To evaluate the impact of the decision threshold, these results are compared to those using a threshold that maximizes the F1-score.
For the threshold of 0.5, the LSTM provides the best results for all metrics except precision (Table 5). Here, the best precision score is achieved by the random forest.
Table 5.
Threshold-based evaluation results (dataset A).
| Balanced accuracy | Recall | Precision | F1 | |
|---|---|---|---|---|
| Decision threshold: 0.5 | ||||
| LR | 0.672 | 0.597 | 0.177 | 0.274 |
| LSTM | 0.727 | 0.607 | 0.268 | 0.372 |
| RF | 0.618 | 0.288 | 0.340 | 0.312 |
| ET | 0.675 | 0.513 | 0.261 | 0.290 |
| FNN | 0.619 | 0.299 | 0.312 | 0.305 |
| Decision threshold: optimized | ||||
| LR | 0.671 | 0.363 | 0.621 | 0.457 |
| LSTM | 0.706 | 0.431 | 0.687 | 0.530 |
| RF | 0.682 | 0.467 | 0.296 | 0.361 |
| ET | 0.689 | 0.493 | 0.282 | 0.358 |
| FNN | 0.618 | 0.269 | 0.448 | 0.336 |
LR: logistic regression; LSTM: long short-term memory; RF: random forest; ETs: extra trees; FNN: feedforward neural network.
The optimized threshold causes the F1-score of LSTM to increase from 0.372 to 0.530, while the balanced accuracy decreases from 0.727 to 0.706 (Table 5).
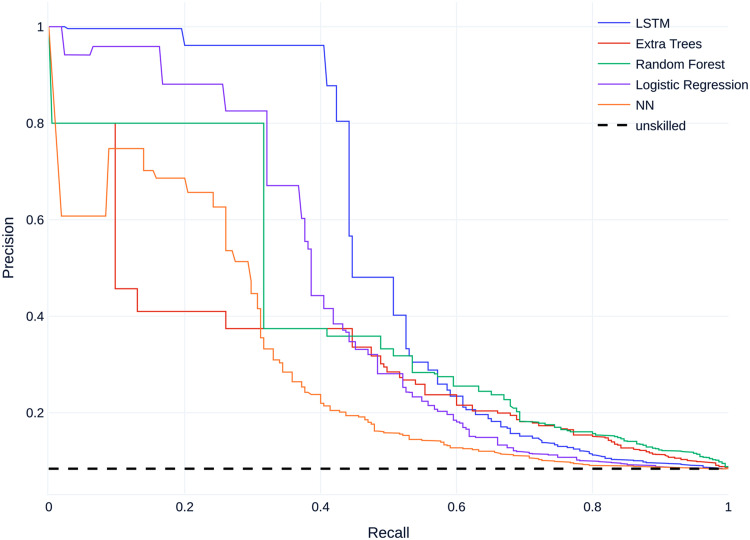
Regarding non-threshold based evaluation results the LSTM model performs best with an AUCPR of 0.529 and the feedforward neural net model performs worst with an AUCPR of 0.281 (Table 6). The baseline for the precision--recall (PR) curve is 0.08, given by the skew of the dataset, which corresponds to an unskilled classifier.
Table 6.
Non-threshold-based evaluation results (dataset A).
| AUCROC | AUCPR | |
|---|---|---|
| LR | 0.708 | 0.430 |
| LSTM | 0.777 | 0.529 |
| RF | 0.777 | 0.269 |
| ET | 0.776 | 0.282 |
| FNN | 0.640 | 0.281 |
LR: logistic regression; LSTM: long short-term memory; RF: random forest; ETs: extra trees; FNN: feedforward neural network; AUCROC: area under the receiver operator characteristic curve; AUCPR: area under the precision–recall curve.
Figure 5 shows the mean precision–recall (PR) curves for all models compared to the baseline. All models perform better than an unskilled classifier.
Figure 5.
Mean precision–recall (PR) curves on dataset A.
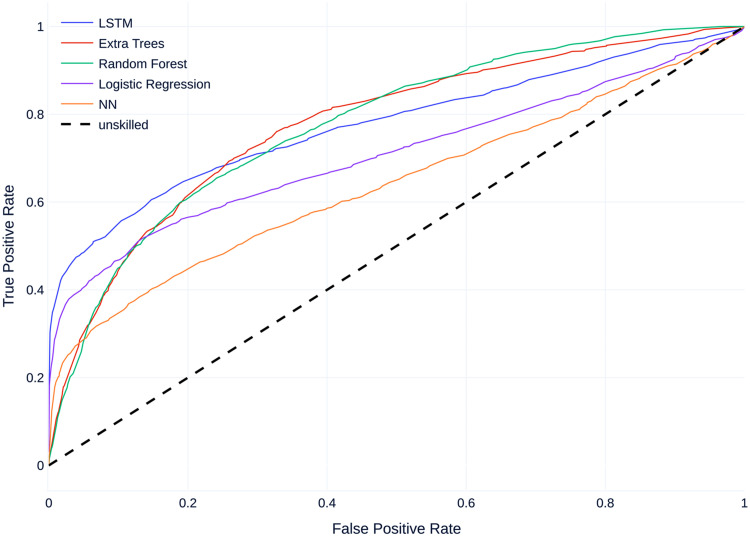
Figure 6 shows the mean receiver operating characteristic curve (ROC curves) for all models compared to a baseline of 0.5 which corresponds to an unskilled classifier. Similar to the PR Curves, all models perform better than an unskilled classifier, with most models performing similarly, except the FNN which performs worse than the other models.
Figure 6.
Mean receiver operating characteristic curve (ROC curves) on dataset A.
All ICUs
The dataset contains 40,663 ICU stays, 8127 of those are used for evaluation. 13.5% of stays are labeled as ‘’returning.” The results are compared to those of the best models of the study by Lin et al.7 The LSTM model of this study achieves a higher AUCROC than the two best-performing models (LSTM and LSTM+CNN) from the study by Lin et al. (Table 7). The AUCPR value is not recorded for the other model. Both AUCROC and AUCPR are better using data from all ICUs instead of just data from the CCU and CSRU (Table 7).
Table 7.
Non-threshold based evaluation results (dataset B).
AUCROC: area under the receiver operator characteristic curve; AUCPR: area under the precision–recall curve; LSTM: long short-term memory; CNN: convolutional neural network.
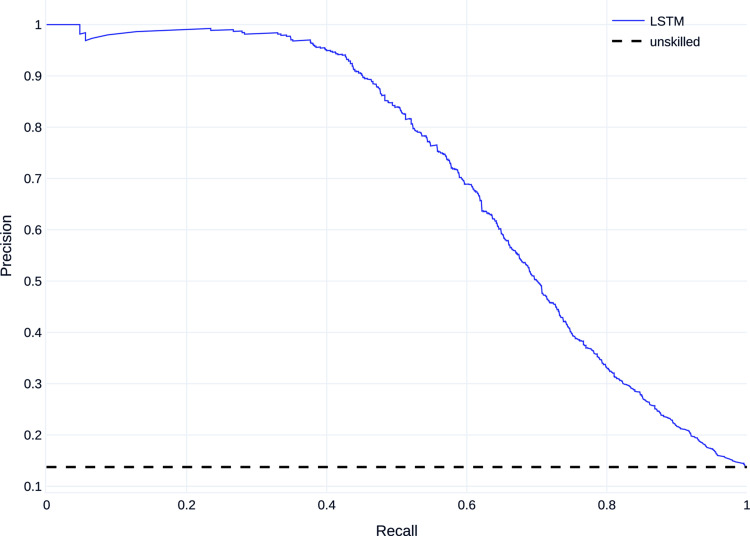
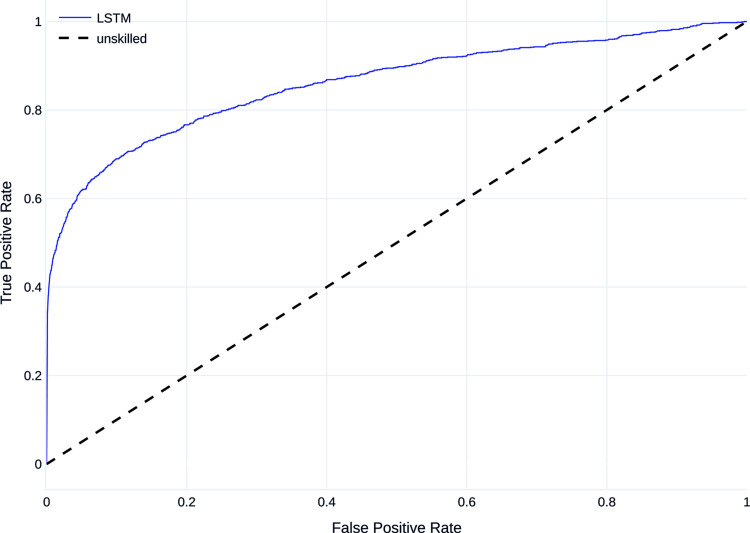
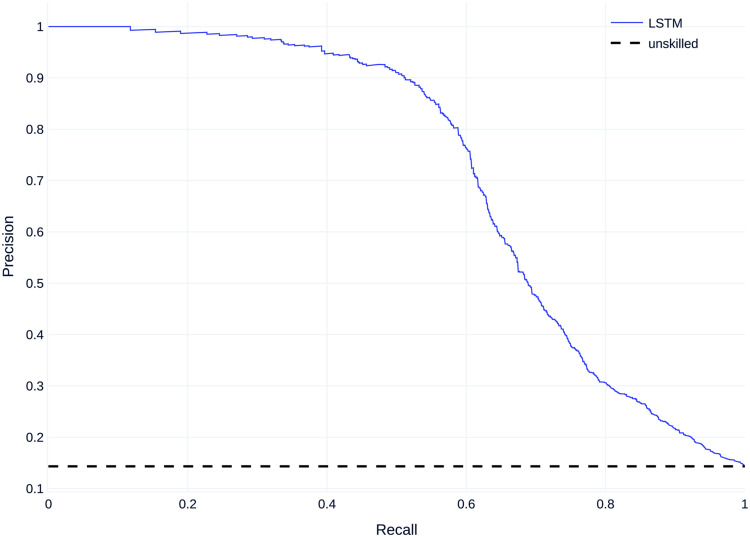
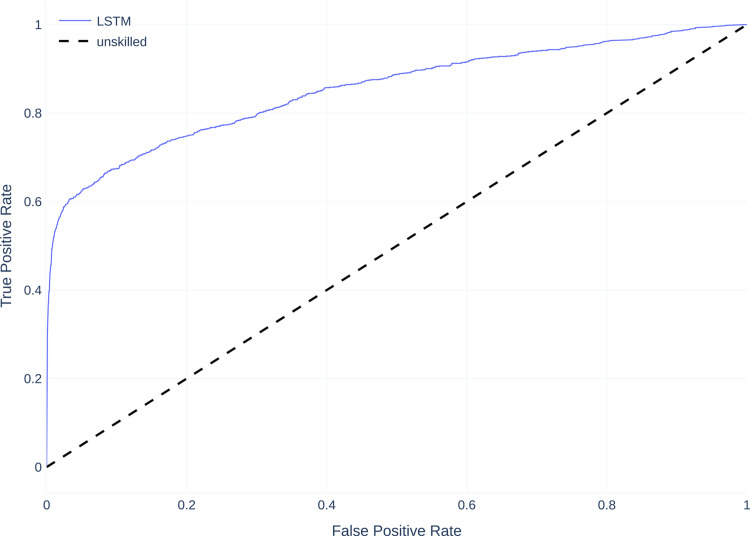
Figures 7 and 8 show the mean PR curve and ROC curve of the LSTM trained and evaluated on dataset B, with the PR curve showing good detection, especially of the majority class and both curves being above the curve of the unskilled classifier.
Figure 7.
Precision–recall (PR) curve on dataset B.
Figure 8.
Receiver operating characteristic curve (ROC curve) on dataset B.
A model trained on data from all ICUs was also evaluated on test set that only consists of patients from the CCU and CSRU. PR and ROC curvess are shown in Figures 9 and 10. The area under the curve is 0.716 for the PR curve and 0.853 for the ROC curve.
Figure 9.
PR curve for evaluation on heart-related ICUs. ICU: intensive care unit; PR: precision–recall.
Figure 10.
ROC curve for evaluation on heart-related ICUs. ICUs: intensive care units; ROC: receiver operating characteristic.
Direct comparison of LSTM and LR
As the LSTM was shown to be the superior method, we further analyzed how the LSTM and LR models performed on cases from the held-out test set: out of 2560 cases in the test cohort, 1791 cases were predicted correctly by both of the classifiers. The number of cases for which the LSTM model predicted correctly while the LR predicted incorrectly was 405. The number of cases for which the LR model predicted correctly while the LSTM predicted incorrectly was 106.
Feature importances
As described in the methods section, to provide a simplified declaration about how the random forest model has made its conclusion, the most relevant features are shown in the diagram in Figure 11.
Figure 11.
Most relevant features used by the random forest classifier.
Discussion
In this study, we presented an LSTM-based deep learning model to assist intensivists in making decisions if patients can be discharged from cardiovascular intensive care units, which has been shown to outperform comparable models. Despite the fact that RF and ET have the same or similar AUCROC compared to our LSTM, the LSTM model provides a higher precision (Figure 5), that leads to a higher AUCPR (Table 6). In the context of these observations, the LSTM performs better than all alternative models such as decision tree-based models. This indicates that the class label depends on non-linear relations of the input data and its temporal structure so classifiers that are able to detect those perform better.
Table 5 shows that the balanced accuracy is slightly higher than the recall, so the true negative rate is higher than the true positive rate. This indicates that although the models have a bias for the majority class, it is smaller than it would be without oversampling the training data.
Using the optimized decision threshold decreases recall and increases precision for all models with only a small decrease for the balanced accuracy. While the optimized threshold results in a better compromise between recall and precision, indicated by the F1 score, there is no strictly optimal threshold that results in the correct classification of all cases. Therefore, the threshold in a practical application should be chosen depending on whether an intensivist is more likely to need assistance in correctly identifying transferable or non-transferable patients.
Using patient data from all ICUs instead of focusing on cardiovascular ICUs improves AUCROC and AUCPR (Table 7). The advantages of using the complete dataset are a higher amount of data available for training and a less skewed dataset, so results of the models trained on heart-related ICU data could be further improved by using larger datasets.
A model trained on data from all ICUs performs better than the model trained on data from heart-related ICUs when both are evaluated on data from heart-related ICUs. This indicates that a model trained on all data from one hospital could be used on specific units of the hospital, even if there is some difference in data on different units. However, as acquiring real patient data from multiple departments, even within the same hospital would result in complications, mostly caused by data protection protocols, the feasibility of training such a model remains still in question. Therefore, for this study, we compared the performance of the models trained with data from cardiovascular care units together.
The resulting LSTM model is compared to the best performing model of the study of Lin et al.,7 which uses more input features and a bi-directional LSTM which also utilizes convolutions. While the preprocessing and labeling processes are different, the main goals of this study and the study by Lin et al. are similar and so the results are comparable.
While the LSTM and the choice of features in this work are aimed at transferring cardiac patients, it provides better results than the models of Lin et al. The comparison of the results with LSTM+CNN (Table 7) also shows that the choice of features and the preprocessing has a greater influence on the performance of a deep learning model than the number of features or the complexity of the model.
In order to realize the use of the LSTM model presented in this study in a clinical context, explainability and improved performance is necessary. The explainability of the machine and deep learning models not only help to make the models more reliable and to draw accurate conclusions about the patient’s condition, but may also be a legal necessity.29 However, the explainability of deep learning models is one of the current research areas, and there is currently no established method for an accurate and widely accepted explanation of the classification results. Also, since intensivists decisions depend on the performance of the model, its accuracy should still be significantly increased which might be achieved with dedicated and high-resolution data, the next step in our work.
Promising results for the explainability of black box models are provided by methods like LIME30 and SHAP.31 Based on these methods, the next steps will be to explore the possibility of explaining the results of LSTM-based models. For the current study, we used feature importance metric of the random forest model to identify the most relevant features for this classifier to decide on the target label. The results are shown in Figure 11. However, analyzing the parameter importance for the LSTM model is a out of focus for this current study. Nevertheless, state-of-the-art ML models for time-series analysis, such as LSTM are capable of investigating hidden non-linear patterns in the data which might make them superior even to experienced domain experts. Thus, as part of our future work, we plan to conduct empirical studies comparing performance of the proposed model to that of domain experts. Another possible way to improve performance might be utilizing state-of-the-art models such as residual networks32 which have shown to achieve good results for multivariate time-series classification and prediction.33 This study has further limitations. One of them is that the comparison with the models of Lin et al. is vague based only on the AUCROC. As mentioned earlier, AUROC does not perform well on an unbalanced dataset. Unfortunately, Lin et al. do not present other metrics for a better comparison with our models. Another aspect is the relationship between precision and recall. As the results show, an increase of precision reduces recall and vice versa. Contextually, a decreasing precision means that the number of false alarms of the model increases. Decreasing recall, on the other hand, means that the number of patients for whom the model falsely predicts that they would be successfully transferred from the ICU, increases. In a practical application, both cases are disadvantageous and should be avoided if possible. Finally, the improvement of AUCROC and AUCPR by using patient data from all ICUs should be explored empirically. In this context, in addition to a larger dataset, the results for cardiovascular ICU could be further improved by an even more specific feature selection.
To conclude, the current study was aimed at analyzing the overall relevance of an established method for time-series data analysis (LSTM) on an open access dataset (MIMIC-III) to provide a proof of concept for further follow-ups. Therefore, evaluating the proposed model on an independent cardiovascular cohort, which is an important step toward establishing a new tool for clinical decision support, is the motivation behind an upcoming study of ours. Furthermore as proposed in the related work,34 in the future, we consider natural language processing (NLP) approaches for readmission prediction based on patients’ electronic health records (EHRs) and treatment reports during their stays at ICUs. This will require extra preprocessing steps as our datasets of patient records feature bilingual texts.
Nonetheless, the use of a system based on machine or deep learning methods to support the intensivists in making decisions regarding the discharge of a patient from the ICU has some important clinical implications. In fact, the additional information provided by the system makes it possible to analyze the patient’s health condition systematically and in a rapid fashion. Faster analysis allows rapid and flexible allocation of patients to the ICU, which remains a scarce resource. Additionally, optimization of the timing of patient discharge from the ICU may help to reduce patient readmissions. Hence LSTM-based decision making in this context, may not only help to increase the quality of patient care, but may also help to reduce costs and to optimize ICU resources.
Acknowledgements
The authors would like to thank Susanne Bunnenberg Herzstiftung for their general support.
Footnotes
Contributership: HA and FS conceived the study. HA, AL, and VH provided the medical expertise. SKe and DS preprocessed the data, selected the classification methods and developed the classifiers. SKo carried out the machine learning related guidance and supervision. SKe and SKo wrote the first draft of the manuscript. HA, FS and AL contributed substantially to the manuscript. SKa and SM conceptualized the revised manuscript. SKe, SKa and SM contributed substantially to the revised version of the manuscript in model selection, data processing, writing, and revising. SKo reviewed and corrected the manuscript during the final review. All authors reviewed and approved the (re-)submitted version of the manuscript.
The authors declared no potential conflicts of interest with respect to the research, authorship, and/or publication of this article.
Ethical approval: Ethical approval is not required.
Funding: The authors disclosed receipt of the following financial support for the research, authorship, and/or publication of this article: This work was supported by the Federal Ministry of Education and Research of Germany [grant number 16SV8601].
Guarantor: Falko Schmid
ORCID iDs: Sergej Korlakov https://orcid.org/0000-0001-5690-199X
Hug Aubin https://orcid.org/0000-0001-9289-8927
References
- 1.Angelo SA, Arruda EF, Goldwasser R. et al. Demand forecast and optimal planning of intensive care unit (ICU) capacity. Pesqui Operacional 2017; 37: 229–245. [Google Scholar]
- 2.Franklin C, Jackson D. Discharge decision-making in a medical icu: characteristics of unexpected readmissions. Crit Care Med 1983; 11: 61–66. [DOI] [PubMed] [Google Scholar]
- 3.Baigelman W, Katz R, Geary G. Patient readmission to critical care units during the same hospitalization at a community teaching hospital. Intens Care Med 1983; 95): : 253–256. [DOI] [PubMed] [Google Scholar]
- 4.Snow N, Bergin KT, Horrigan TP. Readmission of patients to the surgical intensive care unit: patient profiles and possibilities for prevention. Crit Care Med 1985; 1311): : 961–964. [DOI] [PubMed] [Google Scholar]
- 5.Rosenberg AL, Hofer TP, Hayward RA. et al. Who bounces back? Physiologic and other predictors of intensive care unit readmission. Crit Care Med 2001; 293): : 511–518. [DOI] [PubMed] [Google Scholar]
- 6.Elliott M. Readmission to intensive care: a review of the literature. Aust Crit Care 2006; 193): : 96–104. [DOI] [PubMed] [Google Scholar]
- 7.Lin YW, Zhou Y, Faghri F. et al. Analysis and prediction of unplanned intensive care unit readmission using recurrent neural networks with long short-term memory. PLoS ONE 2019; 147): : e0218942. [DOI] [PMC free article] [PubMed] [Google Scholar]
- 8.Azarfarin R, Ashouri N, Totonchi Z. et al. Factors influencing prolonged ICU stay after open heart surgery. Res Cardiovasc Med 2014; 34): : 2. [DOI] [PMC free article] [PubMed] [Google Scholar]
- 9.Almashrafi A, Elmontsri M, Aylin P. Systematic review of factors influencing length of stay in ICU after adult cardiac surgery. BMC Health Serv Res 2016; 161): : 318. [DOI] [PMC free article] [PubMed] [Google Scholar]
- 10.Rafi P, Pakbin A, Pentyala SK. Interpretable deep learning framework for predicting all-cause 30-day icu readmissions.
- 11.Wang H, Cui Z, Chen Y. et al. Predicting hospital readmission via cost-sensitive deep learning. IEEE/ACM Trans Comput Biol Bioinf 2018; 156): : 1968–1978. [DOI] [PubMed] [Google Scholar]
- 12.Spiga R, Batton-Hubert M, Sarazin M. Predicting hospital admissions with integer-valued time series. International Conference on Time Series and Forecasting, ITISE 2019, 2019. https://hal-emse.ccsd.cnrs.fr/emse-02301132. Poster.
- 13.Desautels T, Das R, Calvert J. et al. Prediction of early unplanned intensive care unit readmission in a UK tertiary care hospital: a cross-sectional machine learning approach. BMJ Open 2017; 7: DOI: 10.1136/bmjopen-2017-017199. https://bmjopen.bmj.com/content/7/9/e017199.full.pdf. [DOI] [PMC free article] [PubMed] [Google Scholar]
- 14.Huang Y, Talwar A, Chatterjee S. et al. Application of machine learning in predicting hospital readmissions: a scoping review of the literature. BMC Med Res Methodol 2021; 211): : 96. [DOI] [PMC free article] [PubMed] [Google Scholar]
- 15.Ashfaq A, Sant-Anna A, Lingman M. et al. Readmission prediction using deep learning on electronic health records. J Biomed Inform 2019; 97: 103256. DOI: 10.1016/j.jbi.2019.103256. https://www.sciencedirect.com/science/article/pii/S1532046419. [DOI] [PubMed] [Google Scholar]
- 16.Johnson AEW, Pollard TJ, Shen L. et al. MIMIC-III, a freely accessible critical care database. Sci Data 2016; 3160035): : 1–9. [DOI] [PMC free article] [PubMed] [Google Scholar]
- 17.Bauder RA, Khoshgoftaar TM, Hasanin T. An Empirical Study on Class Rarity in Big Data. In: 2018 17th IEEE International Conference on Machine Learning and Applications (ICMLA). IEEE, 2018. pp. 785–790. doi:10.1109/ICMLA.2018.00125.
- 18.Lemeshow S, Teres D, Pastides H. et al. A method for predicting survival and mortality of ICU patients using objectively derived weights. Crit Care Med 1985; 137): : 519–525. [DOI] [PubMed] [Google Scholar]
- 19.Nguile-Makao M, Zahar JR, Français A. et al. Attributable mortality of ventilator-associated pneumonia: respective impact of main characteristics at ICU admission and VAP onset using conditional logistic regression and multi-state models. Intens Care Med 2010; 365): : 781–789. [DOI] [PubMed] [Google Scholar]
- 20.Schmidhuber J. Deep learning in neural networks: an overview. Neural Netw 2015; 61: 85–117. [DOI] [PubMed] [Google Scholar]
- 21.Kingma DP, Ba J. Adam: A Method for Stochastic Optimization. arXiv 2014; 1412.6980.
- 22.Breiman L. Random forests. Mach Learn 2001; 451): : 5–32. [Google Scholar]
- 23.Geurts P, Ernst D, Wehenkel L. Extremely randomized trees. Mach Learn 2006; 631): : 3–42. [Google Scholar]
- 24.Loshchilov I, Hutter F. Decoupled Weight Decay Regularization. arXiv 2017; 1711.05101.
- 25.Zhang P. Model selection via multifold cross validation. Ann Stat 1993; 211): : 299–313. [Google Scholar]
- 26.Menze BH, Kelm BM, Masuch R. et al. A comparison of random forest and its gini importance with standard chemometric methods for the feature selection and classification of spectral data. BMC Bioinformatics 2009; 101): : 213. [DOI] [PMC free article] [PubMed] [Google Scholar]
- 27.Fawcett T. An introduction to ROC analysis. Pattern Recognit Lett 2006; 278): : 861–874. ROC Analysis in Pattern Recognition. [Google Scholar]
- 28.Saito T, Rehmsmeier M. The precision-Recall DIFdelPplot is more informative Than the ROC plot when evaluating binary classifiers on imbalanced datasets. PLoS ONE 2015; 103): : e0118432. [DOI] [PMC free article] [PubMed] [Google Scholar]
- 29.Selbst AD, Powles J. Meaningful information and the right to explanation. Int Data Privacy Law 2017; 74): : 233–242. [Google Scholar]
- 30.Ribeiro MT, Singh S, Guestrin C. “why should i trust you?”: explaining the predictions of any classifier, 2016. 1602.04938.
- 31.Schlegel U, Arnout H, El-Assady M. et al. Towards a rigorous evaluation of xai methods on time series, 2019. 1909.07082.
- 32.Wang Z, Yan W, Oates T. Time series classification from scratch with deep neural networks: a strong baseline. ResearchGate 2017; 1578–1585. DOI: 10.1109/IJCNN.2017.7966039. [DOI] [Google Scholar]
- 33.Fawaz HI, Forestier G, Weber J. et al. Deep learning for time series classification: a review. arXiv 2018; doi:10.1007/s10618-019-00619-1. 1809.04356.
- 34.Huang K, Altosaar J, Ranganath R. Clinicalbert: modeling clinical notes and predicting hospital readmission, 2019. doi:10.48550/ARXIV.1904.05342. https://arxiv.org/abs/1904.05342.


