Abstract
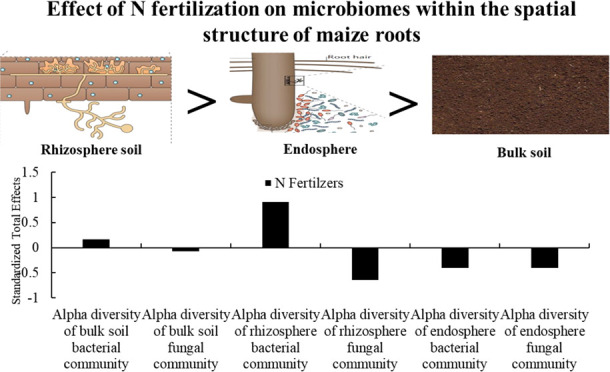
The beneficial interactions between crop roots and microbiomes play a key role in crop nutrient availability, growth promotion, and disease suppression. Recent research, however, rarely reported the effects of nitrogen (N) application rate on microbial community composition at different spatial structures in the maize root zone. Therefore, one experiment was conducted to examine the influence of three N-application levels (0, 180, and 360 kg N ha–1) on microbial community composition in three root-associated compartments of maize (bulk soil, rhizoplane, and endosphere). The microbial diversity and community composition differed significantly among the various compartments. The effects of N application on fungal composition decreased in the order bulk soil > rhizosphere > endosphere at different sampling positions. Also, the fungal composition was more sensitive to the N-fertilizer rate in the bulk soil and the rhizosphere than the bacterial community. A total of 14.42, 9.46, and 3.55% of all taxonomic groups were sensitive to N fertilizer, respectively. The keystone species fungal groups were Humicola (bulk soil), Gibberella (rhizosphere soil), and Humicola (endosphere). Together, our results demonstrate that compared with that of the bacterial community, the fungal community composition was more susceptible to different N-application rates. N fertilization affected the distribution of microflora by changing soil physicochemical properties and enzyme activities. There were strong correlations between microbial communities in maize under the N180 treatment. Moreover, the N180 treatment had the maximum fresh yield and biomass at 64.5 and 24.3 kg·ha–1, respectively.
1. Introduction
Maize (Zea mays L.) is the largest food crop in the world,1 widely used in food, feedstuff, and so on.2 Application fertilization is one of the important agricultural measures to increase soil quality and sustainable utilization.3 Proper nitrogen (N) application has a positive effect on maintaining the soil nutrients and improving the soil environment, thus increasing maize yield.4 In practice, to pursue higher crop yield, modern agriculture generally uses increased fertilizer application.5 However, intensive application of N fertilizers has proved less unsustainable, which leads to soil hardening, acidification, biodiversity losses, and a decrease in crop quality.6 Therefore, the reduction of N-fertilizer inputs is very important for soil, environment, and sustainable maize production.
The soil microbial community has several important roles in plant growth, yield production, and the decomposition of various compounds and other transformations.7 In practice, higher soil microbial diversity can increase soil fertility and maintain soil nutrient balance, thus affecting the growth of maize and increasing the maize yield.8 As an indicator to evaluate soil biological quality and health,9 microbial community structure is affected by a variety of biotic and abiotic factors.10 Fertilization alters plant dependence on increasing resources by increasing soil nutrients.11,12 It has been shown that, with the increasing N-application rate, the abundance of bulk soil microbial diversity decreased and the rhizosphere bacteria diversity increased,6 and microbial diversity and beneficial function microorganisms reduced under higher N rates.12,13 Long-term excess chemical fertilizer input is unsustainable.14 In the long term, repeated fertilization may cause some microorganisms to proliferate and others to become suppressed. Previous studies on the effects of N-fertilizer application on soil microbial composition have found that due to completely different climatic conditions and soil types, N fertilizer has different effects on the composition of the soil microbial community.15 For example, Böhme et al.16 found that the abundance of fungal communities in two long-term Europe field experiments increased after the application of N fertilizer; however, in a Swedish study, the fungal community abundance decreased after N application.17
Microorganisms are widely parasitic or symbiotic or contend among other relationships with plants and animals, and the role of the symbiont in host adaptation is the interaction with the host and then spreading to the host.18 Microbes form mutually beneficial associations with plants through parasitic or symbiotic relationship.19 Bulk soil, rhizosphere, and endophytic environment provide multiple microenvironments. Microbes are preferentially enriched at specific microenvironments by recognizing the signal molecules, and other microbes are filtered out.20,21 Also, these microbes change with biotic and abiotic factors.22 However, compared to other spatial structure microbes, endophytic microbes have an ecological advantage in that they are not affected by adverse external abiotic stresses such as temperature, drought, pH, and osmotic potential. They are more affected by different plant types and varieties.23 Roots and rhizosphere and bulk soil microbes’ beneficial interactions can obtain nutrients for plant growth promotion and disease suppression.24
Microbial communities can provide nutrients to plants by driving the decomposition and mineralization of plant residues, fertilizers, and other substances.25 Plant roots can affect the composition of microbial communities through root secretions.12,26 One study showed that compared to fertilization practice, the spatial structure directly affected the microbial community composition of silage maize roots, and the effect on the diversity of bacteria was gradually dismissed from bulk soil to the endophytic environment.12 Li et al.5 have reported that Astragalus mongholicus rhizosphere microorganisms were more sensitive than bulk soil and endosphere. Fertilization will affect the bulk soil, rhizosphere, and endosphere community composition.27 Although the microbial community structure composition on soil has been widely discussed, the effects of N fertilization on entire maize soil–root spatial structure microbiomes are not understood in detail.
In the current study, the response of bacterial and fungal communities in the different spatial structures of the root system of maize to N fertilization and to disentangle the role of key microbial taxa under N fertilization was determined. Therefore, we measured soil properties, enzyme activities, and maize yield and examined the bacterial and fungal community structures (using 16SrRNA and ITS) in different spatial structures under three N fertilization rates. We hypothesized that (1) N fertilization increased microbial community diversity, with the extent of change depending on the N-fertilizer application rate, and (2) the effects of N fertilization on the bacterial community diversity showed the trend of bulk soil > rhizosphere > endophytic environment.
2. Materials and Methods
The experimental design, sample collection, testing, and statistical analysis method of this study have been described in detail in the Supporting Information.
3. Results
3.1. Yield
N application had significant effects on maize fresh yield and biomass. The fresh yield and biomass under N fertilization (N180 and N360) were higher than those of N0. The N180 treatment had the maximum fresh yield and biomass at 64.5 and 24.3 kg·ha–1, respectively (Table 1).
Table 1. Effects of Different N-Application Rates on Fresh Yield and Biomass of Maizea.
| treatment | fresh yield (Mg·ha–1) | biomass (Mg·ha–1) |
|---|---|---|
| N0 | 53.4 ± 8.7B | 21.6 ± 2.2B |
| N180 | 64.5 ± 1.9A | 24.3 ± 0.7A |
| N360 | 63.2 ± 4.0A | 22.6 ± 0.2B |
| N | <0.001 | <0.05 |
Data are presented as means ± standard deviations. Different uppercase letters indicate significant differences among treatments (P < 0.05). The same as below.
3.2. Soil Physicochemical Properties
The N-application impact dramatically affects soil’s physicochemical properties, in addition to total phosphorus (TP), total carbon (TC), and total potassium (TK) contents, alkaline phosphatase activity (APA), and invertase activity (IA) (P < 0.05) (Table 2). The APA and IA under N fertilization (N180 and N360) were above those in N0 (Table 2), and there was an increase with the increased N-application level. Under the N360 treatment, APA and IA showed maximal activity, which was 0.19 and 61.21 mg g–1·24 h–1, respectively. Under the N180 treatment, the maximum UA activity was 3.68 mg g–1·24 h–1, which was 15.36 and 70.37% higher than those under N0 and N360, respectively (P < 0.05). The hydrogen peroxidase activity (HPA) showed an initial decline, followed by an increase to a maximum of 43.30 mg g–1·20 min–1 in N360, which was 1.08% higher than that in N180 (P < 0.05).
Table 2. Bulk Soil Physicochemical Properties and Soil Enzyme Activity of Fertilization Treatment in the Field Experimenta.
| soil property | N0 | N180 | N360 | P | F |
|---|---|---|---|---|---|
| pH | 8.96 ± 0.02A | 8.91 ± 0.01B | 8.95 ± 0.02A | 0.02 | 6.89 |
| TP (g kg–1) | 0.33 ± 0.14A | 0.43 ± 0.01A | 0.44 ± 0.05A | 0.31 | 1.33 |
| AP (mg kg–1) | 2.78 ± 0.08B | 9.85 ± 0.42A | 9.47 ± 4.59A | 0.02 | 6.69 |
| TC (g kg–1) | 22.48 ± 1.30A | 23.45 ± 0.42A | 22.63 ± 0.74A | 0.40 | 1.02 |
| SOC (g kg–1) | 8.89 ± 0.11B | 9.82 ± 0.20A | 8.89 ± 0.05B | <0.01 | 49.94 |
| OM (g kg–1) | 15.32 ± 0.19B | 16.93 ± 0.34A | 15.32 ± 0.09B | <0.01 | 49.00 |
| TK (g kg–1) | 0.27 ± 0.01B | 0.28 ± 0.00AB | 0.28 ± 0.00A | 0.08 | 3.50 |
| AK (mg kg–1) | 30.23 ± 0.74C | 36.07 ± 1.12A | 33.84 ± 0.74B | <0.01 | 33.45 |
| TN (mg g–1) | 0.13 ± 0.00C | 0.15 ± 0.00B | 0.22 ± 0.01A | <0.01 | 94.33 |
| AN (mg kg–1) | 30.23 ± 2.86B | 46.67 ± 2.86A | 42.00 ± 8.57A | 0.01 | 7.09 |
| HPA (ml g–1·20 min–1) | 42.20 ± 0.11A | 41.85 ± 0.04B | 42.30 ± 0.18A | <0.01 | 10.10 |
| APA (mg g –1·24 h–1) | 0.12 ± 0.02A | 0.13 ± 0.00A | 0.19 ± 0.07A | 0.14 | 2.50 |
| IA (mg g –1·24 h–1) | 55.19 ± 3.54A | 58.28 ± 0.34A | 61.21 ± 8.05A | 0.39 | 1.06 |
| UA (mg g –1·24 h–1) | 3.19 ± 0.12B | 3.68 ± 0.04A | 2.16 ± 0.18C | <0.01 | 30.33 |
TP: total phosphorus; AP: available phosphorus; TC: total carbon; SOC: soil organic carbon; OM: organic matter; TK: total content of potassium; AK: available potassium; TN: total nitrogen; AN: alkali nitrogen; HPA: hydrogen peroxidase activity; APA: alkaline phosphatase activity; IA: invertase activity; UA: urease activity; data are presented as means ± standard deviations. Different letters in each row indicate significant differences based on one-way ANOVA (P < 0.05). The same as below.
The AP, OM, SOC, AN, AK, and TC contents are in the order N180 > N360 > N0. The soil of the experiment area was alkaline; N180 had a minimum pH of 8.91. The TN content increased as the N-application level increased, with a maximum value in N360, which was 69.23% higher than that in N0 and 46.67% more than that in N180 (P < 0.05) (Table 2).
3.3. α-Diversity
A total of 623,124 high-quality raw 16S rDNA and 2,190,423 raw ITS sequences were obtained from 72 samples. Two thousand five hundred forty-eight bacterial OTUs and 2462 fungal OTUs were clustered from 166,896 and 1,116,612 sequences (the least number sequences of the whole sample), respectively, which were the optimized sequence extraction (cutoff at 97%) before clustering. The average lengths of bacterial OTUs and fungal OTUs were 395.51 and 252.64 bp, respectively.
The rarefaction curves of each sample gradually reached a plateau (Figure S1), indicating that the next step of data analysis could be carried out. Spatial structures led to significant changes in bacterial and fungal communities’ α-diversity (P < 0.01) (Table 3). Except for N0, the variation trend of α-diversity of fungal community was rhizosphere soil > bulk soil > endosphere fungi, and the α-diversity of bacterial and fungal communities decreased in the order bulk soil > rhizosphere soil > endophytic environment at different sampling positions. N-fertilizer treatments induced significant (P < 0.01) changes in the Shannon index of the bacterial community in bulk soil, rhizosphere, and fungi community in the rhizosphere (Table 3). There was the highest α-diversity among bacteria samples from the bulk soil (5.89) and rhizosphere soil (5.75) and the lowest diversity index among fungi samples from the bulk soil (4.18) and rhizosphere soil (4.11) under the N360 treatment (Table S3 and Figure S2A–E). Endosphere bacterial and endosphere fungal diversity indexes had the highest α-diversity under the N180 treatment (Table S3 and Figure S2C,F).
Table 3. Effects of N-Application Rate on the Changes in the α-Diversity (Shannon Index) of Bacterial and Fungal Communities Based on the Univariate Linear Model (ULM).
| source of variation | traits | P | F |
|---|---|---|---|
| fertilization | bacterial community | 0.28 | 1.33 |
| fungal community | 0.10 | 2.50 | |
| spatial structure | bacterial community | <0.01 | 130.41 |
| fungal community | <0.01 | 11.61 | |
| fertilization × spatial structure | bacterial community | <0.01 | 4.74 |
| fungal community | 0.30 | 1.29 |
3.4. β-Diversity and Community Structure
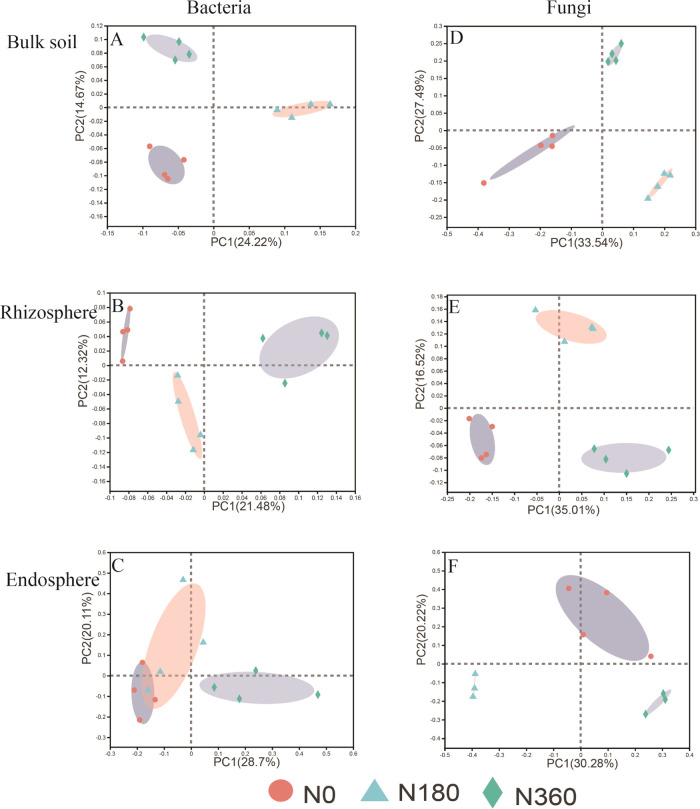
The spatial structure affected the bacterial and fungal community structures (Figure S3A,B). Compared with the bacteria community composition, the fungi community was more discrete (Figure 1A–E), which indicates that the N treatment has a greater effect on the composition of every compartment of fungi compared to bacteria. According to permutational multivariate analysis of variance (PERMANOVA) analysis, the spatial structure and N fertilization led to significant changes in the composition of bacterial and fungal communities, and the effect of N fertilizer on fungal communities gradually decreased with closer proximity to the plant. In addition, N fertilizer had a strong effect on the bulk soil (R2 = 0.58) and rhizosphere (R2 = 0.48) fungal communities’ composition. The endosphere bacterial communities (R2 = 0.34) were more affected by N fertilizer than the fungal communities (R2 = 0.31) (Table 4).
Figure 1.
β-Diversity of bacterial (A–C) and fungal (D–F) communities in corn under bulk soil, rhizosphere, and endosphere, visualized by principal coordinates analysis (PCoA) based on Bray–Curtis distance metrics at the OTU level. Three nitrogen fertilization treatments were 0 (N0), 180 (N180), and 360 (N360) kg N ha –1.
Table 4. Effects of N-Application Rate on the Changes of Bacterial, Fungal Composition Based on PERMANOVA.
| type | P | R2 | |
|---|---|---|---|
| bulk soil | bacterial community | <0.01 | 0.38 |
| fungal community | <0.01 | 0.58 | |
| rhizosphere | bacterial community | <0.01 | 0.32 |
| fungal community | <0.01 | 0.48 | |
| endosphere | bacterial community | <0.01 | 0.34 |
| fungal community | <0.01 | 0.31 | |
| fertilization | bacterial community | <0.01 | 0.73 |
| fungal community | <0.01 | 0.63 | |
| spatial structure | bacterial community | <0.01 | 0.59 |
| fungal community | <0.01 | 0.40 | |
| fertilization × spatial structure | bacterial community | 0.54 | 0.05 |
| fungal community | 0.11 | 0.08 |
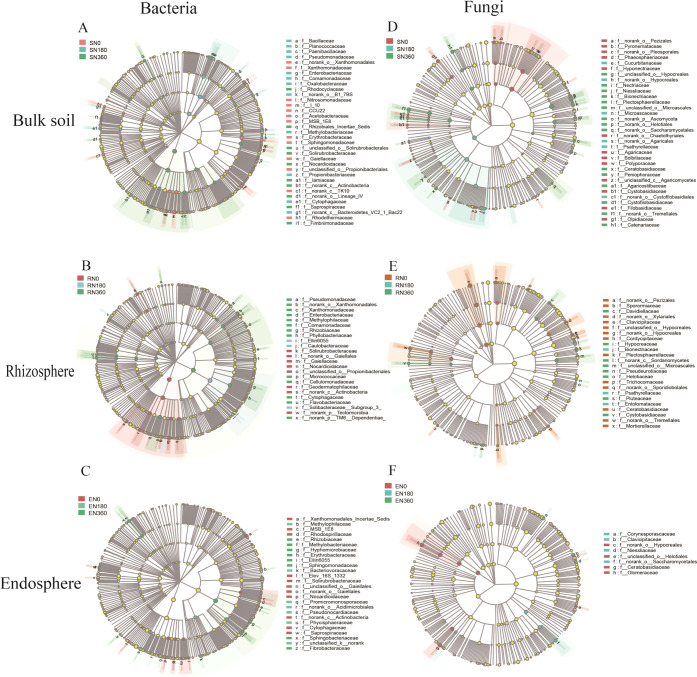
The linear discriminant analysis (LDA) effect size (LEfSe) identified 67 at 8 phylum levels in bulk soil (10.81% of the retrieved taxonomic), 52 at 6 phylum levels in rhizosphere soil (8.39% of the retrieved taxonomic), and 44 at 6 phylum levels in endosphere bacteria (7.28% of the retrieved taxonomic), respectively, that were the most significant biomarker taxa (Figure 2A–C). There were 61 at 4 phylum levels in bulk soil (14.42% of the retrieved taxonomic), 40 at 3 phylum levels in rhizosphere soil (9.46% of the retrieved taxonomic), 15 at 3 phylum levels in endosphere fungi (3.55% of the retrieved taxonomic) that were sensitive to N treatment (Figure 2D–F).
Figure 2.
LEfSe results of bacterial (A–C) and fungal (D–F) communities (LDA = 2) that are sensitive to three nitrogen fertilizers including 0 (N0), 180 (N180), and 360 (N360) kg N ha–1. The four circular rings represent phylum, class, order, and family, respectively, from inside to outside. The node on the circular ring represents a taxon, which belongs to the taxonomic level. The different color nodes represent microbial populations that are significantly enriched in different treatments and have significant effects on differences between groups. The pale yellow nodes represent microbial populations that are not significantly different in different groups.
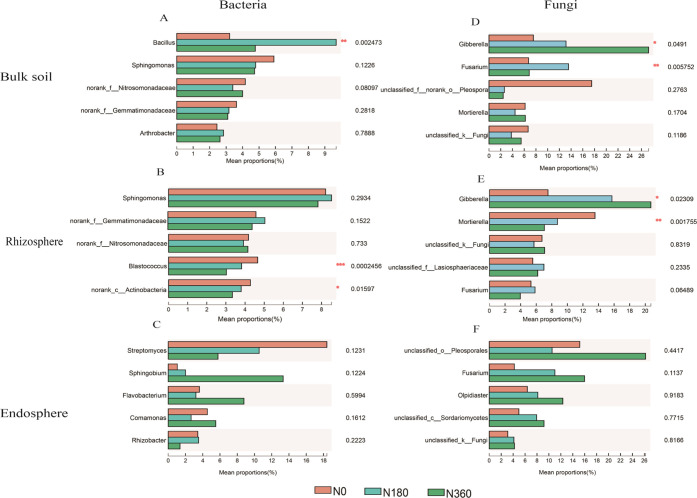
N-fertilizer impact dramatically affects the microbial community composition of the whole root spatial structure. The three most abundant bacteria detected in the whole root spatial structure (1.44–64.59%) were Proteobacteria, Actinobacteria, and Firmicutes (Figure S4A–C). The two most abundant fungi detected in the whole root spatial structure (3.98–81.01%) were Ascomycota and Basidiomycota (Figure S4D–F). The most abundant bacterial genera were Bacillus (3.22–9.69%) in bulk soil, Sphingomonas (7.81–8.52%) in rhizosphere soil, and Streptomyces (5.76–18.39%) in the endophytic environment, respectively. N-fertilizer impact dramatically affects the abundance of Bacillus in bulk soil, Blastococcus, and no rank_c__Actinobacteria in rhizosphere soil (Figure 3A–C). The most abundant fungi genera were Gibberella (7.57–27.22%) in bulk soi, Gibberella (7.51–20.73%) in rhizosphere soil, and unclassified-o-Pleosporales (15.17–26.20%) in the endophytic environment, respectively. In addition, N fertilizer caused a significant change in the abundance of Gibberella and Fusarium in the bulk soil and Gibberella and Motierella in the rhizosphere soil (Figure 3D–F).
Figure 3.
Statistical comparison of the relative abundance among the three nitrogen fertilizers including 0 (N0), 180 (N180), and 360 (N360) kg N ha –1. Comparison of the dominant genus in the bacterial (A–C) and fungal (D–F) communities. Statistical analysis was performed by the one-way ANOVA test. n = 12, in each group (*P < 0.05, **P < 0.01, and ***P ≤ 0.001).
3.5. Correlation Analysis between Environmental Factors and Microbial Communities
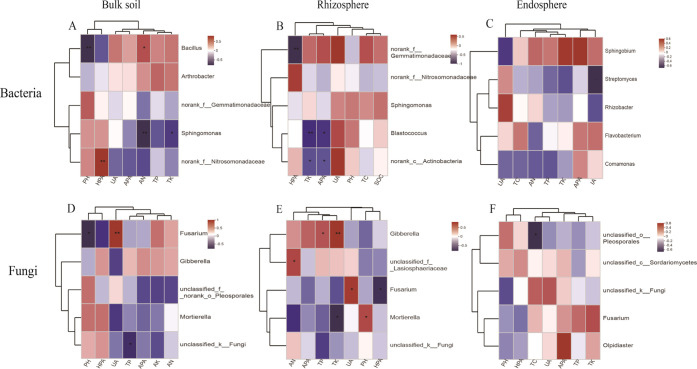
Correlation analysis between abundant genera (top five bacterial and fungal genera in abundance) and environmental factors of Spearman’s coefficients is shown in Figure 4. Bacillus correlated significantly with pH and AN content, Sphingomonas correlated significantly with AN and TK contents, and no rank-f-Nitrosomonadaceae correlated significantly with HPA in bulk soil. Blastococcus and no rank-C-Actinobacteria correlated significantly with the TK content and APA in the rhizosphere. Fusarium correlated significantly with UA and unclassified-k-Fungi with TP in the bulk soil. Gibberella correlated significantly with TP and TK contents and unclassified-k-Lasiosphaeriaceae with the AN content, Fusarium with UA and CAT, and Mortierella with TK content and pH in the rhizosphere.
Figure 4.
Three nitrogen fertilization treatment (0 (N0), 180 (N180), and 360 (N360) kg N ha –1) correlation heatmaps showing the corn soil chemical variable in bacterial (A–C) and fungal (D–F) genus communities of a microbial classification relationship with the environmental variable, R-value, to show different colors in the picture (*P < 0.05, **P < 0.01, and ***P ≤ 0.001).
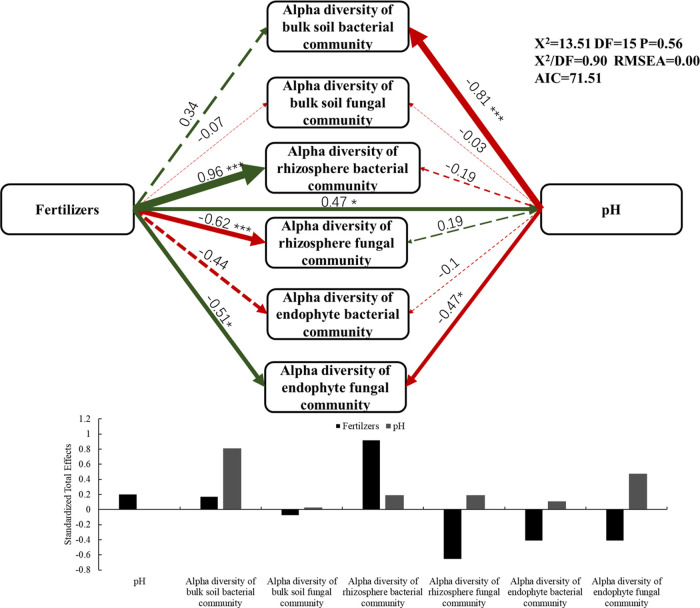
To better assess the direct and indirect effects among spatial structure, microbial α-diversity (Shannon index), fertilizers, and soil enzyme activity, we created a structural equation model (SEM) (Figure 5). N fertilization had a great influence on the diversity of microorganisms in rhizosphere soil. Fertilization directly affected the soil pH (0.47), and pH greatly affected the bulk soil bacterial community diversity (−0.81) and the endosphere fungal community diversity (0.47). Compared to that in the bulk soil, the microbial diversity in the rhizosphere soil and the endophytic environment was more affected by N fertilizer. Fertilization significantly affects the Shannon index of the rhizosphere bacterial and fungal communities (−0.96, and −0.62, respectively) and the endosphere fungal community (−0.51). N fertilization had a greater influence on the fungal community (−0.51) than the bacterial community (−0.44) in the endophytic environment.
Figure 5.
Structural equation model (SEM) illustrating the direct and indirect effects of nitrogen fertilizers on pH and α-diversity of the bacterial and fungal communities of soil, rhizosphere, and endosphere. Significant and nonsignificant relationships are represented by continuous and dashed arrows, respectively. Path coefficients are the adjacent numbers in the same direction indicated by the arrow and are proportional to the degree of the width. The green arrows represent positive correlations and the red arrows represent negative correlations. Significance levels are expressed as *P < 0.05 and **P < 0.01. The standardized total effect calculated by SEM is shown in the table below the figure.
3.6. Co-Occurrence between Microbiomes
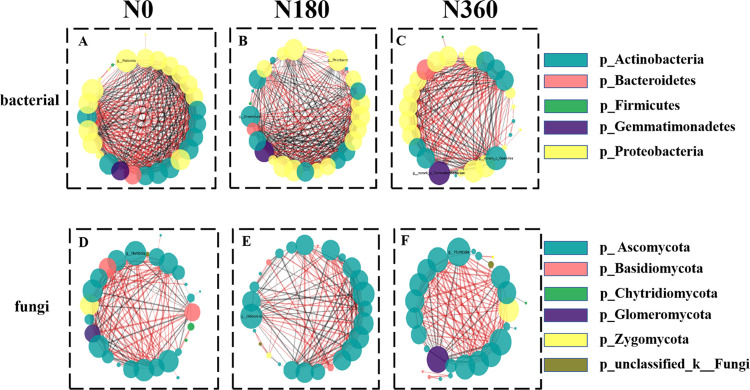
Bacteria and fungi network diagrams were created to further confirm the relationship between microorganisms (Figure 6). The network clustering coefficient, transitivity, and density of Xianyu 335 bacteria were higher than those of fungi (Table 5). Compared with the control, the N treatments decreased the maize transitivity of bacteria and improved fungi transitivity (Table 5). The network within bacteria and fungi also showed that the treatment clustering coefficient was higher for N180 (0.73) than that for other treatments (Figure S5), indicating close microbiome associations under N180. In addition, treatment N180 had higher network density in the bacterial and fungal communities (density of 0.62 and 0.39, respectively). These results indicated that soil microbial communities were more closely related to each other under the N180 treatment. In treatments N0, N180, and N360, the positive correlation between bacterial communities was 48.53, 45.64, and 56.38%, respectively (Table 5 and Figure 6A–C), whereas the positive correlation between fungal communities was 71.34, 60.87, and 77.69%, respectively (Table 5 and Figure 6D–F). Treatment N360 had the highest positive correlation values for both bacterial and fungal communities.
Figure 6.
Network visualization of the effect of fertilization treatment with 0 (N0), 180 (N160), and 360 (N360) kg N ha –1 on the co-occurrence of bacterial (A–C) and fungal (D–F) taxa at the genus level in bulk soil, rhizosphere soil, and endosphere. The node size corresponded to the degree of connection, and the colors correspond to the phylum-level classification information. The red and black lines represent the positive correlation and the negative correlation, respectively, and the thickness of the edges to the size of the Spearman correlation.
Table 5. Topological Indices of Each Network in Figure 6.
| bacterial |
fungal |
|||||
|---|---|---|---|---|---|---|
| item | N0 | N180 | N360 | N0 | N180 | N360 |
| clustering coefficient | 0.82 | 0.85 | 0.73 | 0.64 | 0.67 | 0.65 |
| transitivity | 0.96 | 0.87 | 0.88 | 0.76 | 0.76 | 0.78 |
| network density | 0.62 | 0.62 | 0.49 | 0.37 | 0.39 | 0.34 |
| number of nodes | 30 | 30 | 30 | 29 | 27 | 28 |
| network heterogeneity | 0.46 | 0.40 | 0.52 | 0.59 | 0.47 | 0.64 |
| network centralization | 0.22 | 0.20 | 0.27 | 0.29 | 0.24 | 0.31 |
There were high numbers of abundant species in the network. A correlation-based network analysis showed that the key microorganisms present in the bulk soil, rhizosphere soil, and endosphere bacterial modules were Ralstonia (degree = 24), Rubrobacter and Streptomyces (degree = 23), and Gaiellales and Gemmadaceae (degree = 20), respectively (Table S4). These genera belong to the phylum of Actinobacteria, Gemmatimonadetes, and Proteobacteria (Figure 6). The keystone species present in the bulk soil, rhizosphere soil, and endosphere fungal modules were Humicola (degree = 18), Gibberella (degree = 16), and Humicola (degree = 17), respectively (Table S4). These genera contained only one phylum of Ascomycota (Figure 6). Humicola, Gibberella, Ralstonia, Rubrobacter, Streptomyces, Gaiellales, and Gemmadaceae had higher connections in the network, identifying them as keystone species observed throughout the root spatial structure.
4. Discussion
Spatial structure led to significant changes in microbial community composition, and the host selected the rhizosphere microbial communities the most. Previous studies have suggested that niche selection and crop species are more responsible for microbial community variation than fertilization practice.28,29 Along the soil–plant continuum, the effect of nitrogen fertilizer on fungal community composition gradually decreased. These results provided a basis for the assembly and host selection of maize microbial communities under different N-application rates. Moreover, our results demonstrated that N application affected the diversity and composition of maize rhizosphere soil microbial. Previous studies have found that fertilizers can directly affect the rhizosphere microbiota by providing nutrients, or by changing soil characteristics, such as pH.30 According to Li et al.,5 although α indices in the bulk soil and endosphere showed a significant effect, the effect was small in comparison to that in the rhizosphere soil due to differences in soil properties. The plant root structure and root exudates will also change due to the amount of fertilization.31,32 In addition, we found that the application of N fertilizers significantly influenced the endosphere fungal community composition. The endophytic microbial community can improve crop yield by fixing N, potassium, and dissolved phosphorus in the atmosphere.33 Endosphere fungi are important components of plant microecosystems. Shankar et al.34 isolated some fungi in the roots of healthy plants and conducted antifungal activity experiments and found that endophytic fungi from healthy plants had certain antagonisms against pathogens. Endophyte entry into plants occurs naturally, mainly through wounds. The wound can provide access to microorganisms and access for leakage of plant exudates, creating favorable nutritional conditions for microorganisms.12,33 As a biocontrol agent, endophytic microbes can increase the soil nitrogen content and crop yield through nitrogen fixation and stimulation of plant hormones.23 Therefore, endophytic microbes can reduce microbial competition for N by increasing the rhizosphere N content.35 The dominant taxa play a key role in microbiome assembly.12,36 The abundance of Proteobacteria and Actinobacteria decreased with decreasing to the plant. The abundance of Proteobacteria increases in nutrient-rich soil environments and play a key role in nutrient cycling.27 Actinobacteria are active in biodegradation and can produce abundant secondary metabolites.37 Basidiomycota is enriched in an endophytic environment, producing oxidase and causing degradation of lignin.38 The enrichment degree of fungi microbial community varied among the studied spatial compartments; compared with those in the bulk soil and rhizosphere, Chytridiomycota and Glomeromycota were enriched in the endophytic environment. Our results further indicate that the specific microbial communities create different compartment niches in different spatial structures of the root system.12,29
Input mineral N is too high, and the bacterial diversity decreases.6 We showed that the bacterial α-diversity was highest in the N360 treatment and fungal α-diversity was lowest in the bulk soil and rhizosphere soil, which was different from previous studies. The increase in microbial community diversity is probably related to the fact that the distribution of microbial communities is affected by the extension of roots of nearby plants and different root secondary metabolites.12Bacillus, Sphingomonas, and Streptomyces were the most abundant bacterial genera. Bacillus in bulk soil, Blastococcus, and no rank-c-Actinobacteria in rhizosphere soil showed significant differences among the three N treatments, and their abundance in N180 was higher than that in N360. Changes in microbes’ community composition in different N treatments of maize may be due to the difference in root exudates. Previous studies showed that the microbial community composition of plant root appendices can be regulated by root exudates that can stimulate or repress distinct microbial members of the soil.2,39 In addition, according to Diacono et al.,40 differences in available nutrients and organic carbon fractions under different N treatments would also result in differences in the microbial community composition. Soil enzymes are produced by microorganisms, and microorganisms significantly affect soil physicochemical properties.41 In this study, our founding was that the change of microorganisms changed the soil pH, AN content, TK content, and APA. Bacillus and Blastococcus were enriched under the N180 treatment. Bacillus correlated significantly with pH and AN content and Blastococcus correlated significantly with TK content and APA in the rhizosphere. Bacillus has strong resistance to antibacterial and disease prevention effects and can be used for the prevention and control of plant diseases.42 In addition, endosphere or epiphyte Bacillus has good colonization and reproduction ability; in maize, it has good prevention and control ability for vascular and seed infection diseases.42Streptomyces can produce antibiotics.43Blastococcus can degrade organic material.25 Therefore, the N180 treatment is beneficial to enhance soil nutrients and improve the resistance to the antibacterial and disease prevention effects of maize. N fertilizers led to significant changes in Gibberella and Fusarium in the bulk soil and Gibberella and Mortierella in the rhizosphere soil. Changes in fungal microorganisms changed the soil pH, TK, TP contents, and UA. Gibberella was enriched in the N360 treatment, and this genus is associated with a devastating soil-borne disease in maize and poses a grave threat to maize production and kernel quality.44 Therefore, the abundance of microbial harmful fungi was increased, and that of beneficial bacteria was decreased with the high N-application rate.
According to the topological features of the network, we found that under the N180 treatment, both bacterial and fungal microbial communities formed a close relationship between microbial communities; however, this relationship was weakened under the N360 treatment. This might be attributed to the abundance of some key microorganisms that are more sensitive to N application.45 A recent study also reported that most key species are believed to participate in C and N cycling in the soil bacterial network.4 Wang et al.6 showed that high N-application levels had a negative effect on the soil bacterial community and reduced the soil bacterial network complexity and connectivity; however, it can have a positive effect on fungal interactions. Paungfoo-Lonhienne13 found that excessive application of N fertilizer had a negative effect on the soil carbon cycle and promoted some pathogenic fungal genera. In addition, the fresh yield and biomass were the highest under the N180 treatment, and biomass was significantly higher than that under other N treatments. A large number of studies have found the same result that a suitable nitrogen-application rate will increase crop yield, while excessive fertilizer application will not only reduce crop yield but also cause nitrogen redundancy in the soil.46 Together, these results demonstrated that the N-application rate of 180 kg N ha–1 could promote the diversity of the microbiome, thereby improving the plant–microbial system stability to resist harsh environmental conditions and affecting the growth and development of maize.
5. Conclusions
This study has shown that the N-application rate has profound impacts on microbiomes within the spatial structure of maize roots, which suggests that further research is needed to focus on multiple spatial levels in the roots to accurately capture microbiome fluctuations. N fertilization strongly influenced bacterial community diversity, but the fungal composition was more sensitive to N-fertilizer rate in the bulk soil and rhizosphere, and the effect on fungal communities decreased with closer proximity to the maize root. Gibberella and some pathogenic fungi were enriched in the N360 treatment, suggesting that high N-addition levels may promote fungi with known pathogenic traits. The abundance of beneficial bacteria was increased during the N180 treatment, and short-term application at the N180 treatment level helped to form closer ties among maize, thus contributing to the formation of maize yield. Changes in soil physicochemical properties and enzyme activities were identified as the main reason for the changes in the microbial community.
Acknowledgments
This work was financially supported by the National Key R&D Program of China (2016YFD0300305-3), the National Natural Science Foundation of China (31860356), and the Major Science and Technology Projects of Inner Mongolia Autonomous Region (2019ZD009, 2020ZD005-0403).
Supporting Information Available
The Supporting Information is available free of charge at https://pubs.acs.org/doi/10.1021/acsomega.2c01711.
Materials and methods; soil physicochemical properties before planting seedings (Table S1); information of primers (Table S2); α-diversity of the microbial communities (Table S3 and Figure S2); highest degree of microbial sensitivity to nitrogen (Table S4); rarefaction curves (Figure S2); β-diversity and relative abundance of the microbial communities (Figures S3 and S4); and the networks visualize fertilization treatment (Figure S5) (PDF)
The authors declare no competing financial interest.
Supplementary Material
References
- Tester M.; Langridge P. Breeding technologies to increase crop production in a changing world. Science 2010, 327, 818–822. 10.1126/science.1183700. [DOI] [PubMed] [Google Scholar]
- Zhu S. S.; Vivanco J. M.; Manter D. K. Nitrogen fertilizer rate affects root exudation, the rhizosphere microbiome and nitrogen-use-efficiency of maize. Appl. Soil Ecol. 2016, 107, 324–333. 10.1016/j.apsoil.2016.07.009. [DOI] [Google Scholar]
- Savci S. An agricultural pollutant: chemical fertilizer. Int. J. Environ. Sci. Dev. 2012, 3, 73–80. 10.7763/IJESD.2012.V3.191. [DOI] [Google Scholar]
- Zhang M.; Zhang X.; Zhang L.; Zeng L.; Liu Y.; Wang X.; He P.; Li S.; Liang G.; Zhou W.; Ai C. The stronger impact of inorganic nitrogen fertilization on soil bacterial community than organic fertilization in short-term condition. Geoderma 2021, 382, 114752 10.1016/j.geoderma.2020.114752. [DOI] [Google Scholar]
- Li B. Z.; Zhang Q. Q.; Chen Y. H.; Su Y. L.; Sun S. Y.; Chen G. Different crop rotation systems change the rhizosphere bacterial community structure of Astragalus membranaceus (Fisch) Bge. var. mongholicus (Bge.) Hsiao. Appl. Soil Ecol. 2021, 166, 104003 10.1016/j.apsoil.2021.104003. [DOI] [Google Scholar]
- Wang C.; Liu D. W.; Bai E. Decreasing soil microbial diversity is associated with decreasing microbial biomass under nitrogen addition. Soil Biol. Biochem. 2018, 120, 126–133. 10.1016/j.soilbio.2018.02.003. [DOI] [Google Scholar]
- Kumar A.; Meena R.; Meena V. S.; Bisht J. K.; Pattanayak A. Towards the stress management and environmental sustainability. J. Cleaner Prod. 2016, 137, 821–822. 10.1016/j.jclepro.2016.07.163. [DOI] [Google Scholar]
- Turner T. R.; James E. K.; Poole P. S. The plant microbiome. Genome Biol. 2013, 14, 209 10.1186/gb-2013-14-6-209. [DOI] [PMC free article] [PubMed] [Google Scholar]
- Zhang B.; Liang C.; He H.; Zhang X. Variations in soil microbial communities and residues along an altitude gradient on the northern slope of Changbai Mountain, China. Plos One 2013, 8, e66184 10.1371/journal.pone.0066184. [DOI] [PMC free article] [PubMed] [Google Scholar]
- Lupwayi N. Z.; Clayton G. W.; O’Donovan J. T.; Grant C. A. Soil microbial response to nitrogen rate and placement and barley seeding rate under no till. Agron. J. 2011, 103, 1064–1071. 10.2134/agronj2010.0334. [DOI] [Google Scholar]
- Morrison E. W.; Frey S. D.; Sadowsky J. J.; van Diepen L. T. A.; Thomas W. K.; Pringle A. Chronic nitrogen additions fundamentally restructure the soil fungal community in a temperate forest. Fungal Ecol. 2016, 23, 48–57. 10.1016/j.funeco.2016.05.011. [DOI] [Google Scholar]
- Bai L. F.; Zhang X. Q.; Li B. Z.; Sun F. C.; Zhao X. Q.; Wang Y. F.; Lu Z.; Zhang D.; Fang J. Fungal communities are more sensitive to nitrogen fertilization than bacteria in different spatial structure of silage maize under shore-term nitrogen fertilization. Appl. Soil Ecol. 2022, 170, 104275 10.1016/j.apsoil.2021.104275. [DOI] [Google Scholar]
- Paungfoo-Lonhienne C.; Yeoh Y. K.; Kasinadhuni N. R. P.; Lonhienne T. G. A.; Robinson N.; Hugenholtz P.; et al. Nitrogen fertilizer dose alters fungal communities in sugarcane soil and rhizosphere. Sci. Rep. 2015, 5, 8678 10.1038/srep08678. [DOI] [PMC free article] [PubMed] [Google Scholar]
- Mclaughlin A.; Mineau P. The impact of agricultural practices on biodiversity. Agric., Ecosyst. Environ. 1995, 55, 201–212. 10.1016/0167-8809(95)00609-V. [DOI] [Google Scholar]
- Smith J. L.; Doran J. W.. Measurement and Use of pH and Electrical Conductivity for Soil Quality Analysis. In Methods For Assessing Soil Quality; John Wiley & Sons, 1996; Vol. 49, pp 169–185. [Google Scholar]
- Böhme L.; Langer U.; Böhme F. Microbial biomass, enzyme activities and microbial community structure in two European long-term field experiments. Agric., Ecosyst. Environ. 2005, 109, 141–152. 10.1016/j.agee.2005.01.017. [DOI] [Google Scholar]
- Kirchmann H.; Schön M.; Börjesson G.; Hamnér K.; Kätterer T. Properties of soils in the Swedish longterm fertility experiments: VII. Changes in topsoil and upper subsoil at Örja and Fors after 50 years of nitrogen fertilization and manure application. Acta Agric. Scand., Sect. B 2013, 63, 25–36. 10.1080/09064710.2012.711352. [DOI] [Google Scholar]
- May G.; Nelson P. Defensive mutualisms: do microbial interactions within hosts drive the evolution of defensive traits?. Funct. Ecol. 2014, 28, 356–363. 10.1111/1365-2435.12166. [DOI] [Google Scholar]
- Eduardo K.; Mitter J.; Renato D. F.; James J. G. Bacterial root microbiome of plants growing in oil sands reclamation covers. Front. Microbiol. 2017, 8, 849 10.3389/fmicb.2017.00849. [DOI] [PMC free article] [PubMed] [Google Scholar]
- Hacquard S.; Garrido-Oter R.; Gonzalez A.; Spaepen S.; Ackermann G.; Lebeis S.; McHardy A. C.; Dangl J. L.; Knight R.; Ley R. Microbiota and host nutrition across plant and animal kingdoms. Cell Host Microbe 2015, 17, 603–616. 10.1016/j.chom.2015.04.009. [DOI] [PubMed] [Google Scholar]
- Müller D. B.; Vogel C.; Bai Y.; Vorholt J. A. The plant microbiota: systemslevel insights and perspectives. Annu. Rev. Genet. 2016, 50, 211–234. 10.1146/annurev-genet-120215-034952. [DOI] [PubMed] [Google Scholar]
- Edwards J.; Johnson C.; Santos-Medellın C.; Lurie E.; Podishetty N. K.; Bhatnagar S.; Eisen J. A.; Sundaresan V. Structure, variation, and assembly of the root-associated microbiomes of rice. Proc. Natl. Acad. Sci. U.S.A. 2015, 112, 911–920. 10.1073/pnas.1414592112. [DOI] [PMC free article] [PubMed] [Google Scholar]
- Rana K. L.; Kour D.; Yadav A. N. Endophytic microbiomes: biodiversity, ecological significance and biotechnological applications. Res. J. Biotechnol. 2019, 14, 142–162. [Google Scholar]
- Hu H. W.; He J. Z. Manipulating the soil microbiome for improved nitrogen management. Microbiol. Aust. 2018, 39, 24–27. 10.1071/MA18007. [DOI] [Google Scholar]
- Wang Y. J.; Liu L.; Yang J.; Duan Y.; Zhao Z.; et al. The diversity of microbial community and function varied in response to different agricultural residues composting. Sci. Total Environ. 2020, 715, 136983 10.1016/j.scitotenv.2020.136983. [DOI] [PubMed] [Google Scholar]
- Verma J. P. Functional importance of the plant microbiome: implications for agriculture, forestry and bioenergy: a book review. J Cleaner Prod. 2018, 178, 877–879. 10.1016/j.jclepro.2018.01.043. [DOI] [Google Scholar]
- Zhou Y. J.; Li J. H.; Friedman C. R.; Wang H. F. Variation of soil bacterial communities in a chronosequence of rubber tree (Hevea brasiliensis) plantations. Front. Plant Sci. 2017, 8, 849 10.3389/fpls.2017.00849. [DOI] [PMC free article] [PubMed] [Google Scholar]
- Cregger M. A.; Veach A. M.; Yang Z. K.; Crouch M. J.; Vilgalys R.; Tuskan G. A.; Schadt C. W. The Populus holobiont: dissecting the effects of plant niches and genotype on the microbiome. Microbiome 2018, 6, 31 10.1186/s40168-018-0413-8. [DOI] [PMC free article] [PubMed] [Google Scholar]
- Xiong C.; Zhu Y. G.; Wang J. T.; Singh B.; Han L. L.; Shen J. P.; Li P. P.; Wang G. B.; Wu C. F.; Ge A. H.; et al. Host selection shapes crop microbiome assembly and network complexity. New Phytol. 2021, 229, 1091–1104. 10.1111/nph.16890. [DOI] [PubMed] [Google Scholar]
- Zhang Y.; Shen H.; He X.; Thomas B. W.; Lupwayi N. Z.; Hao X.; et al. Fertilization shapes bacterial community structure by alteration of soil pH. Front. Microbiol. 2017, 8, 1325 10.3389/fmicb.2017.01325. [DOI] [PMC free article] [PubMed] [Google Scholar]
- Geisseler D.; Scow K. M. Long-term effects of mineral fertilizers on soil microorganisms - a review. Soil Biol. Biochem. 2014, 75, 54–63. 10.1016/j.soilbio.2014.03.023. [DOI] [Google Scholar]
- Sasse J.; Martinoia E.; Northen T. Feed your friends: do plant exudates shape the root microbiome?. Trends Plant Sci. 2018, 23, 25–41. 10.1016/j.tplants.2017.09.003. [DOI] [PubMed] [Google Scholar]
- Kandel S. L.; Joubert P. M.; Doty S. L. Bacterial endophyte colonization and distribution within plants. Microorganisms 2017, 5, 77 10.3390/microorganisms5040077. [DOI] [PMC free article] [PubMed] [Google Scholar]
- Shankar N.; Shashikala J.; Krishnamurthy Y. L. Study on the diversity of endophytic communities from rice (Oryza sativa L.) and their antagonistic activities in vitro. Microbiol. Res. 2009, 163, 209–296. 10.1016/j.micres.2006.12.003. [DOI] [PubMed] [Google Scholar]
- Doty S. L.; Sher A. W.; Fleck N. D.; Khorasani M.; Bumgarner R. E.; Khan Z.; Ko A. W. K.; Kim S. H.; DeLuca T. H. Variable nitrogen fixation in wild populus. PLoS One 2016, 11, e0155979 10.1371/journal.pone.0155979. [DOI] [PMC free article] [PubMed] [Google Scholar]
- Banerjee S.; Schlaeppi K.; Van D. Keystone taxa as drivers of microbiome structure and functioning. Nat. Rev. Microbiol. 2018, 16, 567–576. 10.1038/s41579-018-0024-1. [DOI] [PubMed] [Google Scholar]
- Polti M. A.; Aparicio J. D.; Benimeli C. S.; Amorosoa M. J.. 11-Role of Actinobacteria in Bioremediation. In Microbial Biodegradation Bioremediation; Elsevier, 2014; pp 269–286. [Google Scholar]
- Dix N. J.; Webster J.. Colonization and Decay of Wood. In Fungal Ecology; Springer: Netherlands, 1995; pp 145–171. [Google Scholar]
- Badri D. V.; Chaparro J. M.; Zhang R.; Shen Q.; Vivanco J. M. Application of natural blends of phytochemicals derived from the root exudates of Arabidopsis to the soil reveal that phenolic-related compounds predominantly modulate the soil microbiome. J. Biol. Chem. 2013, 288, 4502–4512. 10.1074/jbc.M112.433300. [DOI] [PMC free article] [PubMed] [Google Scholar]
- Diacono M.; Montemurro F. Long-term effects of organic amendments on soil fertility. A review. Agron. Sustainable Dev. 2010, 30, 401–422. 10.1051/agro/2009040. [DOI] [Google Scholar]
- Zhen L. S.; Gu J.; Hu T.; Chen Z. X. Effects of compost containing oxytetracycline on enzyme activities and microbial communities in maize rhizosphere soil. Environ. Sci. Pollut. Res. 2018, 25, 29459–29467. 10.1007/s11356-018-2964-4. [DOI] [PubMed] [Google Scholar]
- Bacon C. W.; Yates I. E.; Meredith H. F. Biological Control of Fusarium moniliforme in Maize. Environ. Health Persp. 2001, 109, 325–332. 10.1289/ehp.01109s2325. [DOI] [PMC free article] [PubMed] [Google Scholar]
- Schlatter D.; Fubuh A.; Xiao K.; Hernandez D.; Hobbie S.; Kinkel L. Resource Amendments Influence Density and Competitive Phenotypes of Streptomyces in Soil. Microb. Ecol. 2009, 57, 413–420. 10.1007/s00248-008-9433-4. [DOI] [PubMed] [Google Scholar]
- Agrios G. N.Plant Diseases Caused by Fungi. In Plant Pathology; Elsevier B.V., 1969; Chapter 9, pp 209–321. [Google Scholar]
- Zhao Z. B.; He J. Z.; Geisen S.; Han L. L.; Wang J. T.; Shen J. P.; Wei W. X.; Fang Y. T.; Li P. P.; Zhang L. M. Protist communities are more sensitive to nitrogen fertilization than other microorganisms in diverse agricultural soils. Microbiome 2019, 7, 33 10.1186/s40168-019-0647-0. [DOI] [PMC free article] [PubMed] [Google Scholar]
- Delevatti L. M.; Cardoso A. S.; Barbero R. P.; Leite R. G.; Romanzini E. P.; Ruggieri A. C.; Reis R. A. Effect of nitrogen application rate on yield, forage quality, and animal performance in a tropical pasture. Sci. Rep. 2019, 9, 7596 10.1038/s41598-019-44138-x. [DOI] [PMC free article] [PubMed] [Google Scholar]
Associated Data
This section collects any data citations, data availability statements, or supplementary materials included in this article.


