

Abstract
The analysis aimed at identifying subject‐specific characteristics (covariates) influencing exposure to daridorexant and quantification of covariate effects to determine clinical relevance. Data from 13 phase I, two phase II, and two phase III studies were pooled to develop a population pharmacokinetic model describing daridorexant concentration over time. Covariate effects were quantified based on model predictions. A two‐compartment model with dose‐dependent bioavailability, absorption lag time, linear absorption, and nonlinear elimination described the data best. Statistically significant covariates were food status on absorption (lag time and rate constant), time of drug administration (morning, bedtime) on absorption rate constant, lean body weight on central volume of distribution and elimination, fat mass on peripheral volume of distribution and intercompartmental drug transfer, and age and alkaline phosphatase on elimination. Age, lean body weight, fat mass, and alkaline phosphatase influence exposure (area under the curve, time of maximum concentration after dose administration, maximum plasma concentration, and next‐morning concentration) to a limited extent, that is, less than 20% difference from a typical subject. Morning administration is not relevant for daridorexant use by insomnia patients. The food effect with simultaneous intake of a high‐fat, high‐calorie food is an extreme‐case scenario unlikely to occur in clinical practice. Body composition, alkaline phosphatase, and age showed clinically negligible effects on exposure to daridorexant. Lean body weight and fat mass described the pharmacokinetics of daridorexant better than other body size descriptors (body weight, height, body mass index), suggesting a convenient physiological alternative to reduce the number of covariates in population pharmacokinetic models. The results indicate that differences between subjects do not require dose adjustments.
Study Highlights.
WHAT IS THE CURRENT KNOWLEDGE ON THE TOPIC?
The orexin system is involved in the regulation of sleep and arousal and currently targeted with new therapies for sleep disorders such as insomnia. Daridorexant (ACT‐541468) is a potent and selective dual orexin receptor antagonist that blocks the actions of orexin neuropeptides at both orexin‐1 and orexin‐2 receptors. Daridorexant was approved for marketing by the US Food and Drug Administration and the European Medicines Agency in 2022 for the treatment of insomnia.
WHAT QUESTION DID THIS STUDY ADDRESS?
Quantification of exposure to daridorexant for subjects differing by demographics, food status, time of drug administration, and disease status to judge if dose adaptation is required for particular subject characteristics.
WHAT DOES THIS STUDY ADD TO OUR KNOWLEDGE?
Daridorexant pharmacokinetics (PK) were characterized by a two‐compartment model with dose‐dependent bioavailability and nonlinear drug elimination most pronounced at concentrations originating from doses above the clinical dose of 50 mg. Food status and time of drug administration (morning vs. bedtime), body composition, age, and alkaline phosphatase influence exposure to daridorexant. Age and body composition as well as alkaline phosphatase influence exposure parameters to a limited extent, that is, not more than 20% different from a typical subject.
HOW MIGHT THIS CHANGE DRUG DISCOVERY, DEVELOPMENT, AND/OR THERAPEUTICS?
Lean body weight and fat mass provided a better characterization of the PK of daridorexant than body weight, height, body mass index, age, or sex, suggesting body composition as a physiologically meaningful PK covariate with lower dimensionality than a set of standard demographic covariates, in particular for lipophilic compounds. The clinical implications of differences in daridorexant concentration between subjects with different characteristics are negligible.
INTRODUCTION
Insomnia disorder is defined as a predominant complaint of dissatisfaction with sleep quantity or quality associated with difficulty initiating sleep, difficulty maintaining sleep, or early‐morning awakening with an inability to return to sleep. Estimates indicate a prevalence of 6%–10% of adults meeting the established diagnostic criteria. 1 As a consequence, clinically significant distress or impairment in social, occupational, educational, academic, behavioral, or other important areas of functioning occur.
Orexin is suggested to play a key role in insomnia and the sleep/wake cycle. 2 Orexin receptor antagonists appear to not induce dependency and reduced efficacy over time, that is, tolerance. 3 Thus, safety and tolerability clearly differ from older treatment options such as barbiturates, benzodiazepines, or nonbenzodiazepines such as zolpidem. Following the marketed dual orexin receptor antagonists (DORAs) suvorexant and lemborexant, daridorexant was approved for marketing in the United States 4 and the European Union 5 in 2022 supported by two pivotal clinical studies. 6 The recommended dose is 50 mg.
The molecular weight of daridorexant is 451 g/mol, 7 and the absolute bioavailability was estimated as 62% derived from an oral dose of 100 mg of daridorexant and a microdose of 2.02 μg. Elimination was determined to be primarily via feces (56.6%) and urine (27.9%). 8 Daridorexant is primarily metabolized by cytochrome P450 3A4. 9
The clinical program of daridorexant in insomnia so far comprised 18 phase I studies, two phase II studies, and three phase III studies with further studies in planning. The aim of this study was to identify subject‐specific characteristics influencing exposure (area under the curve [AUC], maximum plasma concentration [C max], time of maximum concentration after dose administration [t max], and next‐morning concentration [C 8h]) in healthy subjects and insomnia patients. The covariate effects were quantified to determine clinical relevance and in turn the necessity of dose adaptation in special populations.
Sleep‐inducing drugs such as daridorexant have specific modeling aspects such as assessing next‐morning concentrations (possibly related to daytime functioning) and daytime versus nighttime pharmacokinetics (PK) (i.e., during sleep), showing that identification of clinically relevant covariates plays a role in efficacy and safety aspects.
METHODS
Data
Daridorexant concentration data from 13 clinical phase I studies, two phase II studies, and two phase III studies were combined. The data not used for population PK modeling were largely excluded because of placebo treatment, other concomitant medication (e.g., in drug–drug interaction studies with diltiazem, midazolam, citalopram, or ethanol), formulations of no further clinical relevance (liquid‐filled soft gelatin capsule), or concentration measurements prior to first‐dose administration (467). The orally administered doses ranged from 5 to 200 mg.
Model development
The population PK model was developed in a stepwise approach. Selection of the structural model that best described daridorexant concentrations over time (i.e., absorption, distribution, and elimination) was based on data from phase I studies in healthy subjects with dense PK sampling. One‐, two‐, and three‐compartment models with linear and nonlinear absorption with and without lag time and linear and nonlinear elimination were evaluated.
Parameter estimation was based on all PK data from phase I studies (healthy subjects, subjects with hepatic/renal impairment) using the structural model selected in Step 1. This model formed the phase I base model for subsequent covariate analysis.
Covariate analysis, that is, univariate forward inclusion/backward elimination, used all phase I data.
All PK data, that is, phase I, II, and III data, were combined, and model parameters were (re)estimated. Parameters for which phases II and III (sparse) data did not provide additional information, for example, absorption parameters, intercompartmental drug transfer, interindividual variability (IIV), and covariate effects, were kept fixed to the estimates obtained in Step 3.
The final covariate analysis using the full data set was restricted to drug clearance and volume(s) of distribution. Univariate forward inclusion/backward elimination was used to determine significant parameter–covariate relationships.
IIV was added a priori to each of the model parameters and only removed if, for example, the parameter was very small with a high relative standard error (RSE). Parameters were estimated using stochastic approximation of expectation maximization (SAEM). 10
For all covariates, the baseline value was defined as the last measurement prior to study drug administration. Candidate covariates for the PK model were as follows: covariates (Table S1) were assessed for their impact on the specified model parameters. Other covariates were investigated if indicated by plots displaying random effects versus covariates and the associated p value calculated with Pearson's correlation test (continuous covariates) or analysis of variance (categorical covariates). If a covariate was included in the defined set of candidate covariates or was statistically significant (p < 0.05) based on the aforementioned criteria, the covariate was included in the model and formally tested for significance using Wald's test. 11 This procedure was performed univariately, that is, assessing one covariate on one model parameter per run (univariate forward selection). All covariates that were statistically significant (p < 0.05) were included in a full covariate model.
Based on the full covariate model, an iterative backward elimination was performed. After each run, the least significant covariate was dropped until all remaining covariates were statistically significant (p < 0.01). Body weight was the primary body size descriptor assessed as a covariate (to allow for pediatric scaling based on body size, i.e., volume of distribution). Other body size descriptors such as body mass index (BMI), lean body weight, and fat mass were assessed if suggested by graphical analyses and statistical criteria. These variables were only kept in the model if:
A statistically significant effect on top of a body weight effect was apparent, or
The effect was statistically significant while the body weight effect was not.
Continuous covariate–parameter terms were included in the model as power relationships:
where θ is the population parameter for the reference covariate value, and β θ,cov is the parameter estimate for the covariate effect. Reference values were chosen as round values close to observed medians.
Categorical covariate–parameter terms were implemented as power relationships:
where θ is the population parameter for the reference covariate category, and β θ,cov is the covariate effect parameter.
Continuous covariates were centered at a round value close to the observed median. Categorical covariates were investigated versus a specified reference category, typically the most frequent. Table 1 provides an overview.
TABLE 1.
Covariate summary
| Variable at baseline (unit) | Minimum | First quartile | Median | Mean | Third quartile | Maximum |
|---|---|---|---|---|---|---|
| Age (years) | 18 | 38 | 54 | 51.8 | 66 | 88 |
| Body weight (kg) | 42.0 | 64.9 | 73.6 | 74.7 | 83.2 | 119.5 |
| BMI (kg/m2) | 17.6 | 22.9 | 25.4 | 25.8 | 28.1 | 39.6 |
| LBW (kg) | 29.1 | 41.3 | 47.2 | 50.3 | 59.6 | 83.9 |
| FM (kg) | 7.0 | 19.0 | 23.4 | 24.4 | 28.9 | 58.6 |
| Categorical variable at baseline | Group (size) |
|---|---|
| Sex | Female (1155), male (743) |
| Race/ethnicity | White (1646), Black or African American (175), Asian (36), Japanese (17), American Indian or Alaska Native (4), Native Hawaiian or Other Pacific Islander (4), not reported (1), other (15) |
| Hepatic impairment | Healthy (1882), mild (8), moderate (8) |
| Renal impairment | Healthy (1891), severe (7) |
| Laboratory value at baseline (unit) | Minimum | First quartile | Median | Mean | Third quartile | Maximum |
|---|---|---|---|---|---|---|
| ALP (U/L) | 16 | 50 | 61 | 64 | 75 | 244 |
| CLcr (ml/min) | 16 | 79 | 98 | 101 | 120 | 241 |
Abbreviations: ALP, alkaline phosphatase; BMI, body mass index; CLcr, creatinine clearance 37 ; FM, fat mass; LBW, lean body weight.
For categorical covariates, only categories comprising more than 5% of the subjects were considered. This rule was not applied to food status (light meal/uncontrolled, fasted, fed), hepatic/renal impairment, and drug formulation.
Body size–related covariates were defined as follows BMI = body weight (kg)/body height (m)2, lean body weight = 9270 * body weight/(6680 + 216 * BMI) for male subjects and 9270 * body weight/(8780 + 244 * BMI) for female subjects, 12 and fat mass was derived from the difference between body weight and lean body weight.
Covariate selection was performed using the combined stochastic approximation for model building and conditional sampling for stepwise approach based on correlation tests methodology, an automated covariate model–building algorithm in Monolix. 13 , 14 The laboratory parameter alkaline phosphatase (ALP) was specifically considered because it was identified as a covariate in the population PK model for lemborexant. 15
Model qualification
Model qualification was based on the precision of the parameter estimation based on RSE and goodness‐of‐fit plots of observations versus predictions and residuals versus time and versus predictions. Predictive model performance was assessed based on visual predictive checks (VPCs) without covariates and prediction‐corrected VPCs (pcVPCs) with covariates. In addition, Akaike's information criterion was evaluated, a combination of goodness of fit and a penalty term for the number of parameters, that is, the model complexity. 16
Model‐based simulations
The final population PK model was employed to derive exposure estimates for different subject characteristics based on the statistically significant covariates. Covariate effects, that is, exposure parameters, were estimated for the 5% and 95% quantiles of covariates and quantified in comparison to the reference subject (defined as 60 years of age, fat mass of 20 kg, lean body weight of 55 kg, ALP of 60 U/L, food status light meal/uncontrolled, and bedtime drug administration). Exposure estimates were derived for the first day of drug administration because daridorexant exhibits negligible drug accumulation.
Visualizations and tabulated numerical results of exposure parameters were created for the exposure parameters C max and t max, next‐morning plasma concentration (C 8h), and AUC over a 24‐h interval.
Software
The statistical programming environment R 17 was used for data set preparation, exploratory analyses, and the visualization of results. Population PK modeling was performed using Monolix 18 and its implementation of the SAEM method 10 , 19 for model fitting. Concentrations below the lower limit of quantification (LLOQ) were treated as censored and simulated from a lognormal distribution restricted to the range (0, LLOQ). The Fisher information matrix and log‐likelihoods were generally estimated using stochastic approximation unless numerical convergence could not be achieved (in which case linear approximation was used). The stiff ordinary differential equation solver was used in case of nonconvergence of the ordinary differential equation solver (in a few cases during structural model identification). Berkeley Madonna was used for model exploration and visualization. 20 , 21 Simulx was used to perform model‐based simulations. 22
RESULTS
Data characteristics
The phase I studies provided 9420 concentrations from 412 subjects, and the two phase II and two phase III studies provided 3207 next‐morning concentrations from 1486 insomnia patients, totaling 12,627 concentrations from 1898 subjects. Some observations had to be excluded for reasons such as missing dosing history (2), measurements not being performed (32), missing concentration values (2), missing time of dose administration or concentration measurement (8), no drug intake (1), or switched samples (24).
Different study setups provided information on subject characteristics (e.g., age), drug administration times (mostly morning in the phase I studies and bedtime in the phase II and III studies), or food effects (Table S2).
Population PK model
The concentration‐time course of daridorexant was described by a two‐compartment population PK model with bioavailability reduced at higher doses, linear absorption, and nonlinear elimination apparent at high concentrations associated with doses higher than 50 mg. The final parameter estimates are provided in Table 2. The model described the daridorexant concentration data well across the dose range from 5 to 200 mg. Model predictions and simulations showed good alignment with the observed data (Figures S1–S5). Further analyses did not indicate systematic differences between observations and predictions (Figures S6–S10).
TABLE 2.
PK model parameter estimates for selected models
| Phase I data (intense PK) | All Phase I data | All data, reestimation | All data, final model | |||||
|---|---|---|---|---|---|---|---|---|
| Estimate | RSE(%) | Estimate | RSE(%) | Estimate | RSE(%) | Estimate | RSE(%) | |
| Parameter | ||||||||
| F | 0.53 | 3.43 | 0.41 | 1.53 | 0.41 | 0.41 | ||
| Dose | −0.66 | 4.39 | −0.47 | 4.17 | −0.47 | −0.47 | ||
| t lag (h) | 0.29 | 0.06 | 0.41 | 7.94 | 0.41 | 0.41 | ||
| Food: fasted on t lag | −0.51 | 16.50 | −0.51 | −0.51 | ||||
| Food: fed on t lag | 0.62 | 17.80 | 0.62 | 0.62 | ||||
| k a (1/h) | 5.28 | 0.09 | 1.05 | 18.70 | 1.05 | 1.05 | ||
| Food: fasted on k a | 0.09 | 172.00 | 0.09 | 0.09 | ||||
| Food: fed on k a | −1.19 | 16.90 | −1.19 | −1.19 | ||||
| Morning administration on k a | 1.05 | 11.00 | 1.05 | 1.05 | ||||
| V c (L) | 24.40 | 2.51 | 14.60 | 1.42 | 14.60 | 14.60 | ||
| Lean body weight on V c | 0.37 | 18.20 | 0.56 | 17.10 | 0.49 | 13.86 | ||
| V p (L) | 19.40 | 4.75 | 13.70 | 1.91 | 13.70 | 13.70 | ||
| Fat mass on V p | 0.72 | 8.70 | 0.42 | 18.50 | 0.47 | 13.83 | ||
| Q (L/h) | 3.96 | 0.09 | 3.58 | 3.24 | 3.58 | 3.58 | ||
| Fat mass on Q | 1.21 | 8.57 | 1.39 | 8.76 | 1.47 | 6.48 | ||
| V m (mg/h) | 4.81 | 6.91 | 6.94 | 1.13 | 6.94 | 6.94 | ||
| K m (μg/ml) | 0.96 | 0.00 | 2.36 | 2.20 | 2.36 | 2.36 | ||
| Age on K m | 0.30 | 6.87 | ||||||
| ALP on K m | 0.34 | 10.54 | ||||||
| Lean body weight on K m | −0.12 | 79.30 | −0.55 | 8.58 | −0.20 | 25.95 | ||
| CL (L/h) | ||||||||
| Variability | ||||||||
| SD(F) | 0.31 | 12.30 | 0.42 | 4.94 | 0.42 | 0.42 | ||
| SD(t lag) | 0.23 | 7.38 | 0.26 | 14.40 | 0.26 | 0.26 | ||
| SD(k a) | 1.35 | 7.92 | 0.59 | 9.12 | 0.59 | 0.59 | ||
| SD(V c) | 0.31 | 9.56 | 0.17 | 7.26 | 0.17 | 0.17 | ||
| SD(V p) | 0.32 | 10.30 | 0.23 | 7.70 | 0.23 | 0.23 | ||
| SD(Q) | 0.55 | 12.80 | 0.50 | 5.18 | 0.50 | 0.50 | ||
| SD(V m) | 0.27 | 13.00 | 0.09 | 11.90 | 0.09 | 0.09 | ||
| SD(K m) | 0.28 | 11.90 | 0.36 | 4.28 | 0.36 | 0.36 | ||
| SD(CL) | ||||||||
| IOV(F) | 0.19 | 7.33 | 0.20 | 5.59 | 0.20 | 0.20 | ||
| IOV(t lag) | 0.42 | 5.70 | 0.42 | 0.42 | ||||
| IOV(k a) | 0.66 | 5.72 | 0.66 | 0.66 | ||||
| Additive error | 0.25 | 10.00 | 4.44 | 3.84 | 17.70 | 1.88 | 17.59 | 1.97 |
| Multiplicative error | 0.23 | 1.13 | 0.18 | 1.10 | 0.16 | 1.31 | 0.16 | 1.34 |
Note: If no RSE value is reported, the population parameter was fixed rather than estimated.
Continuous covariates were normalized by reference values, that is, age 30 years, fat mass 20 kg, lean body weight 55 kg, ALP 60 U/L, and dose 50 mg. Categorical covariates were defined with reference categories light meal/uncontrolled for food status and evening for time of administration.
Parameters are assumed to follow a lognormal distribution such that, for example, t lag with food status fed and fasted are derived from the reference, light meal/uncontrolled, as 0.41 * exp(0.62) = 0.76 and 0.41 * exp(−0.51) = 0.25, respectively. For continuous covariates, for example, V c with lean body weight of 40 kg and the reference of 55 kg, is derived as V c = 14.6 * exp(0.49 * log[40/55]) = 12.49 L.
Abbreviations: ALP, alkaline phosphatase; CL, clearance; F, relative bioavailability; IOV, interoccasion variability; k a, absorption rate constant; K m, concentration at which the rate of elimination is half the maximum rate; PK, pharmacokinetic(s); Q, intercompartmental transfer rate; RSE, relative standard error; t lag, time lag between drug intake and start of absorption; V c, volume of distribution of the central compartment; V m, maximum rate of elimination; V p, volume of distribution of the peripheral compartment.
The evaluation of covariate effects showed that the inclusion of body size descriptors improved the model fit. Lean body weight and fat mass described the data more accurately than combinations of alternatives such as body weight, BMI, age, or sex. The formulae for derivation of lean body weight (fat‐free mass) are sex specific and include body weight and BMI. 12 Alternative methods include age and estimate both, lean body weight and fat mass, separately per sex. 23
Although it can be difficult to identify the correct relation of volumes of distribution and body size descriptors, 24 body composition and the relation of volumes to lean body weight and fat mass provide a physiologically plausible model structure, in particular for a lipophilic compound such as daridorexant. These relationships are visualized for different covariates (Figure 1). The complete separation of sexes with lean body weight and fat mass (Figure 2) indicates that sex provides no additional information to body composition.
FIGURE 1.
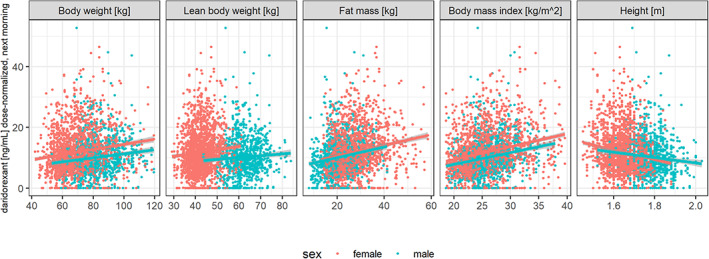
Next‐morning concentrations (dose normalized) after bedtime administration versus body size descriptors in patients with insomnia disorder. Data restricted to 8–10 h after drug administration (pharmacokinetics [PK] sampling was scheduled to be between 9 and 10 h after drug administration, however, more than 10% of PK samples were taken between 8 and 9 h after drug administration). Colors indicate sexes, lines indicate linear regression fits with 90% confidence intervals (gray areas) by sex.
FIGURE 2.
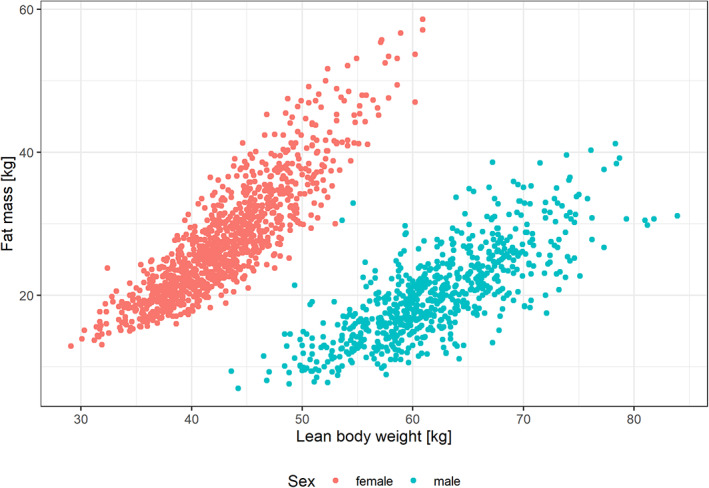
Fat mass versus lean body weight by sex in patients with insomnia disorder.
The PK model parameters comprised the components bioavailability (fraction F of the dose), absorption (absorption lag time, t lag, and absorption rate constant, k a), distribution (central and peripheral volumes, V c and V p, with intercompartmental transfer Q), and elimination (V m and K m).
The relative bioavailability F was found to decrease with higher doses: a dose of 200 mg was estimated to have 52% of the bioavailability of the 50 mg dose or approximately twice as much drug bioavailable with a dose four times as high.
The estimated t lag was 15 min (fasted), 25 min (light meal/uncontrolled), and 46 min (high‐fat, high‐calorie food). The absorption rate constant increased by 9% in the fasted state and decreased by 70% with high‐fat, high‐calorie food compared with light meal/uncontrolled food intake. Morning administration showed a 186% higher absorption rate constant compared with bedtime administration.
The central volume of distribution was associated with lean body weight, and the peripheral volume of distribution and the intercompartmental transfer rate were associated with body fat mass.
The elimination parameter K m was found to be related to lean body weight, age, and ALP. K m decreased with higher lean body weight and increased with higher age and higher ALP levels. Higher ALP levels are associated with reduced liver function and cholestasis (decreased bile flow). 25
Creatinine clearance, renal impairment (yes/no with renally impaired subjects from a dedicated study), hepatic impairment (yes/no with hepatically impaired from a dedicated study), and race (Black or African American) were not statistically significant at the 1% level on bioavailability, absorption, and elimination.
The relationships between model parameters and covariates are summarized in Table 3.
TABLE 3.
Covariate effects on population PK model parameters
| Covariate parameter | Dose | Food | Time of administration | Lean body weight | Fat mass | Age, ALP |
|---|---|---|---|---|---|---|
| F | F(200 mg) = 52% F(50 mg) | |||||
| t lag | t lag(fed) = 3.1 * t lag(fasted) | |||||
| k a | k a(fasted) = 3.6 * k a(fed) | k a(morning)=2.9 * k a(bedtime) | ||||
| V c | V c increases with lean body weight | |||||
| V p | V p increases with fat mass | |||||
| Q | Q increases with fat mass | |||||
| V m | ||||||
| K m | K m decreases with lean body weight | K m increases with age and ALP |
Abbreviations: ALP, alkaline phosphatase; F, relative bioavailability; k a, absorption rate constant; K m, concentration at which the rate of elimination is half the maximum rate; PK, pharmacokinetic(s); Q, intercompartmental transfer rate; t lag, time lag between drug intake and start of absorption; V c, volume of distribution of the central compartment; V m, maximum rate of elimination; V p, volume of distribution of the peripheral compartment.
Model qualification
All model parameters were well estimated as evidenced by the RSE values that were below 20% for all structural model parameters and random effects (Table 2).
Observations and predictions showed good alignment on the population and individual levels for the base model in healthy subjects (Figures S1 and S2) and the full data set with healthy subjects and patients with insomnia disorder (Figures S3–S5). Analyses of residuals and random effects indicated good alignment between the observed data and model fits overall (Figures S6–S10).
Predictive model performance was shown to be good based on pcVPCs comparing observed to model‐predicted 5th, 50th, and 95th percentiles as empirical percentiles are largely within the confidence intervals of the predictions for daridorexant concentrations (Figure S5). Limited overestimation of the variability was observed for the higher doses of 150 and 200 mg (Figure S5). These could possibly be attributed to (limited) differences between studies or study participants.
Quantification of covariate effects
A typical subject (age 60 years, fat mass 20 kg, lean body weight 55 kg, ALP 60 U/L, food status light meal/uncontrolled, bedtime administration) provided the reference for comparisons.
Covariate effects were estimated for the 5th and 95th percentiles for continuous covariates (age 23 and 74 years, fat mass 13.1 and 39.1 kg, lean body weight 36.2 and 69.1 kg, ALP 38 and 99 U/L). Categorical covariates were evaluated for each category (food status fasted and fed vs. uncontrolled/light meal, and morning drug vs. bedtime drug administration).
Model‐based estimation of the exposure parameters (AUC, C max, C 8h, t max) showed that food (drug administration simultaneously with a high‐calorie, high‐fat meal) and morning administration compared with bedtime administration had the largest effects on exposure (Figure 3). Simultaneous food and drug intake was estimated to increase tmax from 2.1 h to 4.5 h and decreased C max from 817 ng/ml to 523 ng/ml (−36%). Morning drug administration reduced t max from 2.1 h to 1.25 h and increased C max from 817 ng/ml to 1054 ng/ml (+29%). All other covariates affected the exposure by less than 20% (Figure 3), in line with concentration‐time profiles for different subject characteristics (Figure 4).
FIGURE 3.
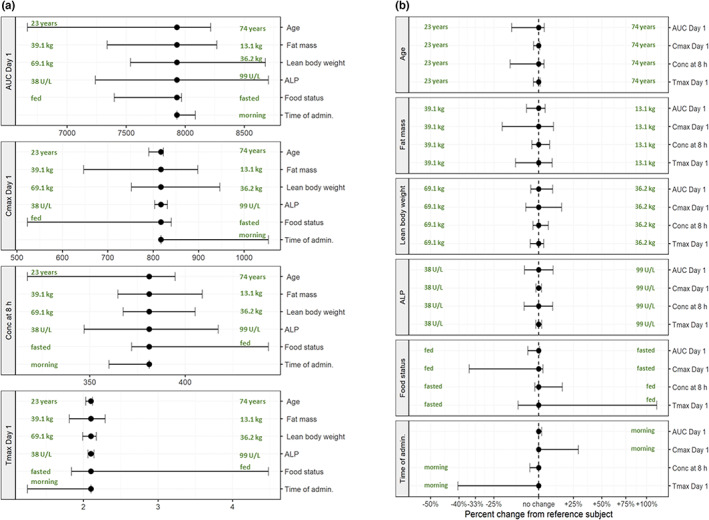
Covariate effects on exposure parameters with a dose of 50 mg: absolute exposure (a) and difference to reference subject (b). Bullets indicate model predictions of exposure for the reference subject (age 60 years, fat mass 20 kg, lean body weight 55 kg, ALP 60 U/L, food status light meal/uncontrolled, bedtime administration); ranges indicate estimated exposure ranges for 5%–95% quantile ranges of covariates (age 23–74 years, fat mass 13.1–39.1 kg, lean body weight 36.2–69.1 kg, ALP 38–99 U/L, food status fasted and fed, morning administration). Units: AUC0–24h = ng/ml * h, C max and Conc at 8 h = ng/ml, and t max = h. ALP, alkaline phosphatase; AUC, area under the curve; AUC Day 1, area under the curve 0–24 h; C max, maximum plasma concentration; Conc, concentration; t max, time of maximum concentration after dose administration.
FIGURE 4.
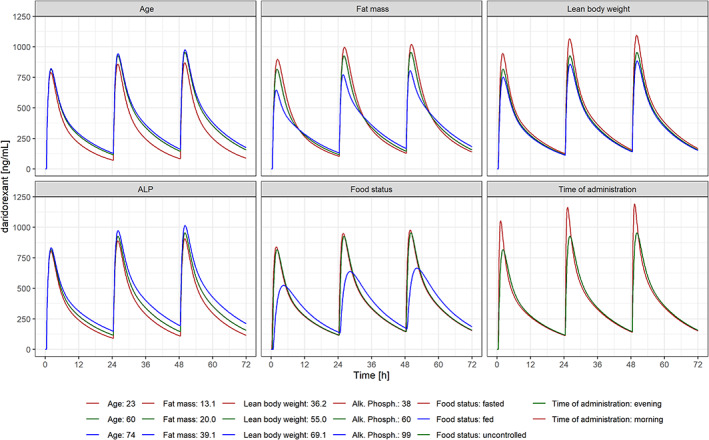
Concentration‐time profiles for different subject characteristics with 50 mg once‐daily dosing for 3 days. ALP, alkaline phosphatase.
DISCUSSION
Clinical studies with insomnia drugs
Studying insomnia drugs poses particular challenges. Drugs are generally administered to patients at bedtime, whereas studies in healthy subjects are generally conducted with morning drug administration. It appears plausible that there might be differences in PK depending on whether a subject is awake or asleep (i.e., different body postures). To collect data, nighttime PK sampling is not easy to implement in practice, in particular if sleep parameters are to be assessed in the study.
An ideal drug to treat insomnia should have fast absorption (to fall asleep quickly) and a PK profile such that most of the drug is eliminated by the morning to avoid residual next‐morning effects and allow for full daytime functioning. Next‐morning exposure is a characteristic of insomnia drugs administered at bedtime, and the common trough concentration, that is, before administration of the next dose, is of limited relevance.
Healthy subjects (mostly young and male) and insomnia patients (mostly elderly of both sexes) generally differ substantially. Estimating differences between morning and bedtime administrations should be based on data containing both administrations in the same population, healthy subjects or patients, avoiding convolution of the estimation by differences between populations, for example, age. Phase I studies in healthy young and elderly subjects enabled robust estimation of PK differences between morning and bedtime administrations (possibly related to differences in body posture and liver blood flow as well as being awake or asleep) and quantification of the influence of interindividual differences on the PK of daridorexant.
Comparison of DORAs
The population PK models for drugs in the same class, that is, daridorexant, suvorexant, 26 and lemborexant, 15 , 27 show similarities and differences with respect to population PK models. Similar structural models (i.e., absorption, number of compartments, and drug elimination) would facilitate comparison of covariate influences. However, the differences are substantial, and a comparison of the three models is hampered by differences in structural models, covariates, and covariate selection methods.
Data
The suvorexant analysis used 16 phase I studies, apparently not including patient data. 26 The lemborexant analysis combined nine phase I (six with rich PK sampling), one phase II, and two phase III studies (with sparse PK sampling), with 1892 subjects in total (Table 4 in Lalovic et al. 15 ). The daridorexant analysis included 13 phase I studies, two phase II studies, and two phase III studies, with 1898 subjects in total (Table 4).
TABLE 4.
Comparison of population PK models for daridorexant, lemborexant, and suvorexant
| Compound | Daridorexant | Lemborexant | Suvorexant |
|---|---|---|---|
| Reference | 15, 27 | FDA review 26 | |
| Data (number of studies in phases I, II, and III) |
13 phase I studies Two phase II studies Two phase III studies 1898 subjects providing 12,627 concentration measurements |
Nine phase I studies One phase II study Two phase III studies 1892 subjects including 112 taking concomitant protein pump inhibitors |
16 studies The numbers of subjects and samples were not reported |
| Structural model |
Two compartments Linear absorption Nonlinear elimination (in supratherapeutic range) |
Three compartments Nonlinear absorption Linear intercompartmental transfer Linear elimination |
Three compartments Nonlinear absorption Saturable distribution into one peripheral compartment Linear elimination |
|
F Absorption |
41% for reference dose of 50 mg. Nonlinear for doses above the therapeutic dose Linear absorption with absorption lag time. Presence of food increases t lag and decreases k a; morning administration increases k a |
F at least 87%, no decrease in F with higher doses, 21% increase with food (not based on population PK model) t lag 24 min Mixed first‐order and zero‐order absorption (presumably in parallel) Food effect on k a Bedtime administration increases duration of zero‐order absorption |
62% for 20 mg and 47% for 40 mg t lag 11 min A sigmoidal function, representing zero‐order release of drug from the tablet formulation followed by first‐order absorption Food effect not included in population PK model. Morning administration increases F and linear absorption |
| Apparent volumes of distribution | 14.6 and 13.7 L | 9.09, 278, and 783 L | 58.3 and 47.6 L, no estimate for third compartment (saturable distribution) |
| CL | 2.4–1.8 L/h for concentrations of 500–1000 ng/ml | 22.7 L/h | 4.81 L/h for the linear component |
| Covariates | Higher lean body weight and fat mass correspond to higher central and peripheral volume, respectively. Higher age and ALP levels increase K m, whereas higher lean body weight decreases K m | CL decreases with higher BMI and higher ALP, whereas CL is decreased in the elderly (categorical covariate, 0.7 in elderly patients aged >65 years vs. adults) | CL decreases with higher BMI and is lower in female subjects |
Abbreviations: ALP, alkaline phosphatase; BMI, body mass index; CL, clearance; F, relative bioavailability; FDA, Food and Drug Administration; k a, absorption rate constant; K m, concentration at which the rate of elimination is half the maximum rate; PK, pharmacokinetic(s); t lag, time lag between drug intake and start of absorption.
Structural models
The structural models for suvorexant and lemborexant comprised three compartments. Lemborexant's intercompartmental transfer was identified as linear, whereas the suvorexant model included saturable transfer kinetics into the second peripheral compartment, an unusual model component. 26
Although the suvorexant PK were structurally described by a three‐compartment model with sequential zero‐order absorption (to describe an absorption limit for the tablet formulation) followed by first‐order absorption, lemborexant PK were described by a three‐compartment model with parallel zero‐ and first‐order absorption. Daridorexant PK were described by a two‐compartment model with first‐order absorption and bioavailability reduced at higher doses.
Apparent volumes of distribution were reported as 58.3 and 47.6 L for suvorexant (no volume reported for the saturable peripheral compartment) and 9.09, 278, and 783 L for lemborexant, whereas daridorexant estimates were 14.6 and 13.7 L (with bioavailability estimated as additional model parameter).
Elimination of suvorexant was described by linear clearance, estimated as 4.81 L/h, whereas lemborexant clearance was estimated as 22.7 L/h. Daridorexant apparent drug clearance was estimated as 2.4 L/h at concentrations of 500 ng/ml.
Parameter estimates and covariate effects
Bioavailability of suvorexant was 62% at 20 mg and 47% at 40 mg, whereas lemborexant was reported to have at least 87% bioavailability (not as part of the PK model but from a bioavailability study; NCT02046213 15 ) with a 21% increase if administered with food. The suvorexant model identified a decreased bioavailability with higher doses similar to the daridorexant model, whereas the lemborexant model did not include an effect of dose on bioavailability. Bioavailability of suvorexant and daridorexant was estimated to decrease with higher doses and was approximately 50%–60% for clinically relevant doses, whereas no change in bioavailability with higher doses was reported for lemborexant.
For lemborexant, t lag was estimated as 24 min, whereas the suvorexant value was reported as 11 min. Suvorexant absorption was described as “a sigmoidal 26 function, representing zero‐order release of drug from the tablet formulation followed by first‐order absorption,” whereas lemborexant absorption was described by a mixed first‐order and zero‐order absorption.
A food effect was not included in the suvorexant population PK model 26 even though a study suggested a delay in t max (1.5 h in the fasted state vs. 3 h in the fed state 26 ) that is reflected in the US prescriber information (“Time to effect of BELSOMRA may be delayed if taken with or soon after a meal”). 28 For lemborexant, differences in C max (−23% with food), AUC0–∞ (−18% with food), and t max (1.75 h delay with food) were determined. 27 However, only food status on absorption rate constant was included in the population PK model 15 (i.e., not affecting AUC). Similarly, the daridorexant population PK model included food status on t lag and k a (t lag 0.41 and 1.23 h, k a 3.8 and 1.05/h in the fasted and fed states, respectively).
Morning administration was reported to increase bioavailability and the linear absorption rate constant for suvorexant, whereas for lemborexant, morning administration was associated with a shorter duration of the zero‐order absorption process and, for daridorexant, with a higher absorption rate constant.
Female subjects were reported to have a lower suvorexant clearance than male subjects, in line with lower clearance for lemborexant with higher BMI (BMI shows a positive correlation with body fat mass, which is generally higher in female subjects).
Lemborexant results included the effects of ALP on clearance (reduced with higher levels) and 26% lower clearance for elderly subjects (65 years and older).
The many differences in model structure, parameters, and covariates among the three models might simply reflect different approaches to modeling. Correlations between covariates might have made the choice of particular covariates arbitrary to some extent. It is generally difficult to identify which of the body size descriptors are most appropriate. 24 Although the lemborexant model included BMI, the suvorexant model included BMI and sex, and the daridorexant model included lean body weight and fat mass.
Clinically, none of the results suggested the need of dose adaptation for specific patient populations.
Body composition as covariate
The results of the daridorexant model suggested that lean body weight and fat mass should be considered as candidate covariates for the description of body size, offering a physiological characterization for lipophilic compounds if the peripheral volume is considered to be fat mass.
For medical purposes, body composition is frequently divided into lean body weight (or lean body mass) and fat mass. Body composition measurements are generally labor intensive (e.g., using dual‐energy x‐ray absorptiometry, i.e., DEXA scanning) such that formulae were derived for estimation of body composition based on easily accessible parameters such as body weight and height. 12 , 23 , 29 , 30 , 31 Janmahasatian et al. 12 provided an estimation method for lean body weight with individual characteristics that are commonly measured in clinical studies, that is, body weight, age, and sex. This formula was used in the current analysis to estimate lean body weight. Fat mass was derived from the difference between total body weight and lean body weight. Further details on alternative estimation methods and R code are provided in Appendix S1.
BMI is considered to be another estimator for the percentage of body fat. 32 , 33 Ranasinghe et al. 34 concluded that age and sex should be taken into account when using BMI to predict body fat percentage. Using lean body weight and fat mass therefore offers a convenient reduction of the number of covariates for PK models because age and sex are adjusted for in the estimation of lean body weight.
These subject‐specific characteristics might further be used for a physiology‐based PK model to estimate pediatric exposure based on scaling to children using body composition (lean body weight and fat mass). 35 , 36 Practically, allometric scaling and dosing based on body weight appears simpler than deriving doses based on body composition but might not reflect the change in body composition between different ages in children as well as lean body weight and fat mass.
CONCLUSIONS
The subject‐specific characteristics of age and body composition (lean body weight and fat mass) as well as ALP were shown to influence the daridorexant exposure parameters AUC, t max, C max, and next‐morning concentration to a limited extent, that is, not more than 20% different from a typical subject. The effect of morning administration is not relevant for patient use of daridorexant. The food effect if daridorexant is taken simultaneously with high‐fat, high‐calorie food is an extreme‐case scenario unlikely to occur in clinical practice. Clinical implications of differences in daridorexant concentrations between subjects with different characteristics are therefore considered negligible.
Lean body weight and fat mass are suggested as candidate covariates for body size (i.e., central and peripheral volumes of distribution) in lieu of body weight, height, BMI, age, and sex for lipophilic compounds. These might allow for a physiology‐based characterization of the PK in pediatric patients, reflecting changes in body composition during maturation.
The population PK models for the three DORAs daridorexant, lemborexant, and suvorexant show differences at all model components, the structural models, and the covariates determined to influence exposure to drug.
AUTHOR CONTRIBUTIONS
A.K. and J.M.B. wrote the manuscript. A.K., D.L., C.M., and J.D. designed the research. A.K., D.L., J.M.B., C.M., and J.D. performed the research. A.K., D.L., and J.M.B. analyzed the data.
FUNDING INFORMATION
The studies included for analysis were funded by Actelion Pharmaceuticals Ltd (the predecessor of Idorsia Pharmaceuticals Ltd) or Idorsia Pharmaceuticals Ltd.
CONFLICT OF INTEREST
All authors were employees and/or shareholders of Actelion Pharmaceuticals Ltd and/or Idorsia Pharmaceuticals Ltd during study conduct.
Supporting information
Appendix S1
ACKNOWLEDGMENTS
The authors gratefully acknowledge support by Andrea Henrich and Alexandre Mathis (Idorsia Pharmaceuticals Ltd, Allschwil, Switzerland) as well as Geraldine Cellière and Pauline Traynard (Lixoft, Antony, France).
Krause A, Lott D, Brussee JM, Muehlan C, Dingemanse J. Population pharmacokinetic modeling of daridorexant, a novel dual orexin receptor antagonist. CPT Pharmacometrics Syst Pharmacol. 2023;12:74‐86. doi: 10.1002/psp4.12877
REFERENCES
- 1. American Psychiatric Association . Diagnostic and Statistical Manual of Mental Disorders. American Psychiatric Association Publishing; 2022. doi: 10.1176/appi.books.9780890425787 [DOI] [Google Scholar]
- 2. Riemann D, Spiegelhalder K. Orexin receptor antagonists: a new treatment for insomnia? Lancet Neurol. 2014;13:441‐443. [DOI] [PubMed] [Google Scholar]
- 3. Muehlan C, Vaillant C, Zenklusen I, Kraehenbuehl S, Dingemanse J. Clinical pharmacology, efficacy, and safety of orexin receptor antagonists for the treatment of insomnia disorders. Expert Opin Drug Metab Toxicol. 2020;16:1063‐1078. [DOI] [PubMed] [Google Scholar]
- 4. United States Food and Drug Administration . Highlights of prescribing information: Quviq (daridorexant) tables, for oral use. 2022. https://www.accessdata.fda.gov/drugsatfda_docs/label/2022/214985s000lbl.pdf. Accessed September 22, 2022.
- 5. European Medicines Agency . Quviviq (daridorexant). 2022. https://www.ema.europa.eu/en/medicines/human/EPAR/quviviq. Accessed September 22, 2022.
- 6. Mignot E, Mayleben D, Fietze I, et al. Safety and efficacy of daridorexant in patients with insomnia disorder: results from two multicentre, randomised, double‐blind, placebo‐controlled, phase 3 trials. Lancet Neurol. 2022;21:125‐139. [DOI] [PubMed] [Google Scholar]
- 7. Treiber A, de Kanter R, Roch C, et al. The use of physiology‐based pharmacokinetic and pharmacodynamic modeling in the discovery of the dual orexin receptor antagonist ACT‐541468. J Pharmacol Exp Ther. 2017;362:489‐503. [DOI] [PubMed] [Google Scholar]
- 8. Muehlan C, Heuberger J, Juif PE, Croft M, van Gerven J, Dingemanse J. Accelerated development of the dual orexin receptor antagonist ACT‐541468: integration of a microtracer in a first‐in‐human study. Clin Pharmacol Ther. 2018;104:1022‐1029. [DOI] [PubMed] [Google Scholar]
- 9. Boof ML, Alatrach A, Ufer M, Dingemanse J. Interaction potential of the dual orexin receptor antagonist ACT‐541468 with CYP3A4 and food: results from two interaction studies. Eur J Clin Pharmacol. 2019;75:195‐205. [DOI] [PubMed] [Google Scholar]
- 10. Kuhn E, Lavielle M. Maximum likelihood estimation in nonlinear mixed effects models. Comput Stat Data Anal. 2005;49:1020‐1038. [Google Scholar]
- 11. Harrell FE Jr. Regression Modeling Strategies: With Applications to Linear Models, Logistic and Ordinal Regression, and Survival Analysis. Springer; 2015. [Google Scholar]
- 12. Janmahasatian S, Duffull SB, Ash S, Ward LC, Byrne NM, Green B. Quantification of lean bodyweight. Clin Pharmacokinet. 2005;44:1051‐1065. [DOI] [PubMed] [Google Scholar]
- 13. Prague M, Lavielle M. SAMBA: A novel method for fast automatic model building in nonlinear mixed‐effects models. CPT Pharmacometrics Syst Pharmacol. 2022;11:161‐172. [DOI] [PMC free article] [PubMed] [Google Scholar]
- 14. Ayral G, Si Abdallah JF, Magnard C, Chauvin J. A novel method based on unbiased correlations tests for covariate selection in nonlinear mixed effects models: The COSSAC approach. CPT Pharmacometrics Syst Pharmacol. 2021;10:318‐329. [DOI] [PMC free article] [PubMed] [Google Scholar]
- 15. Lalovic B, Majid O, Aluri J, Landry I, Moline M, Hussein Z. Population pharmacokinetics and exposure‐response analyses for the most frequent adverse events following treatment with lemborexant, an orexin receptor antagonist, in subjects with insomnia disorder. J Clin Pharmacol. 2020;60:1642‐1654. [DOI] [PMC free article] [PubMed] [Google Scholar]
- 16. Lixoft Automatic covariate model building. 2019. http://monolix.lixoft.com/model‐building/automatic‐covariate‐model‐building/. Accessed September 22, 2022.
- 17. R Development Core Team . R: A language and environment for statistical computing. 2019. https://www.r‐project.org/. Accessed September 22, 2022. [Google Scholar]
- 18. Lixoft Monolix Documentation. 2020. http://monolix.lixoft.com/. Accessed September 22, 2022.
- 19. Delyon B, Lavielle M, Moulines E. Convergence of a stochastic approximation version of the EM algorithm. Ann Stat. 1999;27:94‐128. [Google Scholar]
- 20. Macey, R. I. & Oster, G. F. Berkeley Madonna 8.3.18. 8.3.18. 2009.
- 21. Krause A, Lowe P. Visualization and communication of pharmacometric models with berkeley madonna. CPT Pharmacom Syst Pharmacol. 2014;3:1‐20. [DOI] [PMC free article] [PubMed] [Google Scholar]
- 22. Lixoft Simulx documentation. 2020. https://simulx.lixoft.com/. Accessed September 22, 2022.
- 23. Lee DH, Keum NN, Hu FB, et al. Development and validation of anthropometric prediction equations for lean body mass, fat mass and percent fat in adults using the National Health and Nutrition Examination Survey (NHANES) 1999‐2006. Br J Nutr. 2017;118:858‐866. [DOI] [PubMed] [Google Scholar]
- 24. Bonate PL. Effect of correlation on covariate selection in linear and nonlinear mixed effect models. Pharm Stat. 2017;16:45‐54. [DOI] [PubMed] [Google Scholar]
- 25. Lindenmeyer CC. Laboratory tests of the liver and the gallbladder. MSD Man. 2022. https://www.msdmanuals.com/professional/hepatic‐and‐biliary‐disorders/testing‐for‐hepatic‐and‐biliary‐disorders/laboratory‐tests‐of‐the‐liver‐and‐gallbladder. Accessed September 22, 2022. [Google Scholar]
- 26. FDA Suvorexant clinical pharmacology and biopharmaceutics review(s). 2014. https://www.accessdata.fda.gov/drugsatfda_docs/nda/2014/204569Orig1s000ClinPharmR.pdf. Accessed September 22, 2022.
- 27. FDA Multi‐discipline review and evaluation of Dayvigo (lemborexant). 2019. https://www.accessdata.fda.gov/drugsatfda_docs/nda/2019/212028Orig1s000MultidisciplineR.pdf. Accessed September 22, 2022.
- 28. Suvorexant . Highlights of prescribing information: belsomra (suvorexant) tables, for oral use. 2014. https://www.accessdata.fda.gov/drugsatfda_docs/label/2014/204569s000lbledt.pdf. Accessed September 22, 2022.
- 29. Hume R. Prediction of lean body mass from height and weight. J Clin Pathol. 1966;19:389‐391. [DOI] [PMC free article] [PubMed] [Google Scholar]
- 30. James WPT. Research on obesity. Nutr Bull. 1977;4:187‐190. [Google Scholar]
- 31. Boer P. Estimated lean body mass as an index for normalization of body fluid volumes in humans. Am J Physiol – Ren Fluid Electrolyte Physiol. 1984;16:F632‐F636. [DOI] [PubMed] [Google Scholar]
- 32. Deurenberg P, Andreoli A, Borg P, et al. The validity of predicted body fat percentage from body mass index and from impedance in samples of five European populations. Eur J Clin Nutr. 2001;55:973‐979. [DOI] [PubMed] [Google Scholar]
- 33. Geliebter A, Atalayer D, Flancbaum L, Gibson CD. Comparison of body adiposity index (BAI) and bmi with estimations of % body fat in clinically severe obese women. Obesity. 2013;21:493‐498. [DOI] [PMC free article] [PubMed] [Google Scholar]
- 34. Ranasinghe C, Gamage P, Katulanda P, Andraweera N, Thilakarathne S, Tharanga P. Relationship between Body mass index (BMI) and body fat percentage, estimated by bioelectrical impedance, in a group of Sri Lankan adults: a cross sectional study. BMC Public Health. 2013;13:797. [DOI] [PMC free article] [PubMed] [Google Scholar]
- 35. Hudda MT et al. Development and validation of a prediction model for fat mass in children and adolescents: meta‐analysis using individual participant data. BMJ. 2019;366:l4293. [DOI] [PMC free article] [PubMed] [Google Scholar]
- 36. Wells J, Cole T. Adjustment of fat‐free mass and fat mass for height in children aged 8 y. Int J Obes (Lond). 2002;26:947‐952. [DOI] [PubMed] [Google Scholar]
- 37. Cockcroft DW, Gault MH. Prediction of creatinine clearance from serum creatinine. Nephron. 1976;16:31‐41. [DOI] [PubMed] [Google Scholar]
Associated Data
This section collects any data citations, data availability statements, or supplementary materials included in this article.
Supplementary Materials
Appendix S1