Abstract
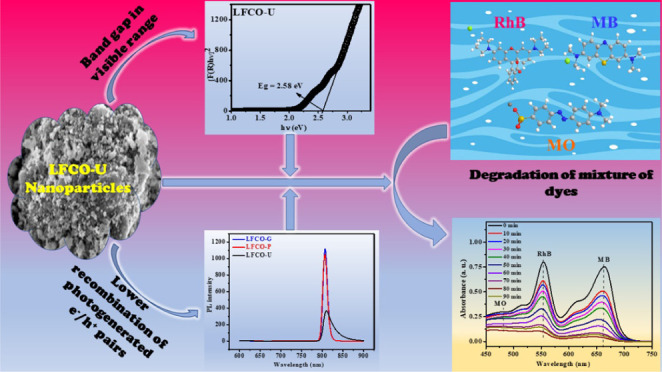
The present study reports the synthesis of nanocrystalline LaFe0.5Cr0.5O3 via a solvent-free combustion method using glycine, poly(vinyl alcohol), and urea as fuels, with superior photocatalytic activity. Rietveld refinement and powder X-ray diffraction data of nanomaterials demonstrate the existence of an orthorhombic phase that corresponds to the Pbnm space group. The crystallite size of nanoperovskite samples lies in the range of 20.9–36.4 nm. The Brunauer–Emmett–Teller (BET) surface area of the LaFe0.5Cr0.5O3 fabricated using urea is found to be higher than that of the samples prepared using other fuels. The magnetic measurements of all samples done using a SQUID magnetometer showed a dominant antiferromagnetic character along with some weak ferromagnetic interactions. The optical band gap of all nanosamples lies in the visible range (2–2.6 eV), making them suitable photocatalysts in visible light. Their use as a photocatalyst for the degradation of the rhodamine B dye (model pollutant) is studied, and it has been observed that the catalyst fabricated using urea shows excellent degradation efficiency for rhodamine B, i.e., 99% in 60 min, with high reusability up to five runs. Additionally, the degradation of other organic dyes such as methylene blue, methyl orange, and a mixture of these dyes (rhodamine B + methylene blue + methyl orange) is also investigated with the most active photocatalyst, i.e., LFCO-U, to check its versatility.
1. Introduction
Extremely rapid and active research efforts over the past decade are concentrated on the synthesis of nanostructures with the desired electronic, magnetic, optical, and catalytic properties.1−4 Binary oxide nanoparticles have been largely explored for such dimension-dependent properties, but ternary systems have not been studied very much in such a way.5−9 It is probably due to the problem in successful fabrication of ternary nanomaterials with the desirable stoichiometry and size. Mixed metal oxides with a perovskite-type structure (ABO3) are essential for their application in sensors, fuel cell, electrode materials, etc. Lanthanum perovskites containing the 3d transition metal series hold a tactical research area because of their diverse technological potential in the areas of solid oxide fuel cells, catalysts, gas sensors, magneto-optic or magneto-resistant properties, etc.10−12 These above-mentioned properties can be tuned by innumerable possibilities of chemical substitutions in the A- or B-site of the perovskite structure. Such a chemical substitution causes changes in the ionic radii and valencies of A- and B-site cations, which ultimately modify the structural features and electronic states of perovskite oxides. Among perovskite oxides, lanthanum orthoferrite (LaFeO3) is a promising material for its electrical, magnetic, and photocatalytic properties and is explored for these properties by several groups of researchers.13−17 LaFeO3 perovskite oxide crystallizes in the orthorhombic symmetry with the Pbnm space group. The magnetic properties of LaFeO3 showed an antiferromagnetic character with a high Néel temperature (TN) of 740 K.18 The superexchange interactions due to Fe3+–O–Fe3+ result in antiferromagnetism in LaFeO3.19 Treves et al.20 reported TN = 738 K for LaFeO3 with a considerably small magnetization of 0.044 μB/Fe. The uncompensated surface spins are responsible for the low magnetization in antiferromagnetic materials.21,22 Furthermore, substitution on the B-site of LaFeO3 leads to improvement in its properties. To enhance the physical properties of LaFeO3, solid solutions of LaFeO3 and LaCrO3 have been studied by several groups of researchers.23−28 Azad et al.25 have investigated the structure of the Cr3+-substituted lanthanum ferrite perovskite (LaFe0.5Cr0.5O3), and its magnetization measurement results reveal the overall antiferromagnetic behavior of the synthesized compound. A magnetic cluster state has been found near the transition temperature TN = 265 K due to the weak uncompensated magnetic moment. In addition to this, Hu along with his co-authors have studied the magnetic properties of LaFe1–xCrxO3 (0 ≤ x ≤ 1) series.27 They demonstrate that the magnetization varies with the doping of Cr3+ and becomes maximum for the sample at x = 0.5. Furthermore, the weak ferromagnetic interaction in samples with x = 0–0.9 is attributed to the Fe–O–Cr superexchange and Fe–O–Fe antisymmetric exchange interactions. The M versus H curve of Cr3+-substituted LaFeO3 also shows a weak ferromagnetism in the temperature range of 5–300 K. The temperature-dependent magnetic studies manifested the irreversibility in the ZFC-FCC curve, which is ascribed to the antiferromagnetism and ferromagnetism exchange interactions.28
In recent years, heterogeneous photocatalysis has gained a lot of attention due to its potential applications in many fields such as the generation of renewable and sustainable hydrogen fuel, degradation of organic pollutants, and CO2 photoreduction.29−37 Among the aforementioned applications, photodegradation of synthetic organic dyes, pharmaceutical goods, etc., have received a lot of interest since they are manufactured in vast quantities all over the world and are continually affecting the environment.38 Organic dyes such as rhodamine B, methylene blue, and methyl orange have potential applications in photographic, textile, paper, and leather industries. It is very important to treat these dyes in wastewater, as they cause carcinogenicity and neural and reproductive toxicity in humans and animals. Perovskite oxides have been proved to be very promising photocatalysts for the treatment of organic water contaminants.39−41 For instance, nanocrystalline LaFeO3 is extensively used as a photocatalyst for dye degradation.13,16,42−45 It has shown better photocatalytic efficiency than that of the P25 photocatalyst because of its narrow optical band gap.43 Again, Kumar et al.44 have reported 83% photocatalytic degradation of methyl orange in 180 min using LaFeO3 nanospheres.
The crystallite size/surface area of perovskite oxides can be managed by the fabrication method. These types of nanostructured orthoferrites can be prepared by hydrothermal synthesis,46 coprecipitation,47 sol–gel process,48 and other methods.49 Among all methods, the combustion approach has been the most commonly employed because it is cheap, requires little preparation time, uses less energy during synthesis, and is environmentally friendly also.
Among perovskite oxides, LaFeO3 is one of the most studied perovskite oxides in the field of photocatalysis, owing to its high stability, nontoxicity, and suitable band gap energy values that lie in the range of visible light. The photocatalytic activity of LaFeO3 can further be improved by doping Cr3+ at the Fe3+ site, as Cr3+ promotes conversion of Fe3+ to Fe2+ and eventually, Fe2+ causes a photo-Fenton-type reaction, which is responsible for photodegradation.50 In addition to this, LaFeO3 possesses an antiferromagnetic character due to Fe3+–O–Fe3+ interactions and Cr3+ substitution at the Fe site can introduce Fe3+–O–Cr3+ double-exchange ferromagnetic interactions, thereby causing a drastic change in magnetic properties. In view of this, we have synthesized nanocrystalline Cr-doped lanthanum orthoferrite LaFe0.5Cr0.5O3 by a combustion method using different fuels because it is a simpler process, yielding pure products, and significantly saves time and energy consumption over traditional methods. The photocatalytic activity of nano-LaFe0.5Cr0.5O3 perovskite oxides was investigated for the removal of different organic dyes from water in their unitary and ternary solutions. Rhodamine B was selected as a model pollutant, and under the same optimized conditions, methylene blue, methyl orange, and their mixture were photocatalytically degraded. In this article, the comparative impact of different fuels on the structural, optical, magnetic, and photo-oxidative degradation of dyes was discussed. Furthermore, surface area, photoluminescence spectroscopy, and optical band gap studies were used to evaluate the efficiency of the prepared nanoperovskites as photocatalysts. The LaFe0.5Cr0.5O3 nanocatalyst can act as a multifunctional catalyst in the realm of photocatalysis, which can be used to tackle environmental problems due to its straightforward and effective technique of manufacturing.
2. Experimental Section
2.1. Materials and Reagents
The chemicals used in the present work, such as lanthanum nitrate hexahydrate (99.9%) [La(NO3)3·6H2O], iron nitrate nonahydrate (>98%) [Fe(NO3)3·9H2O], chromium nitrate nonahydrate (98.5%) [Cr(NO3)3·9H2O], glycine (99%), poly(vinyl alcohol) (PVA) (98–99%), urea (99%), rhodamine B (RhB), and hydrogen peroxide (27% w/w), were purchased from Alfa Aesar. Methylene blue (MB) and methyl orange (MO) were from Loba Chemie. All the chemicals were reagents of analytical quality and were used directly without further purification.
2.2. Synthesis of LaFe0.5Cr0.5O3
LaFe0.5Cr0.5O3 materials were fabricated by a nitrate combustion method. In a typical preparation procedure, stoichiometric amounts of metal nitrates and fuel were taken and mixed together in an agate mortar and pestle for about 2 h to get better homogeneity. Due to the hygroscopic properties of metal nitrates, a slurry was formed, which was then transferred to a beaker and heated on a hot plate at 80 °C till a gel was produced. The gel was further heated in an oven at a suitable temperature depending on the nature of fuel used. In the case of glycine, combustion takes place at 120 °C, yielding a fluffy product in the beaker. However, for both poly(vinyl alcohol) and urea, combustion nearly occurred between 240 and 250 °C. These samples were subjected to further heat treatment at 700 °C for 4 h to obtain reddish-brown products. In this method, no water was used during the preparation of the precursor solution to get rid of impurities produced by water completely. The materials fabricated using glycine, PVA, and urea fuels were labeled as LFCO-G, LFCO-P, and LFCO-U, respectively.
The exothermic reactions for the desired composition with each fuel are shown as follows:
The reaction using urea as a fuel is
The reaction using poly(vinyl alcohol) (PVA) as a fuel is
The reaction using glycine as a fuel is
2.3. Material Characterization
Thermogravimetric analysis (TGA) was conducted under a nitrogen atmosphere using a Perkin Elmer thermal analyzer (STA-6000). The materials were heated from 10 to 900 °C at a heating rate of 10 °C per minute. The phase constitution of the prepared nanosamples was determined by means of Bruker D8-advance X-ray powder diffraction (XRD) using Cu Kα radiation (λ = 1.5406 Å) at room temperature, and data were collected in a 2θ scan range from 10 to 100° with 0.02° step size. The Rietveld structural refinement technique was used to calculate the structural parameters for each sample using the GSAS program. The shape, morphology, and purity of the synthesized nanosamples were studied using field emission scanning electron microscopy (FE-SEM) and energy dispersive X-ray spectroscopy (EDS) on a Zeiss EVO18 LaB6 filament scanning electron microscope. High-resolution transmission electron microscopy (HRTEM) was conducted to determine the particle size using a TEM CM 200 (Philips) microscope operated at 200 kV. The specific surface area, pore size, and pore volume of nanomaterials were characterized using the Brunauer–Emmett–Teller (BET) method using a BELSORP MINIX utilizing nitrogen gas at 77 K. Degassing of the samples was done at 180 °C prior to the BET surface area measurements. The UV–vis diffuse reflectance spectra for calculating the band gap of the samples were recorded using a UV–vis spectrometer (Perkin Elmer, model Lambda 1050+). Photoluminescence properties of the system were measured using a Hitachi F-4700 fluorescence spectrophotometer equipped with a Xe lamp as a light source. A Quantum Design SQUID magnetometer was used to measure the thermal variation of magnetization in the range of 10–300 K under both ZFC and FC conditions and the magnetization in relation to the applied magnetic field at 10 K.
2.4. Photocatalytic Experimental Details
A self-designed UV–visible reactor chamber was employed for the photocatalytic reaction using the visible light source 250 W Hg lamp with the wavelength greater than 400 nm (∼10 cm above the solution surface), which was positioned in the middle of a reaction vessel for ensuring the maximum degradation of the dye. In the experiment, 0.1 g of LaFe0.5Cr0.5O3 as a photocatalyst was added to 100 mL of RhB solution (10 ppm) in a 400 mL beaker. The suspensions were stirred in the dark for an optimized time of 60 min to ensure the establishment of absorption–desorption equilibrium between the photocatalyst and RhB. Furthermore, 1 mL of H2O2 was added to the reaction mixture, which was then subjected to visible light irradiation under continuous stirring. A total of 4 mL of the suspension was taken out and centrifuged after the specified time intervals. The supernatants were analyzed by monitoring the absorbance at 553 nm using a Perkin Elmer model Lambda 1050+ UV–vis spectrophotometer. To examine the recyclability and stability of the catalyst, the catalyst was rinsed with water and ethanol multiple times and dried in an oven. A similar procedure has been followed for photodegradation of MB, MO, and the mixture of dyes (RhB + MB + MO).
3. Results and Discussion
3.1. Thermogravimetric Analysis (TGA)
TGA measurements have been carried out to investigate the thermal behavior of the precursors dehydrated at 80 °C for all fuels, and the corresponding TGA profiles are depicted in Figure 1. The various stages such as adsorbed water molecules, combustion reactions, removal of combustion residue, phase transformation, and stabilization of the pure phase at higher temperatures can be analyzed by TGA plots. The weight loss for each dried precursor takes place mainly in three steps. TG curves of precursors of LFCO-G and LFCO-U show a weight loss of 6 and 8%, respectively, below 190 °C, while for the precursor of LFCO-P, the weight loss is 16% at ∼140 °C, which corresponds to the vaporization of the adsorbed water.51 Further heating of precursors causes an abrupt decomposition between 190 and 205 °C for LFCO-G, 190 and 450 °C for LFCO-U, and 140 and 500 °C for LFCO-P, and these are related to the combustion reaction between nitrates and fuels in dried precursors with the liberation of large amounts of gaseous products.51,52 The final and minimal weight losses for LFCO-G, LFCO-U, and LFCO-P in the temperature range of 205–690, 450–690, and 500–690 °C, respectively, could be attributed to the removal of organic residues.51 Furthermore, for higher temperature, no weight loss can be found, showing the formation and stabilization of phases.
Figure 1.
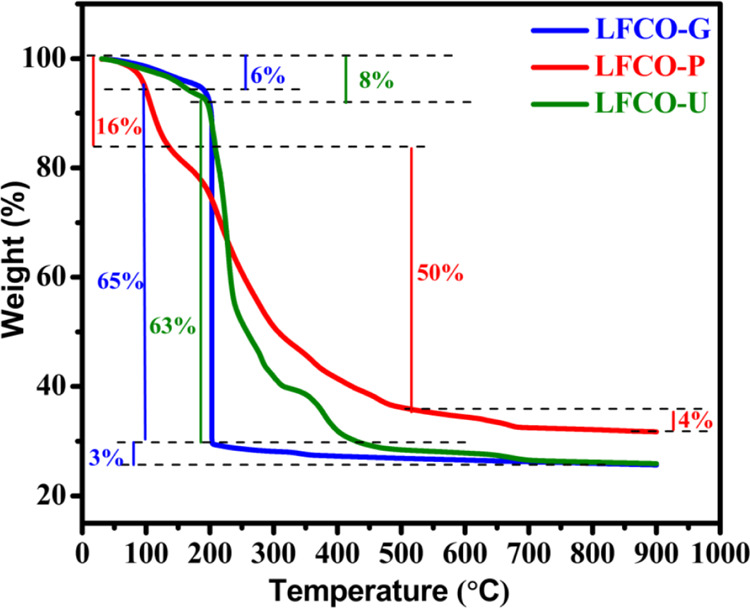
TGA curves of LFCO nanomaterials.
3.2. Powder X-ray Diffraction
Figure S1 presents the powder X-ray diffractograms of the synthesized materials, and the results reveal that all three materials crystallize in the Pbnm space group with an orthorhombic structure at room temperature. The observed peaks for LFCO-G are sharp and intense, which indicate its high crystalline nature, whereas in the case of LFCO-P and LFCO-U, comparatively slight broad and intense peaks are seen, confirming that they are more nanocrystalline than LFCO-G. Furthermore, no traces of impurities have been detected from the XRD pattern of all materials, which authenticates the monophase formation of the solid solutions observed within the detection limit of the XRD.
The average crystallite size was calculated from Scherrer’s formula53
| 1 |
where D, k (0.9), λ, β, and θ represent the crystallite size, dimensionless shape factor, wavelength of X-ray radiation, full width at half maximum of the most intense diffracted peak, and angle of diffraction, respectively. The crystallite sizes of the synthesized nanomaterials calculated using XRD data are listed in Table 1. The results show that the crystallite size of LFCO-G is higher than that of the other materials, ascribed to its higher decomposition temperature for the combustion reaction than that of other fuels.54,55
Table 1. Structural Parameters Obtained from the Rietveld Refinement of the X-ray Diffraction Pattern for LFCO Nanomaterialsa.
| compound | LFCO-G | LFCO-P | LFCO-U | |
|---|---|---|---|---|
| a (Å) | 5.5338(2) | 5.5336(11) | 5.5499(9) | |
| b (Å) | 5.5152(3) | 5.5141(11) | 5.4972(11) | |
| c (Å) | 7.8047(4) | 7.8013(16) | 7.7767(13) | |
| V (Å)3 | 238.20(2) | 238.04(8) | 237.26(7) | |
| x | La | –0.0071(4) | –0.0091(8) | –0.0094(6) |
| O(1) | 0.0746(29) | 0.074(6) | 0.082(4) | |
| O(2) | 0.7102(23) | 0.693(4) | 0.6926(28) | |
| y | La | 0.0241(4) | 0.0221(8) | 0.0218(6) |
| O(1) | 0.4946(29) | 0.494(6) | 0.502(4) | |
| O(2) | 0.2680(23) | 0.250(4) | 0.2504(28) | |
| z | O(2) | 0.0271(23) | 0.010(4) | 0.0095(28) |
| Uiso | La | 0.01600(4) | 0.01840(2) | 0.02278(4) |
| Fe/Cr | 0.00766(4) | 0.01076(3) | 0.01432(3) | |
| O(1) | 0.02856(5) | 0.03487(3) | 0.06996(3) | |
| O(2) | 0.02823(2) | 0.03834(5) | 0.02454(6) | |
| Rwp | 0.0669 | 0.0844 | 0.0688 | |
| Rp | 0.0522 | 0.0634 | 0.0526 | |
| χ2 | 1.677 | 2.238 | 1.479 | |
| D (nm) | 36.4 | 27.2 | 20.9 |
The atomic sites are La 4c[x, y,0.25]; Fe 4b[0.5,0,0]; Cr 4b[0.5,0,0]; O(1) 4c[x, y,0.25]; and O(2) 8d [x, y, z] in the space group Pbnm.
3.3. Structural Parameter Estimation by Rietveld Refinement
Using powder XRD data, the Rietveld refinement approach via GSAS software was utilized to evaluate the crystal structure and lattice parameters. The structural refinement has been carried out in the orthorhombic setting with La 4c[x, y, 0.25], Fe/Cr 4b[0.5, 0, 0], O(1) 4c[x, y, 0.25], and O(2) 8d[x, y, z] in the space group Pbnm. The XRD patterns were typically refined for the lattice parameters, scale factor, backgrounds, pseudo-Voigt profile function (u, v, and w), atomic coordinates, and isothermal temperature factors (Uiso). The Rietveld refinement plots shown in Figure 2 reveal that there is good agreement between the observed and calculated patterns, which is based on the consideration of lower Rp and Rwp values. The refinement results consisting of structural parameters along with the residuals for the weighted pattern Rwp, the pattern Rp, and the goodness of fit χ2 of all the samples are listed in Table 1. The refinement results show that the structural parameters are in good agreement with the samples of the same composition reported previously.56 It has been found that the lattice parameters of the synthesized samples are lower than those of the reported LaFeO3, thus confirming the doping of smaller Cr3+ ions in the place of comparatively larger Fe3+ ions at the B-site.57 The selected bond lengths, bond angles, and their averages are given in Table S1. The results show that the average ⟨Fe/Cr O⟩ bond lengths are quite similar and virtually do not change when using different fuels. These are found to be in good agreement with the theoretical value (1.98 Å) calculated using Shannon radii for Fe3+ and Cr3+ in the high spin state with a coordination number of 6. These results are consistent with the fixed valence of Fe and Cr, confirming that valency is a major parameter controlling the bond length. The values of average ⟨Fe/Cr O Fe/Cr⟩ bond angles indicate that there is a considerable distortion in the (Fe/Cr)O6 octahedra of all the samples.
Figure 2.
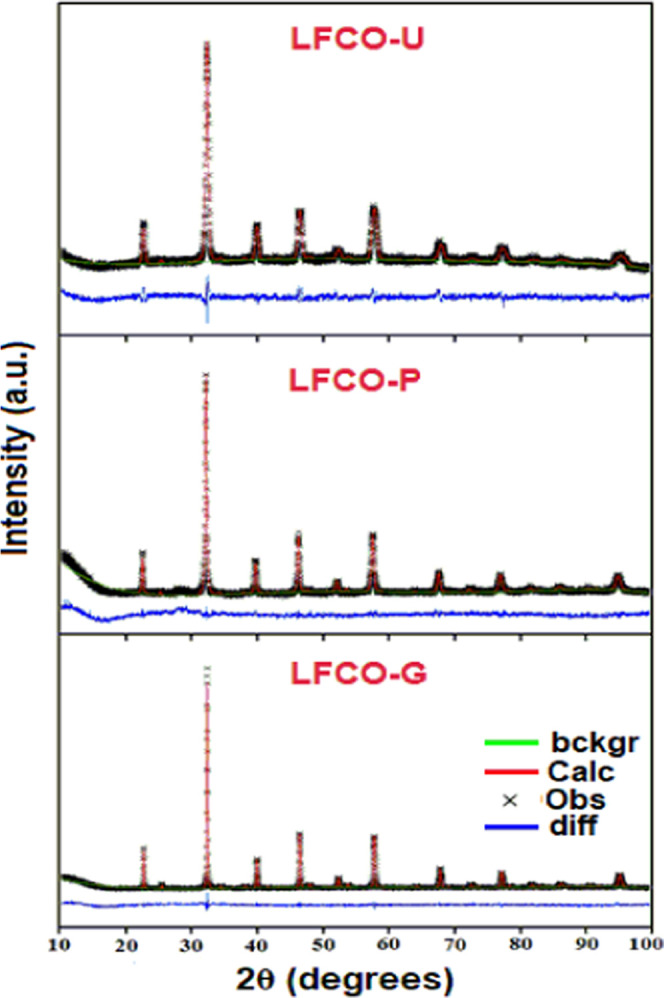
Rietveld Refinement profile for the P-XRD patterns of LFCO nanomaterials.
3.4. BET Surface Area
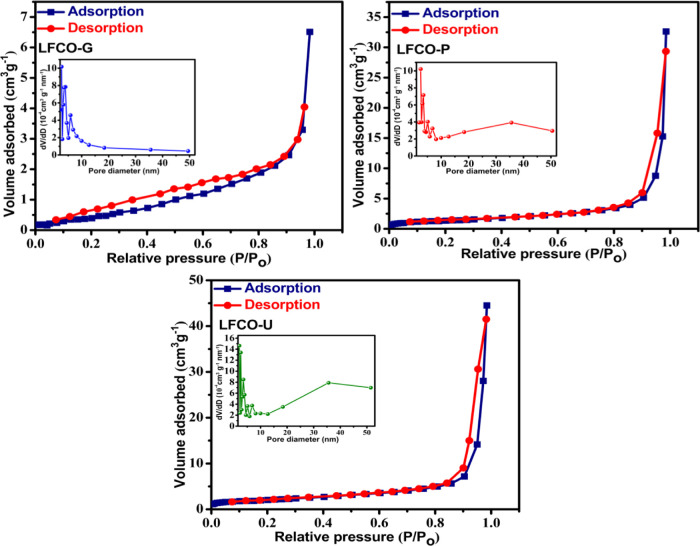
Surface area has a considerable effect on the magnetic properties and catalytic activity, and the same can be determined by N2 physisorption. The BET surface area, total pore volume, and mean pore diameter obtained for the synthesized nanomaterials are presented in Table 2. The sorption experiment on the activated phase of all materials revealed a type IV isotherm (Figure 3) according to the IUPAC classification, demonstrating a mesoporous structure.58 The loops did not show any saturated adsorption at high P/P0, further supporting the mesoporous character of the materials. The LFCO-G has the lowest surface area and the smallest total pore volume among all the materials because of the high flame decomposition temperature of glycine, which leads to the collapse of pores, and hence, reduction in the surface area and pore volume occurs.54,55,59 In addition to this, LFCO-U shows a significantly high N2 uptake among all materials, indicating well-developed porosity. BET results are also supported by crystallite size obtained from XRD data (Table 1). LFCO-U has the highest surface area among all the samples, attributed to its lowest crystallite size. The insets of Figure 3 represent the pore size distribution curves for the desorption branch of isotherms for all nanomaterials. It has been observed that the pore size is concentrated in the range of 2–20 nm for all LFCO samples, indicating the presence of the mesoporous structure in the synthesized nanomaterials.
Table 2. BET Surface Area, Total Pore Volume, and Mean Pore Diameter for LFCO Nanomaterials.
| compound | BET surface area (m2/g) | total pore volume (cm3/g) | mean pore diameter (nm) |
|---|---|---|---|
| LFCO-G | 1.82 | 1.01 × 10⁻² | 22.171 |
| LFCO-P | 4.66 | 5.05 × 10⁻² | 43.307 |
| LFCO-U | 7.33 | 6.88 × 10⁻² | 37.579 |
Figure 3.
BET adsorption–desorption isotherms for LFCO nanomaterials. The insets in each isotherms show the BJH pore size distribution curves.
3.5. Elemental Purity and Morphological Analysis
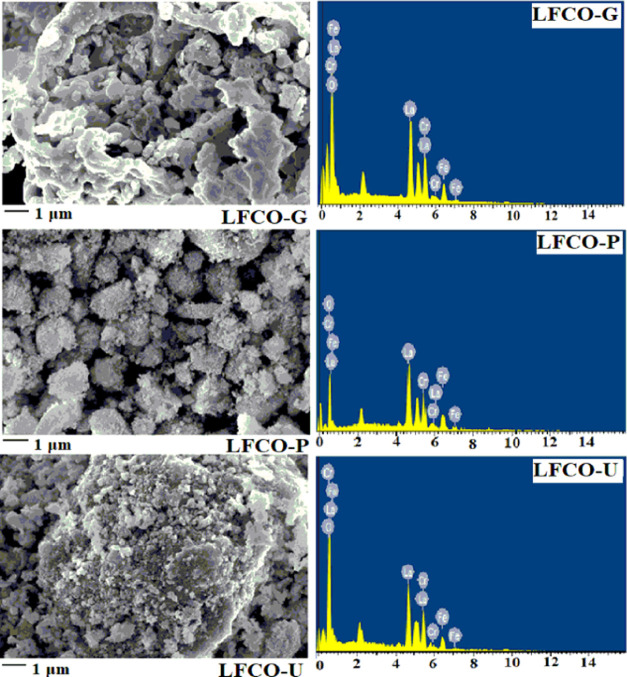
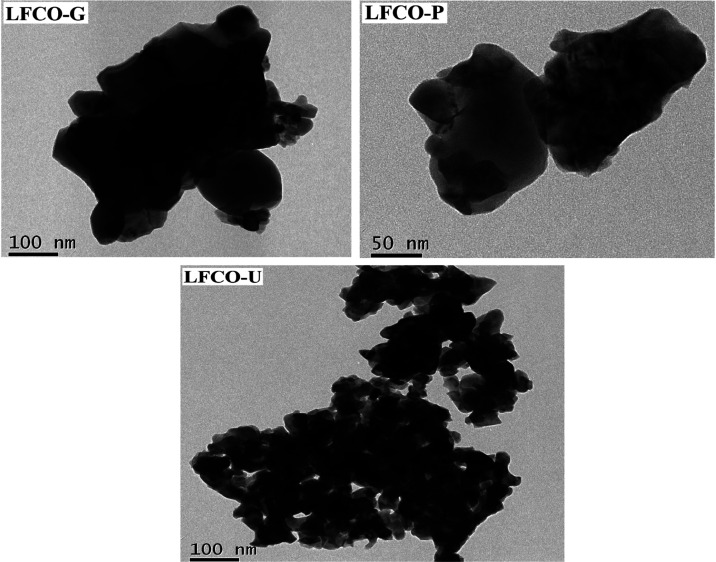
Examination of the nanomaterials in SEM images reveals that all the material particles have nearly roundish shapes (Figure 4). In LFCO-G, a recognizable agglomeration of irregular-shaped particles has been observed comparatively to other materials. A close inspection of the SEM images sharply indicates the higher porosity in LFCO-P and LFCO-U than that in LFCO-G. The EDX patterns of the phases are displayed in Figure 4, and the values of the experimental elemental compositional mass percentage and the theoretical ones are concluded in Table 3. The EDX results confirm the proposed chemical composition with the expected presence of La, Fe, Cr, and O and also ensured that no additional impurity is obtained during the preparation. HRTEM investigations (Figure 5) also reveal the surface structures of the synthesized nanomaterials. The average particle sizes of LFCO-G, LFCO-P, and LFCO-U obtained from the HRTEM micrographs are 60, 34, and 26 nm, respectively, indicating the agglomeration in the synthesized nanomaterials.
Figure 4.
SEM micrographs and EDX spectra of LFCO nanomaterials.
Table 3. EDX Results of the LFCO Nanomaterials.
| compound | LFCO-G | LFCO-P | LFCO-U | LFCO |
|---|---|---|---|---|
| elements | experimental mass % | experimental mass % | experimental mass % | theoretical mass % |
| La | 57.43 | 57.58 | 57.70 | 57.67 |
| Fe | 11.71 | 11.63 | 11.52 | 11.59 |
| Cr | 10.72 | 10.88 | 10.63 | 10.79 |
| O | 20.14 | 19.91 | 20.15 | 19.93 |
Figure 5.
High-resolution TEM images of LFCO nanomaterials.
3.6. Optical Properties
Figure S2 shows the UV–vis diffuse reflectance spectra (DRS) of LFCO nanoparticles synthesized using different fuels. The DRS response of all the materials is analogous to that of a similar type of perovskite structures60 and is attributed to the electronic transition from the valence band (O2p) to the conduction band (unoccupied 3d). Figure S2 reveals that the reflection of light occurs after 530 nm and continues to increase for all LFCO materials but is found to be maximum for LFCO-G. It is caused by the increased possibility of reflection for photons that lack the sufficient energy to interact with electrons or atoms. This indicates that absorption mainly occurs before 530 nm, and hence, all LFCOs could serve as potential visible light-driven photocatalytic materials.
The following relational expression is used to calculate the band gap and is given by Tauc, Mott, and Davis61
| 2 |
where h, v, α, Eg, and A are the Planck constant, frequency of vibration, absorption coefficient, band gap, and proportional constant, respectively. The values of the exponent n denote the nature of the sample transition. The values n = 1/2, n = 3/2, n = 2, and n = 3 are used for direct allowed transition, direct forbidden, indirect allowed, and indirect forbidden transition, respectively. The obtained diffuse reflectance data are converted to the Kubelka–Munk function F(R). Since the quantity F(R) is proportional to the absorption coefficient, α is replaced by F(R) in Tauc’s equation, and thus, in the actual experiment, eq 2 becomes
| 3 |
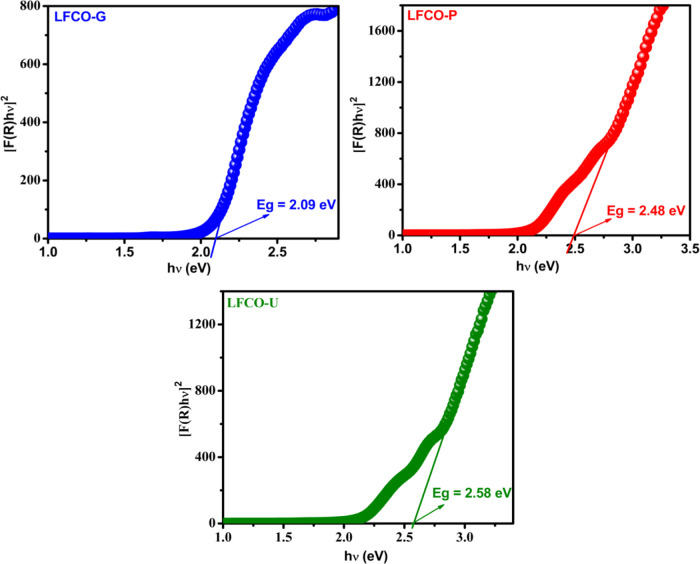
The direct allowed sample transition is generally used for perovskite materials to calculate the band gap as reported by a number of researchers.62−64 Therefore, in the present work, n = 1/2 is used to estimate Eg. A Tauc plot, i.e., a graph between the function [F(R)hv]2 and photon energy (hv) was plotted, and the linear part of the Tauc plot (Figure 6) is extrapolated to [F(R)hv]2 = 0 to get the band gap energy. The band gap energies of LFCO-G, LFCO-P, and LFCO-U nanomaterials are found to be 2.09, 2.48, and 2.58 eV respectively, which are comparable to the previously reported values.65 It is observed that with a decrease in the particle size, the band gap energy increases, which is attributed to the quantum confinement effect.66,67 Therefore, for the photocatalytic degradation of organic pollutants, these LFCO nanostructures have sufficient band gap energy that can be triggered by visible light.
Figure 6.
Tauc plot transformation of diffuse reflectance spectra of LFCO nanomaterials.
3.7. Magnetic Studies
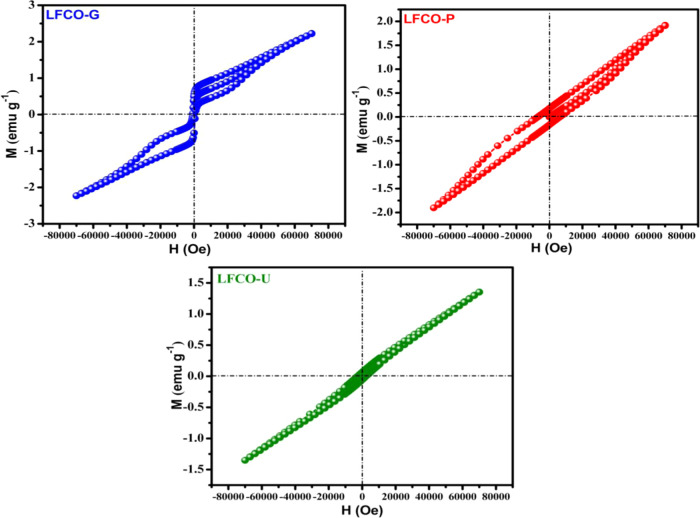
The field variation of magnetization up to 70 kOe at 10 K was performed for the synthesized nanosamples as shown in Figure 7. The linear relationship between magnetization (M) and magnetic field strength (H) suggests the antiferromagnetic behavior of the prepared samples. However, small hysteresis loops in the M vs H curves indicate the presence of some weak ferromagnetism in the samples. The coexistence of superexchange antiferromagnetic Fe3+–O–Fe3+ and Cr3+–O–Cr3+ and double-exchange ferromagnetic Fe3+–O–Cr3+ interactions is responsible for the weak ferromagnetic character in LFCO samples.68 Furthermore, the maximum magnetization (Mmax) for LFCO samples increases with an increase in the crystallite size as given in Table 4. This behavior is due to the fact that with the increase in the particle size of nanomaterials, the number of magnetic moments contributing to magnetization increases.69−71
Figure 7.
Variation of magnetization (M) with the applied field (H) for LFCO nanomaterials.
Table 4. Magnetic Parameters of the LFCO Nanomaterials.
| parameters | LFCO-G | LFCO-P | LFCO-U |
|---|---|---|---|
| Mmax(emu g–1) | 2.23 | 1.93 | 1.36 |
| TN (K) | 267 | 289 | |
| μeff(B.M.) | 4.25 | 3.42 | |
| θ (K) | –290 | –55 |
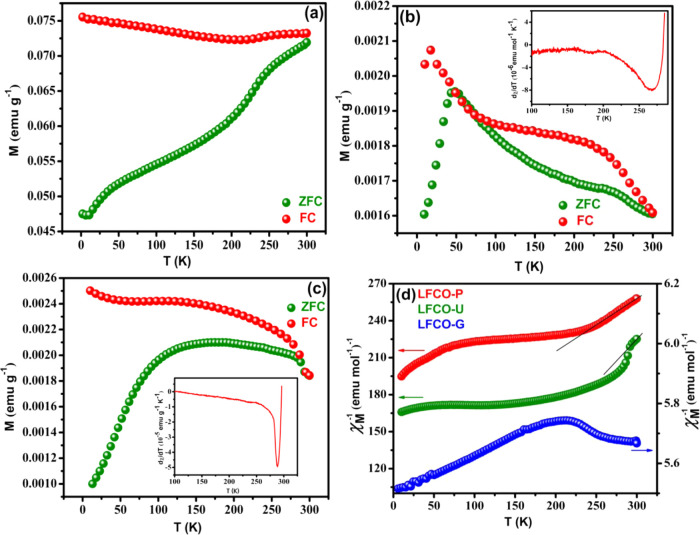
Zero-field-cooled (ZFC) and field-cooled (FC) magnetization in the 10–300 K temperature range was also performed for the synthesized samples under an applied magnetic field of 100 Oe, as presented in Figures 8a–c. All the synthesized materials show strong divergence between ZFC and FC curves due to the magnetic frustration between the antiferromagnetic and ferromagnetic characters. The ZFC-mode magnetization (MZFC) of LFCO-G shows a decrease in magnetization with a decrease in temperature. The MZFC for LFCO-P first increases up to 49 K and then starts decreasing with a decrease in temperature, while LFCO-U shows a broad peak in the range of 160–190 K and finally decreases with a decrease in temperature. The FC mode for all samples shows a positive magnetization and increases regularly with a decrease in temperature. The Néel temperature (TN) of samples was obtained from dχ/dT versus T plot, as presented in the inset of Figure 8b,c. The values of TN for LFCO-P and LFCO-U were found to be 267 and 289 K, respectively, but no such transition was observed for LFCO-G, which could be beyond the measurable range of the SQUID. It is important to mention that our synthesized nanophases have a much lower value of TN than that reported for LaFeO3 (750 K),72 which is understandable, as doping of Cr3+ in LaFeO3 weakens the AFM character by the introduction of the Fe3+–O–Cr3+ FM interaction. The variation of inverse molar susceptibility with temperature is presented in Figure 8d. It can be seen that the samples LFCO-P and LFCO-U obey the Curie–Weiss law in a very small temperature range above TN as shown in the linear fit in Figure 8d, while no such behavior is shown by LFCO-G. The Curie–Weiss law shows the relation between molar susceptibility and temperature as
| 4 |
where C is the Curie constant and θ is the Curie–Weiss constant. The value of C is provided by the slope of the linear fitted region as depicted in Figure 8d. The effective magnetic moment was then calculated by substituting the value of C in the equation μeff = 2.828√C. The theoretical value of the magnetic moment was predicted from the relation73,74
| 5 |
where μFe3+ (5.91 B.M.) and μCr3+ (3.87 B.M.) are the spin-only magnetic moments of Fe3+ and Cr3+ ions, respectively. The values of μeff for the phases LFCO-P and LFCO-U are summarized in Table 4, which are found to be smaller than the theoretical one (5 B.M.). Furthermore, the value of θ was determined by extrapolating the straight line fit to the temperature axis, and its values are also listed in Table 4. The negative values of θ and smaller values of μeff than those of μcal confirm the presence of antiferromagnetic interactions in the samples between the magnetic ions.
Figure 8.
Variation of magnetization as a function of temperature for (a) LFCO-G, (b) LFCO-P (inset showing the dχ/dT versus T plot), (c) LFCO-U (inset showing the dχ/dT versus T plot), and (d) plot of χM–1 versus T for LFCO nanomaterials.
3.8. Photocatalytic Activity of LFCO Materials
To evaluate the photocatalytic performance of nano-LFCO materials, photodegradation of RhB dye in aqueous solution as a model dye was studied.
3.8.1. Control Experiments
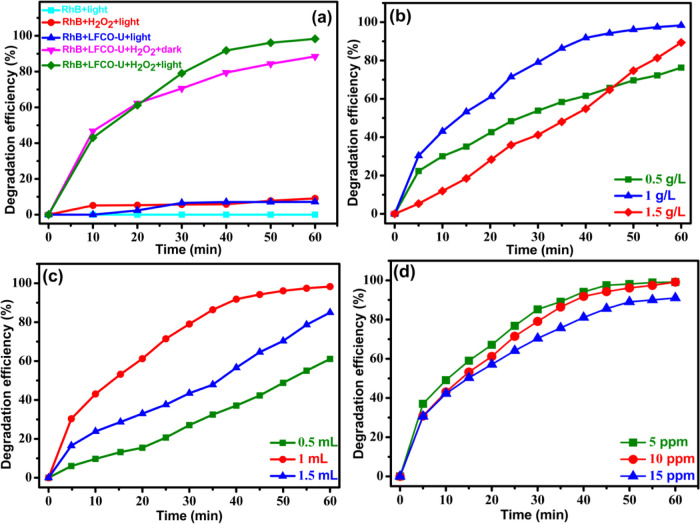
To achieve the favorable conditions for photodegradation of RhB, various components such as catalyst, hydrogen peroxide, and visible light have been considered. Different combinations of components such as RhB + light, RhB + light + H2O2, RhB + catalyst + light, RhB + catalyst + H2O2 + dark, and RhB + LFCO + H2O2 + light were considered, and their results are shown in Figure 9a. It has been found that the dye in the presence of light does not show any degradation in 60 min. About 10% degradation was obtained with H2O2 only, and a similar result is reported in the literature.75−77 When the catalyst was added to the dye solution in the presence of light without H2O2, about 8% degradation occurred. The degradation efficiency increases abruptly to 84% when the catalyst and the oxidant H2O2 were employed together in the dark for 60 min, which can be due to a Fenton-like process. However, degradation of RhB was found to be maximum, i.e., 99% in the same interval of time under visible light irradiation along with the catalyst and the oxidant H2O2. This significant acceleration in degradation in the presence of light is attributed to the combined effect of photocatalysis and the Fenton-like process. Hence, it was concluded that a catalyst, H2O2, and visible light are required variables for maximum degradation efficiency.
Figure 9.
(a) Control experiments for the degradation of the RhB dye and optimization of various reaction parameters: (b) catalyst dosage, (c) H2O2, and (d) initial dye concentration toward maximum degradation of RhB.
3.8.2. Optimization of Various Components
The photocatalytic degradation of the organic dye RhB in LFCO-H2O2 (catalyst–oxidant) system was mainly influenced by the catalyst dosage, oxidant dosage, and RhB concentration. Therefore, it is important to optimize these components to obtain the maximum photocatalytic degradation of RhB. Due to the higher surface area, LFCO-U has been preferred to optimize the above-said parameters for photocatalytic performance for degrading the RhB dye.
-
(a)
Optimization of the catalyst dosage: Photocatalytic degradation of the dye was examined by changing the catalyst dosage from 0.5 to 1.5 g/L, while other parameters were kept constant (1 mL of H2O2 and 100 mL of 10 ppm dye solution). Figure 9b depicts the impact of the catalyst dosage on RhB degradation when exposed to visible light. The results have shown that the degradation increases with the increase in the catalyst concentration from 0.5 to 1 g/L, which is attributed to the increase in the number of surface active sites on the photocatalyst.78 A further increase in the catalyst dosage declines the dye degradation. This downward trend of dye degradation is induced by blockage of penetration of visible light due to the large amount of catalyst in solution, which in turn causes a decrease in the OH• radical concentration.79 With further consideration of the fact that other parameters such as dye concentration and H2O2 dosages may affect the degradation, the optimized catalyst dosage considered was therefore 1 g/L.
-
(b)Optimization of oxidant dosage: To determine the appropriate amount of hydrogen peroxide (oxidant) for the degradation of RhB, three experiments were carried out with different amounts of hydrogen peroxide (0.5, 1, and 1.5 mL), keeping the other parameters constant (1 g/L catalyst and 100 mL of 10 ppm dye solution), and the results are depicted in Figure 9c. It has been found that as the amount of H2O2 is increased from 0.5 to 1 mL, the degradation efficiency of the photocatalyst is improved, increasing from 60 to 99%. However, a further increase in the H2O2 amount to 1.5 mL does not further enhance the degradation efficiency but rather decreases it from 99 to 85%. This reduction in dye degradation may be due to the excess amount of H2O2, which causes scavenging of OH• radicals, thus lowering the concentration of OH• radicals,80 and the process can be shown as

6
Thus, 1 mL of H2O2 was used further as the optimized amount for carrying out the dye degradation reactions.
7 -
(c)
Optimization of the dye concentration: The initial dye concentration was varied from 5 to 15 ppm to know its influence on photocatalysis at a constant catalyst amount (1 g/L) and oxidant dosage (1 mL), and the results are displayed in Figure 9d. The diminishing behavior of RhB photodegradation at a higher initial concentration (15 ppm) is possibly ascribed to the blocking effect of the adsorbed RhB molecules on light penetration. As the concentration of the dye is increased, light is absorbed by the dye molecules, and thus, light does not reach efficiently the catalyst surface, i.e., increased initial RhB concentration reduces the photon’s ability to reach the surface of the photocatalyst, which lowers the photodegradation efficiency. Furthermore, on decreasing the dye concentration from 10 to 5 ppm, the degradation efficiency remains the same as that of 10 ppm dye solution, and hence, 10 ppm was considered an optimized dye concentration.
Thus, 1 g/L catalyst dosage, 100 mL of 10 ppm RhB solution, and 1 mL of H2O2 were considered the optimum operating conditions, which can be further applied to compare the degradation efficiency of other LFCO catalysts. The photodegradation of MB, MO, and the ternary mixture of RhB, MB, and MO dyes has also been studied with LFCO-U under the same optimized conditions.
3.8.3. UV–Visible spectroscopy studies
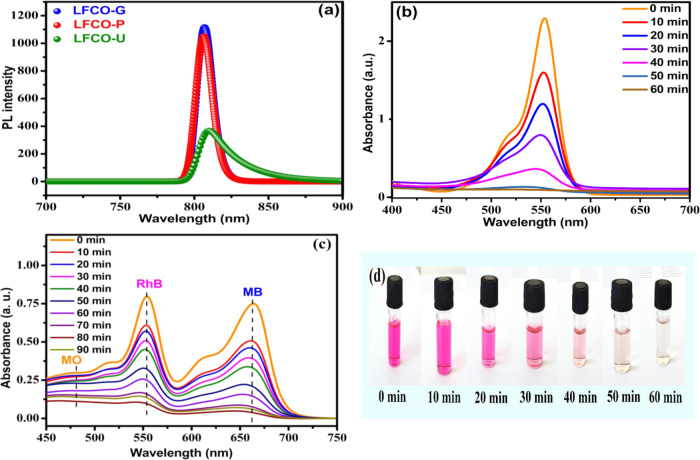
The UV–visible absorption maximum for the RhB dye was observed at 554 nm, which slowly declines with increasing light exposure and disappears in 60 min under the optimized conditions by the LFCO-U catalyst as illustrated in Figure 12b. This decline in absorption intensity with time is ascribed to the breakdown of chromophores, which give intense color to dyes. Furthermore, the same optimized conditions were applied for degradation of RhB by other catalysts also (LFCO-P and LFCO-G). For the LFCO-P catalyst, the RhB dye degrades completely in 70 min, but for LFCO-G, degradation becomes constant at 27% after 60 min. The graph for degradation of RhB under optimized conditions by different nano-LFCO catalysts is depicted in Figure 10.
Figure 12.
(a) Room temperature PL spectra of LFCO nanomaterials and time-dependent UV–vis spectra of (b) RhB dye, (c) mixture of dyes, and (d) discoloration on photodegradation of RhB.
Figure 10.
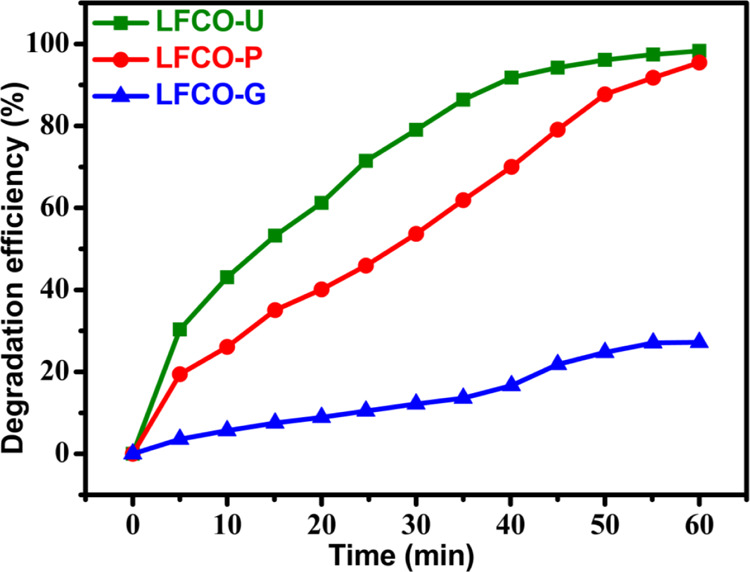
Photocatalytic activity of LFCO nanomaterials for degradation of the RhB dye.
The degradation percentage (D%) for RhB at a particular interval of time is obtained from UV–visible absorption spectra according to the formula
| 8 |
where A0 is the initial maximum absorbance and At is the absorbance at time, “t”.
Since LFCO-U is the most active photocatalyst for the degradation of the RhB dye, the photocatalytic activity of the LFCO-U catalyst is also checked for degradation of other organic dyes such as MB and MO and the mixture of RhB, MB, and MO, and their UV–visible absorption spectra are displayed in Figures S3, S4, and 12c, respectively.
3.8.4. Proposed Mechanism for Degradation of Dyes
The photocatalytic activity of LFCO catalysts toward the degradation of dyes in aqueous solution is mainly due to hydroxyl radicals (OH•). A significant degradation (∼84%) of the RhB dye by LFCO-U has been observed in the dark and can be explained by a Fenton-like process. In Fenton degradation, an iron-based catalyst activates H2O2 to generate hydroxyl radicals, causing an enhancement in the decomposition of dyes. The possible reactions occurring during this Fenton process are elaborated below [eqs 9–13]. The Fe3+ sites on the catalyst surface are reduced by H2O2, forming HOȮ, and generate Fe2+ ions, which in turn react with H2O2 to form OH• radicals, and finally, these radicals are responsible for the degradation of RhB. Also, there might be the joint role of Cr3+ and Fe3+ ions in the degradation of dyes. The Cr2+ ion formed by HOȮ radicals reduces Fe3+ to Fe2+, and subsequently, Fe2+ initiates the Fenton reaction.81
| 9 |
| 10 |
| 11 |
| 12 |
| 13 |
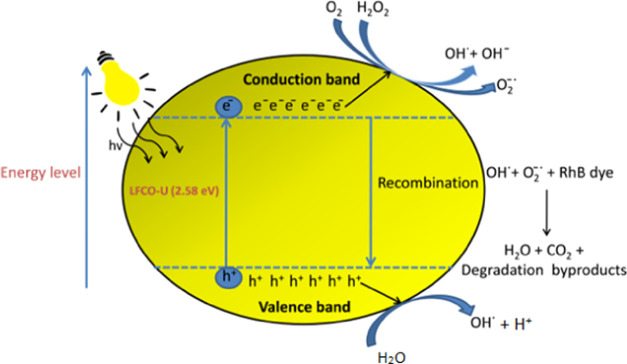
When the reaction mixture is exposed to visible light, two processes occur simultaneously for the degradation of dyes: (i) photocatalysis via photogenerated charges and (ii) Fenton-type reaction. In the presence of light, excitation of electrons from the valence band to the conduction band of the photocatalyst takes place, resulting in the formation of the electron (e–) and positive hole (h+) pairs. The available photogenerated e– on the surface of the photocatalyst activates the H2O2 and dissolved oxygen present in water to produce OH• and O2•– radicals, whereas the photogenerated h+ reacts with H2O molecules to produce OH• radicals.82,83 These OH• and O2•– radicals react with the adsorbed organic reactants efficiently, eventually resulting in the breakdown of the organic reactants. The schematic representation of the reaction mechanism involved in photocatalysis is as shown in Figure 11. The photocatalytic efficiency of the synthesized LFCO nanomaterials is found to be superior to that of the catalysts reported in the literature, and their comparison is shown in Table 5.
Figure 11.
Schematic diagram of the reaction mechanism involved in photocatalysis of RhB with LFCO-U as the photocatalyst.
Table 5. Comparison of Photocatalytic Activity of the LFCO-U with that of Some Published Photocatalysts.
| catalyst | reaction conditions | degradation(min)/degradation (%) | refs |
|---|---|---|---|
| LaFeO3-doped acid-modified natural zeolite | RhB = 10 mg L–1, pH = 6, H2O2 | 80/98.3 | (94) |
| g-C3N4/LaFeO3 | RhB = 10 mg L–1, H2O2 | 120/97.4 | (95) |
| LaFeO3-doped mesoporous/macroporous silica | RhB = 10 mg L–1, pH = 6, H2O2 | 90/95.6 | (80) |
| LaFeO3 | RhB = 10 mg L–1, pH = 5, H2O2 | 90/99 | (96) |
| LaFe0.5Cr0.5O3 synthesized by urea | RhB = 10 mg L–1, H2O2 | 60/99 | this work |
3.8.5. Photoluminescence Studies
To investigate the electronic structure and optical properties of the materials to extract information such as surface defects and efficiency of suppression of electron–hole (e–/h+) pairs,60,79,84,85 photoluminescence (PL) studies were carried out, and its spectrum is shown in Figure 12a. The intensity in PL emission spectra increases due to the recombination of e–/h+ pairs generated due to the irradiated photons. It has been found that the intensity of the emission bands increases in the order LFCO-U < LFCO-P < LFCO-G, which can be explained with the support of surface area. The significant decrease in the emission intensity of LFCO-U could be considered due to its higher surface area and hence the increase in the surface-to-volume ratio. This in turn increases the number of defect centers in the sample, and these defects provide a route for trapping of holes and eventually cause a fall in the recombination rate of e–/h+ pairs and hence a decrease in the emission intensity. Thus, this charge separation has enhanced the photocatalytic activity of LFCO-U compared to that of other LFCO samples. The remarkable enhancement of the luminescence intensity of LFCO-G compared to that of other samples is ascribed to its high rate of recombination of photogenerated e–/h+ pairs, which ultimately shows a very less photodegradation activity.
3.8.6. Explanation for Photocatalytic Performance of LFCO Materials for Degradation of Dyes
The optimized parameters have also been applied to other catalysts (LFCO-G and LFCO-P) for degradation of the RhB dye. It has been found that both catalysts LFCO-G (27%) and LFCO-P (95%) exhibit low photocatalytic performance compared to that of LFCO-U (99%) in the same time interval, as depicted in Figure 10. The surface area provides an explanation for this sort of photocatalytic behavior. Since photocatalysis is a surface phenomenon and LFCO-U has a higher surface area than that of the other catalysts, it provides a higher number of active reaction sites and hence results in an effective degradation of RhB.13,86 Moreover, recombination of e–/h+ pairs was also found to be less prominent in the LFCO-U catalyst, which is supported by our PL results. Thus, charge separation due to trapping of e–/h+ pairs in LFCO-U results in enhanced photocatalytic activity. Also, according to Fu et al.,87 for degradation of organic dyes, e–/h+ pairs must move from the inner body to the surface of the catalyst without their recombination. Furthermore, the recombination rate of e–/h+ pairs depends upon the crystallite size. An increase in the size of the LFCO nanoparticles leads to an increase in the traveling time of e–/h+ pairs to the surface of the photocatalyst, thus causing higher probability of recombination rate of e–/h+ pairs. Hence, LFCO-U having the smallest crystallite size leads to less recombination of e–/h+ pairs and exhibits excellent photocatalytic performance in comparison to that of other LFCO catalysts.
In the end, the photocatalytic performance of LFCO-U for the degradation of MB, MO, and the mixture of dyes (RhB + MB + MO) has been examined to check its applicability. Figures S3 and S4 represent the absorption spectrum of MB and MO with the characteristic peak at 664 and 464 nm, respectively. The cationic dyes MB (98% in 60 min of irradiation) and RhB (99% in 60 min) have degraded faster than the anionic dye MO (60% in 60 min of irradiation). Since LFCO-U is electron-rich, it may attract cationic dye molecules, while repelling anionic dye molecules, and causes fast photodegradation of cationic dyes.50 The difference in the photodegradation of these dyes may be due to their different molecular structures.88 Based on the reports,89,90 the RhB degradation process begins with an N-de-ethylation and breakdown of the chromophore. This process involves the opening of the rings of the molecules and a series of oxidation products. Finally, mineralization of the smaller molecules occurs until the final products are obtained, i.e., CO2 and H2O. In the case of MB, the degradation starts with the breaking of the S–Cl, N–CH3, CS, CN, and C=O bonds. Subsequently, the degradation of a series of intermediate products occurs, which will cause the MB rings to open, forming smaller organic molecules. This degradation process continues until mineralization is achieved.91 MO dye molecules involve the breaking of the N=N bonds and separate the molecules. Afterward, a series of intermediate steps occur, in which the molecules will break into smaller molecules. This process occurs until complete mineralization is achieved, and CO2 and H2O remain as the final molecules.92,93 In the case of the mixture of dyes, the degradation completes in 90 min as shown in Figure 12c. It is further mentioned that the peak of MO in the mixture is not strong due to the highly intense peak of the RhB dye and MB dye.
3.8.7. Reusability Analysis
The reuse, regeneration, and stability of the LFCO-U photocatalyst have a significant effect on the degradation process, which make the process cost-effective. Here, the catalyst in the case of all three dyes was regenerated by filtration followed by several counts of washing with ethanol and distilled water and then dried for 2 h at 120 °C. It can be seen from Figure S5 that LFCO-U has a good degradation effect on all dyes after being used repeatedly for five consecutive runs. The slight decrease in the catalytic efficiency is due to the fact that some sample might be lost during the separation process (centrifugation, washing, and drying). Moreover, the XRD patterns of the recovered LFCO-U catalysts (Figure S6) in the case of each dye after five cycles demonstrate that the photocatalyst structure is preserved even after recovery, indicating its high photostability.
3.8.8. Kinetic Study
The pseudo-first-order kinetic model has been used to evaluate the photocatalytic degradation of the RhB dye by nano-LFCO samples. The pseudo-first-order model is expressed by the equation
| 14 |
where C0 and Ct are the concentrations (mg/L) of the dye at time t = 0 and at particular time, t, respectively, and k is the degradation rate constant (min–1). The absorbance of a dye solution in UV–vis spectra is proportional to its concentration in reaction medium, and thus, the ratio of absorbance at time t = 0 (A0) to absorbance at time t (At) is proportional to the ratio of concentration at time t = 0 (C0) to concentration at time t (Ct), so eq 14 takes the form
| 15 |
The linear fit between ln(A0/At) and reaction time t for RhB degradation is shown in Figure 13. The regression correlation coefficients (R2) have been found to be in the range of 0.96–0.98 for LFCO samples, which indicates that the degradation of the RhB dye fits well with the first-order kinetic model. The rate constant (k) is a measure of the rate of the reaction and has been determined from the slope of straight lines shown in Figure 13. The greater value of the rate constant corresponds to a faster reaction. The k values for the degradation of the RhB dye are found to be 0.00492, 0.0567, and 0.06724 min–1 for LFCO-G, LFCO-P, and LFCO-U, respectively. The magnitude of k is found to be higher for LFCO-U, and hence, an efficient photodegradation is obtained for LFCO-U, as discussed in the photodegradation section.
Figure 13.
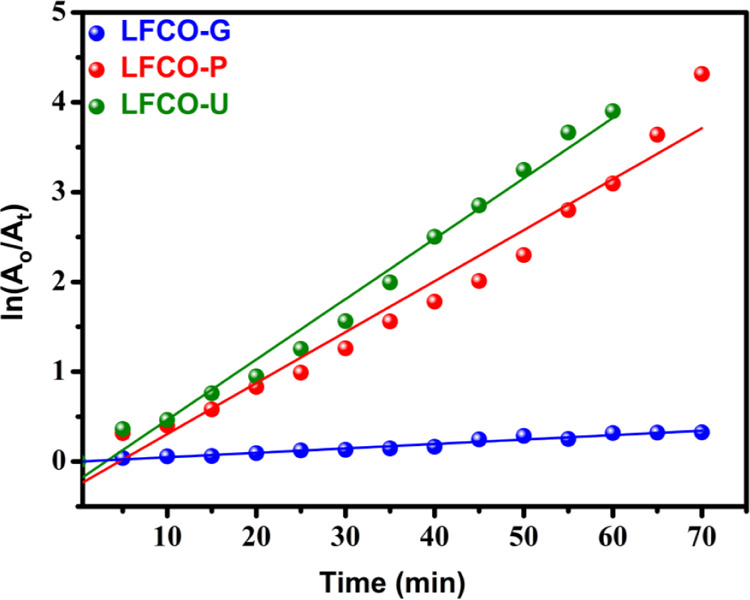
Plots of ln(A0/At) versus reaction time (min) with the synthesized LFCO nanomaterials.
4. Conclusions
In conclusion, the pure nanocrystalline phases LFCO-G, LFCO-P, and LFCO-U with specific surface areas of 1.82, 4.66, and 7.33 m2/g, respectively, were successfully fabricated by a combustion method using different fuels. Due to the difference in the surface properties of LFCO samples, a considerable change in structural, optical, and magnetic properties has been noticed. The magnetic studies reveal that magnetization increases linearly with crystallite size, as a significant number of magnetic moments participate in the magnetization of the sample having a larger crystallite size. Both LFCO-P and LFCO-U show antiferromagnetic ordering at around 267 and 289 K, respectively, whereas no such transition is shown by LFCO-G. Furthermore, the band gap of the samples lies in the range of 2–2.6 eV, which is suitable for carrying out visible light-induced photocatalysis. Among the synthesized samples, LFCO-U shows excellent visible light-assisted degradation of different dyes and their mixture due to its higher surface area, small band gap, and less recombination of photogenerated electrons as supported by PL results.
Acknowledgments
The authors are obliged to the Director, IIC Roorkee, for executing P-XRD, SEM, and EDX studies, to SAIF IIT Bombay for HRTEM, and to CIF IISER Bhopal for conducting SQUID VSM studies. The authors would especially like to thank the Department of Chemistry at the University of Jammu in Jammu and the funding organizations for the instruments TGA (UGC-SAP), PL (DST-PURSE phase-II), BET (DST-PURSE phase-II), and UV–vis-NIR spectrophotometer (RUSA 2.0). The authors are also thankful to the University Grants Commission, New Delhi, India, for financial assistance, vide UGC-ref No. 191/(CSIR- UGC NET DEC. 2018).
Supporting Information Available
The Supporting Information is available free of charge at https://pubs.acs.org/doi/10.1021/acsomega.2c05594.
Powder XRD diffractograms of LFCO nanomaterials, selected bond lengths and angles of LFCO nanomaterials, UV–vis DRS spectra of LFCO photocatalysts, time-dependent UV–vis spectra of methylene blue and methyl orange by the LFCO-U photocatalyst, recyclability graph of LFCO-U for five consecutive cycles for different dyes, and P-XRD pattern of LFCO-U before and after recyclability of photodegradation of RhB, MB, and MO dyes (PDF)
The authors declare no competing financial interest.
Supplementary Material
References
- Hu J.; Odom T. W.; Lieber C. M. Chemistry and physics in one dimension: Synthesis and properties of nanowires and nanotubes. Acc. Chem. Res. 1999, 32, 435–445. 10.1021/ar9700365. [DOI] [Google Scholar]
- Patzke G. R.; Krumeich F.; Nesper R. Oxidic nanotubes and nanorods-anisotropic modules for a future nanotechnology. Angew. Chem., Int. Ed. 2002, 41, 2446–2461. . [DOI] [PubMed] [Google Scholar]
- Xia Y.; Yang P.; Sun Y.; Wu Y.; Mayers B.; Gates B.; Yin Y.; Kim F.; Yan H. One-dimensional nanostructures: Synthesis, characterization, and applications. Adv. Mater. 2003, 15, 353–389. 10.1002/adma.200390087. [DOI] [Google Scholar]
- Catalan G.; Scott J. F. Physics and applications of bismuth ferrite. Adv. Mater. 2009, 21, 2463–2485. 10.1002/adma.200802849. [DOI] [Google Scholar]
- Park J.; An K.; Hwang Y.; Park J. G.; Noh H. J.; Kim J. Y.; Park J. H.; Hwang N. M.; Hyeon T. Ultra-large-scale syntheses of monodisperse nanocrystals. Nat. Mater. 2004, 3, 891–895. 10.1038/nmat1251. [DOI] [PubMed] [Google Scholar]
- Jana N. R.; Chen Y.; Peng X. Size and shape-controlled magnetic (Cr, Mn, Fe, Co, Ni) oxide nanocrystals via a simple and general approach. Chem. Mater. 2004, 16, 3931–3935. 10.1021/cm049221k. [DOI] [Google Scholar]
- Yin M.; O’Brien S. Synthesis of monodisperse nanocrystals of manganese oxides. J. Am. Chem. Soc. 2003, 125, 10180–10181. 10.1021/ja0362656. [DOI] [PubMed] [Google Scholar]
- Ghosh M.; Sampathkumaran E. V.; Rao C. N. R. Synthesis and magnetic properties of CoO nanoparticles. Chem. Mater. 2005, 17, 2348–2352. 10.1021/cm0478475. [DOI] [Google Scholar]
- He X.; Song X.; Qiao W.; Li Z.; Zhang X.; Yan S.; Zhong W.; Du Y. Phase and size-dependent optical and magnetic properties of CoO nanoparticles. J. Phys. Chem. C 2015, 119, 9550–9559. 10.1021/jp5127909. [DOI] [Google Scholar]
- Backhaus-Ricoult M. SOFC-a playground for solid state chemistry. Solid State Sci. 2008, 10, 670–688. 10.1016/j.solidstatesciences.2007.11.021. [DOI] [Google Scholar]
- Choi Y.; Mebane D. S.; Lin M. C.; Liu M. Oxygen reduction on LaMnO3-based cathode materials in solid oxide fuel cells. Chem. Mater. 2007, 19, 1690–1699. 10.1021/cm062616e. [DOI] [Google Scholar]
- Petrović S.; Terlecki-Baričević A.; Karanović L.; Kirilov-Stefanov P.; Zdujić M.; Dondur V.; Paneva D.; Mitov I.; Rakić V. LaMO3 (M = Mg, Ti, Fe) perovskite type oxides: Preparation, characterization and catalytic properties in methane deep oxidation. Appl. Catal. B 2008, 79, 186–198. 10.1016/j.apcatb.2007.10.022. [DOI] [Google Scholar]
- Thirumalairajan S.; Girija K.; Mastelaro V. R.; Ponpandian N. Photocatalytic degradation of organic dyes under visible light irradiation by floral-like LaFeO3 nanostructures comprised of nanosheet petals. New J. Chem. 2014, 38, 5480–5490. 10.1039/C4NJ01029A. [DOI] [Google Scholar]
- Lee W. Y.; Yun H. J.; Yoon J. W. Characterization and magnetic properties of LaFeO3 nanofibers synthesized by electrospinning. J. Alloys Compd. 2014, 583, 320–324. 10.1016/j.jallcom.2013.08.191. [DOI] [Google Scholar]
- Fujii T.; Matsusue I.; Nakatsuka D.; Nakanishi M.; Takada J. Synthesis and anomalous magnetic properties of LaFeO3 nanoparticles by hot soap method. Mater. Chem. Phys. 2011, 129, 805–809. 10.1016/j.matchemphys.2011.05.015. [DOI] [Google Scholar]
- Thirumalairajan S.; Girija K.; Ganesh I.; Mangalaraj D.; Viswanathan C.; Balamurugan A.; Ponpandian N. Controlled synthesis of perovskite LaFeO3 microsphere composed of nanoparticles via self-assembly process and their associated photocatalytic activity. Chem. Eng. J. 2012, 209, 420–428. 10.1016/j.cej.2012.08.012. [DOI] [Google Scholar]
- Nie Y.; Zhang L.; Li Y. Y.; Hu C. Enhanced Fenton-like degradation of refractory organic compounds by surface complex formation of LaFeO3 and H2O2. J. Hazard. Mater. 2015, 294, 195–200. 10.1016/j.jhazmat.2015.03.065. [DOI] [PubMed] [Google Scholar]
- Scholl A.; Stohr J.; Luning J.; Seo J. W.; Fompeyrine J.; Siegwart H.; Locquet J. P.; Nolting F.; Anders S.; Fullerton E. E.; Scheinfein M. R.; Padmore H. A. Observation of antiferromagnetic domains in epitaxial thin films. Science 2000, 287, 1014–1016. 10.1126/science.287.5455.1014. [DOI] [PubMed] [Google Scholar]
- Cristóbal A.; Botta P. M.; Aglietti E. F.; Conconi M. S.; Bercoff P. G.; López J. P. Synthesis, structure and magnetic properties of distorted YxLa1–xFeO3: Effects of mechanochemical activation and composition. Mater. Chem. Phys. 2011, 130, 1275–1279. 10.1016/j.matchemphys.2011.09.014. [DOI] [Google Scholar]
- Treves D. Studies on orthoferrites at the Weizmann Institute of Science. J. Appl. Phys. 1965, 36, 1033–1039. 10.1063/1.1714088. [DOI] [Google Scholar]
- Kodama R. H.; Berkowitz A. E. Atomic-scale magnetic modeling of oxide nanoparticles. Phys. Rev. B 1999, 59, 6321. 10.1103/PhysRevB.59.6321. [DOI] [Google Scholar]
- Lee Y. C.; Pakhomov A. B.; Krishnan K. M. Size-driven magnetic transitions in monodisperse MnO nanocrystals. J. Appl. Phys. 2010, 107, 09E124 10.1063/1.3366611. [DOI] [PMC free article] [PubMed] [Google Scholar]
- Belayachi A.; Loudghiri E.; El Yamani M.; Nogues M.; Dormann J. L.; Taibi M. Unusual magnetic behavior in LaFe1–xCrxO3. Ann. Chim-Sci. Mat. 1998, 23, 297–300. 10.1016/S0151-9107(98)80078-0. [DOI] [Google Scholar]
- Belayachi A.; Nogues M.; Dormann J. L.; Taibi M. Magnetic properties of LaFe1-xCrxO3 perovskites. Eur. J. Sol. State Inorg. Chem. 1996, 33, 1039–1049. [Google Scholar]
- Azad A. K.; Mellergård A.; Eriksson S. G.; Ivanov S. A.; Yunus S. M.; Lindberg F.; Svensson G.; Mathieu R. Structural and magnetic properties of LaFe0.5Cr0.5O3 studied by neutron diffraction, electron diffraction and magnetometry. Mater. Res. Bull. 2005, 40, 1633–1644. 10.1016/j.materresbull.2005.07.007. [DOI] [Google Scholar]
- Coutinho P. V.; Moreno N. O.; Ochoa E. A.; Da Costa M. M.; Barrozo P. Magnetization reversal in orthorhombic Sr-doped LaFe0.5Cr0.5O3–δ. J. Phys. Condens. Matter 2018, 30, 235804 10.1088/1361-648X/aac06d. [DOI] [PubMed] [Google Scholar]
- Hu W.; Chen Y.; Yuan H.; Zhang G.; Li G.; Pang G.; Feng S. Hydrothermal synthesis, characterization and composition-dependent magnetic properties of LaFe1–xCrxO3 system (0 ≤ x ≤ 1). J. Solid State Chem. 2010, 183, 1582–1587. 10.1016/j.jssc.2010.04.041. [DOI] [Google Scholar]
- Selvadurai A. P. B.; Pazhanivelu V.; Jagadeeshwaran C.; Murugaraj R.; Muthuselvam I. P.; Chou F. C. Influence of Cr substitution on structural, magnetic and electrical conductivity spectra of LaFeO3. J. Alloys Compd. 2015, 646, 924–931. 10.1016/j.jallcom.2015.05.213. [DOI] [Google Scholar]
- He J.; Liu P.; Ran R.; Wang W.; Zhou W.; Shao Z. Single-atom catalysts for high-efficiency photocatalytic and photoelectrochemical water splitting: Distinctive roles, unique fabrication methods and specific design strategies. J. Mater. Chem. A 2022, 10, 6835–6871. 10.1039/D2TA00835A. [DOI] [Google Scholar]
- Han X.; Liu P.; Ran R.; Wang W.; Zhou W.; Shao Z. Non-metal fluorine doping in Ruddlesden-Popper perovskite oxide enables high-efficiency photocatalytic water splitting for hydrogen production. Mater. Today Energy 2022, 23, 100896 10.1016/j.mtener.2021.100896. [DOI] [Google Scholar]
- Xiao H.; Liu P.; Wang W.; Ran R.; Zhou W.; Shao Z. Enhancing the photocatalytic activity of Ruddlesden-Popper Sr2TiO4 for hydrogen evolution through synergistic silver doping and moderate reducing pre-treatment. Mater. Today Energy 2022, 23, 100899 10.1016/j.mtener.2021.100899. [DOI] [Google Scholar]
- Zhou L.; Li Y.; Zhang Y.; Qiu L.; Xing Y. A 0D/2D Bi4V2O11/gC3N4 S-scheme heterojunction with rapid interfacial charges migration for photocatalytic antibiotic degradation. Acta Phys.-Chim. Sin. 2022, 38, 2112027. 10.3866/PKU.WHXB202112027. [DOI] [Google Scholar]
- Li S.; Cai M.; Liu Y.; Zhang J.; Wang C.; Zang S.; Li Y.; Zhang P.; Li X. In situ construction of a C3N5 nanosheet/Bi2WO6 nanodot S-scheme heterojunction with enhanced structural defects for the efficient photocatalytic removal of tetracycline and Cr (VI). Inorg. Chem. Front. 2022, 9, 2479–2497. 10.1039/D2QI00317A. [DOI] [Google Scholar]
- Lan C. Y.; Xian X. Y.; Feng L. D.; Jin L. Y.; Hun X.; Hua C. Q. Insight into superior visible light photocatalytic activity for degradation of dye over corner-truncated cubic Ag2O decorated TiO2 hollow nanofibers. Chinese J. Struct. Chem. 2020, 39, 588–597. [Google Scholar]
- Zhao X.; Li J.; Li X.; Huo P.; Shi W. Design of metal-organic frameworks (MOFs)-based photocatalyst for solar fuel production and photo-degradation of pollutants. Chinese J. Catal. 2021, 42, 872–903. 10.1016/S1872-2067(20)63715-9. [DOI] [Google Scholar]
- Shen R.; Zhang L.; Chen X.; Jaroniec M.; Li N.; Li X. Integrating 2D/2D CdS/α-Fe2O3 ultrathin bilayer Z-scheme heterojunction with metallic β-NiS nanosheet-based ohmic-junction for efficient photocatalytic H2 evolution. Appl. Catal., B 2020, 266, 118619 10.1016/j.apcatb.2020.118619. [DOI] [Google Scholar]
- Bai J.; Shen R.; Chen W.; Xie J.; Zhang P.; Jiang Z.; Li X. Enhanced photocatalytic H2 evolution based on a Ti3C2/Zn0.7Cd0.3S/Fe2O3 Ohmic/S-scheme hybrid heterojunction with cascade 2D coupling interfaces. Chem. Eng. J. 2022, 429, 132587 10.1016/j.cej.2021.132587. [DOI] [Google Scholar]
- Mahmoodi N. M.; Hayati B.; Arami M.; Lan C. Adsorption of textile dyes on Pine Cone from colored wastewater: Kinetic, equilibrium and thermodynamic studies. Desalination 2011, 268, 117–125. 10.1016/j.desal.2010.10.007. [DOI] [Google Scholar]
- Li L.; Wang X.; Lan Y.; Gu W.; Zhang S. Synthesis, photocatalytic and electrocatalytic activities of wormlike GdFeO3 nanoparticles by a glycol-assisted sol-gel process. Ind. Eng. Chem. Res. 2013, 52, 9130–9136. 10.1021/ie400940g. [DOI] [Google Scholar]
- Tripathi V. K.; Nagarajan R. Correlating the influence of two magnetic ions at the A-site with the electronic, magnetic, and catalytic properties in Gd1-xDyxCrO3. ACS Omega 2017, 2, 2657–2664. 10.1021/acsomega.7b00480. [DOI] [PMC free article] [PubMed] [Google Scholar]
- Safari S.; Ahmadian S. M. S.; Amani-Ghadim A. R. Visible light photocatalytic activity enhancing of MTiO3 perovskites by M cation (M = Co, Cu, and Ni) substitution and Gadolinium doping. J. Photochem. Photobiol. A 2020, 394, 112461 10.1016/j.jphotochem.2020.112461. [DOI] [Google Scholar]
- Li S.; Jing L.; Fu W.; Yang L.; Xin B.; Fu H. Photoinduced charge property of nanosized perovskite-type LaFeO3 and its relationships with photocatalytic activity under visible irradiation. Mater. Res. Bull. 2007, 42, 203–212. 10.1016/j.materresbull.2006.06.010. [DOI] [Google Scholar]
- Tang P.; Tong Y.; Chen H.; Cao F.; Pan G. Microwave-assisted synthesis of nanoparticulate perovskite LaFeO3 as a high active visible-light photocatalyst. Curr. Appl. Phys. 2013, 13, 340–343. 10.1016/j.cap.2012.08.006. [DOI] [Google Scholar]
- Dhinesh Kumar R.; Jayavel R. Facile hydrothermal synthesis and characterization of LaFeO3 nanospheres for visible light photocatalytic applications. J. Mater. Sci.: Mater. Electron. 2014, 25, 3953–3961. 10.1007/s10854-014-2113-x. [DOI] [Google Scholar]
- Thirumalairajan S.; Girija K.; Hebalkar N. Y.; Mangalaraj D.; Viswanathan C.; Ponpandian N. Shape evolution of perovskite LaFeO3 nanostructures: A systematic investigation of growth mechanism, properties and morphology dependent photocatalytic activities. RSC Adv. 2013, 3, 7549–7561. 10.1039/c3ra00006k. [DOI] [Google Scholar]
- Li X.; Duan Z. Q. Synthesis of GdFeO3 microspheres assembled by nanoparticles as magnetically recoverable and visible-light-driven photocatalysts. Mater. Lett. 2012, 89, 262–265. 10.1016/j.matlet.2012.08.140. [DOI] [Google Scholar]
- Jia G.; You H.; Yang M.; Zhang L.; Zhang H. Uniform lanthanide orthoborates LnBO3 (Ln = Gd, Nd, Sm, Eu, Tb, and Dy) microplates: General synthesis and luminescence properties. J. Phys. Chem. C 2009, 113, 16638–16644. 10.1021/jp905540a. [DOI] [Google Scholar]
- Wang X.; Zhang Y. G.; Wu Z. Magnetic and optical properties of multiferroic bismuth ferrite nanoparticles by tartaric acid-assisted sol-gel strategy. Mater. Lett. 2010, 64, 486–488. 10.1016/j.matlet.2009.11.059. [DOI] [Google Scholar]
- Henkes A. E.; Bauer J. C.; Sra A. K.; Johnson R. D.; Cable R. E.; Schaak R. E. Low-temperature nanoparticle-directed solid-state synthesis of ternary and quaternary transition metal oxides. Chem. Mater. 2006, 18, 567–571. 10.1021/cm052190o. [DOI] [Google Scholar]
- Singh S.; Sharma S.; Manhas U.; Qadir I.; Atri A. K.; Singh D. Different fuel-adopted combustion syntheses of nano-structured NiCrFeO4: A highly recyclable and versatile catalyst for reduction of nitroarenes at room temperature and photocatalytic degradation of various organic dyes in unitary and ternary solutions. ACS Omega 2022, 7, 19853–19871. 10.1021/acsomega.2c01616. [DOI] [PMC free article] [PubMed] [Google Scholar]
- Yu H. C.; Fung K. Z.; Guo T. C.; Chang W. L. Syntheses of perovskite oxides nanoparticles La1–xSrxMO3–δ (M = Co and Cu) as anode electrocatalyst for direct methanol fuel cell. Electrochim. Acta 2004, 50, 811–816. 10.1016/j.electacta.2004.01.121. [DOI] [Google Scholar]
- Prasad D. H.; Park S. Y.; Oh E. O.; Ji H.; Kim H. R.; Yoon K. J.; Son J. W.; Lee J. H. Synthesis of nano-crystalline La1–xSrxCoO3–δ perovskite oxides by EDTA-citrate complexing process and its catalytic activity for soot oxidation. Appl. Catal. A: Gen. 2012, 447–448, 100–106. 10.1016/j.apcata.2012.09.008. [DOI] [Google Scholar]
- Klug H. P.; Alexander L. E.. X-ray Diffraction Procedures: for Polycrystalline and Amorphous Materials, 1974, 992.
- Thorat N. D.; Shinde K. P.; Pawar S. H.; Barick K. C.; Betty C. A.; Ningthoujam R. S. Polyvinyl alcohol: An efficient fuel for synthesis of superparamagnetic LSMO nanoparticles for biomedical application. Dalton Trans. 2012, 41, 3060–3071. 10.1039/c2dt11835a. [DOI] [PubMed] [Google Scholar]
- Singh D.; Singh S. Structural and magnetic characterization of nanocrystalline LaFeO3 synthesized by low temperature combustion technique using different fuels. Indian J. Chem. A 2020, 56, 1041–1047. 10.56042/ijca.v56i10.16571. [DOI] [Google Scholar]
- Singh D.; Gupta S. Study of structural and transport properties of half-doped lanthanum chromium orthoferrite. Monatsh. Chem. 2016, 147, 1461–1465. 10.1007/s00706-016-1658-1. [DOI] [Google Scholar]
- Thuy N. T.; Minh D. L. Size effect on the structural and magnetic properties of nanosized perovskite LaFeO3 prepared by different methods. Adv. Mater. Sci. Eng. 2012, 2012, 1–6. 10.1155/2012/380306. [DOI] [Google Scholar]
- Deng H.; Mao Z.; Xu H.; Zhang L.; Zhong Y.; Sui X. Synthesis of fibrous LaFeO3 perovskite oxide for adsorption of Rhodamine B. Ecotoxicol. Environ. Saf. 2019, 168, 35–44. 10.1016/j.ecoenv.2018.09.056. [DOI] [PubMed] [Google Scholar]
- Hwang C. C.; Wu T. Y.; Wan J.; Tsai J. S. Development of a novel combustion synthesis method for synthesizing of ceramic oxide powders. Mater. Sci. Eng. B 2004, 111, 49–56. 10.1016/j.mseb.2004.03.023. [DOI] [Google Scholar]
- Li S.; Jing L.; Fu W.; Yang L.; Xin B.; Fu H. Photoinduced charge property of nanosized perovskite-type LaFeO3 and its relationships with photocatalytic activity under visible irradiation. Mater. Res. Bull. 2007, 42, 203–212. 10.1016/j.materresbull.2006.06.010. [DOI] [Google Scholar]
- He J.; Liu P.; Ran R.; Wang W.; Zhou W.; Shao Z. Single-atom catalysts for high-efficiency photocatalytic and photoelectrochemical water splitting: Distinctive roles, unique fabrication methods and specific design strategies. J. Mater. Chem. A 2022, 10, 6835–6871. 10.1039/D2TA00835A. [DOI] [Google Scholar]
- Hira; Daud A.; Zulfiqar S.; Agboola P. O.; Shakir I.; Warsi M. F. DyCrxFe1–xO3 nanoparticles prepared by wet chemical technique for photocatalytic applications. Ceram. Int. 2020, 46, 26675–26681. 10.1016/j.ceramint.2020.07.138. [DOI] [Google Scholar]
- Safari S.; Ahmadian S. M. S.; Amani-Ghadim A. R. Visible light photocatalytic activity enhancing of MTiO3 perovskites by M cation (M = Co, Cu, and Ni) substitution and Gadolinium doping. J. Photochem. Photobiol. A: Chem. 2020, 394, 112461 10.1016/j.jphotochem.2020.112461. [DOI] [Google Scholar]
- Xia W.; Wu H.; Xue P.; Zhu X. Microstructural, magnetic, and optical properties of Pr-doped perovskite manganite La0.67Ca0.33MnO3 nanoparticles synthesized via sol-gel process. Nanoscale Res. Lett. 2018, 13, 1–13. 10.1186/s11671-018-2553-y. [DOI] [PMC free article] [PubMed] [Google Scholar]
- Ali S. A.; Naseem S.; Khan W.; Sharma A.; Naqvi A. H.. Microstructural, Optical and Electrical Properties of LaFe0.5Cr0.5O3 perovskite nanostructures, AIP Conf. Proc., 2016; p 050016.
- Zhang Q.; Gong W.; Wang J.; Ning X.; Wang Z.; Zhao X.; Ren W.; Zhang Z. Size-dependent magnetic, photoabsorbing, and photocatalytic properties of single-crystalline Bi2Fe4O9 semiconductor nanocrystals. J. Phys. Chem. C 2011, 115, 25241–25246. 10.1021/jp208750n. [DOI] [Google Scholar]
- Bagheri-Mohagheghi M. M.; Shahtahmasebi N.; Alinejad M. R.; Youssefi A.; Shokooh-Saremi M. The effect of the post-annealing temperature on the nano-structure and energy band gap of SnO2 semiconducting oxide nanoparticles synthesized by polymerizing-complexing sol-gel method. Phys. B: Condens. Matter 2008, 403, 2431–2437. 10.1016/j.physb.2008.01.004. [DOI] [Google Scholar]
- Goodenough J. B. Theory of the role of covalence in the perovskite-type manganites [La, M (II)] MnO3. Phys. Rev. 1955, 100, 564. 10.1103/PhysRev.100.564. [DOI] [Google Scholar]
- Salah L. M.; Rashad M. M.; Haroun M.; Rasly M.; Soliman M. A. Magnetically roll-oriented LaFeO3 nanospheres prepared using oxalic acid precursor method. J. Mater. Sci.: Mater. Electron. 2015, 26, 1045–1052. 10.1007/s10854-014-2503-0. [DOI] [Google Scholar]
- Choudhary N.; Sharma S.; Verma M. K.; Sharma N. D.; Singh D. Comparative study of nano-and bulk La0.5Sr0.5Ti0.5Co0.5O3 perovskite: Structural, magnetic, and transport Properties. J. Supercond. Nov. Magn. 2018, 31, 3269–3275. 10.1007/s10948-018-4575-1. [DOI] [Google Scholar]
- Durand A. M.; Belanger D. P.; Ye F.; Chi S.; Fernandez-Baca J. A.; Booth C. H.; Bhat M. Magnetism in nanoparticle LaCoO3. ArXiv.org. 2013, 1311–0240. [DOI] [PubMed] [Google Scholar]
- Ahmed M. A.; Selim M. S.; Arman M. M. Novel multiferroic La0.95Sb0.05FeO3 orthoferrite. Mater. Chem. Phys. 2011, 129, 705–712. 10.1016/j.matchemphys.2011.03.033. [DOI] [Google Scholar]
- Singh S.; Singh D. Structural, magnetic and electrical properties of Fe-doped perovskite manganites La0.8Ca0.15Na0.05Mn1–xFexO3 (x = 0, 0.05, 0.10 and 0.15). J. Alloys Compd. 2017, 702, 249–257. 10.1016/j.jallcom.2017.01.154. [DOI] [Google Scholar]
- Singh D.; Mahajan A. Synthesis, magnetic and electric transport properties of mixed-valence manganites. J. Solid State Chem. 2013, 207, 126–131. 10.1016/j.jssc.2013.09.016. [DOI] [Google Scholar]
- Sharma R.; Singhal S. Photodegradation of textile dyes using magnetically recyclable heterogeneous spinel ferrites. J. Chem. Technol. Biotechnol. 2015, 90, 955–962. 10.1002/jctb.4409. [DOI] [Google Scholar]
- Vanga P. R.; Mangalaraja R. V.; Ashok M. Effect of (Nd, Ni) co-doped on the multiferroic and photocatalytic properties of BiFeO3. Mater. Res. Bull. 2015, 72, 299–305. 10.1016/j.materresbull.2015.08.015. [DOI] [Google Scholar]
- Freyria F. S.; Compagnoni M.; Ditaranto N.; Rossetti I.; Piumetti M.; Ramis G.; Bonelli B. Pure and Fe-doped mesoporous titania catalyse the oxidation of acid orange 7 by H2O2 under different illumination conditions: Fe doping improves photocatalytic activity under simulated solar light. Catalysts 2017, 7, 213. 10.3390/catal7070213. [DOI] [Google Scholar]
- Srivastava V. C.; Srivastava V. C. Photocatalytic oxidation of dye bearing wastewater by iron doped zinc oxide. Ind. Eng. Chem. Res. 2013, 52, 17790–17799. 10.1021/ie401973r. [DOI] [Google Scholar]
- Gupta N. K.; Ghaffari Y.; Kim S.; Bae J.; Kim K. S.; Saifuddin M. Photocatalytic degradation of organic pollutants over MFe2O4 (M= Co, Ni, Cu, Zn) nanoparticles at neutral pH. Sci. Rep. 2020, 10, 4942 10.1038/s41598-020-61930-2. [DOI] [PMC free article] [PubMed] [Google Scholar]
- Phan T. T. N.; Nikoloski A. N.; Bahri P. A.; Li D. Facile fabrication of perovskite-incorporated hierarchically mesoporous/macroporous silica for efficient photo assisted-Fenton degradation of dye. Appl. Surf. Sci. 2019, 491, 488–496. 10.1016/j.apsusc.2019.06.133. [DOI] [Google Scholar]
- Zhou L.; Chu B.; He S.; Yu J.; Lin X.; Wang A. The degradation of indigo sodium disulphonate by chromium isomorphic replacement in magnetite. J. Chin. Chem. Soc. 2016, 63, 611–617. 10.1002/jccs.201500527. [DOI] [Google Scholar]
- Weldegebrieal G. K.; Sibhatu A. K. Photocatalytic activity of biosynthesized α-Fe2O3 nanoparticles for the degradation of methylene blue and methyl orange dyes. Optik 2021, 241, 167226 10.1016/j.ijleo.2021.167226. [DOI] [Google Scholar]
- Malik R.; Tomer V. K.; Duhan S.; Nehra S. P.; Rana P. S. One-pot hydrothermal synthesis of porous SnO2 nanostructures for photocatalytic degradation of organic pollutants. Energy Environ. Focus 2015, 4, 340–345. 10.1166/eef.2015.1182. [DOI] [Google Scholar]
- Li J.; Pan X.; Xu Y.; Jia L.; Yi X.; Fang W. Synergetic effect of copper species as cocatalyst on LaFeO3 for enhanced visible-light photocatalytic hydrogen evolution. Int. J. Hydrogen Energy 2015, 40, 13918–13925. 10.1016/j.ijhydene.2015.07.166. [DOI] [Google Scholar]
- Niu F.; Chen D.; Qin L.; Gao T.; Zhang N.; Wang S.; Chen Z.; Wang J.; Sun X.; Huang Y. Synthesis of Pt/BiFeO3 heterostructured photocatalysts for highly efficient visible-light photocatalytic performances. Sol. Energy Mater. Sol. Cells 2015, 143, 386–396. 10.1016/j.solmat.2015.07.008. [DOI] [Google Scholar]
- Cheng H.; Wang J.; Zhao Y.; Han X. Effect of phase composition, morphology, and specific surface area on the photocatalytic activity of TiO2 nanomaterials. RSC Adv. 2014, 4, 47031–47038. 10.1039/C4RA05509H. [DOI] [Google Scholar]
- Fu Y.; Wang X. Magnetically separable ZnFe2O4-graphene catalyst and its high photocatalytic performance under visible light irradiation. Ind. Eng. Chem. Res. 2011, 50, 7210–7218. 10.1021/ie200162a. [DOI] [Google Scholar]
- Khataee A. R.; Kasiri M. B. Photocatalytic degradation of organic dyes in the presence of nanostructured titanium dioxide: Influence of the chemical structure of dyes. J. Mol. Catal. A: Chem. 2010, 328, 8–26. 10.1016/j.molcata.2010.05.023. [DOI] [Google Scholar]
- Soltani T.; Entezari M. H. Sono-synthesis of bismuth ferrite nanoparticles with high photocatalytic activity in degradation of Rhodamine B under solar light irradiation. Chem. Eng. J. 2013, 223, 145–154. 10.1016/j.cej.2013.02.124. [DOI] [Google Scholar]
- Diao Z. H.; Liu J. J.; Hu Y. X.; Kong L. J.; Jiang D.; Xu X. R. Comparative study of Rhodamine B degradation by the systems pyrite/H2O2 and pyrite/persulfate: Reactivity, stability, products and mechanism. Separ. Purif. Technol. 2017, 184, 374–383. 10.1016/j.seppur.2017.05.016. [DOI] [Google Scholar]
- Lin J.; Luo Z.; Li J.; Li P. Degradation mechanism of methylene blue. Mater. Sci. Semicond. Process. 2018, 87, 24–31. 10.1016/j.mssp.2018.07.003. [DOI] [Google Scholar]
- Salavati H.; Teimouri A.; Kazemi S. Synthesis and characterization of novel composite-based phthalocyanine used as efficient photocatalyst for the degradation of methyl orange. Chem. Method. 2017, 1, 15–31. 10.22631/chemm.2017.90331.1002. [DOI] [Google Scholar]
- Han L.; Xue S.; Shichen Z.; Yan J.; Qian L.; Chen M. Biochar supported nanoscale iron particles for the efficient removal of methyl orange dye in aqueous solutions. PLoS One 2015, 10, e0132067 10.1371/journal.pone.0132067. [DOI] [PMC free article] [PubMed] [Google Scholar]
- Phan T. T. N.; Nikoloski A. N.; Bahri P. A.; Li D. Enhanced removal of organic using LaFeO3-integrated modified natural zeolites via heterogeneous visible light photo-Fenton degradation. J. Environ. Manage. 2019, 233, 471–480. 10.1016/j.jenvman.2018.12.051. [DOI] [PubMed] [Google Scholar]
- Ye Y.; Yang H.; Wang X.; Feng W. Photocatalytic, Fenton and photo-Fenton degradation of RhB over Z-scheme g-C3N4/LaFeO3 heterojunction photocatalysts. Mater. Sci. Semicond. Process 2018, 82, 14–24. 10.1016/j.mssp.2018.03.033. [DOI] [Google Scholar]
- Phan T. T. N.; Nikoloski A. N.; Bahri P. A.; Li D. Optimizing photocatalytic performance of hydrothermally synthesized LaFeO3 by tuning material properties and operating conditions. J. Environ. Chem. Eng. 2018, 6, 1209–1218. 10.1016/j.jece.2018.01.033. [DOI] [Google Scholar]
Associated Data
This section collects any data citations, data availability statements, or supplementary materials included in this article.


