

Abstract

PacC is a key transcriptional regulator of human pathogenic fungus Trichophyton rubrum with pivotal roles in pH homeostasis and virulence. We report the first biophysical characterization of the C-terminal inhibitory tail of PacC, pertinent to its physiological role in maintaining the inactive state of PacC at acidic pH which undergoes conformational changes for its proteolytic removal and activation, at alkaline pH. To gain insights into the structural features of PacC that enable the required conformational flexibility, we performed gel filtration chromatography, dynamic light scattering, circular dichroism, and 1-anilino-8-naphthalenesulfonate binding and showed that the tail exhibits properties similar to intrinsically disordered proteins, as also predicted by bioinformatics tools. We demonstrate that the C-terminal tail is conformationally flexible and attains a molten globule-like state at extremely acidic pH and undergoes biphasic GdmCl-induced unfolding in a noncooperative manner with an intermediate X state. We hypothesize that the conformational plasticity of the C-terminal tail of PacC may play a significant role in modulating its pH-dependent transcriptional activation.
Introduction
Trichophyton rubrum is a major fungal pathogen that causes superficial infections in human skin, hair, and nail to cause dermatophytosis.1 Upon infection, T. rubrum breaks down keratin and other proteins of skin and releases amino acids, whose further degradation leads to the secretion of ammonia, resulting in a shift in pH. The fungus hence encounters a shift in pH on the skin, from the initial pH ∼ 5.0 to pH > 8.5, during disease progression on the human host.2,3 The ability to sense and adapt to changing pH is key to survival and pathogenicity of T. rubrum and is regulated by the PacC transcription factor.4,5 The disruption of pacC in T. rubrum has been shown to result in a decreased secretion of keratinolytic proteases and reduced the ability of the mutant strain to infect human nails in vitro, highlighting its importance.4
PacC is a zinc finger-containing transcription factor with a conserved DNA-binding domain at its N-terminus and an acid-rich unique C-terminal tail. PacC, however, is synthesized in an inactive form and must undergo proteolytic removal of its C-terminal tail to attain an active state capable of initiating cellular response to pH change. Although the PacC-mediated pH-responsive signal transduction pathway is highly conserved among fungi, the molecular details of its activation vary. For instance, while the ∼625-residue Rim101-homologue of Saccharomyces cerevisiae and Candida albicans is activated through a one-step proteolytic removal of the C-terminal tail to yield the active protein,6,7 a two-step cleavage reaction is required for the activation of the 674-residue inactive PacC of Aspergillus nidulans (PacC72).8,9 In S. cerevisiae, the one-step cleavage of ∼100 residues from the C-terminus results in a 531 residue long active protein.6 In A. nidulans, the first pH signal transduction-dependent cleavage removes ∼180 C-terminal residues from PacC72, yielding an inactive intermediate (PacC53),10 followed by a second pH-independent cleavage11 that removes additional ∼245 C-terminal residues from PacC,53 resulting in the functional ∼250-residue PacC.27 In the absence of alkaline ambient pH signaling, the inhibitory C-terminal tail is thought to assume a protease-inaccessible “closed conformation,” through interactions involving three regions in the tail, termed as interacting regions A, B, and C, thereby preventing activation.8 However, the molecular basis of pH-induced conformational changes in the C-terminal tail enabling proteolytic cleavage for activation remains unclear.
The C-terminal tail of T. rubrum PacC is variable when compared to homologues (Figure S1A), with several insertions in the interacting regions A, B, and C, suggesting the incorporation of unique sequence features that may require organism-specific activation. In order to understand the structural properties of this C-terminal tail that aid its activation in response to pH, we have carried out its structural characterization, employing a diverse array of bioinformatics and biophysical methods. We find that the C-terminal tail is an intrinsically disordered protein (IDP) with intrinsic conformational flexibility and exhibits a stable initial structure at a wide range of pH but can attain a molten globule-like partially disordered structure under highly acidic conditions (pH 3.0 or lower). The unique IDP-like structural features of the C-terminal tail of T. rubrum PacC exhibited under in vitro conditions indicate inherent conformational flexibility necessary for the transcription regulator to shift from the inactive to active state during the adaptation to pH change in host cells.
Results
Sequence Properties of T. rubrum PacC Reveal It as an Intrinsically Disordered Protein
The PacC transcription factor of T. rubrum CBS118892 is encoded by TERG_00838 that yields a protein product corresponding to 815 residues. A search for conserved domains and sequence motifs identified an uncharacterized Q/N-rich region at its N-terminus, which appears to be unique to dermatophytes, followed by a short, 88 residue long Zn-finger domain (ZFD) and a long C-terminal tail (Figure 1A). The zinc-finger DNA-binding domain shows a high level of sequence conservation and harbors a conserved nuclear localization signal and the three C2H2 zinc-finger motifs required for its role as a transcription factor (Figure 1A). The C-terminal tail shows intermittent sequence conservation in contrast to the ZFD. The C-terminal tail consists of three interacting regions A, B, and C, which are required for locking the protein in its inactive state at acidic pH.8 Among the conserved sequence features in the tail are the two proteolytic sites required for the activation of PacC into its functional form, present in the interacting regions A and C, and the YPXL/I motifs required for binding to the pH-signaling PalA protein, present in the interacting region C (Figure 1A). Apart from these, no sequence motifs are present in the C-terminal tail. In addition, the interacting regions contain several insertions, especially in the interacting region C, thereby increasing the length of the extended C-terminal tail of PacC in T. rubrum in comparison to other homologues.
Figure 1.
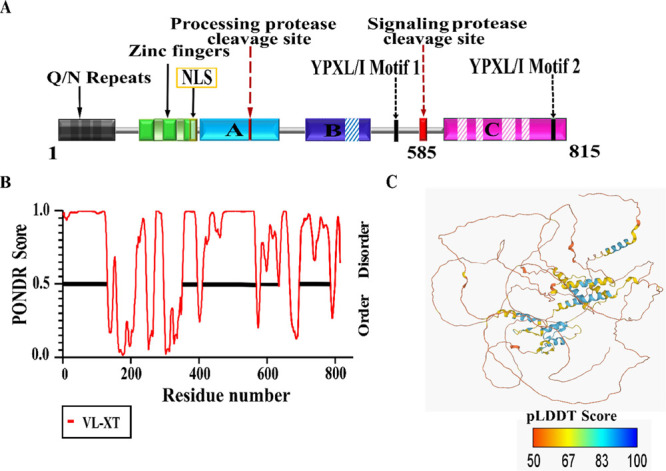
Sequence and structural features of PacC. (A) Domain diagram of T. rubrum PacC (1–815 residues). The three C2H2-conserved zinc-finger motifs in the N-terminal domain are shown in green, while the interacting regions A, B, and C are shown in cyan, blue, and magenta, respectively. Sequence insertions in the interacting regions are shown in dashed lines. The unique C-terminal tail of T. rubrum PacC (residues 585–815) is also indicated. (B) Disorder propensity of PacC, as predicted by the PONDR VL-XT score. (C) Alphafold2-predicted three-dimensional model for PacC. The Cα chain is color-coded according to the per-residue local distance difference test (pLDDT) score. A pLDDT score > 70 indicates accurate structures, whereas a score of <50 indicates a prediction of disorder.
A search for identifiable structural features in the C-terminal tail of PacC was carried out by first analyzing the predicted secondary and tertiary structures. Secondary structure prediction indicated a large number of random coil regions in PacC. The C-terminal tail was predicted as a disordered protein by PONDR,12 with intermittent long stretches of unfolded regions, typical of IDPs (Figure 1B). A substantial enrichment of charged and disorder-promoting amino acids (Glu, Asp, Lys, Gln, Pro and Ser) and the depletion of order-promoting residues, namely the hydrophobic (Ile, Leu and Val) and aromatic amino acids (Phe, Tyr and Trp), corroborate the predicted intrinsically disordered nature of the 231-residue C-terminal tail, PacCΔ1–584 (Figure 2).13−15
Figure 2.

Sequence properties of PacCΔ1–584. (A) Charge–hydropathy plot, (B) amino acid composition, and (C) residue-wise secondary structure prediction from PSIPRED suggest that PacCΔ1–584 (i.e., residues 585–815 of PacC) has IDP-like features.
Tertiary structure analysis was carried out using the three-dimensional structural model of PacC predicted from Alphafold2.16,17 Alphafold predicts a compact folded state for the ZFD corresponding to the C2H2 Zn-finger motifs (Figure S1B). A low pLDDT score for the rest of the structure suggests a low confidence prediction comprising intrinsic disorder for the C-terminal tail (Figure 1C). The pH-induced conformational plasticity of this extended IDP-like C-terminal tail region of T. rubrum PacC was next investigated.
Protein Purification and Structural Features of the C-Terminal Tail
In order to investigate the structure of the IDP-like C-terminal tail PacCΔ1–584, the protein was expressed from a heterologous expression system and purified to homogeneity (Figure 3A). However, PacCΔ1–584, with a predicted Mw of 24.7 kDa, exhibited an anomalous migration on SDS-PAGE of ∼35 kDa, possibly due to the enrichment of charged residues in these proteins, as also observed in many IDPs.18 Size-exclusion chromatography (SEC) of PacCΔ1–584 was next performed to estimate its hydrodynamic properties. Again, although the protein eluted as one major peak over the Superdex 200 10/300 GL column, the apparent Mw was found to be ∼five-fold higher than that of the monomer, that is, 126 ± 0.88 kDa (Figure 3A). A nearly four- to six-fold increase in their apparent Mw is often seen for IDPs having an extended random coil conformation, suggesting a possible similar conformation for PacCΔ1–584 as well.19
Figure 3.

Purity and hydrodynamic properties of PacCΔ1–584. (A) SEC elution profile of PacCΔ1–584, as monitored by a change in A280. The estimation of Mw of PacCΔ1–584 (red) against molecular weight standards is indicated (inset). (B) MALDI-TOF mass spectrum showing multiple peaks corresponding to the oligomers of PacCΔ1–584. (C) DLS analysis at different protein concentrations indicates a unimodal scattering profile at 0.1 mg/mL protein.
The identity, purity and exact Mw of PacCΔ1–584 were correctly estimated by MALDI-TOF mass spectrometry, followed by MS–MS analysis, before further characterization of the protein. MALDI-TOF identified a major peak of 24,709 Da, closely corresponding to the predicted Mw of PacCΔ1–584. However, additional peaks of 49,451 and 74,066 Da were also present, suggesting a dynamic equilibrium for different oligomers for the C-terminal construct (Figure 3B). Light-scattering experiments also identified a concentration-dependent propensity of PacCΔ1–584 to aggregate to higher oligomeric forms, although a unimodal, monodisperse population was present at low concentrations of the protein (0.1 mg/mL protein) (Figure 3C). All further biophysical experiments described in this manuscript were hence performed at low protein concentrations of 0.1 mg/mL.
Conformational Profile of PacCΔ1–584 at Varying pH Conditions
In order to monitor the secondary structure of PacCΔ1–584, far-UV CD spectrum was recorded at alkaline ambient pH 8.0 (Figure 4A). The CD spectrum shows a negative peak at 200 nm, similar to the spectrum shown by intrinsically disordered proteins.18 The characteristic negative peaks at 208 and 222 nm for α-helical or at 218 nm for β-sheet were not visible, in agreement with the large unstructured regions observed in the predicted three-dimensional structure of pacC (Figure 1C). A CD spectrum of PacCΔ1–584 incubated with 6 M GdmCl, however, was typical of denatured proteins with a complete loss of negative peaks (Figure 4A), indicating that the observed initial spectrum is suggestive of a partially folded IDP-like state.
Figure 4.
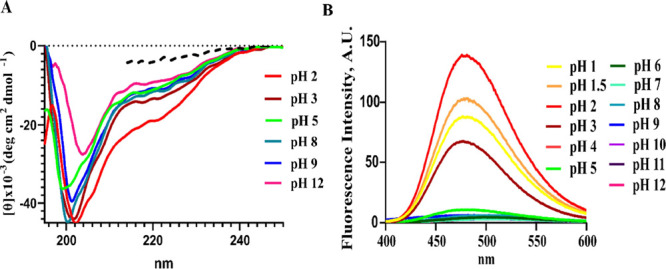
CD and ANS fluorescence measurements of PacCΔ1–584. (A) Far UV-CD spectra of PacCΔ1–584 at indicated pH. The spectrum of 6 M GdmCl-induced unfolded protein is shown in dashed lines. (B) ANS fluorescence emission spectra measured in buffers of indicated pH. All measurements were done in duplicate at 25 °C.
As PacC senses and responds to multiple pH changes in the host cells, the secondary structure of PacCΔ1–584 was next monitored as a function of pH after incubating the protein in different buffers (pH 2–12). No major change in the peak position was observed for PacCΔ1–584 at any pH between pH 3–9, and the overall spectrum continued to be atypical with respect to folded proteins, although at highly acidic or alkaline pH, a slight decrease in negative content was observed between 210 and 230 nm at pH 2.0 and a decrease in negative content at 204 nm at pH 12.0 (Figure 4A). The conformational profile of PacCΔ1–584 at different pH was further probed by ANS binding. At pH 8.0, there is no change in ANS binding. Under highly acidic conditions (pH 1.0, 1.5, 2.0 and 3.0), ANS bound strongly to PacCΔ1–584, leading to 27–55-fold increase in fluorescence intensity, suggesting a partially unfolded molten globule-like state with the exposed hydrophobic regions of the protein at these pH (Figure 4B). There is no change in fluorescence intensity upon ANS binding at pH 5–12, suggesting that PacCΔ1–584 does not have any exposed hydrophobic regions at these pH by attaining a folded (or fully unfolded) state (Figure 4B).
GdmCl-Induced Folding–Unfolding of PacCΔ1–584
In order to estimate the stability of PacCΔ1–584, GdmCl-induced denaturation was monitored by far-UV CD measurements (Figure 5A). The intrinsic fluorescence spectrum of PacCΔ1–584 is suggestive of a fully exposed environment for tryptophan between pH 2 and 12, with λmax of 355–357 nm (Figure S2), limiting the estimation of thermodynamic parameters to far-UV CD measurements.
Figure 5.

GdmCl-induced denaturation of PacCΔ1–584. (A) GdmCl-induced denaturation of PacCΔ1–584 was plotted by monitoring changes in the mean residue ellipticity, [θ]222. (B) Normalized transition curves with the values of fI or fII plotted as a function of [GdmCl]. (C) Values of ΔGI (transition I, N ↔ X) or ΔGII (transition II, X ↔ D) plotted versus [GdmCl]. (D) Estimated thermodynamic parameters of transition I (N ↔ X) and transition II (X ↔ D). Units of ΔGI0 or ΔGIIX is kcal mol–1, that of CmI or CmII is M, and that of mI or mII is kcal mol–1 M–1.
The denaturation curve of PacCΔ1–584 (Figure 5A) was observed to occur in a biphasic manner with two distinct transitions. Transition I (N ↔ X) is centered in the [GdmCl] range 0–1.3 M, where X represents the thermodynamically stable intermediate state between the native (N) and denatured (D) states. Transition II (X ↔ D) exists in the 1.3–5.0 M concentration range of GdmCl. The intermediate state (X) exists in 1.3–2.0 M concentrations of GdmCl. Each transition curve for PacCΔ1–584 was analyzed separately to estimate the respective thermodynamic parameters. The fraction of molecules in the X state (fI) or in the D state (fII) and ΔG associated with transition I (ΔGI) or with transition II (ΔGII) were estimated using the following relations
| 1 |
| 2 |
| 3 |
| 4 |
where R is the universal gas constant; T is the temperature in kelvin; and yN, yX, and yD represent the properties of the protein molecules in the native, intermediate, and denatured states, respectively, at the same [GdmCl] in which y (the observed property of protein) is measured.
The values of the fractions of the denatured molecules in transition I or transition II, that is, fI or fII, were plotted as a function of [GdmCl] (Figure 5B). Also, ΔGI or ΔGII (−1.3 kcal mol–1 ≤ ΔGI or ΔGII ≤ 1.3 kcal mol–1) was plotted versus [GdmCl] (Figure 5C) and found to be linear. A linear least-squares analysis was hence used to obtain the value of ΔGI0 (value of ΔGI at 0 M GdmCl) and mI (slope δΔGI/δ[GdmCl]) for transition I and ΔGIIX (value of ΔGII in the presence of GdmCl where X state existed) and mII (slope δΔGII/δ[GdmCl]) associated with transition II (Figure 5D), using the relations 5 and 6 given below. The transitions reported in Figure 5D, especially X ↔ D, have a somewhat low value for mII = −1.89 ± 0.14 kcal mol–1 M–1, suggesting that it is largely a noncooperative process.
| 5 |
| 6 |
In addition, the two distinct Cm values of PacCΔ1–584 (for transition I or transition II) are clearly suggestive of a noncooperative GdmCl-induced unfolding through an intermediate X state. ANS fluorescence measurements with the GdmCl-induced X state show a nearly twofold increase in fluorescence intensity as compared to the “N” state, indicative of the exposed hydrophobic patches and suggesting that the intermediate X state of PacCΔ1–584 (1.3–1.4 M GdmCl, Figure S3) attains a molten globule-like transition state during unfolding. PacCΔ1–584, however, attains a fully unfolded state at 5 M GdmCl (Figure S3), indicating that the C-terminal tail of PacC (PacCΔ1–584) undergoes unfolding through a two-state biphasic process, that is, N ↔ X and X ↔ D, upon GdmCl-induced denaturation.
Discussion
The proteolytic removal of the C-terminal tail of PacC is a key step in the activation of the N-terminal ZFD, which then translocates into the nucleus and modulates the expression of “alkaline-expressed” and “acid-repressed” genes in response to the alkaline ambient pH change in fungi.20,21 However, no information is available toward the secondary and tertiary structures adopted by the C-terminal regulatory tail or the molecular conformational changes leading to its activation.
In this study, we investigated the structural features of the C-terminal tail region of PacC of T. rubrum and the effect of pH change on its structure, function, and stability, through structural bioinformatics and biophysical investigations. Detailed sequence analysis and structure prediction studies indicate a largely disordered IDP-like structure for PacCΔ1–584 with a low-confidence (low pLDDT score) Alphafold-predicted three-dimensional structure (Figures 1 and 2). The intrinsic disorder of IDP-like proteins has several unique features that contrasts that of globular proteins and can be easily monitored by different biophysical methods, for instance (i) diminished ordered secondary structure by spectroscopic methods; (ii) altered solvent accessibility and compactness by intrinsic or extrinsic fluorophores; (iii) change in hydrodynamic parameters by gel filtration, SAXS, viscometry, or light scattering; (iv) aberrant mobility on SDS-gel electrophoresis; (v) lack of cooperative transition upon chemical denaturant-mediated unfolding, and so forth.22 The physicochemical parameters of PacCΔ1–584 associated with each of these methods were measured and found to be characteristic of IDP-like proteins.
First, (i) far-UV CD measurements showed that the spectrum of PacCΔ1–584 at pH 8.0 was atypical with a negative peak at 200 nm (Figure 4A) and mimics that of IDP-like proteins.18 (ii) Next, intrinsic fluorescence and far-UV CD measurements were conducted in a wide pH range, pH 2–12. The intrinsic fluorescence spectrum of PacCΔ1–584, with λmax of 355–357 nm, was suggestive of a fully exposed environment for the lone tryptophan in the monitored pH range, indicating the absence of folded hydrophobic environment around tryptophan. Moreover, the secondary structure of IDP-like PacCΔ1–584 was largely resistant to changes in pH, with only a slight decrease in the negative content at highly acidic (pH 2.0) or highly alkaline (pH 12.0) buffer conditions (Figure 4A). A large increase in fluorescence quantum yield upon ANS binding under highly acidic conditions (pH 3.0 or lower) (Figure 4B) was also observed, suggesting the formation of a molten globule-like partially disordered structure at low pH and also indicative of pH-induced conformational plasticity in PacCΔ1–584. Such “turned-out” response to changes in pH has been previously observed in many IDPs, such as prothymosin-α, α-synuclein, and histidine-rich protein II, to name a few. While little or no change was observed in the far-UV CD spectra between pH 9.0 and 5.5 of these proteins, a substantial increase in negative intensity in [θ]222 upon the decrease in pH from ∼5.5 was reported that acts as a pH-induced aggregation switch in prothymosin-α and α-synuclein.23−28 IDPs are often thought to have the ability to interact with additional binding partners rendering conformational and functional heterogeneity.13 The conformational flexibility of the C-terminal tail of PacC at low pH is also expected to help in its interaction with the interacting regions A and B in the “closed” inactive state or with signaling Pal protease, as seen in A. nidulans.10 (iii) The hydrodynamic properties of PacCΔ1–584 were also estimated by SEC, which reveals an elution profile suggestive of a highly disordered protein (Figure 3A) with an extended random coil conformation.19 (iv) Like many IDPs, the migration of PacCΔ1–584 on SDS-PAGE was also anomalous, providing further support to its IDP-like properties.18
Finally, (v) GdmCl-induced denaturation of PacCΔ1–584 was found to occur in a noncooperative manner through a biphasic mode of transition (N ↔ X and X ↔ D) (Figure 5A), suggesting the lack of a tightly packed hydrophobic core in PacCΔ1–584, as seen in IDPs29,30 and reaffirming that PacCΔ1–584 is capable of a stable initial IDP-like structure, which can undergo large conformational changes upon induction, viz low pH or a chemical denaturant (GdmCl) in vitro. This conformational flexibility of the C-terminal tail will allow access to proteolytic enzymes to carry out the activation of PacC to enable its function as a transcription regulator for adaptation to pH change in host cells.
In conclusion, we show that although the C-terminal tail of PacC exhibits little or no change in the far-UV spectra at a wide range of pH, it retains structural plasticity to undergo a pH-induced conformational response at extremely acidic pH conditions. This may (i) help the tail to act as a pH sensor, (ii) be required for conformational changes for processing, or (iii) help in the overall stability of the protein by resisting and responding to pH changes through conformational changes. The current study hence emphasizes the IDP-like structure of the C-terminal tail of T. rubrum PacC that may aid its regulatory role in pH sensing in dermatophytes.
Materials and Methods
Bioinformatics Analysis
PacC was identified as a product of TERG_00838 of T. rubrum CBS118892 (NCBI Nucleotide ID: XM_003238803.1, NCBI Protein Accession ID: EGD84560). The domains, repeats, motifs and sequence features of PacC were identified with the help of SMART tool and PSIPRED.31,32 Charge hydropathy plot (CH Plot) and disordered regions in the protein were predicted using PONDR.12 A predicted three-dimensional structure of PacC was generated using Alphafold v2.0.16,17
Cloning, Expression, and Purification of C-Terminal Domains of PacC of T. rubrum
The C-terminal domain of PacC (residues 585–815 of full-length protein) was designated as PacCΔ1–584 and cloned in the pET28a-His10-Smt3 vector in fusion with His10-Smt3 tag at its N-terminus. The expression of PacCΔ1–584 was induced in Escherichia coli Rossetta (DE3) by the addition of 1 mM isopropyl-d-thiogalactoside at 37 °C for 3 h. The bacterial cells were then pelleted by centrifugation, resuspended in buffer A [20 mM Tris–HCl (pH 8.0), 300 mM NaCl, 5% glycerol, and 1 mM phenylmethylsulfonyl fluoride], and lyzed by sonication. The lyzed cells were centrifuged at 20,000g to remove the insoluble debris, and the protein was purified by Nickel affinity chromatography. The His10-Smt3 N-terminal tag was cleaved by overnight incubation with Smt3-specific protease Ulp1 (Ulp1:protein ratio was 1:500) at 4 °C. Tag-free PacCΔ1–584 was then purified by anion exchange, followed by SEC using Superdex-200. The purified protein was eluted and stored in 10 mM Tris–HCl pH 8.0, 100 mM NaCl, and 5% glycerol. The purity and integrity of PacCΔ1–584 were assessed by sodium dodecyl sulfate-polyacrylamide gel electrophoresis (SDS-PAGE). The purified protein was concentrated to 10 mg mL–1 and stored at 4 °C until further use.
MS Measurements
The purity and the molecular mass of PacCΔ1–584 were also determined by a MALDI-TOF mass spectrometer. The sample was spotted with the matrix (sinapic acid, Sigma) and analyzed in linear mode using MALDI-TOF/TOF (SCIEX 5800). The MS spectra were recorded in the mass range of 10–100 kDa, with a total shot count of 250 per spectrum after 10 subspectra and a laser intensity of 5500.
Circular Dichroism Measurements and Secondary Structure Analysis
Far-UV CD measurements of PacCΔ1–584 were carried out in the indicated buffers using a Jasco J-815 spectrophotometer equipped with a temperature controller (PTC-517). 0.1 mg/mL PacCΔ1–584 was incubated in buffers of variable pH: glycine-HCl (pH 1–3), sodium acetate (pH 4), citrate phosphate (pH 5), potassium phosphate (pH 6–8), Tris (pH 9), glycine-NaOH (pH 10–11), and CHAPS (pH 12) for 3–4 h, at 25 °C, before spectral measurements. The CD spectra were measured in the wavelength range 250–195 nm with a scan rate of 100 nm/s, 1 s response time, and bandwidth of 1 nm. Each spectrum was an average of three consecutive scans and corrected by subtraction of the blank solution with the corresponding buffers.
Isothermal GdmCl-Induced Denaturation
The equilibrium unfolding of PacCΔ1–584 in the absence and presence of different concentrations of GdmCl at pH 8.0 was measured at 25 ± 0.1 °C by far-UV CD. The stock solution of GdmCl (8 M) was prepared fresh before each experiment. Protein samples were made by taking the required amount of protein (0.1 mg/mL), denaturant, and buffer solutions and incubated at room temperature for 16 h before taking spectral measurements. The raw CD data were converted into the concentration-independent parameter [θ]λ using the relation: [θ]λ = Moθλ/10lc, where, Mo is the mean residue weight of the protein, θλ is the observed ellipticity in millidegrees at wavelength λ, c is the concentration of the protein (in mg/mL), and l is the path length of cuvette in centimeters. The mean residue ellipticity ([θ]222) was plotted as a function of molar concentration of urea. The obtained transition curves at each pH were analyzed to estimate the thermodynamic parameters associated with them using the linear extrapolation method. All spectral measurements were done in triplicates before plotting.
8-Anilino Naphthalene Sulfonic Acid Fluorescence Measurements
We performed extrinsic fluorescence measurements with the hydrophobic probe, 8-anilinonaphthalene-1-sulfonic acid (ANS), using a Fluoromax-4 spectrofluorometer. PacCΔ1–584 was incubated with 25-fold molar excess of ANS with the indicated buffer for 2 h in the dark before spectral measurements. The excitation was set at 370 nm, and emission spectra were collected in the wavelength range of 400–600 nm in a quartz cuvette of 10 mm path length, with both the excitation and emission slits set at 5 nm bandwidth. All ANS fluorescence measurements were done in duplicates at room temperature (25 °C) before plotting.
Acknowledgments
We wish to thank Shantanu Sengupta, Md. Imtiyaz Hassan, Aseem Chaphalkar, Pooja Badhwar, Sabab Hasan Khan, Dipanjali Sinha, and Pawan Kumar for useful discussions. S.S.D. acknowledges ICMR-Senior Research Fellowship (File No. 80/967/2015-ECD-1). We sincerely thank CSIR-Institute of Genomics and Integrative Biology for providing the infrastructure and central instrument lab facility. B.T. is thankful to Department of Biotechnology (DBT), Government of India, for financial assistance through DBT sanction number BT/PR20790/Med/29/1130/2016.
Supporting Information Available
The Supporting Information is available free of charge at https://pubs.acs.org/doi/10.1021/acsomega.2c04691.
Multiple sequence alignment (MSA) of PacC of selected filamentous fungi; predicted structure of PacC of Trichophyton rubrum; intrinsic fluorescence spectra of PacCΔ1–584; and ANS fluorescence measurements of GdmCl-induced unfolding states of PacCΔ1–584 (PDF)
Author Contributions
S.S.D. and B.T. conceptualized the project. S.S.D. and B.T. designed the experiments. S.S.D. and R.C. performed the experiments and acquired the data. S.S.D., R.C., and B.T. analyzed the data. The manuscript was written by SSD and BT; all authors contributed to its editing and reviewed the final version.
The authors declare no competing financial interest.
Supplementary Material
References
- Weitzman I.; Summerbell R. C. The Dermatophytes. Clin. Microbiol. Rev. 1995, 8, 240–259. 10.1128/CMR.8.2.240. [DOI] [PMC free article] [PubMed] [Google Scholar]
- Martinez-Rossi N. M.; Persinoti G. F.; Peres N. T. A.; Rossi A. Role of PH in the Pathogenesis of Dermatophytoses: PH Role in Pathogenesis of Dermatophytoses. Mycoses 2012, 55, 381–387. 10.1111/j.1439-0507.2011.02162.x. [DOI] [PubMed] [Google Scholar]
- Ciesielska A.; Kawa A.; Kanarek K.; Soboń A.; Szewczyk R. Metabolomic Analysis of Trichophyton Rubrum and Microsporum Canis during Keratin Degradation. Sci. Rep. 2021, 11, 3959. 10.1038/s41598-021-83632-z. [DOI] [PMC free article] [PubMed] [Google Scholar]
- Ferreira-Nozawa M. S.; Silveira H. C. S.; Ono C. J.; Fachin A. L.; Rossi A.; Martinez-Rossi N. M. The PH Signaling Transcription Factor PacC Mediates the Growth of Trichophyton Rubrum on Human Nail in vitro. Med. Mycol. 2006, 44, 641–645. 10.1080/13693780600876553. [DOI] [PubMed] [Google Scholar]
- Cruz A. H. S.; Santos R. S.; Martins M. P.; Peres N. T. A.; Trevisan G. L.; Mendes N. S.; Martinez-Rossi N. M.; Rossi A. Relevance of Nutrient-Sensing in the Pathogenesis of Trichophyton Rubrum and Trichophyton Interdigitale. Front. Fungal Biol. 2022, 3, 858968 10.3389/ffunb.2022.858968. [DOI] [PMC free article] [PubMed] [Google Scholar]
- Li W.; Mitchell A. P. Proteolytic Activation of Rim1p, a Positive Regulator of Yeast Sporulation and Invasive Growth. Genetics 1997, 145, 63–73. 10.1093/genetics/145.1.63. [DOI] [PMC free article] [PubMed] [Google Scholar]
- Xu W.; Mitchell A. P. Yeast PalA/AIP1/Alix Homolog Rim20p Associates with a PEST-Like Region and Is Required for Its Proteolytic Cleavage. J. Bacteriol. 2001, 183, 6917–6923. 10.1128/JB.183.23.6917-6923.2001. [DOI] [PMC free article] [PubMed] [Google Scholar]
- Díez E.; Álvaro J.; Espeso E. A.; Rainbow L.; Suárez T.; Tilburn J.; Arst H. N.; Peñalva M. Á. Activation of the Aspergillus PacC Zinc Finger Transcription Factor Requires Two Proteolytic Steps. EMBO J. 2002, 21, 1350–1359. 10.1093/emboj/21.6.1350. [DOI] [PMC free article] [PubMed] [Google Scholar]
- Mingot J.-M.; Tilburn J.; Diez E.; Bignell E.; Orejas M.; Widdick D. A.; Sarkar S.; Brown C. V.; Caddick M. X.; Espeso E. A.; et al. Specificity Determinants of Proteolytic Processing of Aspergillus PacC Transcription Factor Are Remote from the Processing Site, and Processing Occurs in Yeast If PH Signalling Is Bypassed. Mol. Cell. Biol. 1999, 19, 1390–1400. 10.1128/MCB.19.2.1390. [DOI] [PMC free article] [PubMed] [Google Scholar]
- Peñas M. M.; Hervás-Aguilar A.; Múnera-Huertas T.; Reoyo E.; Peñalva M. Á.; Arst H. N.; Tilburn J. Further Characterization of the Signaling Proteolysis Step in the Aspergillus Nidulans PH Signal Transduction Pathway. Eukaryotic Cell 2007, 6, 960–970. 10.1128/EC.00047-07. [DOI] [PMC free article] [PubMed] [Google Scholar]
- Hervás-Aguilar A.; RodrÁguez J. M.; Tilburn J.; Arst H. N.; Peñalva M. A. Evidence for the Direct Involvement of the Proteasome in the Proteolytic Processing of the Aspergillus Nidulans Zinc Finger Transcription Factor PacC. J. Biol. Chem. 2007, 282, 34735–34747. 10.1074/jbc.M706723200. [DOI] [PubMed] [Google Scholar]
- Xue B.; Dunbrack R. L.; Williams R. W.; Dunker A. K.; Uversky V. N. PONDR-FIT: A Meta-Predictor of Intrinsically Disordered Amino Acids. Biochim. Biophys. Acta 2010, 1804, 996–1010. 10.1016/j.bbapap.2010.01.011. [DOI] [PMC free article] [PubMed] [Google Scholar]
- Radivojac P.; Iakoucheva L. M.; Oldfield C. J.; Obradovic Z.; Uversky V. N.; Dunker A. K. Intrinsic Disorder and Functional Proteomics. Biophys. J. 2007, 92, 1439–1456. 10.1529/biophysj.106.094045. [DOI] [PMC free article] [PubMed] [Google Scholar]
- Turoverov K. K.; Kuznetsova I. M.; Uversky V. N. The Protein Kingdom Extended: Ordered and Intrinsically Disordered Proteins, Their Folding, Supramolecular Complex Formation, and Aggregation. Prog. Biophys. Mol. Biol. 2010, 102, 73–84. 10.1016/j.pbiomolbio.2010.01.003. [DOI] [PMC free article] [PubMed] [Google Scholar]
- Uversky V. N. Intrinsically Disordered Proteins and Their “Mysterious” (Meta)Physics. Front. Phys. 2019, 7, 10. 10.3389/fphy.2019.00010. [DOI] [Google Scholar]
- Jumper J.; Evans R.; Pritzel A.; Green T.; Figurnov M.; Ronneberger O.; Tunyasuvunakool K.; Bates R.; Žídek A.; Potapenko A.; et al. Highly Accurate Protein Structure Prediction with AlphaFold. Nature 2021, 596, 583–589. 10.1038/s41586-021-03819-2. [DOI] [PMC free article] [PubMed] [Google Scholar]
- Tunyasuvunakool K.; Adler J.; Wu Z.; Green T.; Zielinski M.; Žídek A.; Bridgland A.; Cowie A.; Meyer C.; Laydon A.; et al. Highly Accurate Protein Structure Prediction for the Human Proteome. Nature 2021, 596, 590–596. 10.1038/s41586-021-03828-1. [DOI] [PMC free article] [PubMed] [Google Scholar]
- Tompa P. Intrinsically Unstructured Proteins. Trends Biochem. Sci. 2002, 27, 527–533. 10.1016/S0968-0004(02)02169-2. [DOI] [PubMed] [Google Scholar]
- Choi U. B.; McCann J. J.; Weninger K. R.; Bowen M. E. Beyond the Random Coil: Stochastic Conformational Switching in Intrinsically Disordered Proteins. Structure 2011, 19, 566–576. 10.1016/j.str.2011.01.011. [DOI] [PMC free article] [PubMed] [Google Scholar]
- Ramon A. M.; Porta A.; Fonzi W. A. Effect of Environmental pH on Morphological Development of Candida albicans Is Mediated via the PacC-Related Transcription Factor Encoded by PRR2. J. Bacteriol. 1999, 181, 7524–7530. 10.1128/JB.181.24.7524-7530.1999. [DOI] [PMC free article] [PubMed] [Google Scholar]
- Peñalva M. A.; Lucena-Agell D.; Arst H. N. Liaison Alcaline: Pals Entice Non-endosomal ESCRTs to the plasma pembrane for pH pignaling. Curr. Opin. Microbiol. 2014, 22, 49–59. 10.1016/j.mib.2014.09.005. [DOI] [PubMed] [Google Scholar]
- Uversky V. N.; Oldfield C. J.; Dunker A. K. Showing your ID: intrinsic disorder as an ID for recognition, regulation and cell signaling. J. Mol. Recognit. 2005, 18, 343–384. 10.1002/jmr.747. [DOI] [PubMed] [Google Scholar]
- Lynn A.; Chandra S.; Malhotra P.; Chauhan V. S. Heme binding and polymerization by Plasmodium falciparum histidine rich protein II: influence of pH on activity and conformation. FEBS Lett. 1999, 459, 267–271. 10.1016/s0014-5793(99)01260-0. [DOI] [PubMed] [Google Scholar]
- Uversky V.; Li J.; Fink A. Evidence for a partially folded intermediate in α–synuclein fibril formation. J. Biol. Chem. 2001, 276, 10737–10744. 10.1074/jbc.M010907200. [DOI] [PubMed] [Google Scholar]
- Uversky V. N.; Gillespie J. R.; Millett I. S.; Khodyakova A. V.; Vasiliev A. M.; Chernovskaya T. V.; Vasilenko R. N.; Kozlovskaya G. D.; Dolgikh D. A.; Fink A. L.; Doniach S.; Abramov V. M. Natively unfolded human prothymosin alpha adopts partially folded collapsed conformation at acidic pH. Biochemistry 1999, 38, 15009–15016. 10.1021/bi990752+. [DOI] [PubMed] [Google Scholar]
- Uversky V. N.; Li J.; Fink A. L. Evidence for a partially folded intermediate in alpha-synuclein fibril formation. J. Biol. Chem. 2001, 276, 10737–10744. 10.1074/jbc.M010907200. [DOI] [PubMed] [Google Scholar]
- Uversky V. N. Paradoxes and wonders of intrinsic disorder: Stability of instability. Intrinsically Disord. Proteins 2017, 5, e1327757 10.1080/21690707.2017.1327757. [DOI] [PMC free article] [PubMed] [Google Scholar]
- Baidya L.; Reddy G. pH Induced Switch in the Conformational Ensemble of Intrinsically Disordered Protein Prothymosin-α and Its Implications for Amyloid Fibril Formation. J. Phys. Chem. Lett. 2022, 13, 9589–9598. 10.1021/acs.jpclett.2c01972. [DOI] [PubMed] [Google Scholar]
- Neyroz P.; Zambelli B.; Ciurli S. Intrinsically Disordered Structure of Bacillus Pasteurii UreG As Revealed by Steady-State and Time-Resolved Fluorescence Spectroscopy. Biochemistry 2006, 45, 8918–8930. 10.1021/bi060227s. [DOI] [PubMed] [Google Scholar]
- Popelka H.; Uversky V. N.; Klionsky D. J. Identification of Atg3 as an Intrinsically Disordered Polypeptide Yields Insights into the Molecular Dynamics of Autophagy-Related Proteins in Yeast. Autophagy 2014, 10, 1093–1104. 10.4161/auto.28616. [DOI] [PMC free article] [PubMed] [Google Scholar]
- Letunic I.; Bork P. 20 Years of the SMART Protein Domain Annotation Resource. Nucleic Acids Res. 2018, 46, D493–D496. 10.1093/nar/gkx922. [DOI] [PMC free article] [PubMed] [Google Scholar]
- Buchan D. W. A.; Jones D. T. The PSIPRED Protein Analysis Workbench: 20 years on. Nucleic Acids Res. 2019, 47, W402–W407. 10.1093/nar/gkz297. [DOI] [PMC free article] [PubMed] [Google Scholar]
Associated Data
This section collects any data citations, data availability statements, or supplementary materials included in this article.