

Abstract

Heavy-oil fly ash (HOFA) is a graphitic carbon powder extracted in vast amounts as a waste material from burning crude oil in power plants. This HOFA has attractive structural properties besides its high amount of pure carbon (∼90 wt %). This powder exists in spherical, highly porous micron-sized particles, which implies its great potential as a mechanical reinforcement for different polymers. In this work, HOFA has been utilized to enhance the mechanical properties of epoxy flooring at HOFA weight fractions of 0, 1, 1.6, and 3.2 wt %. The obtained results revealed that the prepared epoxy-flooring/HOFA composites at a HOFA content of 1.6 wt % showed significant mechanical improvements compared with the pristine polymer. The tensile strength and Young’s module values were enhanced by ∼17 and 11%, respectively. Furthermore, the neutron-shielding performance was investigated. The composite with 1.6 wt % showed better neutron attenuation and lower transmittance than the pristine epoxy. The chemical resistance was also extensively studied against sodium hydroxide, nitric acid, and sulfuric acid. The changes in morphology, chemical elements, mass, volume, and molecular structures were investigated rigorously for pristine epoxy and its composite with HOFA at 1.6 wt %. After exposure to these chemicals for 21 days, the tested properties of the epoxy-flooring/HOFA composite showed better chemical resistance than that of the pristine epoxy. Where the epoxy-flooring/HOFA composite showed a surface with low cracks and blistering, it showed lesser changes in mass and volume and fewer molecular structure changes. These results indicated that it is possible to use this multifunctional composite for several applications, including the petrochemical industry, radiation shielding, construction, and automobiles.
1. Introduction
Polymers’ uses have increased significantly because of their adorable properties, such as low cost, lightweight, and ease of use. Therefore, metals or ceramics have been replaced with polymers in many applications. The most significant advantage of polymers is that they allow using different additives and fillers to produce composites and materials with new enhanced properties for various purposes.1 Epoxy is a kind of polymer; it is used for even many forked applications, such as the textile and food industry, medical manufacturing, automobiles, petrochemical factories, printers, filling facilities, and laboratories.2−6 It is also utilized for bottles, hospital instrumentation, aircraft hangars, rubber and plastic factories, warehousing, TV rooms, electrical insulators, and terrace coatings.2−6 It can be used for wood coating.7 Epoxy flooring is a kind of epoxy that is applied as a top surface floor and for coating. The advantage of epoxy flooring is its resistance to various chemical materials, even if they are hot or cold solutions. It has considerable high strength, abrasion resistance, hardness, no need for joints, ease of seamless application, curing at room temperature with low shrinkage, and is readily maintained.8,9 Besides, it has excellent adhesion to different materials and substrates, is skid-resistant, and has an adorable appearance.8,9 Epoxy flooring can be filled with varying fillers of additives such as sand, which can be added to industrial epoxy flooring and reach up to 85%.9
Heavy-oil fly ash (HOFA) is a black waste material extracted in vast amounts as a waste material from the burning of crude oil in power plants.10,11 It contains a high ratio of carbon.12 It has been used in different applications such as asphalt,10,13 lubricants,14 filler materials in polymers,15−17 and cement industries.18 It was used as a carbon source for preparing carbon nanotubes.19,20 Besides, it was used in environmental applications, such as in mosquito larvicides21 and removing pollutants such as dyes22 and hydrogen sulfide.23 The high ratio of carbon in the HOFA makes it a good selection for forming new polymer composites.
The usage of nuclear technology in different areas, such as in nuclear medicine, has increased, where many ionizing radiations such as X- and gamma rays are used for diagnosis and treatment. Currently, neutrons have become one choice in advanced medical centers for therapy. Nuclear technology demands shielding materials against radiation that could harm the human body even at a low dose.24−28 Many shielding materials, such as lead and concrete, are used as shields. For neutrons, materials with low Z are preferred. Therefore, materials rich in hydrogen, such as water and wax, are appropriate for neutron radiation shielding. Epoxy is also rich in hydrogen, making it a good neutron radiation shielding. Many studies reported2,29−31 that epoxy has good shielding properties against neutrons.
On the one hand, to the best of our knowledge, although there are extensive studies on adding different fillers, including fly ash, into various epoxies, studies on epoxy flooring are still limited and scarce. On the other hand, there is no study on the neutron shielding property of epoxy flooring. We aim in the present work to utilize the waste HOFA as a filler material, which was introduced to form epoxy-flooring/HOFA composites for neutron radiation shielding application and to enhance mechanical performances and chemical resistance. We first prepared the epoxy-flooring/HOFA composites at different ratios of HOFA, namely, 1, 1.6, and 3.2 wt %. Then, the structural, thermal, and mechanical properties were investigated, besides their neutron radiation shielding property. The chemical resistance was also extensively studied against acids and alkalis. In the following sections, more details about the preparation methods and the obtained results are included, besides discussing the results.
2. Materials and Methods
2.1. Materials
The HOFA used in this work was from the Rabigh Power Plant located in Rabigh in western Saudi Arabia on the coast of the Red Sea. The epoxy flooring used in this work was NITOFLOR FC150 (FOSROC, Jorden). According to the datasheet of this epoxy from the supplier, the contents of its base are epoxy resin (type A), dodecyl and tetradecyl glycidyl ethers, dibutyl phthalate, and quartz; their chemical structures are shown in Figure 1a–d. The contents of the hardener are isophoronediamine, benzyl alcohol, and salicylic acid, and their chemical structures are presented in Figure 1e–g. Sodium hydroxide (NaOH) in the pellet form, nitric acid (HNO3), and sulfuric acid (H2SO4) were obtained from Sigma (Sigma-Aldrich, Germany)
Figure 1.

Chemical structures of epoxy NITOFLOR FC150 base contents (a) epoxy resin (type A), (b) dodecyl and tetradecyl glycidyl ethers, (c) dibutyl phthalate, and (d) quartz. The chemical structures of the hardener contain (e) isophoronediamine, (f) benzyl alcohol, and (g) salicylic acid.
2.2. Preparation of Epoxy-Flooring/HOFA Composites
The epoxy-flooring/HOFA composites were prepared according to the published work32 with necessary modifications. Here, the fly ash powder was added to the base epoxy with a HOFA content of 1, 1.6, and 3.2 wt %. After that, the mixtures were blended under mechanical stirring using a heavy-duty mixer head, model EW-50007-15 (Stir-Pak, Canada). Stirring was for 1 h (h) at a speed rotation of 100 rpm. Then, the mixtures were sonicated via an ultrasonic bath, model CPX 5800 (Branson Ultrasonics, USA), for 3 h and then degassed for 1 h. Then, the hardener was added to the mixture under mechanical stirring for 10 min. Then, the mixtures were poured into specific molds designed exactly according to the ASTM D638 to form type I flat dog bone specimens. Finally, the molded blends were left for 24 h until they solidified and cured at 80 °C for 2 h. The prepared composites’ structural, thermal, mechanical, neutron shielding, and chemical-resistance properties were investigated.
2.3. Characterization Techniques
The surface morphologies of the prepared epoxy-flooring/HOFA composites, besides the HOFA powder, were studied using the scanning electron microscope model JSM-7600F (JEOL, Japan). The chemical element compositions of the prepared composite samples were evaluated using energy-dispersive X-ray spectroscopy (EDS) merged with SEM in one instrument. For SEM, the samples were molded in sheets with a 1.5 mm thickness. From every specimen, a piece was taken and captured by SEM. The pieces were made firm using a particular conductive carbon tape made for imaging by SEM. Then, they were coated with a nanothin layer of platinum to avert the sample charging during focusing the electron beams while taking the SEM images. For EDS analysis, five places were analyzed. The mean value of every element’s weight was calculated from the five measurements. The molecular structures of the prepared composites were investigated using Fourier-transform infrared (FTIR) spectroscopy, model Nicolet iS10 FTIR (Thermo Scientific, USA). Every FTIR spectrum was recorded in the spectral range of 3200–600 cm–1 in the attenuated total reflection sampling technique. At a spectral resolution of 4 cm–1, every FTIR spectrum was generated from an average of 40 scans. The thermogravimetric analysis (TGA) of the prepared composites was carried out under a nitrogen atmosphere in the temperature range starting from room temperature up to 873 K with a 10 K/min heating rate using NETZSCH, model Jupiter STA 449F5 (NETZSCH-Gerätebau GmbH, Germany). The thermal conductivity and diffusivity were also investigated under vacuum at temperatures 300, 320, and 350 K via a laser flash thermal analyzer, model LFA-1000 (Linseis, Germany).
The mechanical properties of the prepared composites were investigated. The tensile tests were carried out via the material testing machine, model LRX Plus (Lloyd Instruments Ltd., UK), at a speed rate of 5 mm/min. The mechanical features, namely, Young’s modulus and the tensile strength, were estimated. Furthermore, a nanoindentation test was carried out using a nanoindentation machine, model NanoTest Vantage (Micro Materials Ltd, UK). The nanoindentation was carried out based on the published work,33 where the load-depth curve and hardness were obtained.
2.4. Neutron Shielding Investigation
After the mechanical tests, the composite that showed the best mechanical properties was selected to be tested for shielding against neutron radiation besides the pristine epoxy flooring. The mechanical tests revealed that the epoxy-flooring/HOFA composite at a HOFA content of 1.6 wt % showed the best mechanical features. Accordingly, we investigated the prepared pristine epoxy flooring and its composite with HOFA at 1.6 wt %. The samples were irradiated using a neutron irradiator, in which two 241Am–Be neutron sources were used with a radioactivity of 5 and 3 Ci. The neutron energy spectrum of the 241Am–Be neutron source starts from 0 to 11 MeV with an average energy of 4.5 MeV and a neutron emission of 2.2 × 10⁶ neutron s–1·Ci–1.34 We recorded the neutron intensity at different samples’ thicknesses via a neutron counter, model TN15 (Kromek, USA).
2.5. Chemical Resistance Tests
NaOH, HNO3, and H2SO4 are the chemicals that were used to investigate the chemical resistance of the pristine epoxy flooring and its composite at a HOFA content of 1.6 wt %. These three chemicals were prepared in the form of solutions where the NaOH solution was prepared by dissolving it in deionized water at a concentration of 0.1 g/mL, and the HNO3 and H2SO4 solutions were prepared by diluting them separately in deionized water at a concentration of 10% by the volume. The tested samples were prepared in a sheet form with the dimensions of 1 × 1 cm and 3 mm thickness; more than 20 sheets were tested to estimate the chemical resistance. The tested samples were immersed in the solution and left for 3 weeks. At the end of the third week, they were taken out from the solution, washed five times with deionized water, and then dried at a temperature of 40 °C and air atmosphere. After that, their masses and volumes were recorded and compared with their values before being immersed in the chemicals. Besides, their surface morphology, chemical element compositions, and chemical group function were investigated using SEM, EDS, and FTIR spectroscopy, respectively.
3. Results and Discussion
The morphology of the used HOFA was investigated using SEM; then, the particle sizes and their size distributions were estimated; the chemical elements’ weight ratios were also evaluated using EDS. The obtained results are shown in Figure 2, where Figure 2a shows the SEM image for the HOFA particles; it can be observed that the particles have spherical shapes with pores distributing on the surface of the particles. Figure 2b displays HOFA particle size distributions (histogram); the distributions show that the particle sizes start from nearly 10 μm up to 90 μm with an average value of 40.92 ± 17.90 μm. Figure 2c displays the EDS spectrum for HOFA, indicating the presence of carbon (C), oxygen (O), sulfur (S), and silicon (S); the estimated weight percentage of C, O, S, and Si are 89.54, 1.9, 7.06, and 1.5, respectively, as presented in a pie chart (Figure 2d).
Figure 2.

Structural characteristics of HOFA (a) SEM, (b) particle size distributions (histogram), (c) EDS spectrum, and (d) weight ratio of the chemical elements in the pie chart.
The surface morphologies of the epoxy flooring composites with HOFA at the contents of 1, 1.6, and 3.2 wt %, besides the pristine epoxy, were investigated. The captured SEM images are shown in Figure 3. The SEM image of the pristine epoxy surface is exhibited in Figure 3a; no particles or fragments can be seen on the surface of the pristine epoxy. However, some particles and fragments appearing as fillers in the epoxy flooring composites with HOFA at the contents of 1, 1.6, and 3.2 wt % can be observed in their SEM images in Figure 3b–d, respectively. The SEM image of the pristine epoxy surface shows that the pristine epoxy surface seemed to be smoother than the surface of the epoxy flooring composites with HOFA. The particles and fragments belonging to the added HOFA could increase the skid resistance, which is considered a desirable property in the epoxy used to coat the floors to avoid slipping and falling.35,36
Figure 3.

SEM images of the prepared epoxy-flooring/HOFA composites at a HOFA content of (a) 0 (pristine), (b) 1, (c) 1.6, and (d) 3.2 wt %.
The molecular structures of the epoxy-flooring/HOFA composites at HOFA content of 1, 1.6, and 3.2 wt %, besides the pristine epoxy and powder of HOFA, were studied via FTIR spectroscopy. The recorded FTIR spectra are shown in Figure 4. The spectra showed many absorption peaks reflecting the molecular structure of the tested samples. The FTIR spectra of the epoxy-flooring/HOFA composites showed nearly similar spectral characteristics to the spectral characteristics of the pristine epoxy. However, the peak intensities of the composites decreased somewhat at higher HOFA contents. No peaks were observed in the FTIR spectra of pristine HOFA. The peaks in the FTIR absorption spectra in the range between 3010 and 2800 cm–1 could be attributed to the stretching vibration modes of methylene (CH3), methane (CH2), and methine (CH) groups in the aliphatic and aromatic structures.37 The peaks in the range 1630–1410 cm–1 might be referred to as C=C bonds in the aromatic molecular structure.38 Besides, the peaks in the spectral range of 1390–1150 cm–1 can be assigned to the C–O group of the rings’ of the phenols and aromatic structures.37,38 The peaks between 1130 and 1050 cm–1 could be attributed to the asymmetric stretching vibration of Si–O–Si in the quartz39−41 included in the epoxy base. The FTIR peaks in the range of 1050–720 cm–1 might be assigned to the oxirane groups’ symmetric/asymmetric stretching vibration mode C–O–C.38
Figure 4.

FTIR spectra of prepared pristine epoxy flooring and epoxy-flooring/HOFA composites at HOFA contents of 1, 1.6, and 3.2 wt % besides the pristine HOFA.
The thermal stability of the pristine and the epoxy-flooring/HOFA composites was investigated. The recorded TGA and derivative of TG (DTG) curves in the temperature range starting from room temperature up to 873 K are shown in Figure 5. The thermal stability tests were carried out under a nitrogen atmosphere. The mass change percentages (Figure 5a) curves showed a thermal decomposition step in the temperature range of ∼608–713 K. This step appeared in the first DTG curves as a peak center at 650 ± 5 K (Figure 5b). TGA and DTG for the tested samples revealed that the prepared epoxy-flooring/HOFA composites appeared to have similar thermal decomposition to the pristine epoxy flooring. No significant differences were detected in the TG and DTG, indicating the addition of HOFA at content up to 3.2 % to the epoxy flooring did not change thermal stability.
Figure 5.

Thermal analysis of the pristine epoxy flooring and its composites with HOFA at the contents of 1, 1.6, and 3.2 wt % (a) TGA, (b) DTG, (c) thermal conductivity, and (d) thermal diffusivity.
The thermal properties, that is, thermal conductivity and diffusivity of pristine epoxy flooring and its composites with HOFA, were explored at 300, 320, and 350 K. The results are presented in Figure 5. The pristine epoxy flooring thermal conductivity at 300 K was 0.482 W·m–1·K–1. It exhibited tiny increases while adding HOFA to be 0.5, 0.51, and 0.53 W·m–1·K–1 for the epoxy-flooring/HOFA composites at HOFA contents of 0, 1, 1.6, and 3.2 wt %, respectively. Then, it decreased tiny while increasing the temperature to 320 and 350 K. In general, the prepared composites showed nearly the same pristine epoxy flooring (Figure 5c). The thermal diffusivity presented almost the same behavior as thermal conductivity. At 300 K, it was 0.203 mm·s–1 for pristine epoxy. Then, it increased to 0.212, 0.22, and 0.24 mm·s–1 for the epoxy-flooring/HOFA composites at HOFA contents of 1, 1.6, and 3.2 wt %, respectively. The thermal diffusivity decreased while the temperature increased. At 350 K, it dropped to 0.17, 0.195, 0.20, and 0.21 mm·s–1 (Figure 5c) for the pristine epoxy and the prepared composites at HOFA contents of 1, 1.6, and 3.2 wt %, respectively. The increase in the thermal properties while adding HOFA to the epoxy flooring could be illustrated through the fact that the HOFA contains some chemical elements: sulfur and silicon (see the analysis of the chemical elements in Figure 2c,d). These chemical elements could enhance the thermal conductivity and diffusivity of the epoxy flooring with HOFA composites.
The mechanical properties, namely, Young’s modulus and tensile strength of the prepared composites and pristine epoxy, were investigated; the results can be seen in Figure 6. Young’s modulus (Figure 6a) was 2454.6, 2484.5, 2723.8, and 2274.5 MPa for the prepared pristine epoxy flooring and its composites at HOFA contents of 1, 1.6, and 3.2 wt %, respectively. At the same time, the tensile strength (Figure 6b) was 31.89, 32.91, 37.32, and 20.01 Mpa, respectively. The results of Young’s modulus and tensile strength revealed that there are enhancements in their values while adding HOFA at the contents of 1 and 1.6 wt %, and their values decreased at the HOFA contents of 3.2 wt %. The improvements in the prepared composites at HOFA contents of 1 and 1.6 wt % could be interpreted through the surface of HOFA particles. They have porous surfaces that play a role in the formation of mechanical bonding in the composites that enhance the mechanical properties of the material where mechanical bonding enhances the adherence between the surfaces of the materials, leading to them being fixed together when they are solidified using an interlocking effect.42 However, the prepared composite at a HOFA content of 3.2 wt % showed negative impacts in the values of Young’s modulus and tensile strength. It is almost supposed that the more the additive ratio of filler, the more the improvement in the composites’ properties until the limit at which any further addition leads to a noncoherent and frangible composite.43 We think the negative effects in the mechanical properties that resulted when adding the higher ratio of HOFA of nearly 3.2 wt % could be understood for two reasons: the viscosity of the epoxy flooring and the particle size of the HOFA. The epoxy flooring polymer is nearly like a paste; its viscosity is high. It was mentioned43 that the higher the viscosity of the matrix material, the lesser the filler that can be integrated to achieve the best benefits in the fabricated composite. Adding a higher ratio of the filler to the highly viscous polymer could reduce the interfacial bonding between the polymer matrix and filler, weakening the fabricated composites’ mechanical properties.44
Figure 6.

Mechanical properties of the epoxy-flooring/HOFA composites at HOFA contents of 1, 1.6, and 3.2 wt % besides the pristine epoxy flooring: (a) Young’s modulus, (b) tensile strength, and (c) different molded wares from epoxy-flooring/HOFA composites.
On the other hand, the mean particle size of the HOFA is 40.92 ± 17.90 μm (see the SEM results in Figure 2). It was reported45 that the filler’s particle size could play a crucial role in the mechanical properties of the composites. The mechanical properties could depend on particle size due to the filler’s surface-to-volume ratio. Therefore, an equilibrium between the effective cross-linking due to the surface area of the filler and its ratio is necessary.45 From the epoxy-flooring/HOFA composites, we successfully molded different wares, such as containers, pipes, and bars, as seen in Figure 6c.
The prepared composite at a HOFA content of 1.6 wt % that showed the best results of Young’s modulus and tensile strength was selected to study by nanoindentation test besides the pristine epoxy flooring for comparison. The nanoindentation technique with atomic force microscopy (AFM) images for shallow depths by low loads is used to measure the hardness of the surface.46 Nanoindentation pits were performed at four loads of 20, 50, 100, and 130 mN. Figure 7 shows the achieved results with the nanoindentation test. Figure 7a displays the indentation loop (loading and holding curves) resulting from loading and unloading procedures at a load of 130 mN applied on both pristine epoxy flooring and its composite with HOFA at 1.6 wt %. Their hardnesses at the load of 130 mN were extracted from the nanoindentation experiments and found to be 25.61 ± 1.2 and 29.19 ± 1.1 MPa, respectively. Figure 7b1–b3) displays the AFM images for the indentations at the four loads of 20, 50, 100, and 130 mN applied on the pristine epoxy. At the same time, Figure 7c1–c3) shows the AFM images when the loads were applied on the epoxy composite with HOFA at 1.6 wt %. AFM images were captured for two-dimensional (2D) top view, three-dimensional (3D) top view, and 3D lateral view. Figure 7b2,b3,c2,c3 display the prominence of fragmentations accumulating around the pits’ edges; this could be because of the cohesive weakness47 in the samples. However, the fragments accumulated around the pits’ edges in the pristine epoxy (Figure 7b2,b3) were more than those of epoxy composites with HOFA (Figure 7c2,c3), meaning that the cohesiveness of the composites is stronger than that of pristine epoxy. This result could illustrate the reason for enhancing the hardness of epoxy-flooring composites with HOFA compared with pristine ones.
Figure 7.

(a) Nanoindentation testing at a maximum load of 130 mN applied on both pristine epoxy flooring and its composite with HOFA at 1.6 wt %. (bi and cii = 1, 2, and 3) AFM images for nanoindentation at four loads of 20, 50, 100, and 130 mN. The topography images were recorded for 2D top view, 3D top view, and 3D lateral view.
The neutron-shielding performances for the pristine epoxy flooring and the prepared composites were investigated using the 241Am–Be neutron source. Plates at a thickness of 15 mm from the tested samples were prepared and irradiated with neutrons. The intensity percentage of the transmitted neutron through the plate versus the HOFA content of 0, 1, 1.6, and 3.2 wt % are shown in Figure 8a. Here, the HOFA content of 0 represents the pristine epoxy flooring. As seen in Figure 8a, the neutron-shielding performance of the epoxy flooring improved a little bit while adding HOFA. We also tested the neutron-shielding performance of both pristine epoxy flooring and its composite with HOFA at 1.6 wt %. The intensity percentages of the transmitted neutron through the tested samples versus the thickness are exhibited in Figure 8b. It is expected for neutron shielding that the intensity percentage of the transmitted neutron must decrease as the thickness increases. This expectation can be noticed in Figure 8b, where the transmitted neutron was 60 and 57%, respectively. Typically, for neutron shielding, very thick layers of materials are used. In this work, the 15 mm thickness started showing a measurable attenuation, reaching 58% at 90 mm. These results indicate that the epoxy flooring could be used in the neutron shielding application. Moreover, the prepared epoxy composite with HOFA at 1.6 wt % manifested better neutron-shielding performance. This result could indicate that adding HOFA as a filler to epoxy flooring might enhance the neutron-shielding performance of the epoxy. We must mention that molded bricks were molded easily from the epoxy-flooring/HOFA composite with different shapes and thicknesses, as seen in Figure 8c.
Figure 8.

Neutron-shielding performance: (a) intensity percentage of transmitted neutrons for the epoxy-flooring/HOFA composites at HOFA contents of 0, 1, 1.6, and 3.2 wt % at a thickness of 15 mm, (b) intensity percentage of transmitted neutrons for the pristine epoxy flooring and its composite at HOFA content 1.6 vs the thicknesses, and (c) molded bricks from the epoxy-flooring/HOFA composite with different shapes and thicknesses. Typically, for neutron shielding, very thick layers of materials are used. In this work, the 15 mm thickness started showing a measurable attenuation, reaching 58% at 90 mm.
The prepared epoxy composite with HOFA at 1.6 wt %, which showed the best mechanical properties among the prepared epoxy-flooring/HOFA composites, was selected to study the chemical resistance. The pristine epoxy flooring and its composite with HOFA at 1.6 wt % were tested for chemical resistance. They were tested under the effect of the solution NaOH, HNO3, and H2SO4. They were immersed in the chemical solution for 21 days. Their surfaces were then investigated. Their SEM micrographs for the exterior are shown in Figures 9 and 10, respectively. The SEM micrographs of the pristine epoxy sample that was not exposed to any chemical besides those exposed to chemicals are demonstrated in Figure 9a–d. The pristine epoxy sample treated with no chemicals shows a fine and relatively smooth surface (Figure 9a). In contrast, different shapes of blisters spread on the surface of the sample treated with NaOH (Figure 9b). Also, the pristine epoxy samples treated with HNO3 and H2SO4 showed considerable changes in their character (Figures 9c and 11d) compared with the sample treated with no chemicals. They revealed that their soft surfaces totally got damaged and became sporadic. Clearly, they showed irregular and coarse surfaces, with different blisters, bubbles, and holes. Many cracks could be seen on their surfaces. These observations could indicate the ability of the NaOH, HNO3, and H2SO4 to change and alter the surface of the epoxy flooring. The SEM micrographs of the prepared composite at HOFA 1.6 wt % samples untreated and treated with NaOH, HNO3, and H2SO4 are displayed in Figure 10a–d. The SEM image for the surface of the untreated sample (Figure 10a) showed a fine texture with spread fragments and buried puckers that could be attributed to the HOFA particles. At the same time, some layers appear on the surface of the sample exposed to NaOH (Figure 10b). Besides, the sample treated with HNO3 shows a fine texture with few small blisters and tiny tight cracks (Figure 10c). Small sheets, small blisters, and furrows can be observed in the sample treated with H2SO4 (Figure 10d). Generally, although the chemicals changed the character of prepared composite epoxy flooring with HOFA at 1.6 wt %, the changes in the pristine epoxy were more considerable (compare Figures 9 and 10).
Figure 9.

Captured SEM images for the surface of the pristine epoxy flooring under the effects of (a) no chemical, (b) NaOH, (c) HNO3, and (d) H2SO4.
Figure 10.

SEM images of the surface of the prepared epoxy-flooring composite at a HOFA content of 1.6 wt % under the effects of (a) no chemical, (b) NaOH, (c) HNO3, and (d) H2SO4.
Figure 11.

Chemical elements via the EDS spectra for the prepared pristine epoxy flooring under the effects of (a) no chemical, (b) NaOH, (c) HNO3, and (d) H2SO4; chemical elements’ weight ratio are in the inset figure.
We investigated the chemical elements for the tested samples under the effects of the chemical using EDS; the recorded EDS spectra for the pristine epoxy flooring and the prepared composite with HOFA at 1.6 wt % are presented in Figures 11 and 12, respectively. EDS spectra showed the existence of different chemical elements: C, O, and Si exist in both untreated samples (Figures 11a and 12a). At the same time, the elements: C, O, Si, and Na were in samples treated with NaOH (Figures 11b and 12b). The presence of Na could result from NaOH. Also, we found the elements C, O, and Si in the samples treated with HNO3 (Figures 11c and 12c). Besides, the elements C, O, Si, and S were found in the samples treated with H2SO4 (Figures 11d and 12d). The presence of S could result from H2SO4.
Figure 12.

Chemical elements via the EDS spectra for the prepared composite at a HOFA content of 1.6 wt % under the effects of (a) no chemical, (b) NaOH, (c) HNO3, and (d) H2SO4; chemical elements’ weight ratio are in the inset figure.
We listed the chemical element weight ratios in Table 1 to ease the comparison between the samples. The chemical element analysis revealed increases in the O weight ratios and decreases in the C weight ratios of samples exposed to NaOH, HNO3, and H2SO4. These changes in the chemical elements were more significant in the pristine epoxy than in the prepared composite of epoxy with HOFA at 1.6 wt %.
Table 1. Chemical Element Analysis of the Pristine Epoxy Flooring and Its Composite at a HOFA Content of 1.6 wt % Treated with No Chemical, NaOH, HNO3, and H2SO4.
| pristine epoxy flooring |
1.6 wt % HOFA |
|||||||
|---|---|---|---|---|---|---|---|---|
| element | no chemical | NaOH | HNO3 | H2SO4 | no chemical | NaOH | HNO3 | H2SO4 |
| C | 74.06 ± 5.61 | 70.52 ± 6.46 | 63.40 ± 7.19 | 59.28 ± 5.96 | 73.24 ± 3.12 | 77.12 ± 4.15 | 70.08 ± 5.09 | 64.02 ± 3.16 |
| O | 22.14 ± 2.12 | 23.07 ± 1.58 | 32.97 ± 4.33 | 31.3 ± 3.73 | 23.02 ± 2.89 | 20.00 ± 3.56 | 27.16 ± 4.16 | 28.35 ± 3.11 |
| Si | 3.8 ± 0.93 | 2.48 ± 0.88 | 3.63 ± 1.01 | 3.54 ± 1.28 | 3.74 ± 0.67 | 2.10 ± 0.87 | 2.76 ± 0.75 | 3.42 ± 0.92 |
| Na | 3.93 ± 0.76 | 0.78 ± 0.10 | ||||||
| Si | 5.88 ± 0.99 | 4.21 ± 1.14 | ||||||
The weight and volume of the pristine epoxy flooring and the prepared composite at a HOFA content of 1.6 wt % were studied under the effect of the chemicals NaOH, HNO3, and H2SO4. The mass (%) was estimated according to the following equation
| 1 |
where M1 and M2 are the sample masses before and after being immersed in the chemicals, respectively. Also, the volume (%) was estimated using the same equation by replacing the mass with the volume. The mass (%) and volume (%) results are presented in Figure 13a,b, respectively. The mass (%) result revealed no change in the weight of the samples exposed to NaOH, while weight gain was recorded for the samples exposed to HNO3 and H2SO4 (Figure 13a). No weight losses were observed while exposing the samples to the chemicals, suggesting that it does not appear as if any erosion happened.48 The weight gains were recorded in the fluoroelastomer49 and polymer48 composites exposed to HNO3 and different chemicals. Jawaid et al.48 referred to the weight gain as the OH group resulting from the water diffusion into the polymer, while Kang et al.49 attributed the weight gain to the acid diffusions into the material. We recorded the FTIR spectra (Figure 14) after exposure to the chemicals, and the OH group peak was not observed in the FTIR spectra, while the NO3 and SO4 groups were observed, as was emphasized in the discussion of the FTIR spectra (Figure 14). Therefore, in this work, the weight gain could be due to the diffusion of the acids. Also, it can be seen that the weight gains in its composite with HOFA are less than those of the pristine epoxy flooring, suggesting that fewer acids diffuse into epoxy containing the HOFA.
Figure 13.

Chemical resistance of the prepared pristine epoxy flooring and its composite with HOFA at the content of 1.6 wt % under effects of NaOH, HNO3, and H2SO4: (a) mass % and (b) volume.
Figure 14.

FTIR spectra after exposure to the chemicals NaOH, HNO3, and H2SO4 for the (a) prepared pristine epoxy flooring and (b) its composite with HOFA at the content of 1.6 wt %.
The volume (%) showed that exposure to NaOH caused decreases in the volume of the pristine epoxy and its composite with HOFA at 1.6 wt % (Figure 13b). This result indicates that shrinking could happen under exposure to NaOH. The volume increase that occurred in both samples exposed to HNO3 and H2SO4 (Figure 13b) could suggest the possibility of swelling. These increases in the volume percentages could be due to the diffusion of acids inside the samples, where the cracks happened in the samples, as seen in the SEM micrographs (see Figures 11 and 12). Although the volume changes (increase/decrease) happened in both the pristine epoxy and its composite with HOFA at 1.6 wt % (Figure 13b), the epoxy composite with HOFA recorded fewer volume changes than the pristine epoxy, suggesting that HOFA’s presence could enhance the chemical resistance of the epoxy.
We recorded FTIR spectra of the prepared pristine epoxy flooring and its composite with HOFA at 1.6 wt % after they were treated with the chemicals for 21 days. The samples’ FTIR spectra are shown in Figure 14. As can be seen in the FTIR spectra, although the spectral peaks’ features seem to be similar to those recorded in Figure 4, there are some differences, where new peaks appeared and the intensity of some peaks significantly decreased. The FTIR spectrum of the pristine epoxy flooring exposed to NaOH showed a nearly similar spectrum with low peak intensities for the sample that was not exposed to any chemicals (Figure 14a). At the same time, new peaks appeared between 1440 and 1270 cm–1 in the spectrum of the sample exposed to HNO3. These peaks could be attributed to the antisymmetric stretch vibration of NO3– of HNO3.50 Also, there are changes in the spectral range of 1280–1100 cm–1 and a small peak center at 883 cm–1 appears in the FTIR spectrum of the sample exposed to H2SO4 (Figure 14a). This peak could be due to the presence of the group of the SO42– of the H2SO451 that could overlap with the C–O group of the rings of the phenols and aromatic structures besides Si–O–Si of quartz and C–O–C of oxirane. Another significant change can be observed in the spectral range of 3010–2800 cm–1, which belongs to the stretching modes of CH3, CH2, and CH groups in the aliphatic and aromatic structures, where these peaks decreased considerably under the effects of chemicals. These observations might suggest that the chemicals NaOH, HNO3, and H2SO4 caused more aromatic and aliphatic molecular structure changes. The changes in the range between 3010 and 2800 cm–1 containing the stretching vibration modes of CH3, CH2, and CH groups in the aliphatic and aromatic structures appeared to be less affected under the chemicals treatment. This result indicated the HOFA could enhance the chemical resistance of the epoxy flooring.
The schematic illustration in Figure 15 presents the prepared pristine epoxy flooring and its composite with HOFA. Figure 15a depicts the prepared pristine epoxy flooring with a smooth and crack-free surface before exposure to the chemicals, as observed via SEM micrographs in Figures 3a and 9a. Figure 15b presents the pristine epoxy flooring with a more significant volume after treatment with chemicals (see Figure 13b). Besides, irregular, coarse, and different blisters can be seen on the surface after exposure to the chemicals, as observed via SEM micrographs in Figure 9b–d. Similarly, Figure 15c presents the epoxy-flooring/HOFA composite with a crack-free surface before exposure, as captured via SEM in Figures 3b–d and 10a. Figure 15d depicts the epoxy-flooring/HOFA composite with a significantly less-crack surface compared with pristine epoxy after exposure to the chemicals, as seen in SEM images in Figure 10b–d. The pristine epoxy flooring showed surfaces with more cracks and blisters than its composite with HOFA. This result could be understood through the mechanical properties, which were enhanced for the epoxy-flooring/HOFA upon comparing with pristine epoxy (see the mechanical property results in Figure 6).
Figure 15.
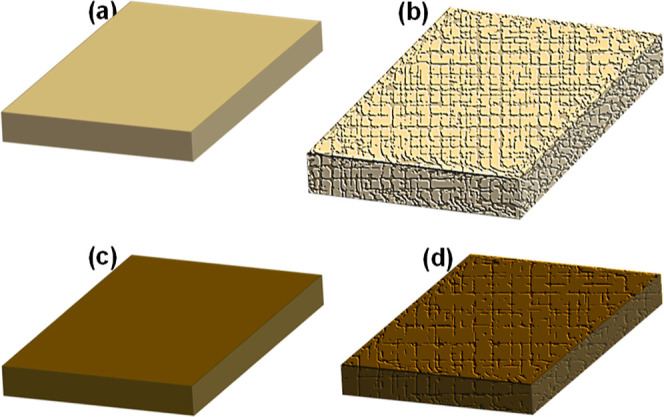
Schematic illustration of (a,b) pristine epoxy flooring before and after exposure to the chemicals, respectively; (c,d) epoxy-flooring composite with HOFA before and after exposure to the chemicals, respectively. After exposure to the chemicals, pristine epoxy appeared with an irregular, coarse, cracked surface and a more significant volume.
We performed a nanoindentation test for the samples after treatment with chemicals. The load-depth curve and hardness were obtained, as shown in Figure 16. The load-depth curves of the samples of pristine epoxy flooring and its composite with HOFA at 1.6 wt % that were exposed to chemicals of NaOH, HNO3, and H2SO4 are shown in Figure 16a,b, respectively. The results of those that were not exposed to any chemical are also shown in the figures. The indentation hardness values for pristine epoxy flooring and its composite with HOFA at 1.6 wt % are displayed in Figure 16c,d, respectively. The epoxy-flooring composite with HOFA revealed higher hardness values than the pristine epoxy, indicating hardness improvements by adding HOFA into epoxy flooring and enhancing the mechanical properties. The enhancement in mechanical properties could minimize the occurrence of cracks and blisters on the surface of the epoxy-flooring/HOFA composite, subsequently decreasing the chemical diffusion inside the epoxy; therefore, fewer changes in the mass and volume of the epoxy-flooring/HOFA composite compared with those of pristine epoxy (see the results of mass and volume percentages in Figure 15) were observed. Besides, the observed the NO3– of HNO3 and SO42– group H2SO4 via FTIR spectroscopy (see Figure 16) will be less when the diffusion of acids inside the epoxy is less; therefore, the O ratio that comes from NO3– and SO42– groups will be less (see the O ratios in Table 1).
Figure 16.

Nanoindentation test for the samples exposed to the chemicals NaOH, HNO3, and H2SO4, besides those that were not exposed to any chemical (a,b) load-depth curve and (c,d) hardness for the pristine epoxy and its composite with HOFA at the content of 1.6 wt %.
4. Conclusions
The waste HOFA was successfully evaluated as a mechanical reinforcement for epoxy-flooring polymer. The obtained results provided a multifunctional composite material with advanced features. These results demonstrated significant enhancements in the mechanical properties, neutron-shielding performance, and chemical resistance in the fabricated composites. The high porosity existing in the HOFA particles played a crucial role in improving the mechanical features of the epoxy-flooring/HOFA composites. The optimized weight fraction of HOFA for better performance was determined to be around 1.6 wt %. Higher weight fractions above this value perhaps could reduce the polymer’s cross-linking network and thus decrease the mechanical properties. Besides this enhancement, we observed tangible improvements in the chemical resistance of this composite. Adding HOFA particles is found to be very effective in decreasing the cracks formed on the surface of the epoxy matrix, which subsequently can reduce the chemical diffusion inside the matrix, leading to enhanced chemical resistance. From the application point of view, this multifunctional composite might be very useful for designing piping, connections, and chambers used in the petrochemical industry or making plates for different purposes, such as radiation shielding, construction, and automobiles.
Acknowledgments
The Deanship of Scientific Research (DSR) at King Abdulaziz University, Jeddah, Saudi Arabia, has funded this project, under grant no. RG-38-135-42. Therefore, the authors gratefully thank the DSR for the technical and financial support.
The authors declare no competing financial interest.
References
- Causin V.; Marega C.; Marigo A. When polymers fail: A case report on a defective epoxy resin flooring. Eng. Fail. Anal. 2007, 14, 1394–1400. 10.1016/j.engfailanal.2006.11.007. [DOI] [Google Scholar]
- Korkut T.; Gencel O.; Kam E.; Brostow W. X-Ray, Gamma, and Neutron Radiation Tests on Epoxy-Ferrochromium Slag Composites by Experiments and Monte Carlo Simulations. Int. J. Polym. Anal. Charact. 2013, 18, 224–231. 10.1080/1023666x.2013.755658. [DOI] [Google Scholar]
- Shen L.; Wang T.-p.; Lee T.-H.; Forrester M.; Becker A.; Torres S.; Pearson C.; Cochran E. W. 3D Printable All-Polymer Epoxy Composites. ACS Appl. Polym. Mater. 2021, 3, 5559–5567. 10.1021/acsapm.1c00889. [DOI] [Google Scholar]
- Pang V.; Thompson Z. J.; Joly G. D.; Francis L. F.; Bates F. S. Block Copolymer and Nanosilica-Modified Epoxy Nanocomposites. ACS Appl. Polym. Mater. 2021, 3, 4156–4167. 10.1021/acsapm.1c00619. [DOI] [Google Scholar]
- Yeh R.-Y.; Reddy K. S. K.; Chen Y.-C.; Wang M.-W.; Chang H.-C.; Abu-Omar M. M.; Lin C. H. Preparation and Degradation of Waste Polycarbonate-Derived Epoxy Thermosets and Composites. ACS Appl. Polym. Mater. 2022, 4, 413–424. 10.1021/acsapm.1c01336. [DOI] [Google Scholar]
- Strutton J. W.; Moser N. H.; Garboczi E. J.; Jennings A. R.; Runnels B.; McCollum J. M. Interface History on Strain Field Evolution in Epoxy Resins. ACS Appl. Polym. Mater. 2022, 4, 1535–1542. 10.1021/acsapm.1c01930. [DOI] [Google Scholar]
- Rosu D.; Mustata F. R.; Rosu L.; Varganici C.-D. Photochemical Aging of Eco-Friendly Wood Coatings Derived from Vegetable Oils. ACS Appl. Polym. Mater. 2021, 3, 6303–6314. 10.1021/acsapm.1c01086. [DOI] [Google Scholar]
- Touchin H. R. Chemical-resistant flooring based on epoxy resins. Anti-Corros. Methods Mater. 1959, 6, 227–228. 10.1108/eb019609. [DOI] [Google Scholar]
- Chen X. M.; Ellis B., Coatings and other applications of epoxy resins. In Chemistry and Technology of Epoxy Resins; Ellis B., Ed.; Springer Netherlands: Dordrecht, 1993; pp 303–325. [Google Scholar]
- Parvez M. A.; Al-Abdul Wahhab H. I.; Shawabkeh R. A.; Hussein I. A. Asphalt modification using acid treated waste oil fly ash. Constr. Build. Mater. 2014, 70, 201–209. 10.1016/j.conbuildmat.2014.07.045. [DOI] [Google Scholar]
- Saeed A.; Alaqab A.; Banoqitah E.; Damoom M. M.; Salah N. Graphitic carbon-rich oil fly ash as effective reinforcements to enhance the mechanical, thermal, and radiation shielding properties of high-grade epoxy polymer. Polym. Test. 2022, 115, 107739. 10.1016/j.polymertesting.2022.107739. [DOI] [Google Scholar]
- Salah N.; Habib S. S.; Khan Z. H.; Alshahrie A.; Memic A.; Al-ghamdi A. A. Carbon rich fly ash and their nanostructures. Carbon lett. 2016, 19, 23–31. 10.5714/cl.2016.19.023. [DOI] [Google Scholar]
- Al-Abdul Wahhab H. I.; Hussein I. A.; Parvez M. A.; Shawabkeh R. A. Use of modified oil fly ash to enhance asphalt concrete performance. Mater. Struct. 2015, 48, 3231–3240. 10.1617/s11527-014-0393-5. [DOI] [Google Scholar]
- Salah N.; Abdel-wahab M. S.; Alshahrie A.; Alharbi N. D.; Khan Z. H. Carbon nanotubes of oil fly ash as lubricant additives for different base oils and their tribology performance. RSC Adv. 2017, 7, 40295–40302. 10.1039/c7ra07155h. [DOI] [Google Scholar]
- Khan M. J.; Al-Juhani A. A.; Shawabkeh R.; Ul-Hamid A.; Hussein I. A. Chemical modification of waste oil fly ash for improved mechanical and thermal properties of low density polyethylene composites. J. Polym. Res. 2011, 18, 2275–2284. 10.1007/s10965-011-9641-3. [DOI] [Google Scholar]
- Salah N.; Alfawzan A. M.; Saeed A.; Alshahrie A.; Allafi W. Effective reinforcements for thermoplastics based on carbon nanotubes of oil fly ash. Sci. Rep. 2019, 9, 20288. 10.1038/s41598-019-56777-1. [DOI] [PMC free article] [PubMed] [Google Scholar]
- Salah N.; Alfawzan A. M.; Allafi W.; Baghdadi N.; Saeed A.; Alshahrie A.; Al-Shawafi W. M.; Memic A. Size-controlled, single-crystal CuO nanosheets and the resulting polyethylene–carbon nanotube nanocomposite as antimicrobial materials. Polym. Bull. 2021, 78, 261–281. 10.1007/s00289-020-03112-8. [DOI] [Google Scholar]
- Mofarrah A.; Husain T. Use of Heavy Oil Fly Ash as a Color Ingredient in Cement Mortar. Int. J. Concr. Struct. Mater. 2013, 7, 111–117. 10.1007/s40069-013-0042-3. [DOI] [Google Scholar]
- Salah N.; Al-ghamdi A. A.; Memic A.; Habib S. S.; Khan Z. H. Formation of Carbon Nanotubes from Carbon-Rich Fly Ash: Growth Parameters and Mechanism. Mater. Manuf. Processes 2016, 31, 146–156. 10.1080/10426914.2015.1025975. [DOI] [Google Scholar]
- Salah N.; Habib S. S.; Khan Z. H.; Memic A.; Nahas M. N. Biostructures, Growth of carbon nanotubes on catalysts obtained from carbon rich fly ash. Digest J. Nanomater. 2012, 7, 1279–1288. [Google Scholar]
- Bosly H. A. E.-K.; Salah N.; Salama S. A.; Pashameah R. A.; Saeed A. Oil fly ash as a promise larvicide against the Aedes aegypti mosquitoes. Acta Trop. 2023, 237, 106735. 10.1016/j.actatropica.2022.106735. [DOI] [PubMed] [Google Scholar]
- Mofarrah A.Environmental management and potential use of heavy oil fly ash; Memorial University of Newfoundland, 2014. [Google Scholar]
- Aslam Z.; Shawabkeh R. A.; Hussein I. A.; Al-Baghli N.; Eic M. Synthesis of activated carbon from oil fly ash for removal of H2S from gas stream. Appl. Surf. Sci. 2015, 327, 107–115. 10.1016/j.apsusc.2014.11.152. [DOI] [Google Scholar]
- Saeed A.; Murshed M. N.; Al-Shahari E. A. Effect of low-dose fast neutrons on the protein components of peripheral blood mononuclear cells of whole-body irradiated Wistar rats. Environ. Sci. Pollut. Res. 2020, 27, 40443–40455. 10.1007/s11356-020-10085-8. [DOI] [PubMed] [Google Scholar]
- Nafee S. S.; Saeed A.; Shaheen S. A.; El Assouli S. M.; El Assouli M. Z. E.; Raouf G. A. Effect of very low dose fast neutrons on the DNA of rats’ peripheral blood mononuclear cells and leukocytes. Health Phys. 2016, 110, 50–58. 10.1097/hp.0000000000000410. [DOI] [PubMed] [Google Scholar]
- Saeed A.; Abolaban F. Risk estimation of the low-dose fast neutrons on the molecular structure of the lipids of peripheral blood mononuclear cells. Biochem. Biophys. Res. Commun. 2020, 533, 1048–1053. 10.1016/j.bbrc.2020.09.116. [DOI] [PubMed] [Google Scholar]
- Saeed A.; Raouf G. A.; Nafee S. S.; Shaheen S. A.; Al-Hadeethi Y. Effects of very low dose fast neutrons on cell membrane and secondary protein structure in rat erythrocytes. PLoS One 2015, 10, e0139854 10.1371/journal.pone.0139854. [DOI] [PMC free article] [PubMed] [Google Scholar]
- Saeed A.; Abolaban F. Spectroscopic study of the effect of low dose fast neutrons on the hemoglobin structure. Spectrochim. Acta, Part A 2021, 261, 120082. 10.1016/j.saa.2021.120082. [DOI] [PubMed] [Google Scholar]
- Adeli R.; Shirmardi S. P.; Ahmadi S. J. Neutron irradiation tests on B4C/epoxy composite for neutron shielding application and the parameters assay. Radiat. Phys. Chem. 2016, 127, 140–146. 10.1016/j.radphyschem.2016.06.026. [DOI] [Google Scholar]
- Huang Y.; Liang L.; Xu J.; Zhang W. The design study of a new nuclear protection material. Nucl. Eng. Des. 2012, 248, 22–27. 10.1016/j.nucengdes.2012.03.016. [DOI] [Google Scholar]
- Okuno K. Neutron shielding material based on colemanite and epoxy resin. Radiat. Prot. Dosim. 2005, 115, 258–261. 10.1093/rpd/nci154. [DOI] [PubMed] [Google Scholar]
- Algarni A.; Salah N.; Bourchak M.; Jilani A.; Alshahrie A.; Nahas M. N. Polymer composite reinforced with nanoparticles produced from graphitic carbon-rich fly ash. J. Compos. Mater. 2017, 51, 2675–2685. 10.1177/0021998316673891. [DOI] [Google Scholar]
- Saeed A.; Alaqab A.; Banoqitah E.; Damoom M. M.; Salah N. Graphitic carbon-rich oil fly ash as effective reinforcements to enhance the mechanical, thermal, and radiation shielding properties of high-grade epoxy polymer. Polym. Test. 2022, 115, 107739. 10.1016/j.polymertesting.2022.107739. [DOI] [Google Scholar]
- Saeed A.; Nafee S. S.; Shaheen S. A.; Raouf G. A.; Al-Hadeethi Y.; Kamal S. M.; Razvi M. A. N. Calculating the ambient dose equivalent of fast neutrons using elemental composition of human body. Appl. Comput. Math. 2016, 274, 604–610. 10.1016/j.amc.2015.11.037. [DOI] [Google Scholar]
- Durá J. V.; Alcántara E.; Zamora T.; Balaguer E.; Rosa D. Identification of floor friction safety level for public buildings considering mobility disabled people needs. Saf. Sci. 2005, 43, 407–423. 10.1016/j.ssci.2005.08.003. [DOI] [Google Scholar]
- Schön J. Coefficient of friction and wear of a carbon fiber epoxy matrix composite. Wear 2004, 257, 395–407. 10.1016/j.wear.2004.01.008. [DOI] [Google Scholar]
- Heng Z.; Chen Y.; Zou H.; Liang M., Spectroscopic Analysis of Epoxy/Rubber Blends. In Handbook of Epoxy Blends; Parameswaranpillai J., Hameed N., Pionteck J., Woo E. M., Eds.; Springer International Publishing: Cham, 2017; pp 147–184. [Google Scholar]
- Nikafshar S.; Zabihi O.; Hamidi S.; Moradi Y.; Barzegar S.; Ahmadi M.; Naebe M. A renewable bio-based epoxy resin with improved mechanical performance that can compete with DGEBA. RSC Adv. 2017, 7, 8694–8701. 10.1039/c6ra27283e. [DOI] [Google Scholar]
- Saeed A.; Madkhli A. Y.; Al-Dossari M.; Abolaban F. Electrical and Dielectric Properties of Composites Composed of Natural Quartz with Aluminum. Silicon 2022, 31, 1. 10.1007/s12633-022-01713-8. [DOI] [Google Scholar]
- Saeed A.; Adewuyi S. O.; Ahmed H. A. M.; Alharbi S. R.; Al Garni S. E.; Abolaban F. Electrical and Dielectric Properties of the Natural Calcite and Quartz. Silicon 2022, 14, 5265–5276. 10.1007/s12633-021-01318-7. [DOI] [Google Scholar]
- Gharieh A.; Moghadas M.; Pourghasem M. Synergistic Effects of Acrylic/Silica Armored Structured Nanoparticles on the Toughness and Physicomechanical Properties of Epoxy Polymers. ACS Appl. Polym. Mater. 2021, 3, 4008–4016. 10.1021/acsapm.1c00530. [DOI] [Google Scholar]
- Emblem A.; Hardwidge M., Adhesives for packaging. In Packaging Technology; Emblem A., Emblem H., Eds.; Woodhead Publishing, 2012; pp 381–394. [Google Scholar]
- Taylor D. F.; Kalachandra S.; Sankarapandian M.; McGrath J. E. Relationship between filler and matrix resin characteristics and the properties of uncured composite pastes. Biomaterials 1998, 19, 197–204. 10.1016/s0142-9612(98)80001-x. [DOI] [PubMed] [Google Scholar]
- Junaedi H.; Baig M.; Dawood A.; Albahkali E.; Almajid A. Effect of the Matrix Melt Flow Index and Fillers on Mechanical Properties of Polypropylene-Based Composites. Materials 2022, 15, 7568. 10.3390/ma15217568. [DOI] [PMC free article] [PubMed] [Google Scholar]
- Alter H. Filler particle size and mechanical properties of polymers. J. Appl. Polym. Sci. 1965, 9, 1525–1531. 10.1002/app.1965.070090427. [DOI] [Google Scholar]
- Bhushan B.; Koinkar V. N. Nanoindentation hardness measurements using atomic force microscopy. Appl. Phys. Lett. 1994, 64, 1653–1655. 10.1063/1.111949. [DOI] [Google Scholar]
- Faisal N. H.; Prathuru A. K.; Goel S.; Ahmed R.; Droubi M. G.; Beake B. D.; Fu Y. Q. Cyclic Nanoindentation and Nano-Impact Fatigue Mechanisms of Functionally Graded TiN/TiNi Film. Shape Mem. Superelasticity 2017, 3, 149–167. 10.1007/s40830-017-0099-y. [DOI] [Google Scholar]
- Jawaid M.; Khalil H. P. S. A.; Bakar A. A.; Khanam P. N. Chemical resistance, void content and tensile properties of oil palm/jute fibre reinforced polymer hybrid composites. Mater. Des. 2011, 32, 1014–1019. 10.1016/j.matdes.2010.07.033. [DOI] [Google Scholar]
- Kang H.; Chen L.; Du H.; Wang H.; Li D.; Fang Q. Hot nitric acid diffusion in fluoroelastomer composite and its degradation. RSC Adv. 2019, 9, 38105–38113. 10.1039/c9ra06286f. [DOI] [PMC free article] [PubMed] [Google Scholar]
- Iannarelli R.; Rossi M. J. The mid-IR Absorption Cross Sections of α- and β-NAT (HNO3 · 3H2O) in the range 170 to 185 K and of metastable NAD (HNO3 · 2H2O) in the range 172 to 182 K. J. Geophys. Res. Atmos. 2015, 120, 707. 10.1002/2015jd023903. [DOI] [Google Scholar]
- Volz F. E. Sulfuric acid in KBr pellet spectroscopy. Appl. Opt. 1979, 18, 2353–2354. 10.1364/ao.18.002353. [DOI] [PubMed] [Google Scholar]