

Abstract
As an easily disposable substrate with a microporous texture, paper is a well-suited, generic substrate to build analytical devices for studying bacteria. Using a multi-pass lasing process, cellulose-based laser-induced graphene (cLIG) with a sheet resistance of 43.7 ± 2.3 Ωsq−1 is developed and utilized in the fabrication of low-cost and environmentally-friendly paper sensor arrays. Two case studies with Pseudomonas aeruginosa and Escherichia coli demonstrate the practicality of the cLIG sensors for the electrochemical analysis of bacteria. The first study measures the time-dependent profile of phenazines released from both planktonic (up to 60 h) and on-chip-grown (up to 22 h) Pseudomonas aeruginosa cultures. While similarities do exist, marked differences in phenazine production are seen with cells grown directly on cLIG compared to the planktonic culture. Moreover, in planktonic cultures, pyocyanin levels increase early on and plateau around 20 h, while optical density measurements increase monotonically over the duration of testing. The second study monitors the viability and metabolic activity of Escherichia coli using a resazurin-based electrochemical assay. These results demonstrate the utility of cLIG paper sensors as an inexpensive and versatile platform for monitoring bacteria and could enable new opportunities in high-throughput antibiotic susceptibility testing, ecological studies, and biofilm studies.
Keywords: cellulose, paper-based analytical device, laser-induced graphene, bacteria, viability, phenazine
1. Introduction
The recent advent of laser-induced graphene/graphite (LIG),1 also known as “laser-scribed graphene” or “laser-engraved graphene”, has enabled the direct conversion of carbonaceous substrates into conductive graphitic carbon in a highly controllable manner. Perhaps the first demonstration of this process was reported by Schumann et al., where an ultraviolet (UV) laser was used to increase the electrical conductivity of polyimide and polybenzimidazole films up to fifteen orders of magnitude.2 More than two decades later in 2012, El-Kady et al. reported the conversion of graphite oxide into three-dimensional porous graphene patterns using a DVD optical drive.3 In 2014, the Tour group successfully converted polyimide films into LIG that was integrated seamlessly into the native polyimide film using a benchtop CO2 laser printer.4 These early pioneering works have helped propel graphene into the direct-write electronics arena, whereby conductive graphene/graphite patterns can be rapidly prototyped and prepared directly from the parent substrate without photolithography or additional deposition steps. While much of the early work on LIG focused primarily on capacitor development,4,5 there are many applications that could benefit from the low-cost, directly patternable, and highly porous character of LIG films,6 especially where pristine and planar monolayer films are not requisite. As a result, extensive research using LIG in batteries,7 sensing (environmental, biological, mechanical, etc.),8,9 wearable/flexible devices,10 antimicrobial coatings,11 and catalysis12 is currently underway.
Electrochemical applications, in particular, can benefit from the high surface area, electrical conductivity, and chemical stability of LIG.6,8 Moreover, the relatively high defect density can improve electron transfer between LIG electrodes and the surrounding electrolyte,6 which serves as the fundamental sensing mechanism in many electrochemical transducers. Many works have leveraged these characteristics in demonstrating LIG electrochemical sensors for uric acid, tyrosine, dopamine, glucose, insecticides, and bacteria, among many others.6,8,10,13–16 Much of this work used LIG synthesized on polyimide or other thermoplastics, but more recent developments have shown LIG can be prepared on a broad range of materials, including paper, wood, charcoal, and cloth.17,18 Paper is an especially interesting material for point-of-care (POC) sensor fabrication, given its low-cost, ubiquity, and biodegradability.19–21 Indeed, paper-based electrochemical sensors and analytical devices (ePAD) have been around for over a decade22 and show great promise for next-generation POC devices.21 Typically, these sensors utilize screen printing, stencil printing, or inkjet printing of conductive inks as the active material(s).21 However, screen printing and inkjet printing can introduce additional challenges related to ink formulation21 while potentially leaving unwanted organic solvent residue in the paper after drying.23 To address these drawbacks and reduce fabrication complexity, various groups have begun developing paper-LIG electrochemical sensors and have successfully detected various small molecules, including ascorbic acid, uric acid, and glucose.20,23–25
Given its favorable properties and ease of disposal (e.g. by incineration), paper is a well-suited platform for studying microbes and pathogens, such as bacteria.26 The ability to safely incinerate contaminated PADs gives them an advantage over sensors based on plastic or other rigid substrates, especially in POC settings. Examples of PADs for bacteria and bacterial metabolites have largely been based on fluorescent or colorimetric detection schemes.27–29 Oftentimes, these methods are only semi-quantitative (especially colorimetric strategies) and may require costly equipment, such as a microplate reader, that is not readily compatible with testing in decentralized settings.30,31 POC monitoring and detection of pathogenic bacteria is critical for environmental, food, and healthcare applications that require prompt results to determine an appropriate course of action.32 Smartphone-based optical strategies are under development to address these shortcomings and show great potential.31,33,34 Electrochemical sensors, on the other hand, are typically more conducive to POC settings and can provide a quantitative readout to the user.21,30,31 As such, there are a number of works that describe paper-based electrochemical sensors for bacteria monitoring.35–38 However, many works sample the bacteria culture at a single or few time point(s). Instead, growing the bacteria directly on-chip and measuring periodically over longer timeframes would take advantage of the fact that the three-dimensional structure of paper closely replicates the native cellular microenvironment, which is more advantageous for cell culture compared to traditional planar cultures.39
Herein, we present a paper-based electrochemical sensor using cellulose-based laser-induced graphene (cLIG) fabricated via a multi-step laser scribing process. To establish the utility of our cLIG electrochemical sensor, we report on two proof-of-concept case studies. The first involves the time-dependent electrochemical detection of phenazines released by Pseudomonas aeruginosa (P. aeruginosa) cultures grown both off- and on-chip. Phenazines are a class of heterocyclic molecules that are secreted by Pseudomonads and play a key role in electron transfer and virulence. Importantly, phenazines are, in general, highly redox-active, making electrochemical detection a promising candidate to monitor their spatiotemporal distribution, which does not necessarily follow a similar trend as cell concentration. In the second case study, we perform a viability/metabolic activity electrochemical assay based on resazurin reduction with Escherichia coli (E. coli) as a model bacterium. Although resazurin is commonly used in fluorescence viability assays, it is also redox-active. By measuring the decrease of the reduction peak associated with the irreversible conversion of resazurin to resorufin, the viability of metabolically-active bacteria can be monitored over time. Overall, this work reveals the potential of cLIG sensors for developing simple, low-cost, and easily disposable electrochemical devices for possible applications including pathogen monitoring, drug screening, and host-pathogen studies.
2. Materials and Methods
2.1. Materials and Reagents
Whatman Grade 1 qualitative filter paper (90 mm diameter, 11 μm pore size, 180 μm thick) and pyocyanin (PYO) were purchased from Millipore-Sigma (Burlington, MA, USA). FireGuard flame suppressant was purchased from Shield Industries (Woodstock, GA, USA). Lysogeny Broth (LB, Lennox) was purchased from Alfa Aesar (Ward Hill, MA, USA) and prepared in an autoclave following the manufacturer’s protocol, Brain-Heart Infusion (BHI), Hexaamineruthenium(III), and ampicillin (CAS No. 69–53-4, 50 μg ml−1) were purchased from Sigma-Aldrich (St. Louis, MO, USA) and prepared in an autoclave. Phenazine-1-carboxylic acid (PCA) was purchased from Apollo Scientific (Bredbury, UK), phenazine-1-carboxamide (PCN) was purchased from Synthonix (Wake Forest, NC, USA), Resazurin was purchased from Acros Organics (ThermoFisher, Waltham, MA, USA), Potassium hexacyanoferrate(II) was purchased from EMD Millipore (Darmstadt, Germany), Dulbecco’s phosphate buffered saline (no Ca or Mg) was purchased from Corning (Corning, NY, USA), ethanol was purchased from Koptec (VWR, Radnor, PA, USA).
2.2. cLIG Preparation
Whatman 1 substrates were sprayed with FireGuard flame suppressant and allowed to dry in ambient conditions overnight before use. After drying, the paper substrates were subjected to two wax print passes in a Xerox ColorQube 8880 printer. The paper substrates were then baked in an oven at ~ 125°C for 2 min to melt the wax, allowing it to penetrate through the entirety of the paper substrate. After baking, the samples were mounted onto glass microscope slides with double-sided adhesive (~ 0.048” total thickness) to ensure the paper substrate laid flat throughout the laser printing process. The perimeter of the paper substrate was also held down with tape. The laser printing was performed with a VLS2.30 benchtop laser system with a CO2 laser (λ = 10.6 μm, 25 W) from Universal Laser Systems (Scottsdale, AZ, USA). Printing conditions were optimized for minimal sheet resistance, as discussed in the main text (Section 3.2). All prints were done with a pulse per inch (PPI) count of 1000 in a raster modality. A three-electrode configuration with a central working electrode (3 mm diameter) surrounded by concentric counter and reference electrodes was used. Six distinct sensors were printed per paper substrate. After printing the cLIG, a final cut-out of the cLIG sensor array was performed in vector mode at z = 0.044”, power = 7.5 W, speed = 5 in. s−1. The cLIG sensors were carefully removed from the tape using a razor. Lastly, a small spot of silver epoxy was added to the reference electrode region and allowed to cure at room temperature for at least 2 h.
2.3. cLIG Characterization
Sheet Resistance Measurements:
Four-probe sheet resistance measurements were conducted in a square van der Pauw geometry of 5 mm × 5 mm using a Keithley 2400 source-measure unit (SMU). A LabVIEW program was used to control the SMU. The current was swept from 1 to −1 mA and the resulting voltage was measured to calculate resistance. This process was repeated for all four contact configurations to obtain average horizontal and vertical resistance values.
Raman Characterization:
Raman measurements were performed with a Horiba LabRam instrument equipped with a 364 nm laser. A neutral density filter was used to set the power at the sample as ~ 1 – 1.5 mW to minimize sample degradation during measurement. A fully reflective 74× objective was used with a 300 g/mm grating. Spectra were acquired using ten 30 s acquisitions. Data processing was performed using the LabSpec6 software. The uncertainty in calculated peak ratios represents the standard deviation of spectra recorded at three distinct locations from the same sample.
X-ray Photoelectron Spectroscopy:
X-ray photoelectron spectroscopy (XPS) measurements were conducted with a Physical Electronics VersaProbe instrument equipped with an Al Kα source (1.49 keV) with charge neutralization. Spectra were analyzed in the CasaXPS software using an Iterated Shirley background.
Scanning Electron Microscopy:
Scanning electron microscopy (SEM) micrographs were taken with a ThermoFisher Verios instrument. The samples were not coated with metal for imaging but were grounded to the chuck using adhesive Cu tape. An accelerating voltage of 3 kV with a beam current of 200 pA was used. The sample working distance was 2.6 mm.
Electrochemical Measurements:
Electrochemical characterization was performed with a MultiPalmSens4 multi-channel potentiostat with an MUX8-R2 8-channel multiplexer (PalmSens). The instrument was controlled with the MultiTrace 4.4 software. All measurements are referenced to an Ag pseudoreference electrode (PRE). For electrochemical measurements, one cellulose sheet with six distinct sensors was mounted in a homemade test housing fabricated from acrylic sheets using the VLS2.30 laser printer. Each sensor well had a small polydimethylsiloxane (PDMS, Dow Sylgard 184) ring around the perimeter to create a water-tight seal between the test housing and cLIG sample. 8 bolts are used to secure the cLIG between the top and bottom acrylic sheets. Contact to the cLIG was made through Ag pads deposited on the bottom side of the top acrylic layer (i.e. the side in contact with cLIG), which were connected to wires that ran to the potentiostat. Cyclic voltammetry (CV) measurements were performed at various scan rates and potential ranges depending on the redox couple under investigation. The potential step Vstep = 2 mV and the current range = 100 μA. Electrochemical impedance spectroscopy (EIS) measurements were performed with the following parameters: Vac = 5 mV, Vdc = open circuit potential (OCP), frequency = 1000 to 0.1 Hz, N = 40 points/decade.
2.4. Sensor Characterization with of Synthetic Phenazines and P. aeruginosa cultures
cLIG sensors were benchmarked with synthetic phenazines: pyocyanin, phenazine-1-carboxylic acid, and phenazine-1-carboxamide in LB to establish the calibration curves. 2 or 3 mM stock solutions of each phenazine were prepared in ethanol and fresh dilutions were prepared for each round of measurements. At least 10 distinct sensors were tested for each analyte and the error bars in Figure 4b, 4d, and 4f represent the standard deviation of those sensors. Before testing with synthetic phenazines, 5 CV scans with LB were done to stabilize the sensors and improve their wettability which can be a challenge with highly porous materials such as cLIG. The improved wetting is seen by an increase in the separation of anodic and cathodic currents with scan number, an indication of increased capacitance possibly attributed to increased electrochemical surface area (see Figure S1 of Supplementary Information).40 Square wave voltammetry (SWV) measurements were performed with the following parameters: frequency = 10 Hz, Vpulse = 50 mV, Vstep = 10 mV, current range = 100 μA, potential range = −0.7 to 0 V.
2.5. Sensor Characterization with P. aeruginosa Cultures
Overnight Culture (OC) Preparation:
P. aeruginosa (PA14, NR-50573) was obtained through BEI Resources, NIH: National Institute of Allergy and Infectious Diseases (NIAID) and stored at −80°C. E. coli O157:H7 (43888) was purchased from the American Type Cell Culture (Manassas, VA, USA) and stored at −80°C The overnight culture was prepared using an inoculation loop of frozen PA14 stock added to ~ 10 ml of LB in a sterile culture tube. The culture was grown overnight (~ 16 h) at 37°C with 210 rpm shaking and typically reached an optical density (λ = 600 nm, OD600) of 0.6 – 0.75 as measured with a spectrophotometer (Eppendorf BioPhotometer D30). 1 ml aliquots of the culture were centrifuged at 4100 × g for 10 min and the supernatant was discarded to remove any phenazines that could alter subsequent measurements.
Off-Chip Culture:
For the tests with planktonic cultures grown off-chip, the pellets of three 1 ml aliquots of OC were resuspended in either 30 ml of LB or LB with 50 μg ml−1 ampicillin for a 1:10 dilution. OD600 values for 1:10 diluted cultures were typically ~ 0.045 – 0.065. These planktonic cultures were incubated continuously at 37°C, 210 rpm, and sampled at each desired time point. The same culture was used for electrochemical and OD600 measurements for a one-to-one comparison. 100 μl of liquid culture was added to each sensor for testing, followed by washing twice with deionized (DI) water (Milli-Q, 18.2 MΩ cm).
On-Chip Culture:
For in situ tests with bacteria grown directly on-chip, the pellet from a 1 ml aliquot of the OC was resuspended in 10 ml of fresh LB or LB with 50 μg ml−1 ampicillin and gently vortexed to ensure uniform mixing. Before adding the bacteria, the cLIG and sensor test housing components were subjected to UV sterilization for 1 h in a biosafety hood. Then, 150 μl of liquid culture was added to each sensor well. The sensor wells were covered with a ~ 2 – 3 mm thick slab of PDMS to help minimize evaporation during testing. PDMS is commonly used in microfluidics and due to its air permeability, still allows for bacterial growth.41 The samples were incubated in a homemade incubator at 37°C (see Supplementary Information Figure S2), and a 30 min acclimation period was taken before starting the electrochemical measurements.
2.6. Resazurin-Based Electrochemical Viability Assay with E. coli
An overnight culture of E. coli was prepared in BHI using an inoculation loop of frozen E. coli frozen stock. The overnight culture was incubated at 37°C with 210 rpm shaking and stored at 4°C until used. Eight working cultures were prepared using a 1:100 dilution of the overnight culture in fresh BHI. Four working cultures were left in a water bath at 80°C for 30 min to kill any bacteria (“heat-killed”) while four were left as-is (“live”). Then, 1 mM resazurin was added to two of the working cultures (1 live, 1 heat-killed), while the other six were left as-is for OD600 measurements (3 live, 3 heat-killed). The error bars in the OD600 measurements of Figure 7c represent the standard deviation of 3 distinct cultures. 150 μl of liquid culture with resazurin was added to each sensor for testing, followed by washing twice with DI water after testing. SWV measurements were performed with the following parameters: frequency = 10 Hz, Vpulse = 25 mV, Vstep = 5 mV, current range = 100 μA, potential range = 0 to −0.8 V.
2.7. Multimodal Printing and Characterization of cLIG with nScrypt-Printed Ag Wire/Leads
With the cLIG working element of the sensors made, high conductivity silver feed lines were printed on the samples. The feed lines were printed with Dupont CB028 flexible silver particle ink through a 0.125 mm ceramic nozzle on a nScrypt 3Dn-450-HP (nScrypt, Orlando, Fl). Speeds and extrusion pressures for the silver ink were separately optimized for even and thin coverage and repeatability of the sensor feed lines from sample to sample.
Current Voltage (I-V) measurements of the cLIG with Ag contacts was performed with a 4200 Keithley Semiconductor Characterization System with a scanning voltage from −5 V to + 5V. Sheet resistance (RS) and contact resistance (RC) of the cLIG was calculated consistent with transfer length measurements (TLM). Each individual TLM sample length with Ag contacts was 1, 6, 11, 16, and 21 mm for a total of 5 measurements. A total of 5 separate TLM structures were measured, and RS/RC values were calculated for each sample made and averaged to obtain the reported RS/RC values here.
3. Results and Discussion
3.1. Fabrication of cLIG and Material Characterization
A schematic overview of the fabrication process for the cLIG sensor chip is shown in Figure 1. The process begins by coating a cellulose sheet with a flame suppressant (step 1 in Figure 1) to prevent thermal degradation or ablation during the laser-printing process. After drying overnight, a wax layer is printed on the cellulose (step 2) and annealed (step 3), forming a hydrophobic barrier to prevent wicking of the solution during electrochemical testing. The graphitization of cellulose (step 4) is then carried out in a benchtop CO2 laser (λ = 10.6 μm), which allows for the creation of arbitrary patterns and rapid prototyping without needing photolithography. The printing process requires two steps; the first is performed with the cellulose held below the focal plane (z1 in Figure 1), while the second is performed with the cellulose at or near the focal plane (z2 in Figure 1).42 Previous reports have shown the first print step converts the cellulose into a carbonaceous char, whereas the second step transforms the char into graphitic carbon.17,42 We adopt a similar strategy to achieve highly-conductive cLIG for application in electrochemical sensing. We should note that attempting to graphitize the cellulose in one step results in total ablation of the cellulose (see Supplementary Information Section S3, Figure S3). Before electrochemical testing, the cLIG sensor array is mounted in a homemade acrylic holder with engraved wells that hold the test solution (step 5; see details in Section 2.3).
Figure 1. A schematic overview of the cLIG sensor fabrication process.

At the bottom is an image of an actual cLIG sensor array with relevant dimensions added. WE = working electrode, CE = counter electrode, RE = reference electrode. SEM scale bar = 50 μm
The scanning electron micrographs in Figure 2a show clear differences in the cLIG microstructure between the first and second print pass (herein referred to as cLIG1 and cLIG2, respectively). After one print pass, cLIG1 maintains a morphology similar to the native cellulose material (Figure S4). After the second print pass, cLIG2 shows a clear increase in porosity, which could be due to the removal of wax from the printed region or possibly the ablation of the native cellulose fibers.25,43 Higher magnifications show a very rough and undulating surface in cLIG1 that shifts to a seemingly smoother and more fibrous structure after the second print step. Such a morphology can be advantageous for electrochemical applications due to the increased surface area for charge transfer to occur.
Figure 2. Material characterization of cLIG.

a) Scanning electron micrographs after 1 (cLIG1) and 2 (cLIG2) laser print passes. Scale bar is 250 μm in top row and 10 μm in bottom row. b) Representative background-corrected Raman spectra (364 nm) for cLIG1 and cLIG2 with main carbon peaks highlighted. Spectra are normalized to the G peak and offset for clarity. c) X-ray photoelectron spectroscopy (XPS) survey spectra for wax-printed cellulose, cLIG1, and cLIG2 with main elements highlighted. Spectra are offset for clarity. O1s region is highlighted in blue, N1s in green, C1s in orange, P2s and 2p in purple, and Si2s and 2p in yellow. The cLIG print conditions are the optimized conditions discussed in Section 3.2.
In addition to morphological dissimilarities, cLIG1 and cLIG2 demonstrate distinct spectroscopic signatures as well. Figure 2b shows representative Raman spectra measured with a 364 nm (3.41 eV) laser at a power of ~ 1 mW to prevent thermal damage of the cLIG and minimize signal distortion from the background fluorescence. The typical Raman bands for graphitic carbon materials are present, including the D, G, and 2D peaks located at approximately 1390, 1580, and 2780 cm−1, respectively. Several distinguishing features can be seen when comparing the two spectra. There is a clear reduction of the G and D peak widths (from ~ 90 cm−1 to ~ 40 cm−1 for the G peak) and shift in the G peak position (~ 1600 cm−1 to 1580 cm−1) when comparing cLIG1 to cLIG2, pointing to a higher degree of crystallinity and reduced disorder after the second print step.44,45 The broadening and blueshift of the G peak seen in cLIG1 are most likely due to an increasing contribution of the overlapping D’ peak at ~ 1620 cm−1,44 which arises from the intravalley double-resonance process in the presence of defects.46 These observations are corroborated by examination of the second-order Raman modes. cLIG1 shows a very broad feature from ~ 2400 – 3400 cm−1 apart from a pronounced peak at ~ 3190 cm−1, which is most likely a combination mode of the D’ and G peaks or the second-order D’ peak (2D’).47 In contrast to cLIG1, cLIG2 shows much sharper second-order peaks, including the 2D peak, which can indicate the layer number in single- and multi-layer graphene samples. For cLIG2, an intensity ratio of the 2D to G peak of 0.159 ± 0.022 (N = 3) typically indicates multi-layer graphene (or graphite).46 However, previous reports have shown suppression of the 2D peak in Raman measurements under UV excitation,48,49 which makes it difficult compare our value to other reports that use visible excitations, where the 2D band is much stronger. For example, Calizo et al. reported an I(2D)/I(G) of 0.111 for mechanically-exfoliated monolayer graphene using a 325 nm laser,48 indicating the cLIG could possibly be few-layer graphene, although a more in-depth investigation is needed. Additional challenges arise when comparing the D to G peak intensities (I(D)/I(G), 0.256 ± 0.083 (N = 3)), which provides a measure of the defect density in the carbon structure. However, I(D)/I(G) does not vary monotonically with defect density.46,50 Based on the multi-stage theory presented by Ferrari et al.,45 cLIG2 appears to be in “Stage 1”, i.e. graphite/nanocrystalline graphite, as evidenced by both the sharpening of the characteristic peaks and their positions.44,45 Taken into consideration, it appears that the two-step print method is necessary to first convert the cellulose precursor into an amorphous carbon, then into a crystalline graphitic carbon.
X-ray photoelectron spectroscopy (XPS) is also utilized to better understand the chemical composition of the cLIG. As expected, well-defined carbon and oxygen peaks are seen in cLIG1, cLIG2, and wax-treated cellulose materials (Figure 2c). The carbon and oxygen content are similar between cLIG1 and cLIG2 materials (see Table S1). A small N peak is present, which was also seen in previous reports of cellulose paper treated with flame suppressant.42 In all three samples, clear Si 2s and 2p peaks can be seen as well. The presence of Si is most likely from the adhesive tape used to mount the sample during the printing process. Finally, the presence of P 2s and 2p peaks in cLIG2 can be attributed to the phosphate-based flame suppressant that is applied to the cellulose. Interestingly, these peaks are missing or very weak in the other samples. Because XPS only probes a few nm beyond the surface, it is likely that the wax is largely burned off the cellulose fibers after two print passes, leaving the cLIG and cellulose fibers more exposed.
3.2. Electrical and Electrochemical Characterization of cLIG
Optimizing the printing conditions for high electrical conductivity is crucial for electrochemical applications. The laser printer patterns in a raster modality, and as a result, the variables that impact the graphitization process include print speed (s), laser power (p), and sample distance from the focal plane (z). To determine the ideal printing conditions, four-probe sheet resistance (Rsheet) measurements are carried out in a van der Pauw configuration for a range of print parameters.42 Figure 3a and 3b demonstrate the effects of print speed and laser power during the second print pass, respectively. In both cases, the first print pass is performed with the sample away from the focal plane at a z-height of 0.2”, while the second print step is performed with the sample closer to focus at a z-height of 0.11”. Additional details pertaining optimization of the first print pass conditions are presented in the Supplementary Information (Section S4, Figure S5 and S6). The print speed effectively determines the dwell time of the laser spot on a given region of the cellulose. At higher speeds, laser fluence is reduced, which likely results in decreased graphitization capacity as evidenced by the increase in Rsheet. Likewise, if the print speed is too low, the fluence is too high, and the cLIG network begins to burn and degrade. This degradation may explain the larger variability in Rsheet seen at the lowest speed tested (0.8 in. s−1). Taking these observations into consideration, we use a print speed of 1.2 in. s−1 to examine the effect of laser power shown in Figure 3b. Rsheet reaches a minimum at 1 W of laser power with a value of 43.7 ± 2.3 Ωsq−1 (N = 6), which is among the lowest values reported for laser-graphitized paper sensors.24,25,42 At powers both larger and smaller than 1 W, Rsheet begins to increase. Perhaps more deleterious is the variability between samples, which increases as well. For electrochemical sensing applications, a highly conductive material is desirable to minimize ohmic losses in the electrode leads. Therefore, we use 1 W, 1.2 in. s−1, and z = 0.11” as the second pass print condition for subsequent sensor fabrication.
Figure 3. cLIG electrical and electrochemical characterization.
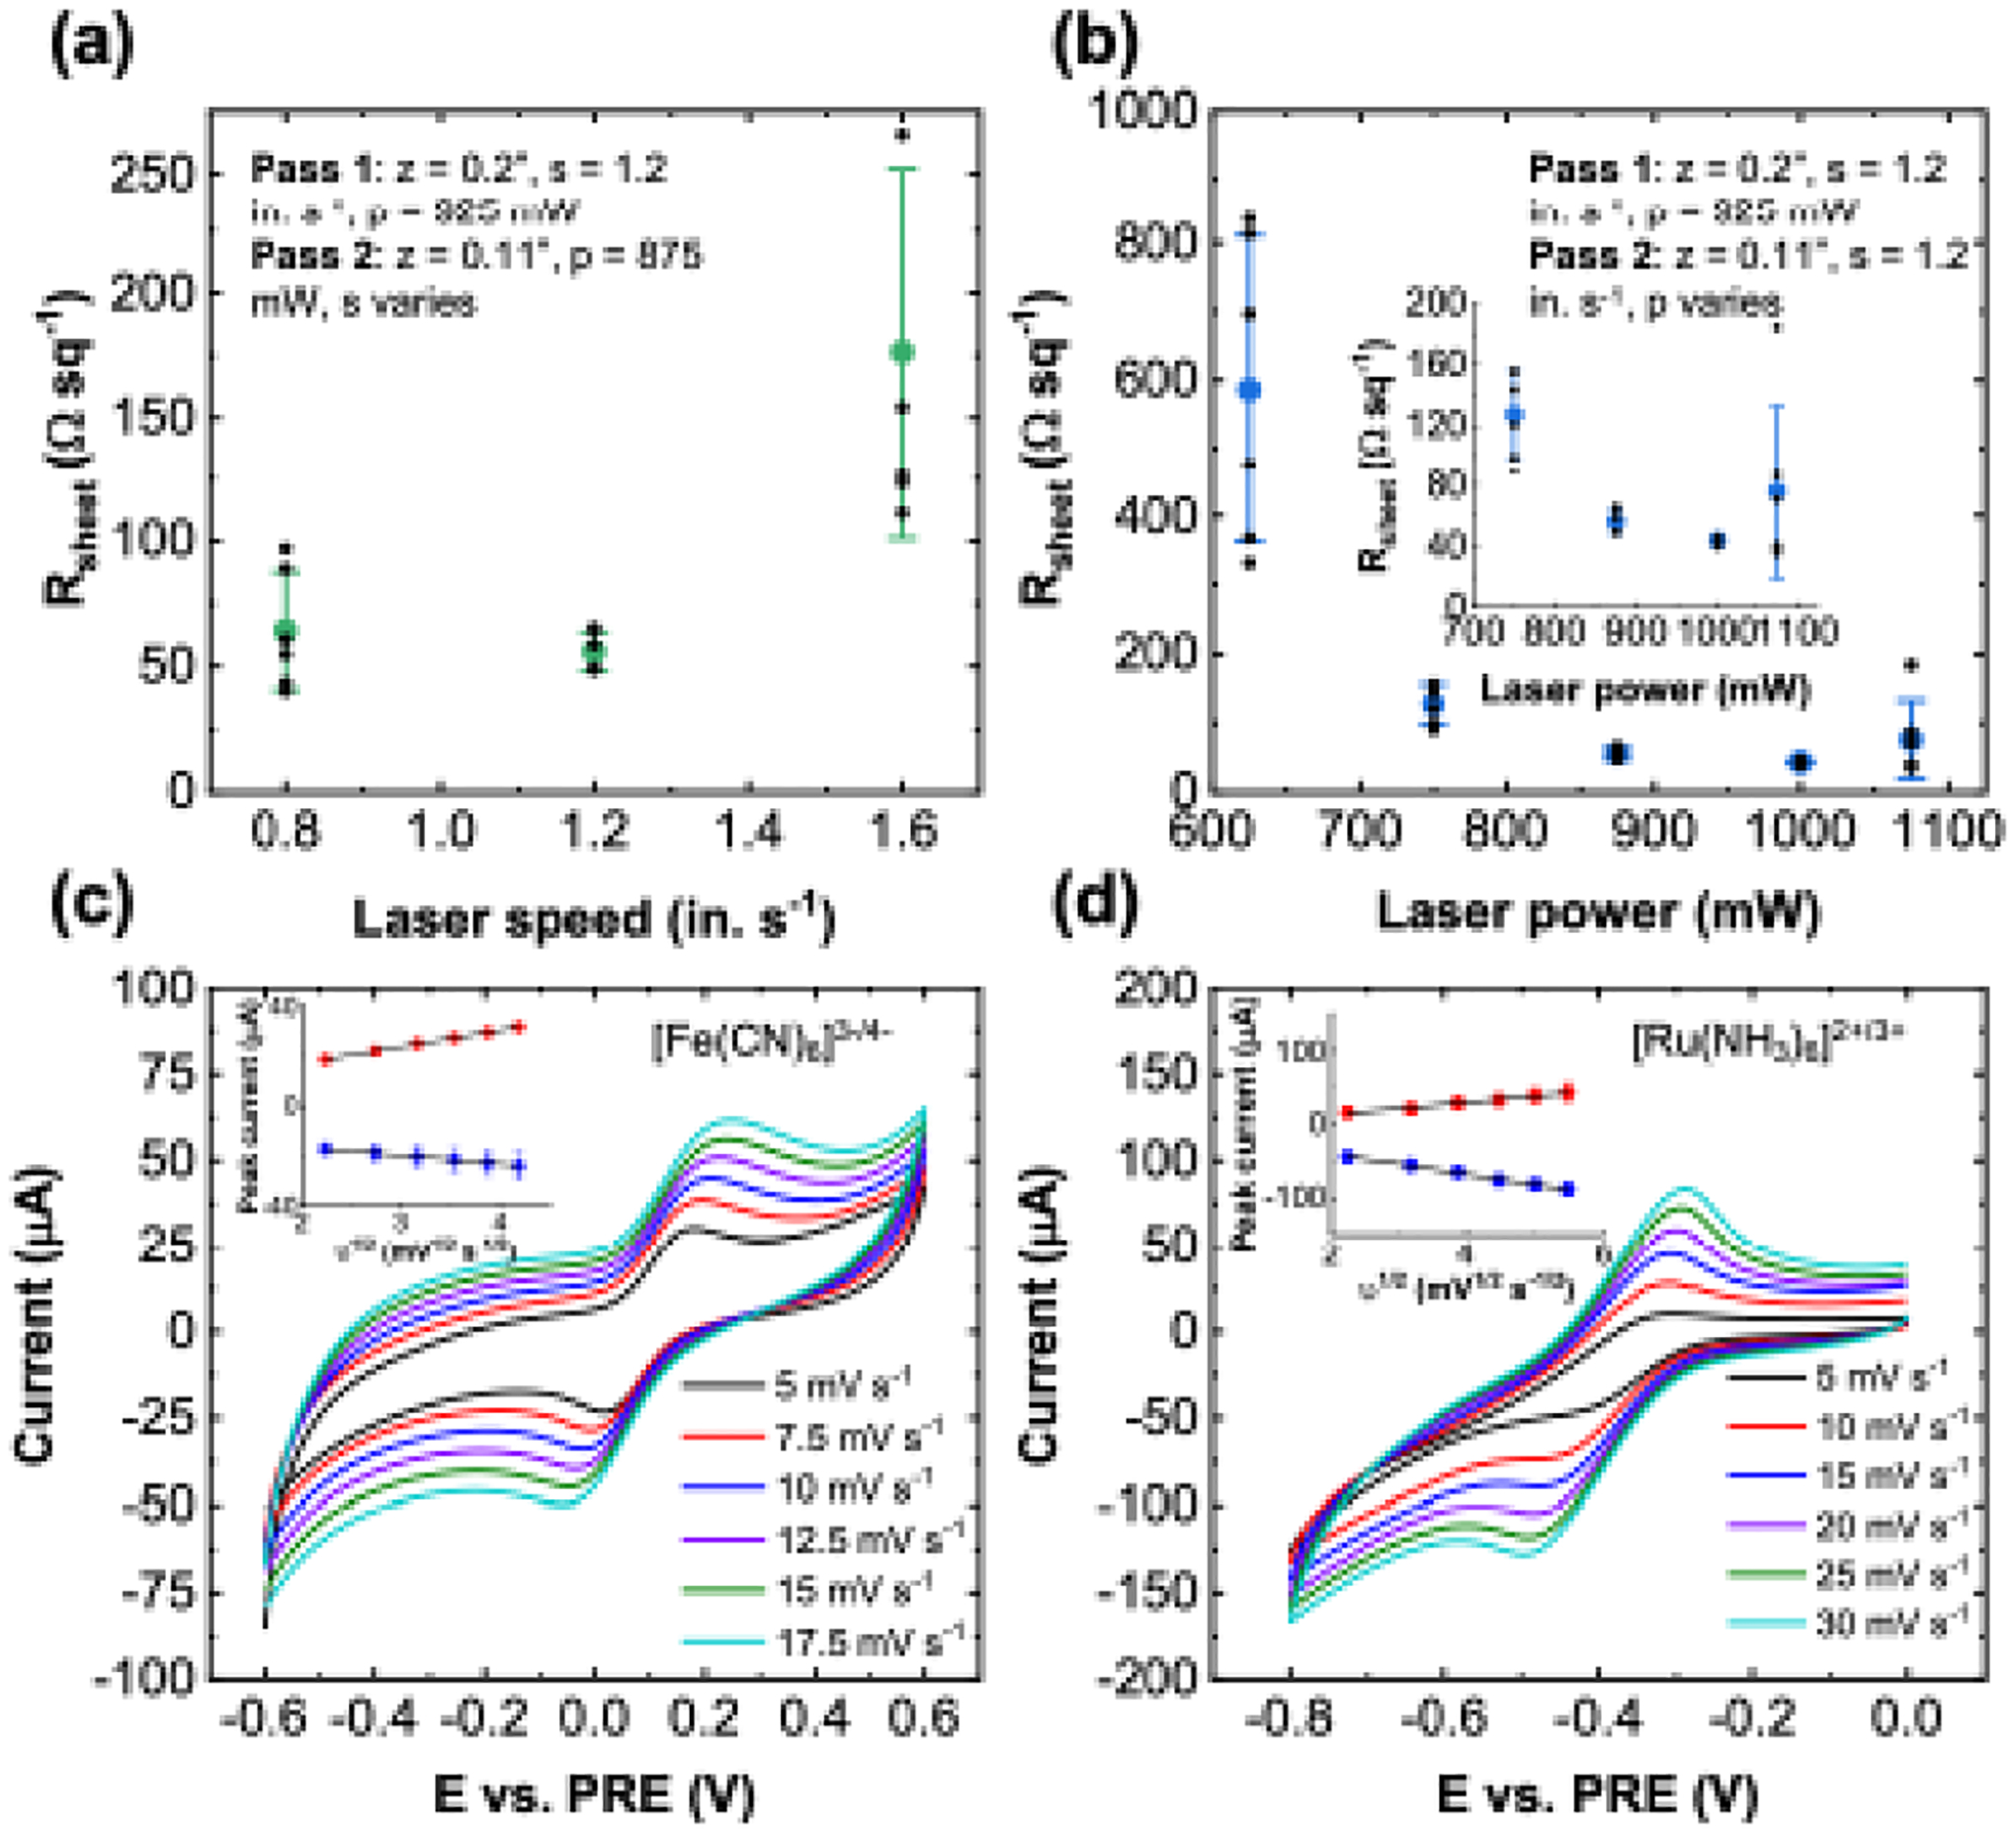
The effect of pass 2 a) speed and b) power on the van der Pauw sheet resistance. Error bars represent the standard deviation of 6 independent samples. Representative cyclic voltammetry (CV) traces with c) 5 mM [Fe(CN)6]4− and d) 5 mM [Ru(NH3)6]3+ at varying scan rates (N = 8). The extracted peak currents vs. square root of the scan rate are plotted in the inset.
To establish the baseline electrochemical properties of the cLIG sensors, we perform cyclic voltammetry (CV) and electrochemical impedance spectroscopy (EIS) measurements (discussed in Section S5 and Figure S7) with [Fe(CN)6]4− and [Ru(NH3)6]3+ redox probes (both 5 mM in PBS). While [Ru(NH3)6]3+/2+ is regarded as an outer-sphere redox couple, meaning it is largely insensitive to electrode surface chemistry, [Fe(CN)6]4−/3− is classified as an inner-sphere couple that is sensitive to the surface condition.51 Both probes are commonly utilized in electrochemical research and facilitate a comparison of the electrochemical properties with other reports in the literature. Figure 3c shows representative CV traces with [Fe(CN)6]4− at scan rates (v) ranging from 5 to 17.5 mV s−1. Both anodic and cathodic peaks show a good linear relationship with the square root of the scan rate (R2 = 1.000 and 0.998, respectively), which suggests predominantly semi-infinite, planar diffusion-type behavior.52 Analysis of the peak separation (ΔEpeak) as a function of scan rate using the methodologies presented by Nicholson53 and Lavagnini54 yields a heterogeneous electron transfer (HET) rate constant (k0) of (6.00 ± 0.45) × 10−4 cm s−1 (see Supplementary Information Section S5 and Figure S8 for more details). Note that for the cLIG sensors reported here, the electrode leads are not cast with silver paste as is done in other reports.25 As a result, resistive losses may lead to a larger ΔEpeak and smaller k0 than what is expected solely from kinetic effects.55 This problem could be mitigated by combining the printing of cLIG with other print modalities (such as direct ink writing) for more conductive materials to serve as contacts/leads. More details are discussed in Section S6 and Figure S9 of the Supplementary Information.
A similar analysis of k0 is carried out with [Ru(NH3)6]3+ for scan rates ranging from 5 to 30 mV s−1, as shown in Figure 3d. Again, both anodic and cathodic peak currents show a linear relationship with the square-root of the scan rate (R2 = 0.991 and 0.996, respectively). We also calculate a HET rate constant of (6.68 ± 0.34) × 10−4 cm s−1. We note that the approach outlined by Nicholson is generally applicable to smooth planar electrodes and does not account for analyte diffusion within the porous structure of the cLIG. However, the power-dependence of the anodic and cathodic peak currents is calculated to be 0.42 and 0.27 for [Fe(CN)6]3−/4− and 0.55 and 0.39 for [Ru(NH3)6]2+/3+, which is close to 0.5 expected for semi-infinite planar diffusion. Moreover, if thin-layer/porous effects were dominant, the slope would approach 1.56 As such, the Nicholson/Lavagnini analyses likely give reasonable estimates for k0. Indeed, the k0 values measured here are of the same order as those previously reported for paper-based LIG sensors.24,25
3.3. Case Study 1: Monitoring the Temporal Profile of Phenazine Generation in P. aeruginosa Cultures
P. aeruginosa is an opportunistic pathogen that is a common source of infection in immunocompromised individuals, such as patients with cystic fibrosis or chronic wounds.57 P. aeruginosa and closely related bacteria are unique in that they produce a family of redox-active metabolites called phenazines,57 which promote virulence and facilitate electron transfer within biofilms.57,58 Examples of phenazines include pyocyanin (PYO), phenazine-1-carboxylic acid (PCA), phenazine-1-carboxamide (PCN), and 5-methylphenazine-1-carboxylic acid (5-MCA).59 Due to their redox-activity and high clinical concentrations (up to 130 μM for PYO, for example),57,58 phenazines show promise as biomarkers for the early detection of P. aeruginosa infections.60 Moreover, the simultaneous detection and identification of multiple phenazines would improve our understanding of their temporal profile and the interplay between the various phenazines. To this end, we use the aforementioned cLIG sensors to electrochemically monitor phenazine production over time in both conventional liquid P. aeruginosa (PA14) cultures and cultures grown directly on cLIG sensors.
First, the three-electrode cLIG sensors are benchmarked with synthetic phenazines LB, as shown in Figure 4. Square wave voltammetry is chosen due to its sensitivity and diagnostic utility. Figure 4a shows exemplary oxidative SWV curves for PYO concentrations ranging from 0.1 to 100 μM. PYO is unique to P. aeruginosa61 and is one of the final species produced in the phenazine biosynthetic pathway.59,60 Perhaps more importantly, it is regarded as the most potent phenazine virulence factor produced by P. aeruginosa,61 and as such, is of great physiological interest. From the SWV profiles, a clear oxidative peak is seen at −0.4 V vs. Ag pseudo-reference electrode (PRE).
Figure 4. Characterization with synthetic phenazines.

a) A representative SWV profile for pyocyanin with concentrations ranging from 0 to 100 μM. b) The resulting calibration curve (N = 10) with R2 = 0.999. c) A representative SWV profile for PCA with concentrations ranging from 0 to 500 μM. d) The resulting calibration curve (N = 12) with R2 = 0.997. e) A representative SWV profile for pyocyanin with concentrations ranging from 0 to 500 μM. f) The resulting calibration curve (N = 12) with R2 = 0.997. SWV parameters: frequency = 10 Hz, Vpulse = 50 mV, Vstep = 10 mV. Error bars represent the standard deviation from independent samples.
The resulting calibration curve is shown in Figure 4b and the peak current (measured from a linear background signal) displays linear behavior across the range of PYO concentration (R2 = 0.999). Using the Upper Limit Approach 1 (ULA1) with α = 0.05 described by Mocak et al.,62 we obtain a sensitivity of 5.01 μA μM−1 cm−2 and a limit of detection (LOD) of 3.37 μM (N = 10). The values of the parameters included in the LOD calculation are included in Section S7. While not the lowest reported, our PYO LOD is at the lower end of the clinical range and is still suitable for early detection of PYO.60,63 Similar analyses are performed for PCA (Figure 4c and 4d) and PCN (Figure 4e and 4f). PCA is produced from chorismate in the phenazine biosynthetic pathway and is a precursor of numerous other phenazine species, including 5-MCA.59 The response of cLIG sensors to PCA indicates this species is not as easily oxidized. Based on SWV measurements, we calculate a LOD of 23.4 μM and a sensitivity of 0.712 μA μM−1 cm−2 (N = 12). We see similar behavior when testing PCN as well, with a LOD of 21.7 μM and sensitivity of 0.569 μA μM−1 cm−2 (N = 12). Reports of clinical concentrations for PCA and PCN are limited. In an updated study, Hunter et al. were unable to detect phenazine concentrations in sputum samples from cystic fibrosis patients above their detection limit of 0.1 μM.64 However, Cezairliyan et al. reported PYO levels of ~ 11.3 μM, PCA levels of ~ 230 μM, and PCN levels below their detection limit in wild-type PA14 cultures grown on peptone, glucose, sorbitol (PGS)-agar plates.65 Moreover, Bellin et al. measured ~ 25 μM of PYO, ~ 75 μM of PCA, and ~ 95 μM of PCN in wild-type PA14 cultures grown for one day on agar plates.66 Furthermore, 5-MCA is a highly-reactive species that is challenging to detect and quantify using chromatographic techniques60 but has been attributed to the voltammetric peak located at a potential more positive than other phenazines.59,66 More recently, Simoska et al. were able to confirm the presence of 5-MCA using advanced mass spectrometry techniques.60 Table S5 in the Supplementary Information summarizes our work and provides a comparison with other reports in the literature. In an effort to build upon and corroborate these prior works, we employ cLIG sensors for monitoring phenazine levels in cultures grown both off-chip and on-chip, as discussed in more detail below.
After benchmarking the cLIG with synthetic phenazines, we next set out to determine if the sensor could detect phenazines released by planktonic P. aeruginosa cultures grown off-chip. P. aeruginosa is known to be resistant to many antibiotics,67 especially in the biofilm state,68 and that sub-inhibitory antibiotic concentrations can modulate the production of virulence factors, such as pyocyanin.69 Thus, we prepare P. aeruginosa cultures with and without antibiotics in the growth medium to reveal the effect antibiotics may have on phenazine production. As a control test, we also monitor E. coli (Figure S10), which does not produce phenazines. Exemplary SWV profiles of PA14 and PA14 with 50 μg ml−1 ampicillin (PA14amp) cultures sampled over the course of 60 h are shown in Figure 5a–5b, respectively. Both PA14 and PA14amp show a clear oxidation peak around −0.4 V vs. PRE. In PA14, this peak shows after 12 h incubation while it shows at 16 h in PA14amp. This peak is most likely a result of pyocyanin generation, which is evident by the distinct blue color seen in the culture media (not shown). In addition to pyocyanin, a faint peak at −0.25 V can be seen in PA14 samples at 12 h (Figure 5c). Based on previous reports,59,60,66 this peak can be attributed to 5-MCA given its relative position (~ 150 mV more positive than pyocyanin). Additionally, another peak can be seen at ~ −0.12 V at later time points. We are not sure what this peak is attributed to, although a similar peak was seen by Simoska et al., where they speculated it to be a derivative of 5-MCA.60
Figure 5. Electrochemical monitoring of planktonic bacteria cultures (off-chip culture).

Exemplary SWV profiles for a) PA14, and b) PA14 + 50 μg ml−1 ampicillin over the course of 60 h. SWV parameters: frequency = 10 Hz, Vpulse = 50 mV, Vstep = 10 mV. c) The 12 and 60 h SWV traces taken from PA14 after background subtraction to highlight the multiple peaks present. The asterisk indicates an unknown peak, although it is suspected to be a derivative of 5-MCA. d) The pyocyanin peak current as a function of time for PA14 (N = 5) and PA14amp (N = 6). Error bars represent the standard deviation of independent samples. e) Optical density (λ = 600 nm) measurements over 60 h for PA14, and PA14amp cultures. Error bars represent the standard deviation of three measurements of same sample.
Plotted in Figure 5d are the extracted pyocyanin peak currents for both PA14 and PA14amp as a function of time. On average, PA14 shows consistently larger peak currents compared to PA14amp, although the variability of this particular sample is large. In both samples, the pyocyanin levels largely plateau beyond 22 h, and even begin to decline slightly, despite a continuous increase in the OD600 of PA14 and PA14amp over 60 h (Figure 5e). Nonetheless, similar behavior was seen in previous studies.60 From the calibration curve presented in Figure 4b, we calculate the pyocyanin level at 22 h as 22.7 ± 11.2 μM for PA14 and 11.8 ± 3.8 μM for PA14amp. The lower average concentration in PA14amp could be a result of lower cell count, as suggested by the smaller OD600 values. However, the OD600 values are similar at 12 h while the peak current (i.e. pyocyanin concentration) is barely detectable in PA14amp cultures, suggesting the antibiotic may alter or slow the phenazine biosynthesis pathway. Liu et al. also noted lower pyocyanin levels in P. aeruginosa incubated with curcumin, which has an antibacterial effect.41 As such, a more in-depth study of the effect of antibiotics on phenazine production is certainly warranted.
Motivated by the ability of cLIG to detect various phenazines in planktonic P. aeruginosa cultures, next we monitor phenazine production in PA14 and PA14amp cultures directly grown on the cLIG sensors. Figure 6 shows exemplary SWV profiles for PA14 and PA14amp over the course of 22 h with data from other sensors presented in Section S7 of the Supplementary Information (Figures S11–S16). Beyond 22 h, leakage of the culture media between adjacent sensor wells becomes an issue, and therefore, we do not test at longer time points. To make cLIG more suitable for multi-day, on-chip studies, improvements will need to be made in the future. Comparing the SWV profiles, we again note consistently smaller peak currents in PA14amp cultures compared to PA14. However, clear differences can be seen in the voltammetric peak profile compared to the planktonic cultures in Figure 5. In PA14, a small peak can be seen after 4 h incubation with a large increase seen between 4 and 6 h. This is approximately the time when P. aeruginosa bacteria begin to irreversibly attach to the substrate and biofilm growth starts.41,70 At 6 h, the appearance of a small shoulder on the main peak seen at more negative potentials indicates the presence of at least one additional phenazine aside from 5-MCA, pyocyanin, and the unknown species, which can be seen at ~ −0.15 V, ~ −0.3 V, and ~ −0.05 V, respectively. Comparing off-chip and on-chip experiments, we observe that phenazine production is higher in the latter, as indicated by larger voltammetric peak currents. This divergence in phenazine production could be a result of the proximity of the biofilm and sensor, which would concentrate the phenazines around the sensor. Alternatively, phenazine production by P. aeruginosa biofilms on paper may be fundamentally different than in planktonic cultures, which corroborates previous reports.71
Figure 6. Monitoring P. aeruginosa cultures grown on cLIG (On-chip culture).

Exemplary SWV profiles for a) PA14 and b) PA14amp showing the evolution of the peak profile over the course of 22 h of testing. SWV parameters: frequency = 10 Hz, Vpulse = 50 mV, Vstep = 10 mV.
Tests with binary mixtures of synthetic phenazines (PYO, PCA, and PCN) with cLIG sensors indicate both PCA and PCN peaks appear at slightly more negative potentials than pyocyanin (Section S10, Figure S17) while the PCA and PCN peaks are difficult to distinguish clearly. This suggests that the shoulder can likely be attributed to PCA and/or PCN. 1-hydroxyphenazine is another possibility, but its oxidation peak typically occurs at a more negative potential (~ 200 – 250 mV more negative than pyocyanin)60 making it a less likely candidate. From the profile, the pyocyanin peak continues to increase in magnitude but is eventually overtaken by the PCA/PCN peak around the 12 h time point. Beyond 12 h, the pyocyanin peak becomes smaller and is overwhelmed by the PCA/PCN peak, which indicates a shift in the particular phenazine(s) being produced. The shift in peak magnitude could also be due to the selective retainment of pyocyanin and PCN by P. aeruginosa biofilms,58 which would suggest the PCA/PCN peak is largely due to PCA. To improve the peak separation, future work could explore tailoring the cLIG electrode porosity to take advantage of thin layer effects.72 Furthermore, improvements to the on-chip reference electrode would provide more consistent peak positions, allowing for more confident peak assignment.
3.4. Case Study 2: Electrochemical Determination of Bacterial Viability (Metabolism)
Characterizing and understanding bacterial viability and metabolic activity is critical for ensuring the effective administration of treatments, such as antibiotics. Typically, techniques, such as colony counting and disk diffusion, are employed to determine the presence of bacteria as well as the response to a given treatment. While low-cost, these methods rely on the direct visualization of bacterial growth on solid media and can take upwards of several days to complete.73 This is especially challenging in resource-limited and point-of-care settings where results are needed in minutes or hours rather than days. Thus, alternative strategies, including electrochemical assays, are under development.74 As a proof-of-concept, we demonstrate one particular electrochemical viability/metabolic activity assay based on the reduction of resazurin (RZ),75 a redox-active dye commonly used in fluorescence assays, using cLIG paper sensors with E. coli as the model bacterium.
The working principle of the resazurin electrochemical assay is based on the irreversible reduction of resazurin to resorufin (RS),
| (1) |
Live and metabolically-active cells reduce the resazurin to resorufin, which results in a decrease in the magnitude of the resazurin electrochemical reduction peak. An example of the time-dependent SWV profile with live cells is shown in Figure 7a. In contrast, a sample with non-metabolizing or dead cells shows little to no change in the resazurin reduction peak magnitude (Figure S18a). We should note, however, the SWV peak shift to more negative potentials seen between 0 and 2 h tests for both live and dead bacteria cultures. This peak shift is possibly due to biofouling of the electrode from proteins or other components in the Brain-Heart Infusion (BHI) broth76 despite washing with DI water after each round of testing. Additionally, changes to the chemical composition of the Ag paste reference electrode may cause a shift in the reduction potential. Because the shift is observed in both live and dead cultures, it is unlikely that the peak shift is due to the reduction of another species besides resazurin.
Figure 7. Electrochemical viability (metabolic activity) assay based on resazurin.

a) A representative SWV profile of live E. coli cultures with 1 mM resazurin in BHI. SWV parameters: frequency = 10 Hz, Vpulse = 25 mV, Vstep = 5 mV. b) The normalized current (w.r.t. t0) for live and heat-hilled (80°C, 30 min) E. coli cultures (N = 4). Error bars represent the standard deviation of four independent samples. c) The corresponding OD600 values of parallel cultures grown without resazurin (N = 3). Error bars represent the standard deviation of three independent cultures.
To demonstrate the resazurin electrochemical assay, we prepare two cultures of E. coli in BHI and sample them over the course of 10 h using our cLIG sensors. One culture is grown normally while the other is subjected to an 80°C water bath to kill any bacteria before testing begins. At the start of testing, 1 mM RZ is added to each culture, which are then incubated at 37°C under constant shaking. Figure 7b shows the resulting SWV reduction peak currents normalized with respect to t0 (data without normalization shown in Figure S18b). The live (metabolizing) culture begins to show a decrease in the normalized current after just 2 h, which is near the start of the exponential growth phase. After 4 h, the normalized current reaches ~ 30% where it holds constant for the remainder of testing. In contrast, the normalized current of the heat-killed (dead) culture remains relatively constant and close to 100% over the course of testing, thus indicating that no viable bacteria are present in the culture.
To complement and validate our electrochemical assay, we perform optical density measurements at λ = 600 nm with resazurin-free cultures grown in parallel (Figure 7c). The OD600 data show good agreement with the electrochemical assay. The live culture begins to grow exponentially until 4–7 h, where the OD600 data begin to plateau. The heat-killed culture, on the other hand, does not show any detectable increase in OD600 over the course of the 10 h window. Interestingly, the electrochemical assay reaches a plateau after 4 h, while the OD600 data do not plateau until 7 h. This discrepancy may be due to the slowing of the metabolic rate at the start of the stationary phase despite a continued increase in cell number.77 Because optical density is used to quantify cell density while resazurin reduction is a result of metabolic processes, it is likely that the two measurements will diverge slightly at various points of the bacterial growth process. Such divergence could also be expected to occur in the early stages of growth (i.e. the lag-phase) where bacteria are metabolically active but are not multiplying.78
4. Conclusion
In this work, we demonstrate cellulose-based laser-induced graphene (cLIG) as a low-cost platform for bacterial culture and on-demand electrochemical monitoring of cellular viability and phenazine production with E. coli and P. aeruginosa as model bacteria. By optimizing the multi-pass print conditions, we achieve one of the lowest sheet resistance values for cLIG (43.7 ± 2.3 Ωsq−1), which is critical for electrochemical applications. The cLIG sensors are capable of profiling the production of phenazines in both planktonic P. aeruginosa cultures grown off-chip and cultures grown on-chip, with notable similarities and differences in the temporal profiles that build upon previous examples of electrochemical sensors for phenazine detection. The cLIG sensors are also suitable for electrochemical metabolic assaying of bacteria using resazurin. While the focus of this study is to demonstrate this assay conceptually, future work could leverage these results and use cLIG to study antibiotic resistance and susceptibility, which is one of the most pressing challenges facing humanity. High-throughput testing with cLIG paper sensors, for example, to evaluate the efficacy of an antibiotic, will require large multi-sensor arrays that can test a range of therapeutic and culture conditions with replicates (as in conventional 96-well plates). Working towards scalable, roll-to-roll manufacturing, we conduct preliminary experiments that combine laser printing with an additional print modality (direct writing of Ag ink on cLIG pads). Combined with the attractive properties of cLIG, this work demonstrates potentially scalable, paper-based electrochemical sensors for monitoring of bacteria. The ubiquity, ease of disposal, and three-dimensional microstructure of paper render the cLIG suitable for the analysis of microbial samples, with envisioned applications including high-throughput antibiotic susceptibility testing, ecological studies, and biofilm studies.
Supplementary Material
HIGHLIGHTS.
A low-cost, easily disposable electrochemical sensor array on cellulose paper for bacterial monitoring
Optimized laser-graphitization print conditions yield a sheet resistance of 43.7 ± 2.3 Ωsq−1
Electrochemical monitoring of phenazine production in both planktonic and biofilm Pseudomonas aeruginosa cultures over course of hours to days
A resazurin-based electrochemical assay for characterizing viability of Escherichia coli cultures
ACKNOWLEDGMENTS
This work was partially supported by NSF:I/UCRC Phase II: Center for Atomically Thin Multifunctional Coatings (ATOMIC; Award #2113864) and the National Institutes of Health (awards R21EB031354 and R21GM132793). The content of this report is solely the responsibility of the authors and does not necessarily represent the official views of the National Science Foundation (NSF) or National Institutes of Health (NIH). The PA14 strain (NR-50573) was obtained through BEI Resources, NIH: National Institute of Allergy and Infectious Diseases (NIAID). The authors would also like to acknowledge the resources and staff of the Materials Characterization Laboratory at Penn State. A special thanks to Dr. Max Wetherington for helpful discussions related to the Raman measurements.
Biographies
Derrick Butler received his B.S. in physics (2015) from the University of Vermont and his M.S.E. in materials science and engineering (2017) from the University of Pennsylvania. He recently received his Ph.D. in electrical engineering from Penn State University in August 2022. He is a recipient of the Penn State University Graduate Fellowship (2018) and the Joseph W. Richards Summer Fellowship from the Electrochemical Society (2021). His current research interests include two-dimensional materials for application in electrochemical and electrical biosensors.
Vinay Kammarchedu received a dual-degree B. Tech and M. Tech (2020) in electronics and communication engineering from the International Institute of Information Technology, Bangalore, India. He is currently pursuing his Ph.D. in electrical engineering at Penn State University. He is a recipient of the 2021 Leighton Riess Graduate Fellowship in Engineering. His research interests revolve around the fusion of electronics, biology, and robotics to create wearable devices and sensors.
Keren Zhou received his B.E. in Electronic Science and Technology from the University of Electronic Science and Technology of China in 2017 and his M.S. in electrical engineering from the Pennsylvania State University in 2020. He is currently a fifth-year Ph.D. candidate at the Pennsylvania State University. He is a recipient of the Milton and Albertha Langdon Memorial Graduate Fellowship (2018) and the College of Engineering Riess Graduate Fellowship (2021). His research focuses on combining electrochemical and optical sensors for bacteria phenotype study and portable and wearable devices for Point-of-care testing.
Lachlan Peeke earned his B.S. in Material Science and Engineering in 2019 at Penn State. Then, he completed a M.S. in Additive Manufacturing and Design in 2021 at Penn State. Currently, he is a Ph.D. student of Material Science and Engineering at Penn State. His focus is material design for additive manufacturing of electronics and antennas for the RF sector.
Luke Lyle (PSU/ARL) is an Assistant Research Professor in the Electronic Materials and Devices Department (EMDD) at the Penn State Applied Research Laboratory (ARL) and holds an Adjunct Professor appointment in the Materials Science and Engineering (MatSE) department. He received his Ph.D. from Carnegie Mellon University in Materials Science and Engineering on materials characterization, electrical characterization, and device fabrication of ultra-wide bandgap semiconductors, primarily focused on electrical contacts to Ga2O3. Dr. Lyle worked on electrical contacts, epitaxial growth, and materials characterization of wide and ultra-wide bandgap semiconductors for over five years. He has 12 peer reviewed publications, 10 conference presentations/invitations, and has raised >$100,000 in research funding since completing his Ph.D. in 2020.
David W. Snyder received his B.S. in chemical engineering from Penn State University in 1986 and his Ph.D. in chemical engineering/materials science from Carnegie Mellon University in 1990. He is currently the Head of the Electronic Materials and Devices Department at the Penn State Applied Research Laboratory. He also holds Adjunct Professor positions in the Penn State Departments of Chemical Engineering and Materials Science and Engineering.
Aida Ebrahimi (Member, IEEE) received her BSc and MSc degrees in electrical engineering from University of Tehran, Iran. Following completion of her Ph.D. studies in electrical and computer engineering, Purdue University (Indiana, USA), Dr. Ebrahimi joined the Pennsylvania State University as an Assistant Professor of Electrical Engineering. At Penn State, she also holds a courtesy appointment in the department of Biomedical Engineering. Dr. Ebrahimi is a recipient of several awards and scholarships for outstanding research performance, including NIH: NIBIB Trailblazer Award (2021), Scialog Fellow in Microbiome, Neurobiology and Disease (Research Corporation for Science Advancement, 2020), the Materials-Life Science Convergence Award (Penn State, 2018), Bilsland Dissertation Fellowship Award (Purdue University, 2015), Rising Star in EECS (MIT, 2015), among others. Dr. Ebrahimi is a member of the IEEE Electron Device Society (EDS), the IEEE Engineering in Medicine and Biology Society (EMBS), the Electrochemical Society (ECS), and the Materials Research Society (MRS).
Footnotes
Publisher's Disclaimer: This is a PDF file of an unedited manuscript that has been accepted for publication. As a service to our customers we are providing this early version of the manuscript. The manuscript will undergo copyediting, typesetting, and review of the resulting proof before it is published in its final form. Please note that during the production process errors may be discovered which could affect the content, and all legal disclaimers that apply to the journal pertain.
CRediT authorship contribution statement
Derrick Butler: Conceptualization, Methodology, Investigation, Writing – Original Draft, Writing – Review & Editing, Visualization Vinay Kammarchedu: Investigation, Resources, Writing – Review & Editing Keren Zhou: Methodology, Investigation, Writing – Review & Editing Lachlan Peeke: Methodology, Investigation, Writing – Review & Editing Luke Lyle: Investigation, Writing – Review & Editing David W. Snyder: Writing – Review & Editing, Supervision Aida Ebrahimi: Writing – Review & Editing, Supervision, Visualization, Funding Acquisition
Declaration of interests
The authors declare that they have no known competing financial interests or personal relationships that could have appeared to influence the work reported in this paper.
The authors have no conflicts of interest to declare.
REFERENCES
- (1).Ye R, James DK, Tour JM, Acc. Chem. Res 2018, 51, 1609–1620. [DOI] [PubMed] [Google Scholar]
- (2).Schumann M, Sauerbrey R, Smayling MC, Appl. Phys. Lett 1991, 58, 428–430. [Google Scholar]
- (3).El-Kady MF, Strong V, Dubin S, Kaner RB, Science 2012, 335, 1326–1330. [DOI] [PubMed] [Google Scholar]
- (4).Lin J, Peng Z, Liu Y, Ruiz-Zepeda F, Ye R, Samuel ELG, Yacaman MJ, Yakobson BI, Tour JM, Nat. Commun 2014, 5, 1–8. [DOI] [PMC free article] [PubMed] [Google Scholar]
- (5).Peng Z, Ye R, Mann JA, Zakhidov D, Li Y, Smalley PR, Lin J, Tour JM, ACS Nano 2015, 9, 5868–5875. [DOI] [PubMed] [Google Scholar]
- (6).Johnson ZT, Williams K, Chen B, Sheets R, Jared N, Li J, Smith EA, Claussen JC, ACS Sensors 2021, 6, 3063–3071. [DOI] [PubMed] [Google Scholar]
- (7).Alhajji E, Zhang F, Alshareef HN, Energy Technol 2021, 9, 2100454. [Google Scholar]
- (8).Santos NF, Pereira SO, Moreira A, Girão AV, Carvalho AF, S Fernandes AJ, Costa FM, Adv. Mater. Technol 2021, 6, 2100007. [Google Scholar]
- (9).Han T, Nag A, Simorangkir RBVB, Afsarimanesh N, Liu H, Mukhopadhyay SC, Xu Y, Zhadobov M, Sauleau R, Sensors 2019, 19, 3477. [DOI] [PMC free article] [PubMed] [Google Scholar]
- (10).Zhu J, Liu S, Hu Z, Zhang X, Yi N, Tang K, Dexheimer MG, Lian X, Wang Q, Yang J, Gray J, Cheng H, Biosens. Bioelectron 2021, 193, 113606. [DOI] [PMC free article] [PubMed] [Google Scholar]
- (11).Singh SP, Li Y, Be’Er A, Oren Y, Tour JM, Arnusch CJ, ACS Appl. Mater. Interfaces 2017, 9, 18238–18247. [DOI] [PubMed] [Google Scholar]
- (12).Zhang J, Ren M, Wang L, Li Y, Yakobson BI, Tour JM, Zhang J, Ren M, Li Y, Yakobson BI, Tour JM, Wang L, Adv. Mater 2018, 30, 1707319. [DOI] [PubMed] [Google Scholar]
- (13).Yang Y, Song Y, Bo X, Min J, Pak OS, Zhu L, Wang M, Tu J, Kogan A, Zhang H, Hsiai TK, Li Z, Gao W, Nat. Biotechnol 2019, 38, 217–224. [DOI] [PubMed] [Google Scholar]
- (14).Zhang L, Wang L, Li J, Cui C, Zhou Z, Wen L, Nano Lett 2022. [DOI] [PubMed] [Google Scholar]
- (15).Soares RRA, Hjort RG, Pola CC, Parate K, Reis EL, Soares NFF, Mclamore ES, Claussen JC, Gomes CL, ACS Sensors 2020, 5, 1900–1911. [DOI] [PubMed] [Google Scholar]
- (16).Zhou K, Kammarchedu V, Butler D, Khamsi PS, Ebrahimi A, Adv. Healthc. Mater 2022, 2200773. [DOI] [PMC free article] [PubMed] [Google Scholar]
- (17).Chyan Y, Ye R, Li Y, Singh SP, Arnusch CJ, Tour JM, ACS Nano 2018, 12, 2176–2183. [DOI] [PubMed] [Google Scholar]
- (18).Ye R, Chyan Y, Zhang J, Li Y, Han X, Kittrell C, Tour JM, Ye R, Chyan Y, Zhang J, Li Y, Han X, Kittrell C, Tour JM, Adv. Mater 2017, 29, 1702211. [DOI] [PubMed] [Google Scholar]
- (19).Mazurkiewicz W, Podrażka M, Jarosińska E, Kappalakandy Valapil K, Wiloch M, Jönsson-Niedziółka M, Witkowska Nery E, ChemElectroChem 2020, 7, 2939–2956. [Google Scholar]
- (20).Bhattacharya G, Fishlock SJ, Hussain S, Choudhury S, Xiang A, Kandola B, Pritam A, Soin N, Roy SS, McLaughlin JA, ACS Appl. Mater. Interfaces 2022. [DOI] [PMC free article] [PubMed] [Google Scholar]
- (21).Baharfar M, Rahbar M, Tajik M, Liu G, Biosens. Bioelectron 2020, 167, 112506. [DOI] [PubMed] [Google Scholar]
- (22).Dungchai W, Chailapakul O, Henry CS, Anal. Chem 2009, 81, 5821–5826. [DOI] [PubMed] [Google Scholar]
- (23).de Araujo WR, Frasson CM, Ameku WA, Silva JR, Angnes L, Longo Cesar Paixão TR, Angew. Chemie 2017, 129, 15309–15313. [DOI] [PubMed] [Google Scholar]
- (24).Kulyk B, Pereira SO, Fernandes AJS, Fortunato E, Costa FM, Santos NF, Carbon 2022, 197, 253–263. [Google Scholar]
- (25).Pinheiro T, Silvestre S, Coelho J, Marques AC, Martins R, Sales MGF, Fortunato E, Adv. Mater. Interfaces 2021, 8, 2101502. [Google Scholar]
- (26).Hol FJH, Whitesides GM, Dekker C, Ecol. Lett 2019, 22, 1316–1323. [DOI] [PMC free article] [PubMed] [Google Scholar]
- (27).Marques AC, Santos L, Costa MN, Dantas JM, Duarte P, Gonçalves A, Martins R, Salgueiro CA, Fortunato E, Sci. Rep 2015, 5, 1–7. [DOI] [PMC free article] [PubMed] [Google Scholar]
- (28).Kim HJ, Kwon C, Lee BS, Noh H, Analyst 2019, 144, 2248–2255. [DOI] [PubMed] [Google Scholar]
- (29).Laliwala A, Svechkarev D, Sadykov MR, Endres J, Bayles KW, Mohs AM, Anal. Chem 2022, 94, 2615–2624. [DOI] [PMC free article] [PubMed] [Google Scholar]
- (30).Liu B, Du D, Hua X, Yu XY, Lin Y, Electroanalysis 2014, 26, 1214–1223. [Google Scholar]
- (31).Nery EW, Kubota LT, Anal. Bioanal. Chem 2013, 405, 7573–7595. [DOI] [PubMed] [Google Scholar]
- (32).Kuss S, Amin HMA, Compton RG, Chem. - An Asian J 2018, 13, 2758–2769. [DOI] [PubMed] [Google Scholar]
- (33).Chu S, Wang H, Ling X, Yu S, Yang L, Jiang C, ACS Appl. Mater. Interfaces 2020, 12, 12962–12971. [DOI] [PubMed] [Google Scholar]
- (34).Wang H, Da L, Yang L, Chu S, Yang F, Yu S, Jiang C, J. Hazard. Mater 2020, 392, 122506. [DOI] [PubMed] [Google Scholar]
- (35).Bhardwaj J, Devarakonda S, Kumar S, Jang J, Sens. Actuators B Chem 2017, 253, 115–123. [Google Scholar]
- (36).Adkins JA, Boehle K, Friend C, Chamberlain B, Bisha B, Henry CS, Anal. Chem 2017, 89, 3613–3621. [DOI] [PubMed] [Google Scholar]
- (37).Rengaraj S, Cruz-Izquierdo A, Scott JL, DiLorenzo M, Sens. Actuators B Chem 2018, 265, 50–58. [Google Scholar]
- (38).e Silva RF, Longo Cesar Paixão TR, Der Torossian Torres M, de Araujo WR, Sens. Actuators B Chem 2020, 308, 127669. [Google Scholar]
- (39).Ng K, Gao B, Yong KW, Li Y, Shi M, Zhao X, Li Z, Zhang XH, Pingguan-Murphy B, Yang H, Xu F, Mater. Today 2017, 20, 32–44. [Google Scholar]
- (40).Goulet MA, Skyllas-Kazacos M, Kjeang E, Carbon 2016, 101, 390–398. [Google Scholar]
- (41).Liu L, Cao X, Ma W, Chen L, Li S, Hu B, Xu Y, Sens. Actuators B Chem 2021, 327, 128945. [Google Scholar]
- (42).Kulyk B, Silva BFR, Carvalho AF, Silvestre S, Fernandes AJS, Martins R, Fortunato E, Costa FM, ACS Appl. Mater. Interfaces 2021, 13, 10210–10221. [DOI] [PubMed] [Google Scholar]
- (43).Kulyk B, Matos M, Silva BFR, Carvalho AF, Fernandes AJS, Evtuguin DV, Fortunato E, Costa FM, Diam. Relat. Mater 2022, 123, 108855. [Google Scholar]
- (44).Ferrari AC, Robertson J, Phys. Rev. B 2000, 61, 14095. [Google Scholar]
- (45).Ferrari AC, Robertson J, Philos. Trans. R. Soc. A Math. Phys. Eng. Sci 2004, 362, 2477–2512. [DOI] [PubMed] [Google Scholar]
- (46).Ferrari AC, Basko DM, Nat. Nanotechnol 2013, 8, 235–246. [DOI] [PubMed] [Google Scholar]
- (47).Kaniyoor A, Ramaprabhu S, AIP Adv 2012, 2, 032183. [Google Scholar]
- (48).Calizo I, Bejenari I, Rahman M, Liu G, Balandin AA, J. Appl. Phys 2009, 106, 043509. [Google Scholar]
- (49).Liu HL, Siregar S, Hasdeo EH, Kumamoto Y, Shen CC, Cheng CC, Li LJ, Saito R, Kawata S, Carbon 2015, 81, 807–813. [Google Scholar]
- (50).Cançado LG, Jorio A, Ferreira EHM, Stavale F, Achete CA, Capaz RB, Moutinho MVO, Lombardo A, Kulmala TS, Ferrari AC, Nano Lett 2011, 11, 3190–3196. [DOI] [PubMed] [Google Scholar]
- (51).McCreery RL, Chem. Rev 2008, 108, 2646–2687. [DOI] [PubMed] [Google Scholar]
- (52).Bard AJ, Faulkner LR, White HS, Electrochemical Methods: Fundamentals and Applications, 3rd ed.; John Wiley & Sons, Inc., 2022. [Google Scholar]
- (53).Nicholson RS, Anal. Chem 1965, 37, 1351–1355. [Google Scholar]
- (54).Lavagnini I, Antiochia R, Magno F, Electroanalysis 2004, 16, 505–506. [Google Scholar]
- (55).Keil RG, J. Electrochem. Soc 1986, 133, 1375–1379. [Google Scholar]
- (56).Punckt C, Pope MA, Aksay IA, J. Phys. Chem . C 2013, 117, 16076–16086. [Google Scholar]
- (57).Hall S, Mcdermott C, Anoopkumar-Dukie S, Mcfarland AJ, Forbes A, Perkins AV, Davey AK, Chess-Williams R, Kiefel MJ, Arora D, Grant GD, Toxins (Basel) 2016, 8, 236. [DOI] [PMC free article] [PubMed] [Google Scholar]
- (58).Saunders SH, Tse ECM, Yates MD, Otero FJ, Trammell SA, Stemp EDA, Barton JK, Tender LM, Newman DK, Cell 2020, 182, 919–932.e19. [DOI] [PMC free article] [PubMed] [Google Scholar]
- (59).Bellin DL, Sakhtah H, Zhang Y, Price-Whelan A, Dietrich LEP, Shepard KL, Nat. Commun 2016, 7, 10535. [DOI] [PMC free article] [PubMed] [Google Scholar]
- (60).Simoska O, Sans M, Fitzpatrick MD, Crittenden CM, Eberlin LS, Shear JB, Stevenson KJ, ACS Sensors 2019, 4, 170–179. [DOI] [PubMed] [Google Scholar]
- (61).Vilaplana L, Marco MP, Anal. Bioanal. Chem 2020, 412, 5897–5912. [DOI] [PubMed] [Google Scholar]
- (62).Mocak J, Bond AM, Mitchell S, Scollary G, Bond AM, Pure Appl. Chem 1997, 69, 297–328. [Google Scholar]
- (63).Wilson R, Sykes DA, Watson D, Rutman A, Taylor GW, Cole PJ, Infect. Immun 1988, 56, 2515–2517. [DOI] [PMC free article] [PubMed] [Google Scholar]
- (64).Glasser NR, Hunter RC, Liou TG, Newman DK, PLoS One 2019, 14, e0226578. [DOI] [PMC free article] [PubMed] [Google Scholar]
- (65).Cezairliyan B, Vinayavekhin N, Grenfell-Lee D, Yuen GJ, Saghatelian A, Ausubel FM, PLOS Pathog 2013, 9, e1003101. [DOI] [PMC free article] [PubMed] [Google Scholar]
- (66).Bellin DL, Sakhtah H, Rosenstein JK, Levine PM, Thimot J, Emmett K, Dietrich LEP, Shepard KL, Nat. Commun 2014, 5, 3256. [DOI] [PMC free article] [PubMed] [Google Scholar]
- (67).Morkunas B, Galloway WRJD, Wright M, Ibbeson BM, Hodgkinson JT, O’Connell KMG, Bartolucci N, Valle M. Della, Welch M, Spring DR, Org. Biomol. Chem 2012, 10, 8452–8464. [DOI] [PubMed] [Google Scholar]
- (68).Stewart PS, Costerton JW, Lancet 2001, 358, 135–138. [DOI] [PubMed] [Google Scholar]
- (69).Zhu K, Chen S, Sysoeva TA, You L, PLOS Biol 2019, 17, e3000573. [DOI] [PMC free article] [PubMed] [Google Scholar]
- (70).Rasamiravaka T, Labtani Q, Duez P, El Jaziri M, Biomed Res. Int 2015, 2015. [DOI] [PMC free article] [PubMed] [Google Scholar]
- (71).Recinos DA, Sekedat MD, Hernandez A, Cohen TS, Sakhtah H, Prince AS, Price-Whelan A, Dietrich LEP, Proc. Natl. Acad. Sci. U.S.A 2012, 109, 19420–19425. [DOI] [PMC free article] [PubMed] [Google Scholar]
- (72).Punckt C, Pope MA, Aksay IA, J. Phys. Chem. C 2014, 118, 22635–22642. [Google Scholar]
- (73).Khan ZA, Siddiqui MF, Park S, Diagnostics 2019, 9. [DOI] [PMC free article] [PubMed] [Google Scholar]
- (74).Bolotsky A, Muralidharan R, Butler D, Root K, Murray W, Liu Z, Ebrahimi A, Biosens. Bioelectron 2021, 172, 112615. [DOI] [PubMed] [Google Scholar]
- (75).Besant JD, Sargent EH, Kelley SO, Lab Chip 2015, 15, 2799–2807. [DOI] [PubMed] [Google Scholar]
- (76).Harris AR, Carter P, Cowan R, Wallace GG, ChemElectroChem 2021, 8, 1078–1090. [Google Scholar]
- (77).Braissant O, Astasov-Frauenhoffer M, Waltimo T, Bonkat G, Front. Microbiol 2020, 11, 2726. [DOI] [PMC free article] [PubMed] [Google Scholar]
- (78).Rolfe MD, Rice CJ, Lucchini S, Pin C, Thompson A, Cameron ADS, Alston M, Stringer MF, Betts RP, Baranyi J, Peck MW, Hinton JCD, J. Bacteriol 2012, 194, 686–701. [DOI] [PMC free article] [PubMed] [Google Scholar]
Associated Data
This section collects any data citations, data availability statements, or supplementary materials included in this article.