Abstract
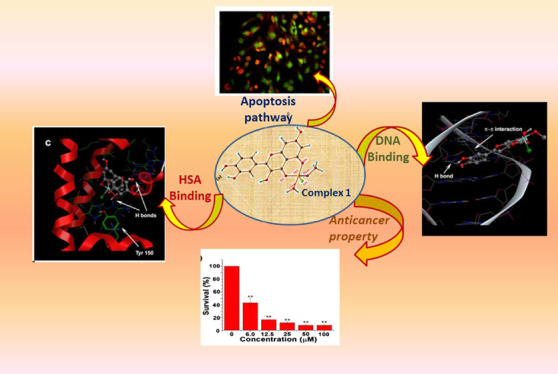
A new quercetin-based iron(III) cationic complex [Fe(Qr)Cl(H2O)(MeO)] (complex 1) is created in the current study by condensation of quercetin with ferric chloride in the presence of Et3N. Comprehensive spectroscopic analysis and conductometric measurement are used to pinpoint complex 1. The generated complex’s +3-oxidation state has been verified by electron paramagnetic resonance (EPR) research. Density functional theory analysis was used to structurally optimize the structure of complex 1. Before biomedical use, a variety of biophysical studies are implemented to evaluate the binding capacity of complex 1 with DNA and human serum albumin (HSA) protein. The findings of the electronic titration between complex 1 and DNA, as well as the stunning fall in the fluorescence intensities of the HSA and EtBr-DNA/DAPI-DNA domain after complex 1 is gradually added, give us confidence that complex 1 has a strong affinity for both macromolecules. It is interesting to note that the displacement experiment confirms partial intercalation as well as the groove binding mechanism of the title complex with DNA. The time-dependent fluorescence analysis indicates that after interaction with complex 1, HSA will exhibit static quenching. The thermodynamic parameter values in the HSA–complex 1 interaction provide evidence for the hydrophobicity-induced pathway leading to spontaneous protein–complex 1 interaction. The two macromolecules’ configurations are verified to be preserved when they are associated with complex 1, and this is done via circular dichroism spectral titration. The molecular docking investigation, which is a theoretical experiment, provides complete support for the experimental findings. The potential of the investigated complex to be an anticancer drug has been examined by employing the MTT assay technique, which is carried out on HeLa cancer cell lines and HEK-293 normal cell lines. The MTT assay results validate the ability of complex 1 to display significant anticancer properties. Finally, by using the AO/PI staining approach, the apoptotic-induced cell-killing mechanism as well as the detection of cell morphological changes has been confirmed.
Introduction
A subset of polyphenolic organic substances known as flavonoids is typically present in plants, everyday fruits and vegetables, tea, wine, and other beverages. The molecules of flavonoids typically consist of two aromatic rings and a heterocycle that contains oxygen. They are intriguing at the chemistry–biology interface because of their multiple functional bioactivities, which include antioxidant, anticancer, anti-inflammatory, antidiabetic, antiatherosclerotic, and antiapoptotic capabilities.1−4 The production of tiny molecules with the ability to kill cancer cells while being less hazardous to normal cells has recently gained enormous attention from the scientific community. Among cancer-preventive medications, flavonoids have received the most research attention. It is undeniably true that these substances can impede some particular stages of the carcinogenic process by reducing cell growth and inducing apoptosis in a variety of cancer cell types.5−9 The anticancer effects of flavonoids may be explained by their antioxidant capacity, which typically occurs via suppression of reactive oxygen species production.10−12 Apples, red grapes, onions, raspberries, honey, cherries, citrus fruits, and green leafy vegetables are all sources of the well-known flavonoid quercetin (3,3′,4′,5,7 pentahydroxyflavone), which has a well-established efficacy against cancer-related diseases via several targeted pathways.13−15 Chemists began to believe that a metal–organic complex might demonstrate efficient anticancer properties like other organic anticancer medication molecules after the successful development of cisplatin as an anticancer medicine. The widespread usage of this great medicine is somewhat constrained by the numerous negative effects of cisplatin. Therefore, several research teams have attempted to create several nonplatinum metal–quercetin complexes to assess their potential as a low-side-effect cancer treatment. The innermetallic complexes have generally been formed in the majority of situations. However, even though it is well established that a secondary anionic residue plays a significant role in the demonstration of effective anticancer property, no report has been found in which metal–quercetin complexes have been developed bearing secondary anionic residues to examine their anticancer properties.16−18 The metal complex’s anticancer property can be managed by carefully choosing the metal ion. Fe complexes occupy a prominent position among the many nonplatinum metal complexes. Fe is a component of every living thing, and enzymes containing Fe can catalyze several organic oxidation processes.19−22 Numerous teams of researchers produce neutral Fe(II)/Fe(III)–quercetin complexes to test their biological applications. However, no studies have been discovered in which a Fe(III) complex with a secondary anionic residue has been developed as a powerful anticancer drug. Additionally, it has been revealed that several iron complexes exhibit possible anticancer properties. Therefore, Fe complexes have drawn particular interest in the production of anticancer drugs.23,24 DNA has become the primary intracellular target for anticancer medications in current research on the generation of such therapies.25,26 In this instance, the drug molecule binds to DNA and then slows down DNA replication.27−29 On the other hand, the toxicity of anticancer drugs to normal cells is a common issue, and the development of drug delivery vehicles that can take the medication to the target area can lessen the side effect. Human serum albumin (HSA) protein is a well-known drug delivery transport30 that can transport drugs to their intended locations.31 As a result, drugs have fewer opportunities to come into contact with healthy cells, which reduces adverse effects.32,33
So before going to the inspection of the anticancer property of the metal complex, it is an urgent need to study the DNA/HSA binding efficacy of the metal complex.
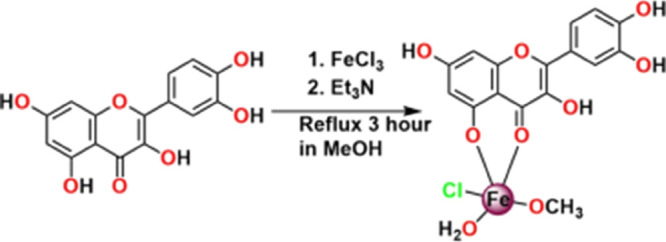
Taking into account every aspect of the study presented here, the creation of the cationic Fe(III) complex [Fe(Qr)Cl(H2O)(MeO)] (complex 1) has been described for the first time (Scheme 1). Spectroscopic analysis has been used to characterize the complex. While the density functional theory (DFT) analysis optimizes the complex’s structure, the EPR study confirms the metal’s oxidation state. After achieving its structural shape, complex 1 has been exposed to test its DNA/HSA binding efficiency using circular dichroism (CD), ultraviolet (UV), and fluorescence spectrum methods. All of the spectral research shows that compound 1 may efficiently interact with DNA via both partial intercalation and groove binding mode. It also exhibits effective HSA interaction potential through a hydrophobicity-induced mechanism. The potential anticancer property of the compound with low toxicity to normal cells has been then confirmed by using MTT assay techniques on one cancer cell line and one normal cell line. Finally, by using the staining technique, the apoptotic-induced cell death pathway of the investigated complex has been demonstrated.
Scheme 1. Synthesis of Complex 1.
Results and Discussion
Synthesis, Infrared (IR), UV, and Electrospray Ionization Mass Spectrometry (ESI-MS) Analysis of Complex 1
Complex 1 has been developed by the reaction of quercetin and FeCl3 in presence of Et3N. At the first step, the Fourier transform infrared (FT-IR) spectra of the quercetin and the complex are noted, leading to a prefatory idea regarding the existing bonds (Figure S1a,b in the Supporting Information file). Generally, the C=O stretching frequency of free quercetin is observed at 1663 cm–1, which is shifted to 1607 cm–1 during the complex 1 formation. The coordination of carbonyl oxygen with metal ions is confirmed by this shift.34−37 The bands at 1604 and 1251 cm–1 are shifted to 1584 and 1261 cm–1 which are assigned as C=C and C–O–C stretching frequencies, respectively. Furthermore, a Fe–O stretching vibration band at 646 cm–1 suggests the formation of a metal complex and this is absent in pure quercetin.
The UV–vis spectrum of the free quercetin and complex 1 in dimethyl sulfoxide (DMSO) is shown in Figure S2 (Supporting Information file). Quercetin exhibits two major absorption bands at 372 and 310 nm representing B-ring absorption (cinnamoyl system) and A-ring (benzoyl system).38 After complex formation, a significant blue shift alteration of the spectral position is observed. For complex 1, two new peaks appear at 305 nm (band IV) and 267 nm (band III). Interestingly, for complex 1, one additional peak arises at 430 nm, confirming the formation of complex 1.
The electrospray ionization mass spectra (positive mode, m/z up to 1200 amu) of the complex are recorded in methanolic solutions (Figure S3 in the Supporting Information file). Complex 1 exhibits one major peak at m/z = 240.9870 amu for the species [C16H15O9ClFeK]2+ (calculated m/z = 240.9735 amu). For complex 1, the isotopic model shows a good agreement with the experimental result.
EPR Study
The solid-state EPR spectrum for complex 1 has been recorded at room temperature to provide concrete proof behind the +3 oxidation of iron in complex 1, and the spectrum is pictographically represented in Figure S4 (in the Supporting Information file). The RT powder spectrum of complex 1 comprises a broad high spin (S = 5/2) resonance centered at g ∼ 5.15 and axial low spin signals at g = 2.19 and 1.96. From the EPR LS rhombic signal, one can say that in [Fe(Qr)Cl (H2O)(MeOH)]+, the unpaired electron resides in a HOMO of dxy character [i.e., t2g-configuration = (dyz) 2 (dxz) 2 (dxy) 1 for the FeIII ion].39
DFT Study
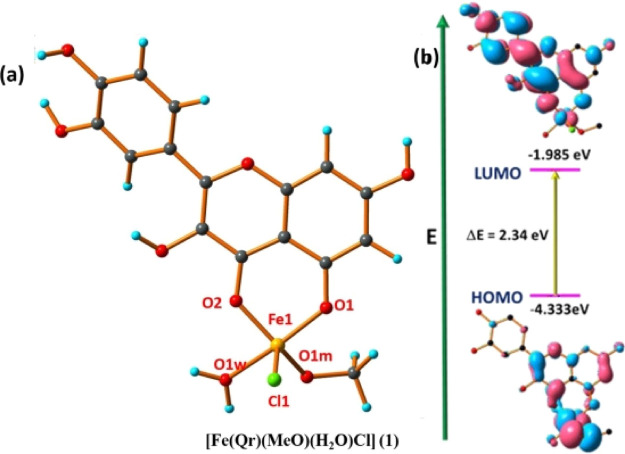
The optimized geometry of the studied Fe(III)–Qr complex (1) through DFT is shown in Figure 1a. The geometry optimization of Fe(III)–Qr (1) has been performed after the confirmation of composition as [Fe(Qr)(MeO)(H2O)Cl] (1), and this confirmation is done with the help of ESI-MS data.40 The theoretical geometry-related parameters of the complex are tabulated in Table S1. In the complex [Fe(Qr)(MeO)(H2O)Cl] (1) having metal center Fe3+, one mono-negatively charged (with an O2 donor system) Qr ligand, two solvent molecules, methanol and water, and one Cl– as a secondary anionic residue are coordinated with the metal center, satisfying the square pyramidal geometry (with Addison parameter τ = 0.31).41 The theoretical Fe–Cl bond and Fe–O bond lengths are measured to be 2.337 and 1.875–2.020 Å, respectively. Moreover, it is found that the HOMO–LUMO energy gap (Figure 1b) is ΔE = 2.34 eV for complex [Fe(Qr)(MeO)(H2O)Cl] (1) which is responsible for the stabilization of the studied complex.
Figure 1.
(a) Optimized geometry of complex 1 having molecular formula [Fe(Qr)(MeO)(H2O)Cl] (1). (b) Frontier molecular orbital with an energy difference of complex 1.
Theoretical Electronic Spectra
Complex 1 shows a well-recognized absorption band at 352 nm (Figure S2 in the Supporting Information file) in DMSO solvent at room temperature, the corresponding calculated absorption band is located at 365 nm which is in excellent agreement with the experimental result, and the frontier molecular orbitals involved in the absorbance of complex 1 in DMSO solution are presented in Figure S5.
DNA Binding Studies
After the structural configuration has been established, the biological impression of complex 1 has been carried out. It is vital to ensure the stability of the compound in working buffer media before analyzing biological implementation. For this reason, complex 1’s absorbance variation in the working buffer solution at pH 7.2 is measured as a function of the time change (days 1, 2, 3, 4, and 5). The stability of the complex in the buffer solution is indicated by Figure S6 (in the Supporting Information file), which shows a slight variation in the absorbance with respect to time. After stability checking in the working buffer solution, the DNA binding efficacy of complex 1 has been checked with the help of the following biophysical study.
UV Absorption Titration
In the initial step, UV metric titration is used to assess the DNA binding capability of complex 1. Here, Figure 2 shows how the steady addition of CT-DNA changed the absorbance of complex 1 at a specific concentration. Complex 1 exhibits absorption maxima at 300 nm and follows the addition of CT-DNA; these maxima are hypochromic. Equation 5 is used to calculate the value of the host–guest binding constant using the titration pictograph (Experimental Section). It has been determined that the binding constant is 3.4 × 10⁴ M–1. The high binding constant value and hypochromic character of the absorbance point to the developed complex’s capacity for DNA interaction.
Figure 2.
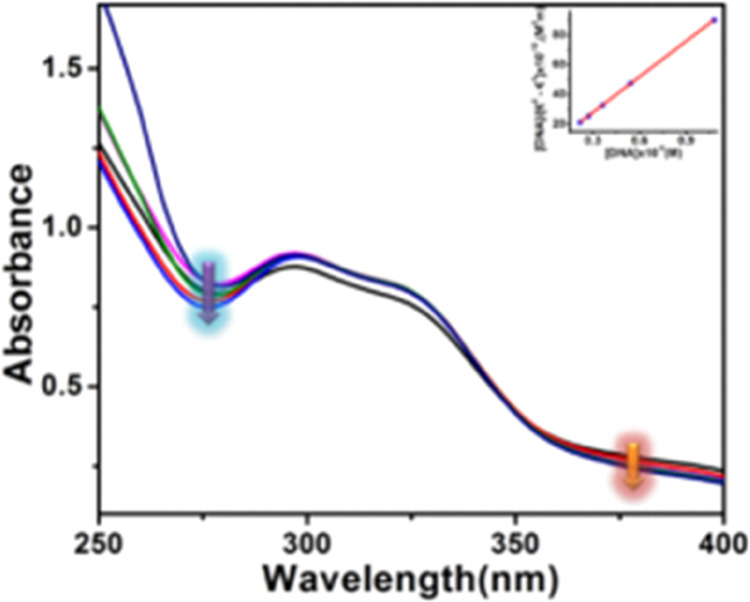
Change of absorption spectra of complex 1 (10 μM) after incremental addition (0 to 80 μM) of CT-DNA. Inset: Linear fitting to determine the binding constant.
Ethidium Bromide (EB) and 4′,6-Diamidino-2-phenylindole (DAPI) Displacement Study
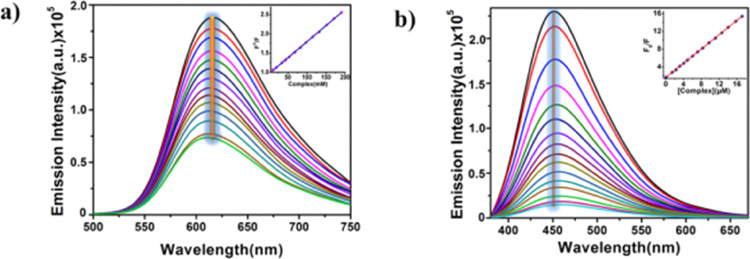
The next task will be to identify the binding mode of complex 1 with DNA after completing the electronic titration and binding constant determination. Ethidium bromide (EtBr)/DAPI displacement study is skillfully acceptable for this purpose. Since DNA does not naturally possess fluorescence properties, two separate potent fluorophores, EB and DAPI, are joined with DNA to form EtBr–DNA and DAPI–DNA adducts. In contrast to DAPI, which associates with DNA by group binding, EtBr has a planer shape and increases the fluorescence intensity of DNA up to twenty-fold after intercalative interaction with it.42,43 In the current study, a majestic reduction in fluorescence intensity has been seen after the incremental addition of complex 1 to the EtBr–DNA/DAPI–DNA adduct.
This observation is graphically depicted in Figure 3. This is because complex 1 causes a contending state between EtBr/DAPI and the investigated complex when it is added to the EtBr–DNA/DAPI–DNA adduct. Due to the reduced number of EtBr/DAPI association sites accessible as a result of the competition, EtBr–DNA/DAPI–DNA adduct fluorescence intensity is quenched. Using the Stern–Volmer equation,44 the quenching constant is calculated:
| 1 |
Here, F0 and F are the emission intensities in the absence and presence of the quencher and Kq is the quenching constant. The quenching constant values of complex 1 are found to be 2.2 × 10⁵ and 8.3 × 10⁵ M–1 for EtBr and DAPI displacement studies, respectively. According to the values of the quenching constant, the produced complex can associate with DNA through major group association and partial intercalation. The section on molecular docking explains the specifics of the fact.
Figure 3.
Fluorescence quenching of (a) EtBr–DNA and (b) DAPI–DNA adducts after gradual inclusion (5–80 μM) of complex 1. Inset: Stern–Volmer curve for quenching constant determination.
Protein Binding Study
HSA is abundantly present in blood plasma. It serves as a drug transporter, delivering medications to the intended place while reducing the likelihood of side effects. Therefore, the HSA binding study using complex 1 is performed following the completion of the DNA binding study.
UV Absorption Titration
At the beginning of a protein binding study, UV metric titration is used to assess complex 1’s ability to bind with HSA. Figure 4 shows the fluctuations in absorbance of complex 1 at a specific concentration following the addition of HSA gradually. HSA exhibits absorption maxima at 280 nm, which is caused by π–π* transition of aromatic amino acids tryptophan, tyrosine, and phenylalanine with the generation of a new band near 330 nm, and this newly generated peak may be arisen due to charge transfer spectra in the metal complex. The enhancement of the absorbance with the blue shift at 280 nm may be correlated with the hydrophobic interaction of the HSA with the studied complex. The change in the absorption spectra of bare HSA in the presence of complex 1 provides an indication regarding the formation of the HSA–complex 1 adduct. The creation of the ground-state complex with HSA is what causes the increase in absorbance. To avoid the inner filter effect, we have modified the spectra using the equation
| 2 |
where I stands for the corrected intensity and Iobs represents the observed background-subtracted fluorescence intensity. Aex and Aem correspond to the respective absorbance values measured at excitation and emission wavelengths, respectively.
Figure 4.
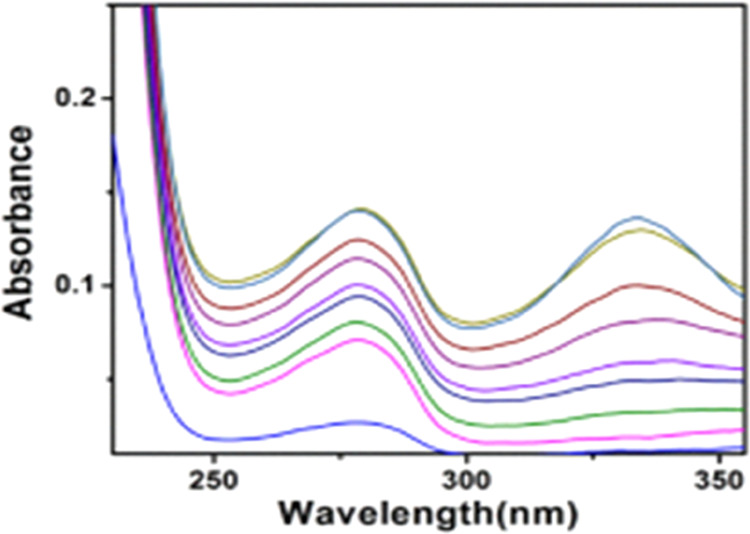
Change of absorbance 5 μM HSA with the increasing concentration of complex 1 at 298 K.
Steady-State Fluorescence Study
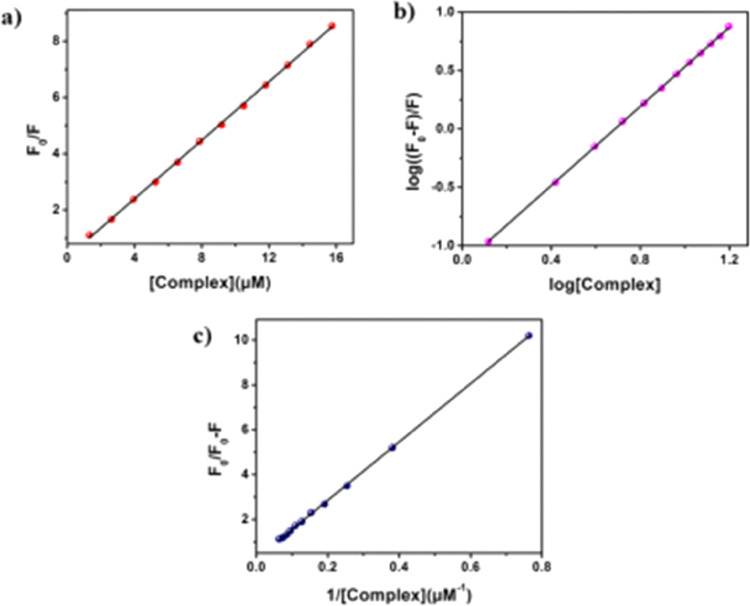
Tyrosine (Tyr) and tryptophan (Trp), two aromatic amino acids, are present in HSA, making it a very potent fluorescent protein.45 One of the most beneficial methods to assess the strength of a small molecule’s interaction with HSA is the fluorescence quenching study of HSA by small molecules. Here, the fluctuation in HSA’s fluorescence intensity is observed following the slow addition of complex 1 to a predetermined HSA concentration. After the continual addition of complex 1, Figure 5 clearly depicts a stunning drop in the fluorescence intensity of HSA at 340 nm. To comprehend the real quenching mechanism, we have applied Stern–Volmer eq 1. The binding constant has been determined using the double log plot (Figure 6b), and the nature of binding is clarified using the modified Stern–Volmer plot (Figure 6c).
Figure 5.
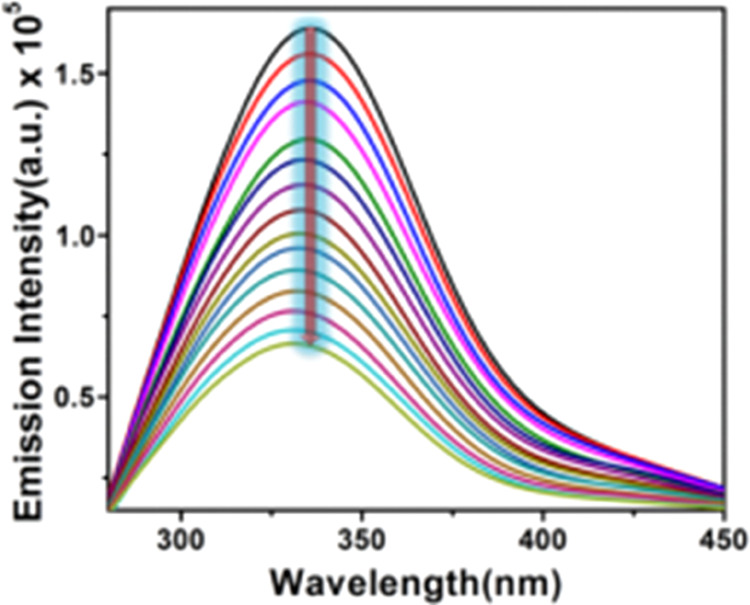
Fluorescence spectra of 5 μM HSA with increasing concentrations of the complex at 298 K as marked in the figure.
Figure 6.
(a) Stern–Volmer plot, (b) double-log plot, and (c) modified Stern–Volmer plot of HSA with varying concentrations of the complex at 298 K as marked in the figure.
According to eq 1, the F0/F vs [complex 1] plot is assumed to be linear, and as seen in Figure 6, we are receiving a linear plot, which supports the static quenching. Eqs 3 and 4 have been implemented the double-log plot (eq 3) and modified Stern–Volmer plot, respectively.
| 3 |
In the above equation, K stands for the binding constant of the complex with HSA and n denotes the number of binding sites.
| 4 |
Here, f is the fraction attainable for the protein fluorescence and KQ is the detectable quenching constant. Table 1 represents all the binding parameters. The Kq value is determined to be in an order of 1013, and this is higher (>1012) than the threshold Kq value which is a typical parameter for the bimolecular quenching process.45,46 During the drug–protein interaction study, if the process follows the diffusion control pathway by collision (dynamic quenching), then the threshold value should be in an order of 1010. Here, Kq is measured from the relation Kq = KQ/⟨τ0⟩.
Table 1. Binding Parameters of HSA–Complex 1 Interaction.
| sample | Kb (L mol–1) | Ksv (L mol–1) | Kq (L mol–1 s–1) | KQ (L mol–1) | n |
|---|---|---|---|---|---|
| complex 1 | 1.03 × 10⁴ | 1.01 × 10¹² | 2.12 × 10¹² | 1.21 × 10⁴ | 1.02 |
For the static quenching system as <τ0> is controlled by the excited-state property of both the fluorophore and the quencher, Kq should be higher than 1010. Here, the value of Kq is found to be higher than the maximum threshold value. This phenomenon suggests the static quenching nature of HSA during association with the studied complex.
Binding Site Number (n) of HSA with Complex 1
Executing Job’s plot, which is connected to the fluorescence emission spectral study, further supports the given n value (Figure S7 in the Supporting Information file). The plot shows that the two straight lines intersect at a molar fraction between 0.52 and 0.56, supporting the 1:1 (n = 1) binding stoichiometry between HSA and the studied complex during the interaction.
Thermodynamic Parameter Calculation of HSA Binding with Complex 1
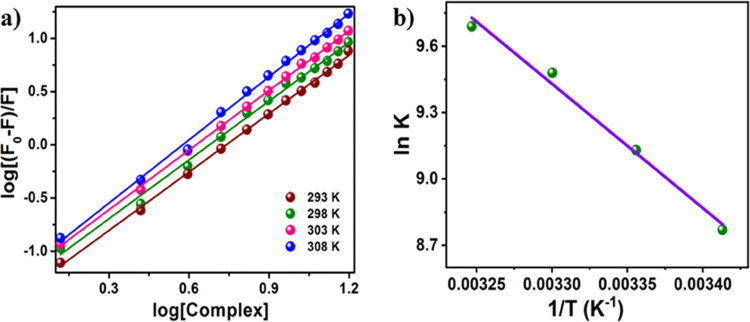
Enthalpy and entropy values, two thermodynamic characteristics, offer reliable cues about how well HSA and complex 1 interact. All the thermodynamic parameters for the complex 1–HSA interaction have been calculated in the current work utilizing van’t Hoff’s equation at four different temperatures (293, 298, 303, and 308 K). It has been previously detailed how the emission spectrum of HSA changes with the incremental concentration of complex 1 and how binding constants (Kb) are measured at 298 K. Figure 7a,b also shows the other three double-log plots at 293, 303, and 308 K in addition to 298 K. Table 2 provides the Kb, log Kb, and n values (number of binding sites per HSA) for these four temperatures. Generally, the values of small enthalpy and positive entropy changes signify the electrostatic interactions, whereas for hydrophobic interactions positive enthalpy and entropy bear a positive signal. On the contrary, generally, the hydrogen bonding and van der Waals interactions are specified by negative enthalpies.47,48 In the present study, the values of ΔH and ΔS for complex 1–HSA interaction are measured to be 30.18 KJ mol–1 and 147.83 J mol–1 K–1, respectively (ΔH > 0 and ΔS > 0), suggesting the hydrophobic interaction among the investigated complex and macromolecule [50].
Figure 7.
(a) Double logarithm plots of the interaction between HSA and the complex at different temperatures as marked in the figure. (b) van’t Hoff plot of HSA interacting with the complex.
Table 2. Binding Parameters of HSA and Complex Interaction at Different Temperatures.
| temperature (K) | Kb value | ln Kb | value n | ΔG(kJ mol–1) |
|---|---|---|---|---|
| 293 | 0.62 × 10⁴ | 8.73 | 1.077 | –21.13 |
| 298 | 1.03 × 10⁴ | 9.23 | 1.132 | –22.76 |
| 303 | 1.32 × 10⁴ | 9.48 | 1.021 | –23.80 |
| 308 | 1.56 × 10⁴ | 9.65 | 1.002 | –24.72 |
Additionally, the −ve free energy change given in Table 2 also authenticates the spontaneous interaction among protein and the studied complex. In the present case, the value of binding parameters like the ΔH and ΔS values during HSA and complex 1 interaction is measured to be 30.18 kJ mol–1 and 176.34 J mol–1 K–1, respectively. The positive values of ΔH and ΔS (ΔH > 0 and ΔS > 0) are a quite natural phenomenon if the studied complex–HSA interaction is hydrophobic in nature49 instead of van der Waals or hydrogen bonding. At the same time, the −ve free energy value is an indication of spontaneous interaction among the studied complex and HSA.
Time-Dependent Fluorescence Study
At 298 °C in CP buffer media, a time-dependent fluorescence decay assessment study is conducted to unveil the fluorescence quenching mechanism of HSA after the inclusion of complex 1. Here, the lifetime decay of HSA is estimated and after the addition of different concentrations of complex 1, the lifetime is also documented via a concentration-dependent track (Figure 8). The fluorescence decay parameters for complex 1 are summarized in Table S2.
Figure 8.
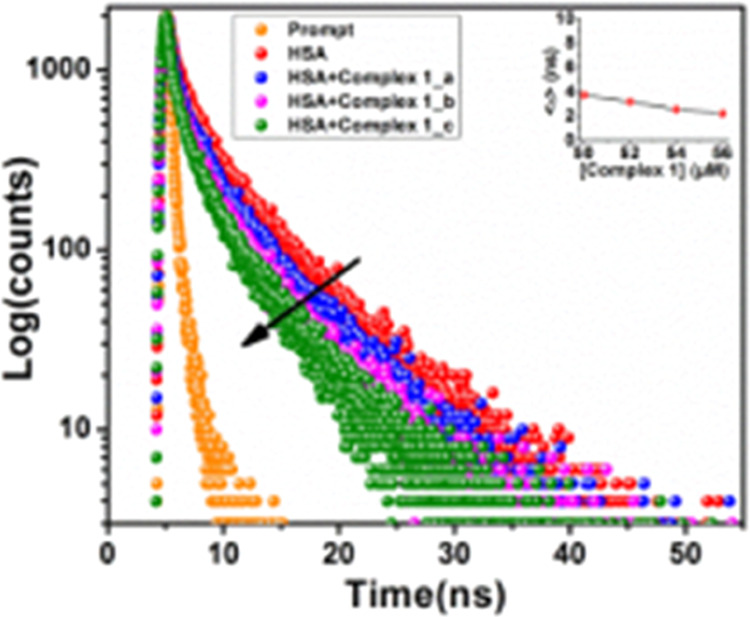
Time-resolved fluorescence measurement HSA (5 μM) in the absence and presence of complex 1 via a concentration-dependent pathway.
The findings show the bi-exponential degradation of both the HSA and HSA–complex 1 adducts. The time constants for using the standard method are listed. The calculated value of the HSA time constant is 3.74 ns, and with the addition of complex 1, there is hardly any lifetime reduction, pointing to the static quenching pathway of the HAS during interaction with the investigated complex. The χ2 value of complex 1 is competently fitted in the allowable range.
Circular Dichroism Study
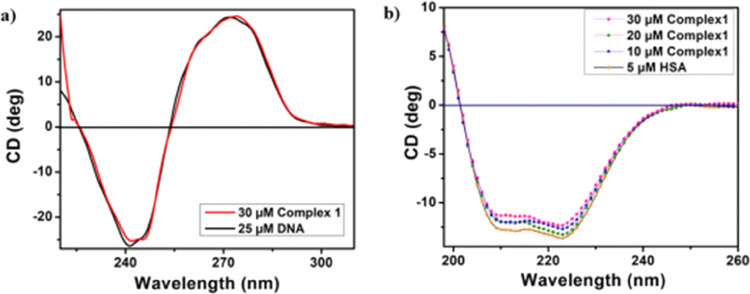
A CD study is an effective approach for learning about any structural changes that occur in a macromolecule when it interacts with a tiny molecule. Figure 9a shows the variance of CD spectral variations of bare DNA in the absence and presence of complex 1. The image clearly demonstrates that the CD of free DNA exhibits one positive lobe at 278 nm and one negative lobe at 248 nm, supporting the presence of the b form of DNA.50 The character of the spectrum is more or less unchanged when complex 1 is added to free DNA, indicating that the conformation of DNA remains preserved throughout complex 1’s binding to it. When complex 1 is associated with protein, whether any organizational alteration has occurred or not, CD spectral titration study furnishes such manifestation. To serve this purpose, the CD spectrum of HSA is recorded in the presence and absence of the title complex.
Figure 9.
CD spectral change of (a) CT-DNA and (b) HSA in the presence and absence of complex 1.
For the spectra of CD of free HSA, two negative peaks51,52 are seen at 209 and 220 nm, respectively, suggesting that HSA has an α-helical structure. The sole change to the CD spectrum following the addition of complex 1 to HSA is in the band potency. The titration study has been examined using CD Pro software. The shape of the curve remains the same both before and after the complex has been introduced. From this observation, one can conclude that after the association of complex 1 with HSA, the α-helical structure of HSA remains dominant.
Molecular Docking Study
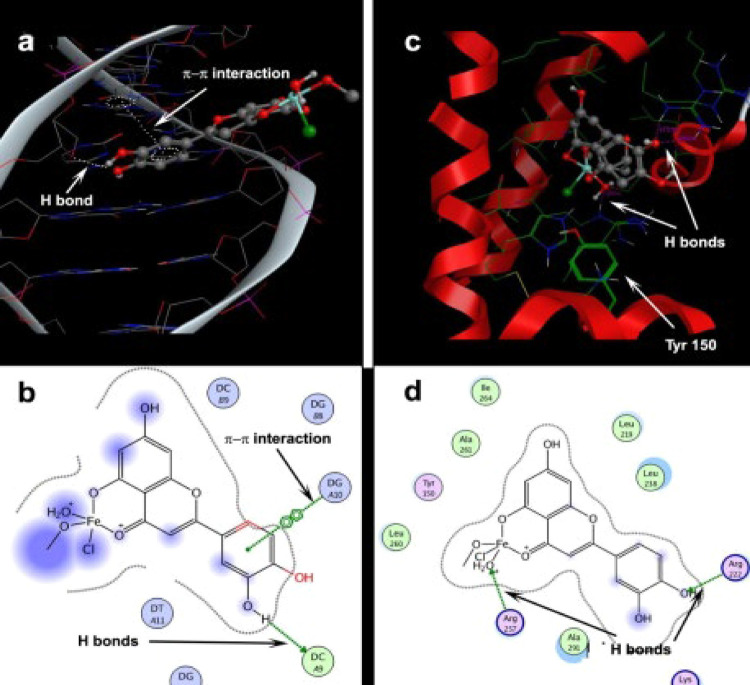
From the docking study, it is revealed that the metal complex approaches the major groove of DNA and the catechol ring of the ligand partially intercalates into the DNA base pairs (Figure 10a).
Figure 10.
Molecular docking of complex 1 with DNA (a,b) and HSA (c,d).
The hydrophilic metal center of the complex is exposed to the solvent. The formation of hydrogen bonds with a phenolic group of the metal complex and the formation of π–π stacking between aromatic rings of the ligand and DNA bases stabilize the DNA–complex 1 adduct (Figure 10a,b). The spacing between the base pairs increased from 3.6 to 4.86 Å due to intercalation (Figure 10a). The binding free energy during complexation is measured to be −31.62 kJ mol–1.
The docking study also shows that the metal complex completely engulfs the binding pocket of HSA (Figure 10c). Here also the phenolic groups form hydrogen bonds (Figure 10d). The distance between the bounded metal complex and Tyrosine 150 residue is 4.77 Å. The energy transfer from Tyrosine 150 amino acid to the iron metal complex is responsible for fluorescence quenching. The binding free energy during binding is calculated to be −14.74 kJ mol–1.
The hydrophobic interaction between the ligand and macromolecule plays a significant role during binding. The value of ΔGhyd can be calculated as ΔGhyd = – (22 ± 5) ΔSASA51 (where ΔSASA is changed in solvent-accessible surface area).
The obtained ΔSASA values which arise due to the association of the title complex with DNA and HSA are 477 and 727 Å2, respectively. These values correspond to ΔGhyd values of −44.05 ± 2.38 and −67.20 ± 3.60 kJ mol–1, respectively. This study clearly indicates that the hydrophobic interaction plays a significant role during complex–macromolecule binding.
In Vitro Cytotoxicity Assay
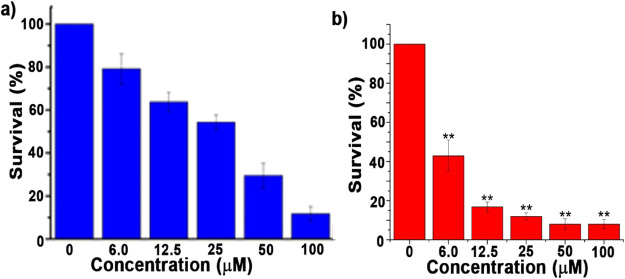
The last section does a good job of discussing the possibility of interaction between complex 1 and the CT-DNA/HSA protein. Finally, the MTT assay research is used to perform the cytotoxicity experiment on the HEK 293 normal cell line and the HeLa cancer cell line in a dose- and time-dependent manner. The results for cell viability are summarized in Figure 11.
Figure 11.
Cell viability of the HeLa cell line after incubation with complex 1 via dose-dependent manner for (a) 24 h and (b) 48 h [** indicating p < 0.001].
Initially, the toxicity of complex 1 was tested in a wide range of doses (0–100 μM, Figure 11a). Based on the primary data, we further tested the toxicity of complex 1. The LD50 value at 24 h is found to be quite high (28.46 ± 1.26 μM), so we increased the incubation time, with lower doses (0–20 μM, Figure 11b). The mortality rate at all doses was found to be significant in comparison to untreated cells (i.e., control cells) (Supplementary Table S3), and the LD50 value after 48 h of treatment for HeLa cells was estimated to be 3.86 ± 0.57 μM. The LD50 values for complex 1 (recaptured in Table 3) provide a strong indication of the compound’s potent antiproliferative ability and low toxicity to normal cells, which is supported by the compound’s high IC50 value. The LD50 value after 48 h of cell incubation is quite impressive, confirming complex 1’s potency as an anticancer drug. Cisplatin has been employed as a positive control against the HeLa cell line (LD50 = 17.66) throughout the entire MTT assay.
Table 3. LD50 Value of Complex 1.
| cell line | LD50_24 h (mean ± SD, n = 3) | LD50_48 h (mean ± SD, n = 3) |
|---|---|---|
| HeLa | 28.46 ± 1.26 | 3.86 ± 0.57 |
| HEK-293 | 66.43 ± 2.34 | |
| FeCl3 | >100 |
Unveiling the Cancer Cell Death Mechanism
Finally, we used the nuclear staining technique by utilizing several dyes to reveal the cause of cell death and to provide insight into the morphological changes within the cell.
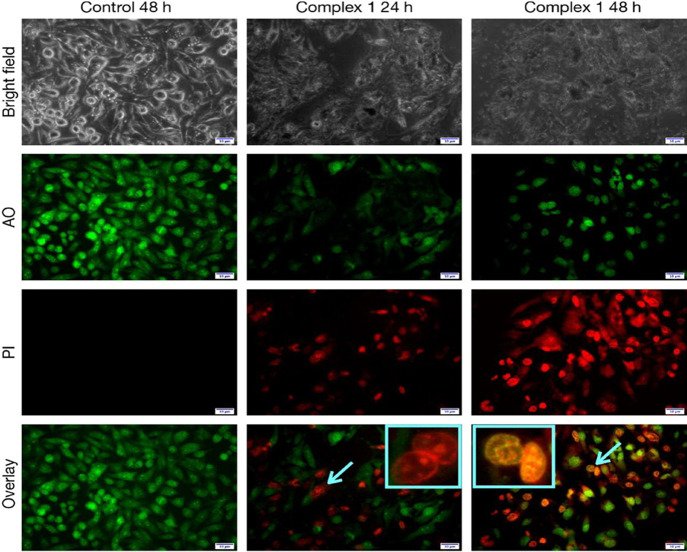
In this study, cells are first exposed to complex 1 (25 μM) for 24 and 48 h and stained with AO/PI to examine changes in the cellular morphology. Figure 12 shows the HeLa cells’ nucleus morphological alterations. AO can center both live and dead cells, and stained DNA results in green fluorescence. PI can only enter in death cells, as the integrity of the cell membranes is lost after the cell death. The untreated cells exhibit uniform green fluorescence, which indicates that the integrity of the nucleus and cell membranes is intact. After treatment with complex 1, at 24 h, around 40% of cells exhibit red fluorescence, and hence, cell death occurs and membrane integrity is lost. With increasing time, more cells turned red (around 85%), indicating an increase in cell death. After 48 h of treatment, the bright yellow-green fluorescence indicated disorganized nuclei of death cells.52−54
Figure 12.
HeLa cells stained with AO/PI after treatment with complex 1 for 24 and 48 h.
Conclusions
One quercetin-based iron(III) complex [Fe(Qr)Cl (H2O)(MeO)] (complex 1) is developed in the current work by a straightforward condensation reaction between quercetin and ferric chloride in the presence of Et3N. Complex 1 has been structurally determined with the aid of numerous spectroscopic studies. The +3-oxidation state of the metal center has been confirmed by the EPR analysis, making this the first 1:1 ligand–metal Fe(III) complex to be reported. It also has a secondary anionic residue. Complex 1 has undergone a DFT analysis for structural optimization. Complex 1 has been utilized to inspect the DNA and HSA binding effectiveness after structural identification as a prelude to biomedical use. Several biophysical experiments, including electronic titration, EtBr/DAPI displacement tests, steady-state fluorescence study, CD titration, and others, have been carried out to properly serve this aim. Anyone can conclude from studying the findings of these investigations that complex 1 has a very high likelihood of associating with both macromolecules. The displacement assay investigation offers substantial support for the complex’s groove binding and partial intercalation properties. The fluorescence lifetime measuring investigation also supports the HSA’s static quenching nature upon connection with the title complex. By calculating the thermodynamic parameters, the hydrophobic nature of the interaction between the investigated complex and HSA is confirmed. The findings obtained from CD spectral titration unveil that following engagement with the complex, both the macromolecules do not face any secondary conformational changes. After determining the effectiveness of DNA/HSA binding, the anticancer property of complex 1 has been evaluated using the MTT assay technique in a time- and dose-dependent way. The LD50 values confirm the developed complex’s strong anticancer ability and low toxicity toward normal cells. Finally, nuclear staining analysis has demonstrated the apoptotic-triggered cancer cell death pathway of the title complex.
Experimental Section
Materials and Methods
All the reagents and solvents used in this synthesis were commercially obtainable and utilized without further purification. CT-DNA, HSA, DAPI, and EB have been procured from Sigma Aldrich Chemicals. Ferric chloride (FeCl3) and Et3N were purchased from Merck. The total interaction studies among the macromolecules and complexes were carried out in a citrate–phosphate (CP) buffer of 10 mM [Na+] at pH 7.4 containing 0.5 mM Na2HPO4. An elemental analysis (C, H, and N) experiment was performed by using a Perkin Elmer 240011 elemental analyzer. To collect the FT-IR data, ATR mode Bruker Tensor-27 was used. Electronic absorption spectral data were gathered with the help of the Perkin Elmer UV–vis Lambda 365 spectrophotometer, and the total fluorometric experiments were executed with the help of the Parkin Elmer fluorescence spectrometer FL6500.
Synthetic Procedures
Synthesis of Complex 1
For the synthesis of complex 1, a methanolic solution of FeCl3·6H2O (0.27 gm, 1 mmol) was added in situ to the methanolic solution of quercetin (0.30 gm, 1 mmol) under reflux conditions with continuous stirring followed by addition of Et3N for 3 h. The chocolate brown color ppt appeared during the complex 1 formation. After that, the solution was allowed to be settled at room temperature and filtered. The ppt was collected and dried for further studies.
Yield: 0.35 gm (80%), C16H14ClFeO9 (441.57) calculated: (C, 43.43; H, 3.17) found: (C, 43.40; H, 3.15).
Theoretical Calculation Method
Ground-state electronic structure calculations in the gas phase of the ligand and complex have been carried out using a DFT55 method associated with the conductor-like polarizable continuum model.55 Becke’s hybrid function56 with the Lee–Yang–Parr correlation function57 was used for the study. The absorbance spectral properties in the DMSO medium for complex 1 were calculated by time-dependent density functional theory, associated with the conductor-like polarizable continuum model and we computed the lowest 40 singlet–singlet transition.
For H atoms, we used the 6-31+(g) basis set; for C, N, O, and Fe atoms, we employed LanL2DZ as the basis set for all the calculations. The calculated electron-density plots for frontier molecular orbitals were prepared by using Gauss View 5.1 software. All the calculations were performed with the Gaussian 09 W software package.58 The Gauss Sum 2.1 program59 was used to calculate the molecular orbital contributions from groups or atoms.
DNA/Protein Interaction Studies
The DNA and HSA stock solution were prepared by dilution of CT-DNA in a CP buffer of 10 mM Na+ containing 0.5 mM Na2HPO4. The DNA concentration was estimated spectro-photometrically by using a molar extinction coefficient (ε) of 6600 M–1 cm–1, and during concentration deduction, no deviation from Beer’s law was noticed. At the same time, by utilizing a molar extinction coefficient (ε) of 37,500 M–1 cm–1, a fixed concentration of HSA was prepared. The following biophysical experiments were carried out to check the binding efficacy of DNA/protein with complex 1.
Absorption Spectral Titrations
In the case of electronic absorption spectral titration, the binding constant (K) for the association of the complex with CT-DNA was calculated with the help of eq 5.17
| 5 |
where [DNA] represents the concentration of CT-DNA in the base pairs, “εa” stands for the apparent absorption coefficient corresponding to Aobs/[complex 1], “εf” is the extinction coefficient of the free complex, and “εb” represents the extinction coefficient of the complex fully bonded with CT-DNA. From the plot of [DNA]/(εa – εf) vs [DNA], the intrinsic binding constant “K” can be determined by the ratio of the slope to intercept.
Steady-State Fluorescence Study and Displacement Assay
In this study, the variation of the fluorescence intensities was recognized after the gradual addition of complex 1 solution step by step into the CT-DNA–EtBr/CT-DNA–DAPI domain. HSA is a highly fluorescence active protein, the fluorescence titration phenomena of HSA were recorded within 260–450 nm upon excitation at 250 nm, the micromolar (μM) amount of stock solutions of each was added continuously into the HSA solution, and fluorescence intensity changes were documented.
Circular Dichroism (CD) Spectral Study
For the CD spectral study, a Jasco J1500 model unit (Jasco International Co. Ltd. Hachioji, Japan) was used. In CD spectral titration after the addition of increasing concentrations of the studied complex to a fixed concentration of CT-DNA (30 μM), the alteration of the CD spectrum of free DNA/HSA was recorded. With the help of the equation [θ] = 100 × θ/(C × l), the molar ellipticity values [θ] were calculated where “θ” is the measured ellipticity in milli degrees, “C” denotes the concentration in mol/L, and “l” represents the cell path length of the cuvette in cm. The molar ellipticity [θ] (deg.cm2/dmol) values are represented in terms of base pairs within the region of 200–400 nm.60,61
Molecular Modeling Studies for DNA Binding and HSA Protein Interaction
For the molecular modeling study, a DNA crystal (6elb.pdb) and HSA–warfarin complex were downloaded (2bxd.pdb) from pdb. The probable binding sites in each macromolecule were identified using a site finder. The ligand (quercetin) was placed in sites, and MD simulation upto100 picosecond (interval of 0.5 ps) at 300 K was run to get the most stable complex (lowest energy).62,63 The binding score with the lowest root means square deviation was taken as the free energy of binding.
In Vitro Cytotoxicity Assay
The anticancer activity of complex 1 on the human cervical carcinoma cell line (HeLa) along with the HEK 293 normal cell line was checked by using the traditional MTT assay technique. Cells were seeded at a density of 2 × 10⁵ cells/well in a 24-well plate. After 24 h of cell seeding, cells were exposed to the studied complex at different concentrations for 24 h. After incubation, cells were washed with 1 X phosphate buffered saline (PBS) twice. Then, they were treated with 0.5 mg/mL MTT solution (SRL) and again incubated for 3–4 h at 37 °C until a purple-colored formazan product developed. The resulting product was dissolved in DMSO, and OD was calculated at 570 nm using a microplate reader (Bio-Rad). With the help of the following formula, the rate of survival was determined.64,65
where ODAT = Absorbency of control cells and ODAC = Absorbency of treated cells.
Acridine Orange (AO) and Propidium Iodide (PI) Dual Staining
HeLa cells were plated at a density of 5 × 10⁴ cells/well in 24-well plates with an overnight incubation at 37 °C in a CO2 incubator. Cells were treated with the desired concentration of developed complexes after 4 h of serum starvation and then incubated at 37 °C for 24 and 48 h. After incubation, the culture medium was aspirated, and cells were twice washed with 1X PBS. Then, the cells were stained with equal volumes (25 μM, AO–PI 1:1) of AO and PI. The stained cells were kept in dark for 30 min. The cells were washed once with 1 X PBS, and the microscopic fluorescence images were taken.66,67
Acknowledgments
The corresponding author Dr. Tithi Maity is grateful to the authority of Prabhat Kumar College, Contai, for their continuous inspiration during the whole period of the work. Dr. Maity highly acknowledges Science and Technology Biotechnology, Government of West Bengal for their financial support through the Gabesanay bangle Scheme. Dr. Maity is also thankful to DST FIST for their financial support to P. K. College, Contai. The author also exhibits her recognition to Prof. Debasis Das Department of Chemistry, the University of Calcutta for their precious advice and ideas.
Data Availability Statement
Data openly available in a public repository that issues datasets with DOIs.
Supporting Information Available
The Supporting Information is available free of charge at https://pubs.acs.org/doi/10.1021/acsomega.2c05790.
FT-IR, UV–vis spectra, mass spectrum, theoretical calculations, selected bond angle and bond-length tables and other parameters for complex 1, lifetime measurement parameter table, and statistical analysis of cell study (PDF)
The authors declare no competing financial interest.
Supplementary Material
References
- Middleton E.; Chithan K.; Theoharides The effects of plant flavonoids on mammalian cells: implications for inflammation, heart disease, and cancer. Pharmacol. Rev 2000, 52, 673–751. [PubMed] [Google Scholar]
- Haslam E. J. Natural polyphenols (vegetable tannins) as drugs: possible modes of action. J. Nat. Prod. 1996, 59, 205–215. 10.1021/np960040+. [DOI] [PubMed] [Google Scholar]
- Harborne J. B.; Williams C. A. Advances in flavonoid research since 1992. Photochemistry 2001, 55, 481–504. 10.1016/s0031-9422(00)00235-1. [DOI] [PubMed] [Google Scholar]
- Hollrnan P. C. H.; Hertog M. G. L.; Katan M. B. Dietary flavonoids: intake, health effects and bioavailability. Food Chem. Toxicol. 1999, 37, 937–942. 10.1016/S0278-6915(99)00079-4. [DOI] [PubMed] [Google Scholar]
- Yamaguchi M.; Murata T.; El-Rayes B. F.; Shoji M. The flavonoid p-hydroxycinnamic acid exhibits anticancer effects in human pancreatic cancer MIA PaCa-2 cells in vitro: Comparison with gemcitabine. Oncol. Rep. 2015, 34, 3304–3310. 10.3892/or.2015.4282. [DOI] [PubMed] [Google Scholar]
- Cárdenas M.; Marder M.; Blank V. C.; Roguin L. P. Antitumor activity of some natural flavonoids and synthetic derivatives on various human and murine cancer cell lines. Bioorg. Med. Chem. 2006, 14, 2966–2971. 10.1016/j.bmc.2005.12.021. [DOI] [PubMed] [Google Scholar]
- Chan F. L.; Choi H. L.; Chen Z. Y.; Chan P. S.; Huang Y. Induction of apoptosis in prostate cancer cell lines by a flavonoid, baicalin. Cancer Lett. 2000, 160, 219–228. 10.1016/S0304-3835(00)00591-7. [DOI] [PubMed] [Google Scholar]
- Kawaii S.; Tomono Y.; Katase E.; Ogawa K.; Yano M. Antiproliferative Activity of Flavonoids on Several Cancer Cell Lines. Biosci., Biotechnol., Biochem. 1999, 63, 896–899. 10.1271/bbb.63.896. [DOI] [PubMed] [Google Scholar]
- Rosa M. D.; Pace U.; Rega D.; Costabile V.; Duraturo F.; Izzo P.; Delrio P. Genetics, diagnosis and management of colorectal cancer (Review). Oncol. Rep. 2015, 34, 1087–1096. 10.3892/or.2015.4108. [DOI] [PMC free article] [PubMed] [Google Scholar]
- Leung H. G.; Kuo C. L.; Yang W. H.; Lin C. H.; Lee H. Z. Antioxidant enzyme activity involvement in luteolin-induced human lung squamous carcinoma CH27 cell apoptosis. Eur. J. Pharmacol. 2006, 534, 12–18. 10.1016/j.ejphar.2006.01.021. [DOI] [PubMed] [Google Scholar]
- Wu T. H.; Yen F. L.; Lin L. T.; Tsai T. R.; Lin C. C.; Cham T. M. Reparation. Preparation, physicochemical characterization, and antioxidant effects of quercetin nanoparticles. Int. J. Pharm. 2008, 346, 160–168. 10.1016/j.ijpharm.2007.06.036. [DOI] [PubMed] [Google Scholar]
- Erlund I. Review of the flavonoids quercetin, hesperetin, and naringenin. Dietary Sources, bioactivities, Bioavailability and epidemiology. Nutr. Res. 2004, 24, 851–874. 10.1016/j.nutres.2004.07.005. [DOI] [Google Scholar]
- Jakubowicz Gil J.; Paduch R.; Piersiak T.; Głowniak T.; Gawron A.; Kandefer Szerszeń M. The effect of quercetin on pro-apoptotic activity of cisplatin, on HeLa cell. Biochem. Pharmacol. 2005, 69, 1343–1350. 10.1016/j.bcp.2005.01.022. [DOI] [PubMed] [Google Scholar]
- Ramos S. J. Effects of dietary flavonoids on apoptotic pathways related to cancer chemoprevention. J. Nutr. Biochem. 2007, 18, 427–442. 10.1016/j.jnutbio.2006.11.004. [DOI] [PubMed] [Google Scholar]
- Das M.; Mukherjee S.; Islam M. M.; Chodhuri I.; Bhattacharya N.; Samanta B. C.; Dutta B.; Maity T. Response of Ancillary Azide Ligand in Designing a 1D Copper(II) Polymeric Complex along with the Introduction of High DNA- and HSA-Binding Efficacy, Leading to Impressive Anticancer Activity: A Compact Experimental and Theoretical Approach. ACS Omega 2022, 27, 23276–23288. 10.1021/acsomega.2c01403. [DOI] [PMC free article] [PubMed] [Google Scholar]
- Satapathi D.; Das M.; Rajak K.; Laha S.; Islam M. M.; Choudhuri I.; Bhattacharya N.; Das S.; Samanta B. C. Development of DNA intercalative, HSA binder pyridine-based novel Schiff base Cu(II), Ni(II) complexes with effective anticancer property: A combined experimental and theoretical approach. T. Appl. Organomet. Chem. 2022, 36, e6473 10.1002/aoc.6473. [DOI] [Google Scholar]
- Das M.; Mukherjee S.; Koley B.; Choudhuri I.; Bhattacharyya N.; Roy P.; Samanta B. C.; Barai M.; Maity T. Developing novel zinc (ii) and copper (ii) Schiff base complexes: combined experimental and theoretical investigation on their DNA/protein binding efficacy and anticancer activity. New J. Chem. 2020, 44, 18347–18361. 10.1039/D0NJ03844J. [DOI] [Google Scholar]
- Bruijnincx P. C.; Sadler P. J. New trends for metal complexes with anticancer activity. Curr. Opin. Chem. Biol. 2008, 12, 197–206. 10.1016/j.cbpa.2007.11.013. [DOI] [PMC free article] [PubMed] [Google Scholar]
- Tse C.; Chow T. W. S.; Guo Z.; Lee H. K.; Huang J. S.; Che C. M.; et al. Nonheme iron mediated oxidation of light alkanes with oxone: characterization of reactive oxoiron (IV) ligand cation radical intermediates by spectroscopic studies and DFT calculations. Angew. Chem., Int. Ed. 2014, 53, 798–803. 10.1002/anie.201305153. [DOI] [PubMed] [Google Scholar]
- Nam W.; Lee Y. M.; Fukuzumi S. Tuning Reactivity and Mechanism in Oxidation Reactions by Mononuclear Nonheme Iron (IV)-Oxo Complexes. Acc. Chem. Res. 2014, 47, 1146–1154. 10.1021/ar400258p. [DOI] [PubMed] [Google Scholar]
- Chen J.; Stubbe J. A. Stubbe, Bleomycins: towards better therapeutics. Nat. Rev. Cancer 2005, 5, 102–112. 10.1038/nrc1547. [DOI] [PubMed] [Google Scholar]
- Kwong W. L.; Lok C. N.; Tse C. W.; Wong E. L. M.; Che C. M. Anti-Cancer Iron (II) Complexes of Pentadentate N-Donor Ligands: Cytotoxicity, Transcriptomics Analyses, and Mechanisms of Action. Chem. – Eur. J. 2015, 21, 3062–3072. 10.1002/chem.201404749. [DOI] [PubMed] [Google Scholar]
- Rechardson D. R.; Kalinowski D. S.; Rechardson V.; Sharpe P. C.; Lovejoy D. V.; Islam M.; Bernhardt P. V. 2-Acetylpyridine Thiosemicarbazones are Potent Iron Chelators and Antiproliferative Agents: Redox Activity, Iron Complexation and Characterization of their Antitumor Activity. J. Med. Chem. 2009, 52, 1459–1470. 10.1021/jm801585u. [DOI] [PubMed] [Google Scholar]
- Bal-Demirci T.; Congur G.; Erdem A.; Erdem-Kuruca S.; Özdemir N.; Akgün-Dar K.; Varol B.; Ülküseven B. Iron(iii) and nickel(ii) complexes as potential anticancer agents: synthesis, physicochemical and structural properties, cytotoxic activity and DNA interactions. New J. Chem. 2015, 39, 5643–5653. 10.1039/C5NJ00594A. [DOI] [Google Scholar]
- Fousiamol M. M.; Sithambaresan M.; Damodaran K. K.; Prathapachandra Kurup M. R. Syntheses, spectral aspects and biological studies of bromide and azide bridged box dimer copper (ii) complexes of an NNO donor aroylhydrazone. Inorg. Chim. Acta 2020, 501, 119301 10.1016/j.ica.2019.119301. [DOI] [Google Scholar]
- Pages B. J.; Ang D. L.; Wright E. P.; Aldrich-Wright J. R. Metal complex interactions with DNA. Dalton Trans. 2015, 44, 3505–3526. 10.1039/C4DT02700K. [DOI] [PubMed] [Google Scholar]
- Komor A. C.; Barton B. K. The path for metal complexes to a DNA target. Chem. Commun. 2013, 49, 3617–3630. 10.1039/c3cc00177f. [DOI] [PMC free article] [PubMed] [Google Scholar]
- Zuber G.; Quada J. C.; Hecht S. M. Sequence selective cleavage of a DNA octanucleotide by chlorinated bithiazoles and bleomycins. J. Am. Chem. Soc. 1998, 120, 9368–9369. 10.1021/ja981937r. [DOI] [Google Scholar]
- Zhou C. Y.; Zhao J.; Wu Y.; Yin C. X.; Yang P. Synthesis, characterization and studies on DNA-binding of a new Cu(II) complex with N1,N8-bis(l-methyl-4-nitropyrrole-2-carbonyl)triethylenetetramine. J. Inorg. Biochem. 2007, 101, 10–18. 10.1016/j.jinorgbio.2006.07.011. [DOI] [PubMed] [Google Scholar]
- Shahabadi N.; Fili S. M.; Kashanian S. Human serum albumin interaction studies of a new copper (II) complex containing ceftobiprole drug using molecular modeling and multispectroscopic methods. J. Coord. Chem. 2017, 72, 329–341. 10.1080/00958972.2018.1428801. [DOI] [Google Scholar]
- Sharfalddin A. A.; Emwas A.; Jaremko M.; Hussien M. A. Synthesis and theoretical calculations of metal-antibiotic chelation with thiamphenicol: in vitro DNA and HSA binding, molecular docking, and cytotoxicity studies. New J. Chem. 2021, 45, 9598–9613. 10.1039/D1NJ00293G. [DOI] [Google Scholar]
- Banerjee A.; Mohanty M.; Lima S.; Samanta R.; Garribba E.; Sasamori T.; Dinda R. Synthesis, structure and characterization of new dithiocarbazate-based mixed ligand oxidovanadium (iv) complexes: DNA/HSA interaction, cytotoxic activity and DFT studies. New J. Chem. 2020, 44, 10946–10963. 10.1039/D0NJ01246G. [DOI] [Google Scholar]
- Yang M. L.; Yang P. J.; Song Y. M. Synthesis, characterization and interaction of transition metal complex of rutin with BSA and HAS. Chin. J. Inorg. Chem. 2005, 21, 483–489. [Google Scholar]
- Neelam S.; Gokara M.; Sudhamalla B.; Amooru D. G.; Subramaniam R. Interaction Studies of Coumaroyltyramine with Human Serum Albumin and Its Biological Importance. J. Phys. Chem. B 2010, 114, 3005–3012. 10.1021/jp910156k. [DOI] [PubMed] [Google Scholar]
- Birjees Bukhari S.; Memon S.; Mahroof Tahir M.; Bhanger M. I. Synthesis, characterization and investigation of antioxidant activity of cobalt–quercetin complex. J. Mol. Struct. 2008, 892, 39–46. 10.1016/j.molstruc.2008.04.050. [DOI] [Google Scholar]
- Bukhari S. B.; Memon S.; Mahroof Tahir M.; Bhanger M. I. Synthesis, characterization and antioxidant activity copper-quercetin complex. Spectrochim. Acta, Part A 2009, 71, 1901–1906. 10.1016/j.saa.2008.07.030. [DOI] [PubMed] [Google Scholar]
- Dolatabadi J. E. N. Molecular aspect on the interaction of quercetin and its metal complexes with DNA. Int. J. Biol. Macromol. 2011, 48, 227–233. 10.1016/j.ijbiomac.2010.11.012. [DOI] [PubMed] [Google Scholar]
- Xu D.; Hu M.; Wang Y.; Cui Y. Antioxidant Activities of Quercetin and Its Complexes for Medicinal Application. Molecules 2019, 24, 1123. 10.3390/molecules24061123. [DOI] [PMC free article] [PubMed] [Google Scholar]
- Kumar P.; Gorai S.; Kumar M.; Mondal B.; Manna D. DNA binding, nuclease activity and cytotoxicity studies of Cu (ii) complexes of tridentate ligands. Dalton Trans. 2012, 41, 7573–7581. 10.1039/c2dt30232b. [DOI] [PubMed] [Google Scholar]
- Mistri T.; Dolai M.; Chakraborty D.; Khuda-Bukhsh A. R.; Das K. K.; Ali M. A highly selective and sensitive in vivo fluorosensor for zinc(ii) without cytotoxicity. Org. Biomol. Chem. 2012, 10, 2380–2384. 10.1039/c2ob07084g. [DOI] [PubMed] [Google Scholar]
- Saha U.; Chatterjee S.; Dolai M.; Kumar G. S. Biophysical and Thermodynamic Investigations on the Differentiation of Fluorescence Response towards Interaction of DNA: A Pyrene-Based Receptor versus Its Fe (III) Complex. ACS Appl. Bio Mater. 2020, 3, 7810–7820. 10.1021/acsabm.0c00983. [DOI] [PubMed] [Google Scholar]
- Jeyalakshmi K.; Arun Y.; Bhuvanesh N. S. P.; Perumal P. T.; Sreekantha A.; Karvembu R. DNA/protein binding, DNA cleavage, cytotoxicity, superoxide radical scavenging and molecular docking studies of copper(ii) complexes containing N-benzyl-N′-aryl-N″-benzoylguanidine ligands. Inorg. Chem. Front. 2015, 2, 780–798. 10.1039/C4QI00234B. [DOI] [Google Scholar]
- Galindo-Murillo R.; Cheatham E. C. Ethidium bromide interactions with DNA: an exploration of a classic DNA–ligand complex with unbiased molecular dynamics simulations. Nucleic Acids Res. 2021, 49, 3735–3747. 10.1093/nar/gkab143. [DOI] [PMC free article] [PubMed] [Google Scholar]
- Morgan A.; Lee J. S.; Pulleyblank D. E.; Murray N. L.; Evans D. H. Ethidium fluorescence assays. Part 1. Physicochemical studies. Nucleic Acids Res. 1979, 7, 547–565. 10.1093/nar/7.3.547. [DOI] [PMC free article] [PubMed] [Google Scholar]
- Lakowicz J. R.Principles of Fluorescence Spectroscopy, 3rd ed.; Plenum: New York, 2006. [Google Scholar]
- Pramanik U.; Khamari L.; Shekhar S.; Mukherjee S. On the Role of Hydrophobic Interactions between Chloramphenicol and Bovine Pancreatic Trypsin: The Effect of a Strong Electrolyte. Chem. Phys. Lett. 2020, 742, 137137 10.1016/j.cplett.2020.137137. [DOI] [Google Scholar]
- Ross P. D.; Subramanian S. Thermodynamics of protein association reactions: forces contributing to stability. Biochemistry 1981, 20, 3096–3102. 10.1021/bi00514a017. [DOI] [PubMed] [Google Scholar]
- Ang D. L.; Lelso C.; Beck J. L.; Ralph S. F.; Harman D. G.; Aldrich-Wright J. R. A study of Pt (II)-phenanthroline complex interactions with double-stranded and G-quadruplex DNA by ESI-MS, circular dichroism, and computational docking. J. Biol. Inorg. Chem. 2020, 25, 429–440. 10.1007/s00775-020-01773-4. [DOI] [PubMed] [Google Scholar]
- Lemiesz L. T.; Karaczyn A.; Keppler B. K.; Koztowski H. J. Studies on the interactions between human serum albumin and trans-indazolium (bisindazole) tetrachlororuthenate(III). J. Inorg. Biochem. 2020, 78, 341–346. 10.1016/S0162-0134(00)00062-3. [DOI] [PubMed] [Google Scholar]
- Kaneko M.; Nagata C. The interaction between small molecules and nucleic acids studied by circular dichroism. Chem. Biol. Interact. 1971, 3, 459–468. 10.1016/0009-2797(71)90007-X. [DOI] [PubMed] [Google Scholar]
- Islam M. M.; Sinha R.; Kumr G. S. RNA binding small molecules: Studies on t-RNA binding by cytotoxic plant alkaloids berberine, palmatine and the comparison to ethidium. Biophys. Chem. 2007, 125, 508–520. 10.1016/j.bpc.2006.11.001. [DOI] [PubMed] [Google Scholar]
- Wang Y.; Wu P.; Zhou X.; Zhang H.; Qiu L.; Cao J. Exploring the interaction between picoplatin and Human serum albumin: effect of protein structure and activity. J. Photochem. Photobiol., B 2016, 162, 611–618. 10.1016/j.jphotobiol.2016.07.031. [DOI] [PubMed] [Google Scholar]
- Balaji S.; Subarkhan M. K. M.; Ramesh R.; Wang H.; Semeril D. Synthesis and Structure of Arene Ru(II) N∧O-Chelating Complexes: In Vitro Cytotoxicity and Cancer Cell Death Mechanism. Organometallics 2020, 39, 1366–1375. 10.1021/acs.organomet.0c00092. [DOI] [Google Scholar]
- Qian C.; Wang J.; Song C.; Wang L.; Ji L.; Chao H. The induction of mitochondria-mediated apoptosis in cancer cells by ruthenium(II) asymmetric complexes. Metallomics 2013, 5, 844–854. 10.1039/c3mt20270d. [DOI] [PubMed] [Google Scholar]
- Parr R. G.; Yang W.. Density Functional Theory of Atoms and Molecules, Oxford University Press, Oxford, 1989. [Google Scholar]
- Barone V.; Cossi M. Quantum Calculation of Molecular Energies and Energy Gradients in Solution by a Conductor Solvent Model. J. Phys. Chem. A. 1998, 102, 1995–2001. 10.1021/jp9716997. [DOI] [Google Scholar]
- Lee C.; Yang W.; Parr R. G. Development of the Colle-Salvetti correlation-energy formula into a functional of the electron density. Phys. Rev. B 1998, 37, 785–789. 10.1103/physrevb.37.785. [DOI] [PubMed] [Google Scholar]
- Casida M. E.; Jamoroski C.; Casida K. C.; Salahub D. R. Molecular excitation energies to high-lying bound states from time-dependent density-functional response theory: Characterization and correction of the time-dependent local density approximation ionization threshold. J. Chem. Phys. 1998, 108, 4439–4449. 10.1063/1.475855. [DOI] [Google Scholar]
- Frisch M. J.; Trucks G. W.; Schlegel H. B.; Scuseria G. E.; Robb M. A.; Cheeseman J. R.; Scalmani G.; Barone V.; Mennucci B.; Petersson G. A.; Nakatsuji H.; Caricato M.; Li X.; Hratchian H. P.; Izmaylov A. F.; Bloino J.; Zheng G.; Sonnenberg J. L.; Hada M.; Ehara M.; Toyota K.; Fukuda R.; Hasegawa J.; Ishida M.; Nakajima T.; Honda Y.; Kitao O.; Nakai H.; Vreven T.; Montgomery J. A. Jr.; Peralta J. E.; Ogliaro F.; Bearpark M.; Heyd J. J.; Brothers E.; Kudin K. N.; Staroverov V. N.; Kobayashi R.; Normand J.; Raghavachari K.; Rendell A.; Burant J. C.; Iyengar S. S.; Tomasi J.; Cossi M.; Rega N.; Millam J. M.; Klene M.; Knox J. E.; Cross J. B.; Bakken V.; Adamo C.; Jaramillo J.; Gomperts R.; Stratmann R. E.; Yazyev O.; Austin A. J.; Cammi R.; Pomelli C.; Ochterski J. W.; Martin R. L.; Morokuma K.; Zakrzewski V. G.; Voth G. A.; Salvador P.; Dannenberg J. J.; Dapprich S.; Daniels A. D.; Farkas Ö.; Foresman J. B.; Ortiz J. V.; Cioslowski J.; Fox D. J.. Gaussian Inc., Wallingford CT, 2009.
- Gradinaru J.; Forni A.; Druta V.; Tessore F.; Zecchin S.; Quici S.; Garbalau N. Structural, Spectral, Electric-Field-Induced Second Harmonic, and Theoretical Study of Ni(II), Cu(II), Zn (II), and VO(II) Complexes with [N2O2] Unsymmetrical Schiff Bases of S-Methylisothiosemicarbazide Derivatives. Inorg. Chem. 2007, 46, 884–895. 10.1021/ic062035r. [DOI] [PubMed] [Google Scholar]
- Khan S.; Masum A. A.; Giri P.; Islam M. M.; Harms K.; Chattopadhyay S. Chirality-Induced Variation in Interaction of Two Similar Copper(II) Coordination Polymers with Calf Thymus DNA: Exploration of Their Antimicrobial Activity and Cytotoxicity. ChemistrySelect 2018, 3, 7112–7122. 10.1002/slct.201801078. [DOI] [Google Scholar]
- Zhang J.; Gao X.; Huang J.; Wang H. Probing the Interaction between Human Serum Albumin and 9-Hydroxyphenanthrene: A Spectroscopic and Molecular Docking Study. ACS Omega 2020, 5, 16833–16840. 10.1021/acsomega.0c02031. [DOI] [PMC free article] [PubMed] [Google Scholar]
- Nayim S.; Jana G. C.; Aktara M. N.; Khatun M.; Das S.; Islam M. M.; Jha P. K.; Hossain M. Berberine derivatives as heteroatom induced hydrophobic sensor: An analytical approach for the selective and sensitive fluorometric detection and discrimination of serum albumins. Anal. Chim. Acta 2019, 1065, 124–133. 10.1016/j.aca.2019.03.026. [DOI] [PubMed] [Google Scholar]
- Mosmann T. Rapid colorimetric assay for cellular growth and survival: Application to proliferation and cytotoxicity assays. J. Immunol. Methods 1983, 65, 55–63. 10.1016/0022-1759(83)90303-4. [DOI] [PubMed] [Google Scholar]
- Kwan Y. P.; Saito T.; Ibrahim D.; Al-Hassan F. M. S.; Oon C. E.; Chen Y.; Jothy S. L.; Kanwar J. R.; Sasidharan S. Evaluation of the cytotoxicity, cell-cycle arrest, and apoptotic induction by Euphorbia hirta in MCF-7 breast cancer cells. Pharm. Biol. 2016, 54, 1223–1236. 10.3109/13880209.2015.1064451. [DOI] [PubMed] [Google Scholar]
- Subash-babu P.; Li D. K.; Alshatwi A. A. In vitro cytotoxic potential of friedelin in human MCF-7 breast cancer cell: Regulate early expression of Cdkn2a and pRb1, neutralize mdm2-p53 amalgamation and functional stabilization of p53. Exp. Toxicol. Pathol. 2017, 69, 630–636. 10.1016/j.etp.2017.05.011. [DOI] [PubMed] [Google Scholar]
- Zhang J.; Ming C.; Zhang W.; Okechukwu P. 10H-3,6- Diazaphenothiazine induces G2/M phase cell cycle arrest and caspase-dependent apoptosis and inhibits cell invasion of A2780 ovarian carcinoma cells through the regulation of NF-κB and (BIRC6- XIAP) complexes. Drug Des., Dev. Ther. 2017, 11, 3045–3063. 10.2147/DDDT.S144415. [DOI] [PMC free article] [PubMed] [Google Scholar]
Associated Data
This section collects any data citations, data availability statements, or supplementary materials included in this article.
Supplementary Materials
Data Availability Statement
Data openly available in a public repository that issues datasets with DOIs.


