PURPOSE:
The integration of pharmacies with oncology practices—known as medically integrated dispensing or in-office dispensing—could improve care coordination but may incentivize overprescribing or inappropriate prescribing. Because little is known about this emerging phenomenon, we analyzed historical trends in medically integrated dispensing.
METHODS:
Annual IQVIA data on oncologists were linked to 2010-2019 National Council for Prescription Drug Programs pharmacy data; data on commercially insured patients diagnosed with any of six common cancer types; and summary data on providers' Medicare billing. We calculated the national prevalence of medically integrated dispensing among community and hospital-based oncologists. We also analyzed the characteristics of the oncologists and patients affected by this care model.
RESULTS:
Between 2010 and 2019, the percentage of oncologists in practices with medically integrated dispensing increased from 12.8% to 32.1%. The share of community oncologists in dispensing practices increased from 7.6% to 28.3%, whereas the share of hospital-based oncologists in dispensing practices increased from 18.3% to 33.4%. Rates of medically integrated dispensing varied considerably across states. Oncologists who dispensed had higher patient volumes (P < .001) and a smaller share of Medicare beneficiaries (P < .001) than physicians who did not dispense. Patients treated by dispensing oncologists had higher risk and comorbidity scores (P < .001) and lived in areas with a higher % Black population (P < .001) than patients treated by nondispensing oncologists.
CONCLUSION:
Medically integrated dispensing has increased significantly among oncology practices over the past 10 years. The reach, clinical impact, and economic implications of medically integrated dispensing should be evaluated on an ongoing basis.
INTRODUCTION
The integration of pharmacies into oncology practices—a cancer care model known as medically integrated dispensing—has the potential to significantly enhance cancer care. A 2019 ASCO/NCODA review found that medically integrated dispensing could improve care coordination, reduce time from diagnosis to treatment, support patient monitoring, and reduce health care costs.1 Medically integrated dispensing—whether through in-office dispensing within the practice or dispensing through an on-site pharmacy—could also lower barriers to medication uptake and adherence; increase the adoption of new, highly effective targeted oral therapies; and mitigate existing distortions in the prescribing of IV therapies. Integrated pharmacy services, however, might create incentives for inappropriate prescribing or overprescribing of oral therapies if oncologists can financially profit from the drugs dispensed by these pharmacies.2,3
Despite the potential of this new care model, very little is known about its prevalence and reach. A convenience-sample survey conducted in 2012 found that more than half of the 40 surveyed oncologists dispensed oral drugs daily from their offices.4 A 2017-2018 Genentech5-sponsored survey of 205 oncology practice managers reported that 48% of patients at these practices had their first fill of oral therapy dispensed in-office. Additional statistics from industry sources point to widespread adoption of medically integrated dispensing,6,7 but there has been little systematic research into its scope and scale nationwide.
Given the considerable positive and negative stakes of medically integrated dispensing, uptake of this new cancer care model is an important question of immediate policy relevance. Using a novel data set linking pharmacies to oncologists and their practices, we analyzed national and state trends in medically integrated dispensing among community and hospital-based oncologists between 2010 and 2019. We also linked granular oncology practice data to data on commercially insured patients diagnosed with cancer and to Medicare summary data to analyze the characteristics of the physicians and the commercially and Medicare-insured patients affected by this care model.
METHODS
Data and Study Population
OneKey (previously SK&A) data on office-based oncologists practicing in the United States between 2010 and 2019 were obtained from the commercial vendor IQVIA.8 OneKey is an annually compiled file of office-based physicians estimated to cover 74% of oncologists billing Medicare fee-for-service and 90% of physicians across all specialties.8-10 OneKey includes physician names, specialties, practice names, practice site addresses, daily patient volume, medical group affiliations, and hospital and health system affiliations. Because OneKey has been reported to understate practices' hospital affiliations,11 we augmented these data with information from web searches on practices' hospital and health system (ownership) affiliations and, for 2016 and 2018, publicly available vertical integration data from the Agency for Healthcare Research and Quality Comparative Health System Performance Initiative Compendium of US Health Systems.12 Physician sex and year of medical school graduation were obtained from the AMA Masterfile13 and linked to IQVIA data using physician national provider identifier.
We distinguished between community oncologists—who own their own practice and accrue revenue from any pharmacies in which they have an ownership stake—and office-based oncologists working in practices owned by hospitals or health systems. Hospital-based oncologists would typically not have a direct financial relationship to outpatient pharmacies owned by their hospital or health system. According to the Community Oncology Alliance, a community oncology practice is defined as a private physician owned business that is not part of a hospital or academic or medical teaching institution. 14 Using this definition, we identified community oncology practices as follows. We first compiled a list of all office-based oncologists using OneKey data, identifying in each year physicians who reported a specialty of medical oncology/hematology, surgical oncology, or gynecologic oncology. The list of sites at which these oncologists practiced constituted our master list of office-based oncology practices. Oncology practices were classified as community practices in a given year if they did not have a hospital or health system affiliation that year, as determined by the protocol described above (using OneKey data, web searches, and the Agency for Healthcare Research and Quality Compendium). The remaining practices, which had a hospital or health system affiliation, were classified as hospital-based practices. Oncologists who reported a community oncology practice as one of their practice sites and who did not report any hospital- or health-system–affiliated site as a practice site were classified as community oncologists that year. The remaining oncologists were classified as hospital-based oncologists.
Annual data on pharmacies, captured in July of each year, were purchased from the National Council for Prescription Drug Programs (NCPDP).15 NCPDP is a nonprofit organization that establishes technical standards for the pharmacy services industry and has historical registration information on 83,000 pharmacies, including chain and independent retail pharmacies, clinic pharmacies, and nonpharmacy dispensing sites (eg, in-office sites). NCPDP pharmacy data include pharmacy name, legal business name, and pharmacy address.
To identify oncology practices with pharmacies, we used fuzzy text matching followed by a manual review of matches. Fuzzy text matching provided an initial match of practices to pharmacies on the basis of common street address, city, and state. Fuzzy matching, unlike exact matching, allowed for small differences in, for example, the street address such that the pair 250 South Main Street and 250 S Main Street—which would have been rejected under exact matching—would receive a high match score under fuzzy matching. The fuzzy match was implemented using the Stata module matchit,16 which generated match scores on the basis of text similarity for all pairs of practices and pharmacies.
We manually reviewed all fuzzy address matches to confirm match validity. Matches were confirmed if there was a match between the pharmacy business name or legal name and the practice name. We conducted additional web searches to confirm the match if the common matched address was that of a medical office building leasing to multiple unrelated tenants. Oncology practices with confirmed pharmacy matches were classified as medically integrated dispensing practices. Practices that did not match to a pharmacy after the manual review were classified as nonmedically integrated dispensing practices. We repeated these steps for each year of data.
Characteristics of oncologists' practices—number of Medicare beneficiaries, census region location, and urbanicity17—were obtained from Medicare Provider Utilization and Payment Data: Physician and Other Supplier public use files.18 Summary characteristics of Medicare patients treated by each oncologist, including mean CMS Hierarchical Condition Category (HCC) risk score19 and number of dual Medicare-Medicaid patients, were also obtained from the Medicare provider summary public use file.
Characteristics of commercially insured patients treated by oncologists were obtained from the HealthCore Integrated Research Environment. HealthCore Integrated Research Environment is a repository of medical and claims data for approximately 78 million members managed by 14 commercial health plans covering a racially and ethnically diverse population across the United States. Because medically integrated dispensing is most relevant for patients with cancers for which there are oral therapies available, we focused on this subset of patients. In particular, our sample consisted of individuals newly diagnosed with early-stage breast cancer or advanced breast cancer, colorectal cancer, lung cancer, melanoma, prostate cancer, or renal cancer between January 1, 2010, and December 31, 2019 (see the Data Supplement, online only, for diagnostic codes used for sample inclusion).
Patients were attributed to a primary oncologist each year on the basis of physician share of medical and pharmacy claims. Because our focus was on oral therapy prescribing, we attributed patients first using pharmacy claims and then using medical claims. An oncologist who was the prescriber of a plurality of a patient's pharmacy claims for 42 common oral anticancer therapies (see the Data Supplement for full list) was considered that patient's primary oncologist that year. If a patient had no oral therapy claims, the rendering oncologist associated with a plurality of a patient's medical claims for physician-administered anticancer therapies (CPT codes 96400-96549; HCPCS codes J9000-J9600) and Evaluation and Management visits20 was considered that patient's primary oncologist. If multiple oncologists accounted for equal plural shares of pharmacy or medical claims, one oncologist was selected at random to be the primary oncologist.
Outcomes
In our graphical analysis of trends, the outcomes of interest were the share of all oncology practices with medically integrated dispensing, the share of community oncologists in practices with medically integrated dispensing, and the share of hospital-based oncologists in practices with medically integrated dispensing. In our analysis of physicians, characteristics of interest included sex, years since medical school graduation, oncology subspecialty, census region, urbanicity of practice location, daily practice volume, and number of Medicare beneficiaries. As a proxy measure for the share of Medicare beneficiaries in an oncologist's patient panel, we calculated the number of Medicare beneficiaries per 100 monthly site visitors (ie, we divided the number of Medicare beneficiaries by practice volume, scaled to a monthly level, and multiplied the ratio by 100).
In our analysis of characteristics of commercially insured patients, attributes of interest included cancer diagnosis/site, sex, age, Charlson comorbidity score,21,22 and—at the ZIP code level—% Black, urbanicity, and median household income. In our analysis of characteristics of Medicare insured patients, oncologist-level attributes included mean HCC risk scores19 and % Medicare-Medicaid dual eligible.
Statistical Analysis
To test for a time trend in the prevalence of medically integrated dispensing, we estimated a regression model of annual prevalence on a constant and a linear time trend. In comparisons of physician and patient characteristics, we used χ2 tests of independence to analyze differences in characteristics by medically integrated dispensing status.
RESULTS
Between 2010 and 2019, the national prevalence of medically integrated dispensing among oncologists increased by 19.3 percentage points, from 12.8% to 32.1% (Fig 1A). This increase was statistically significant (b = 2.2 percentage points per year, P < .001).
FIG 1.
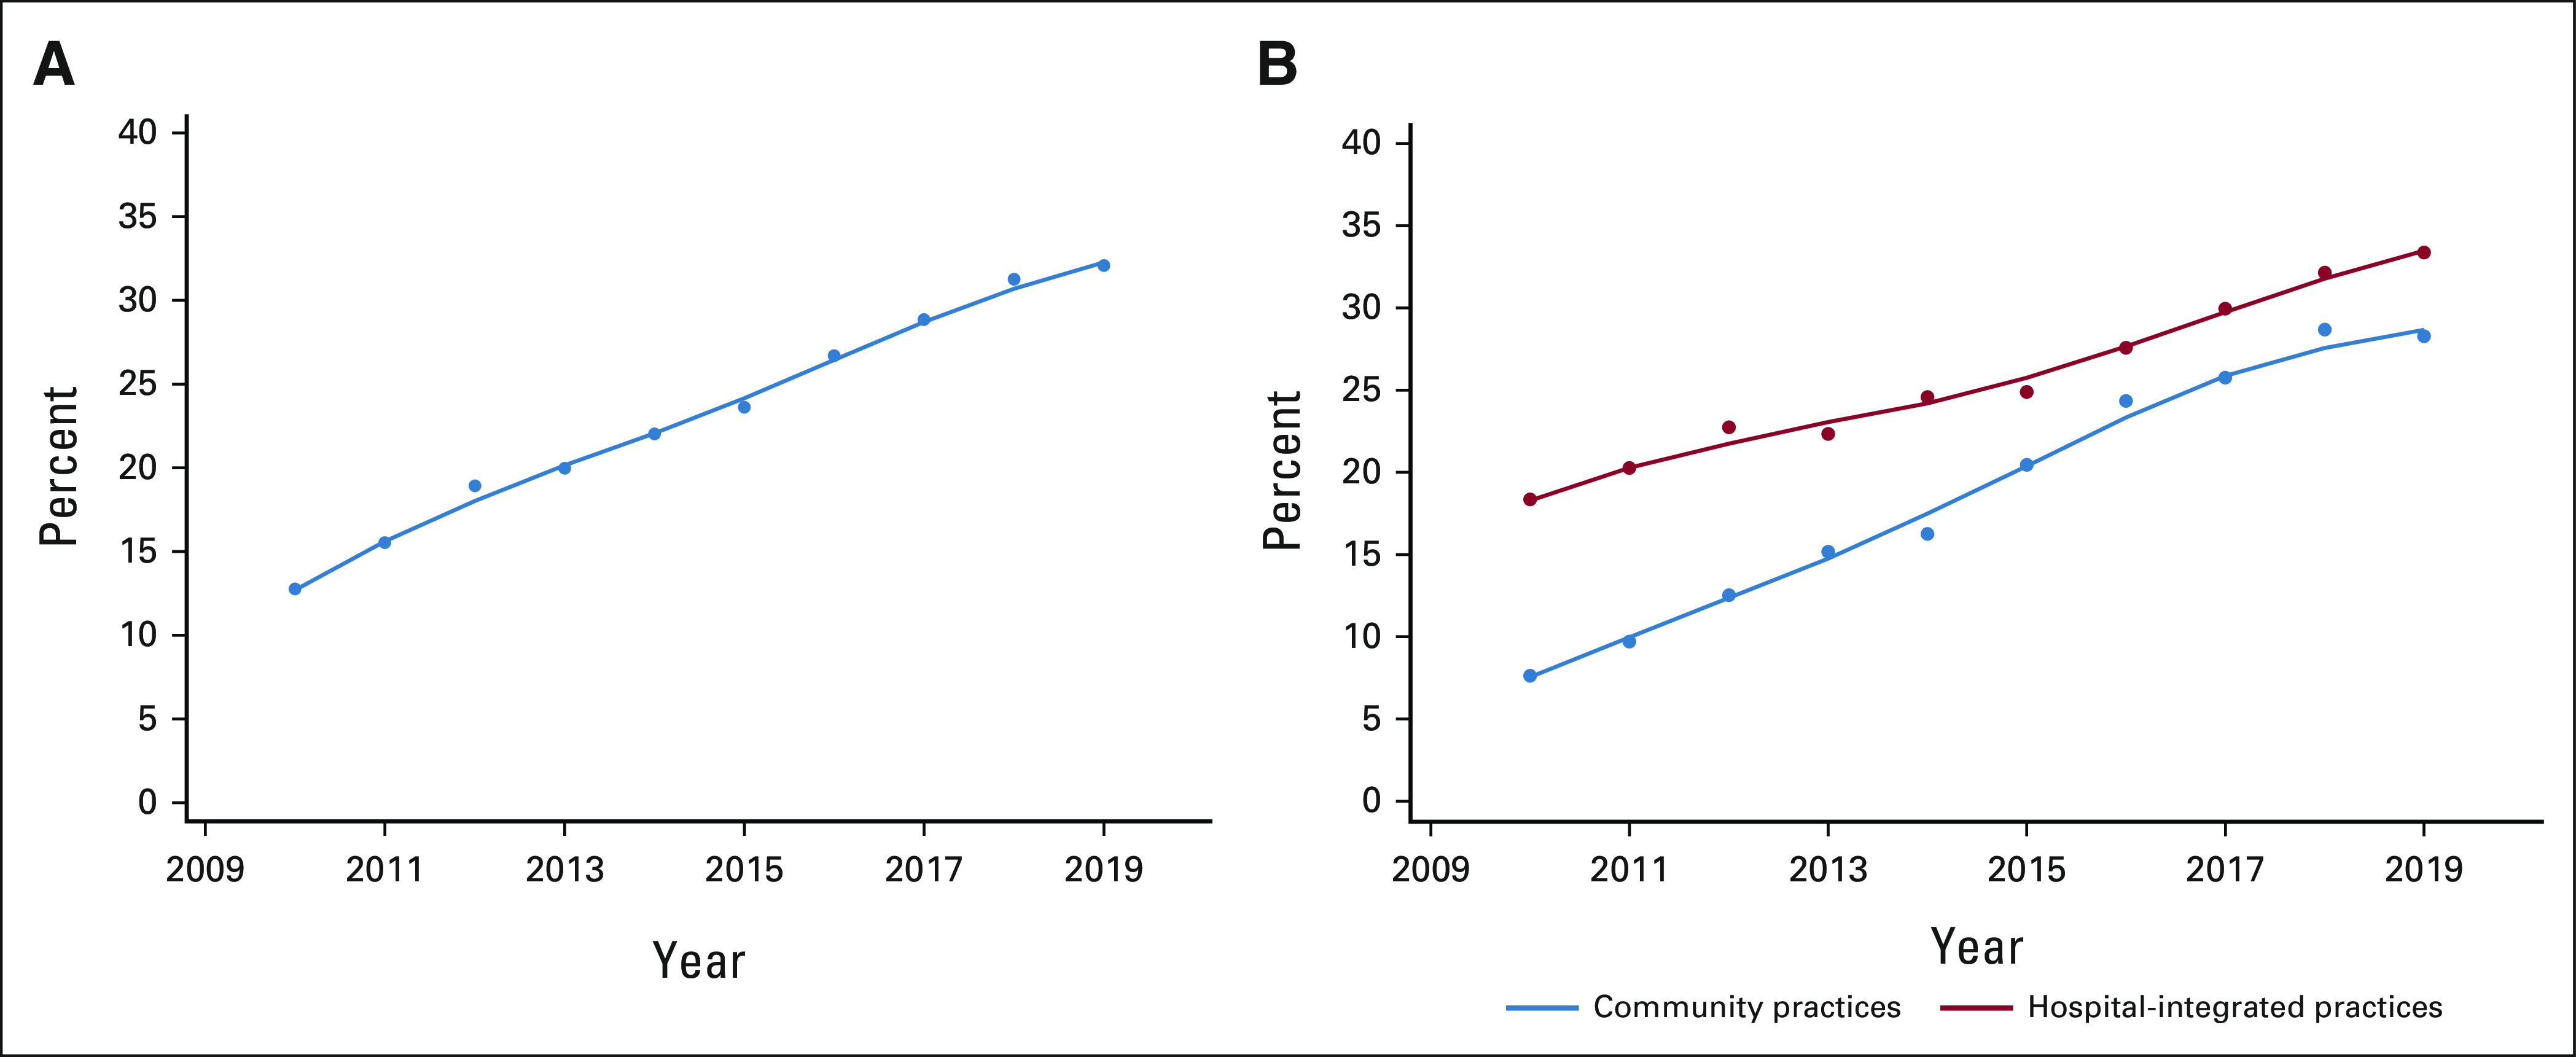
National trends in (A) share of oncologists with medically integrated dispensing, and (B) share of oncologists in community practices and in hospital-integrated practices with medically integrated dispensing. NOTE: Lines are the lowess smoothed curves of annual shares (bandwidth = 0.8).
During this period, prevalence of medically integrated dispensing among community oncology practices increased by 20.6 percentage points, from 7.6% to 28.3% (Fig 1B). Prevalence among hospital-based practices increased from 18.3% to 33.4%.
There was substantial geographic variation in the prevalence of medically integrated dispensing. State prevalence in 2019 ranged from 6% to 68% (Fig 2A). Among community oncologists, prevalence ranged from 0% to 100% (Fig 2B). Among hospital-based oncologists, prevalence ranged from 0% to 73% (Fig 2C).
FIG 2.
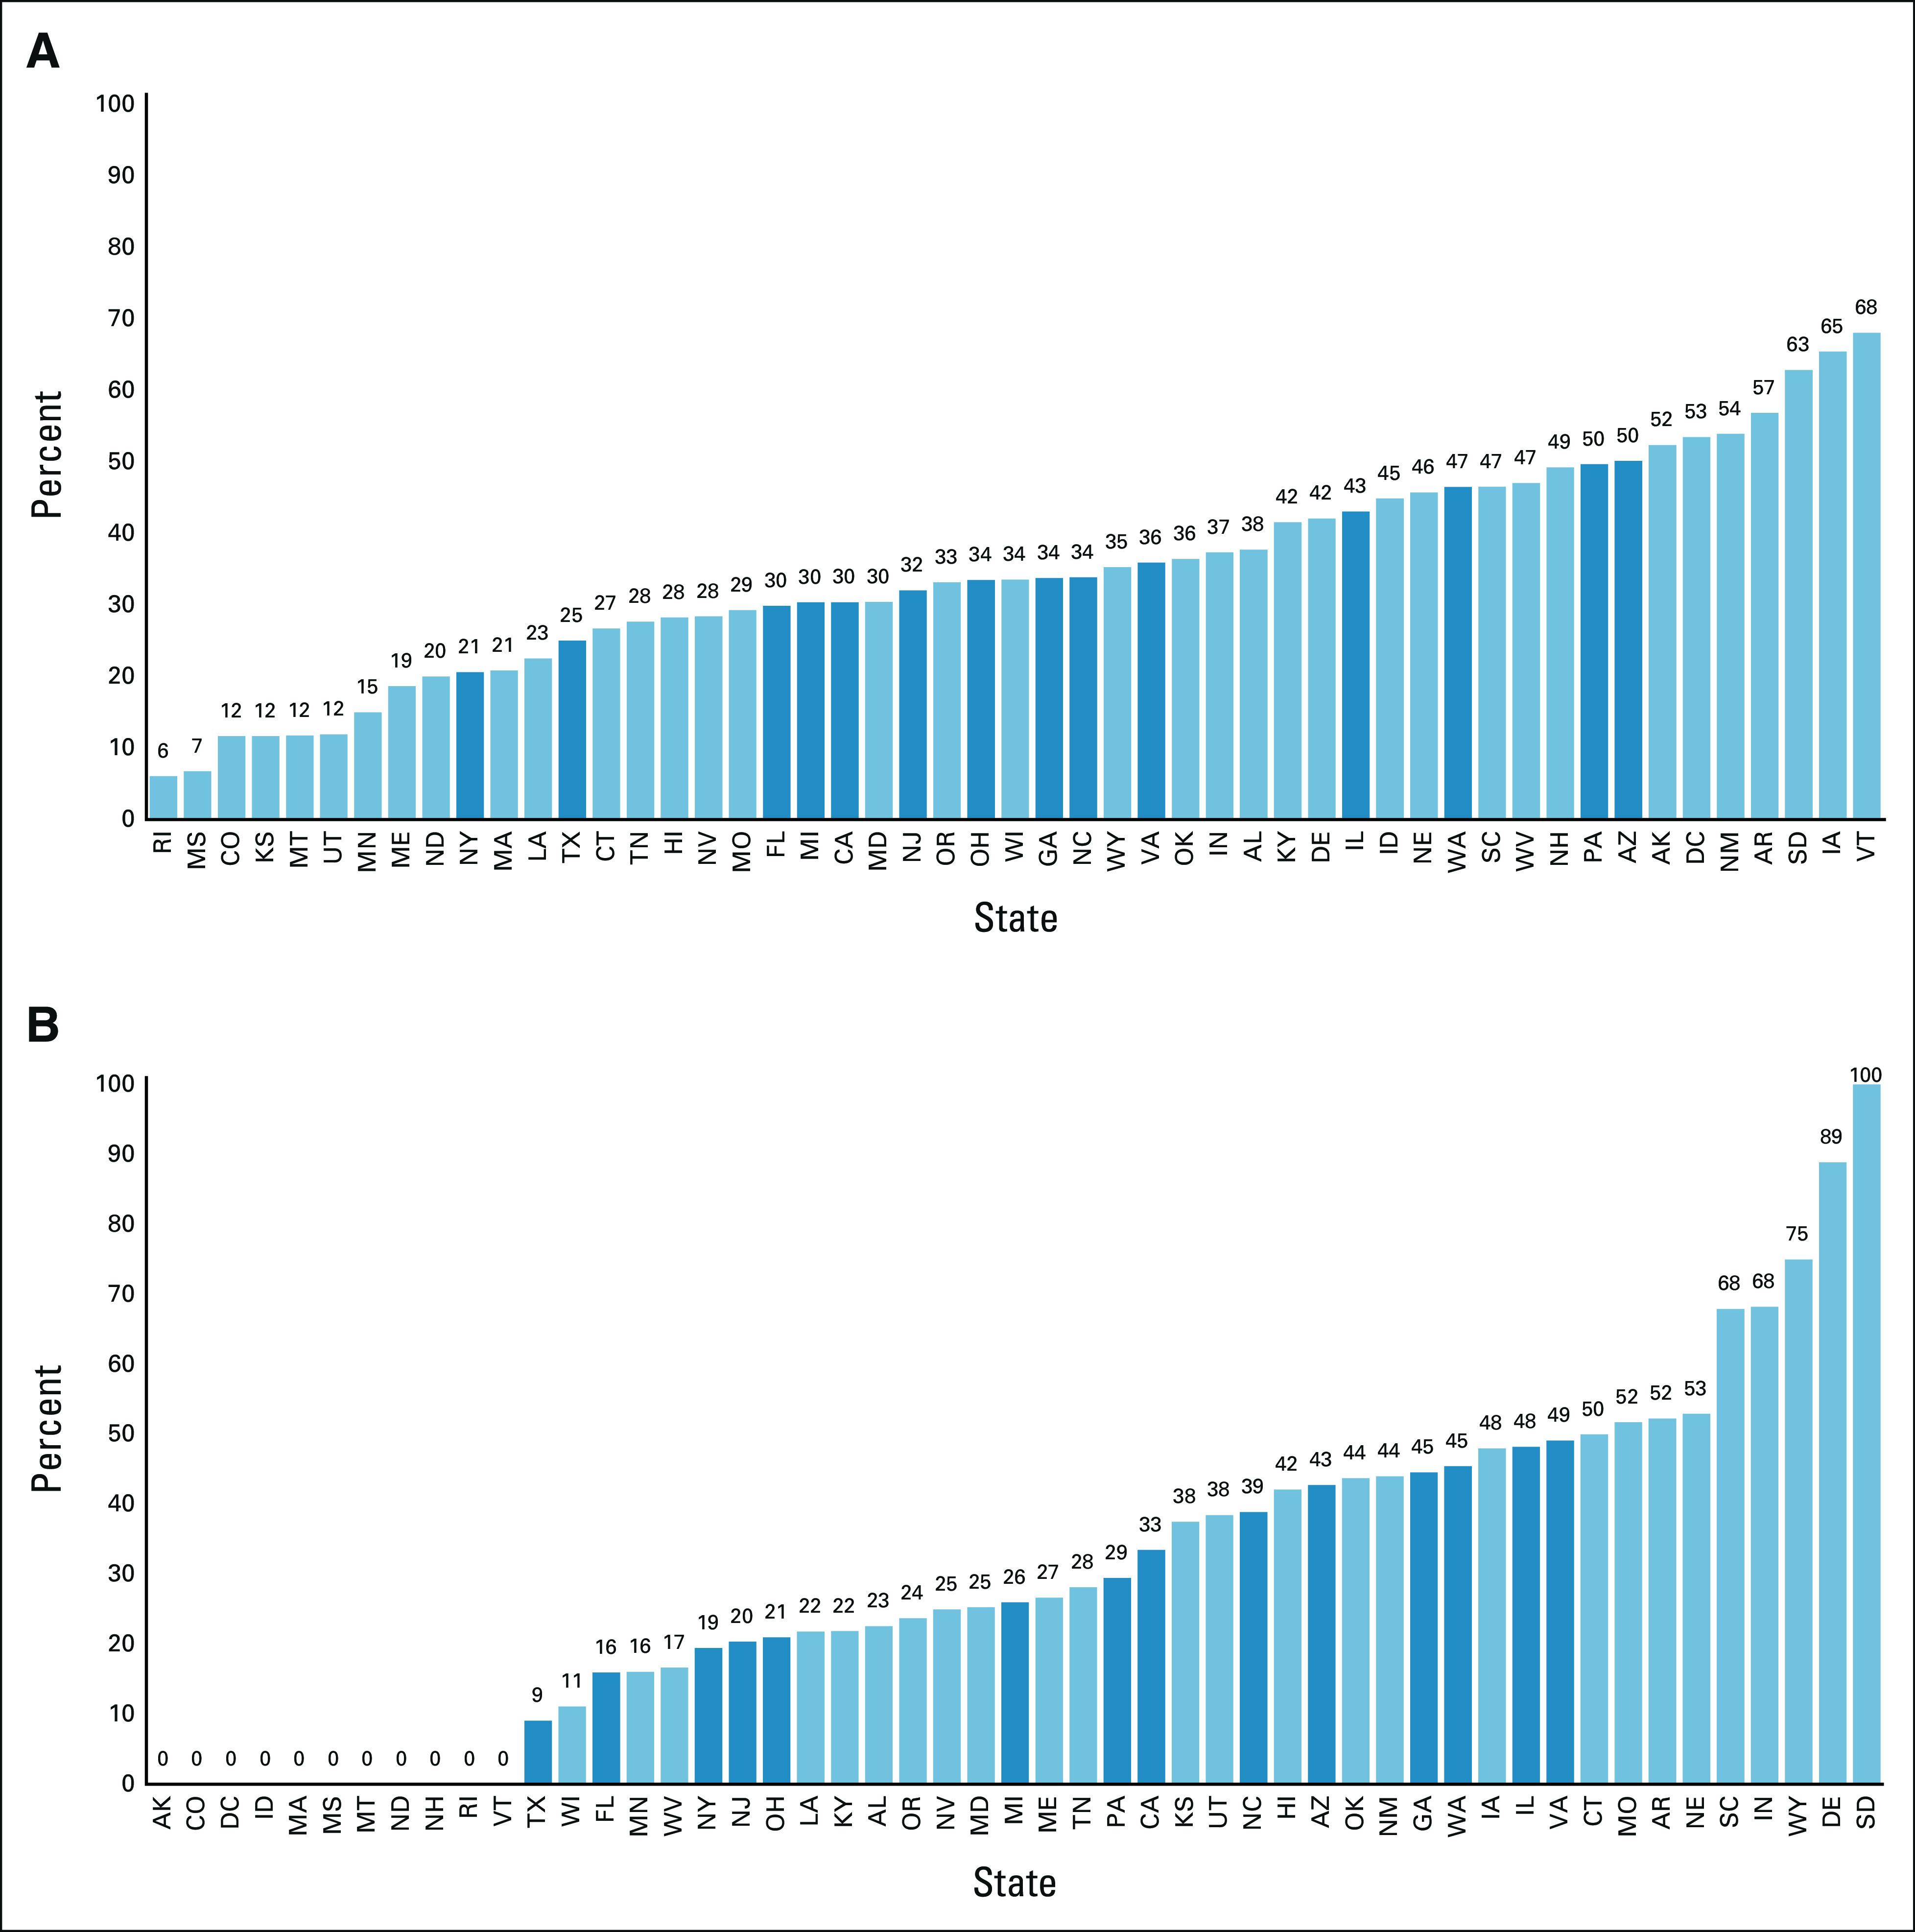
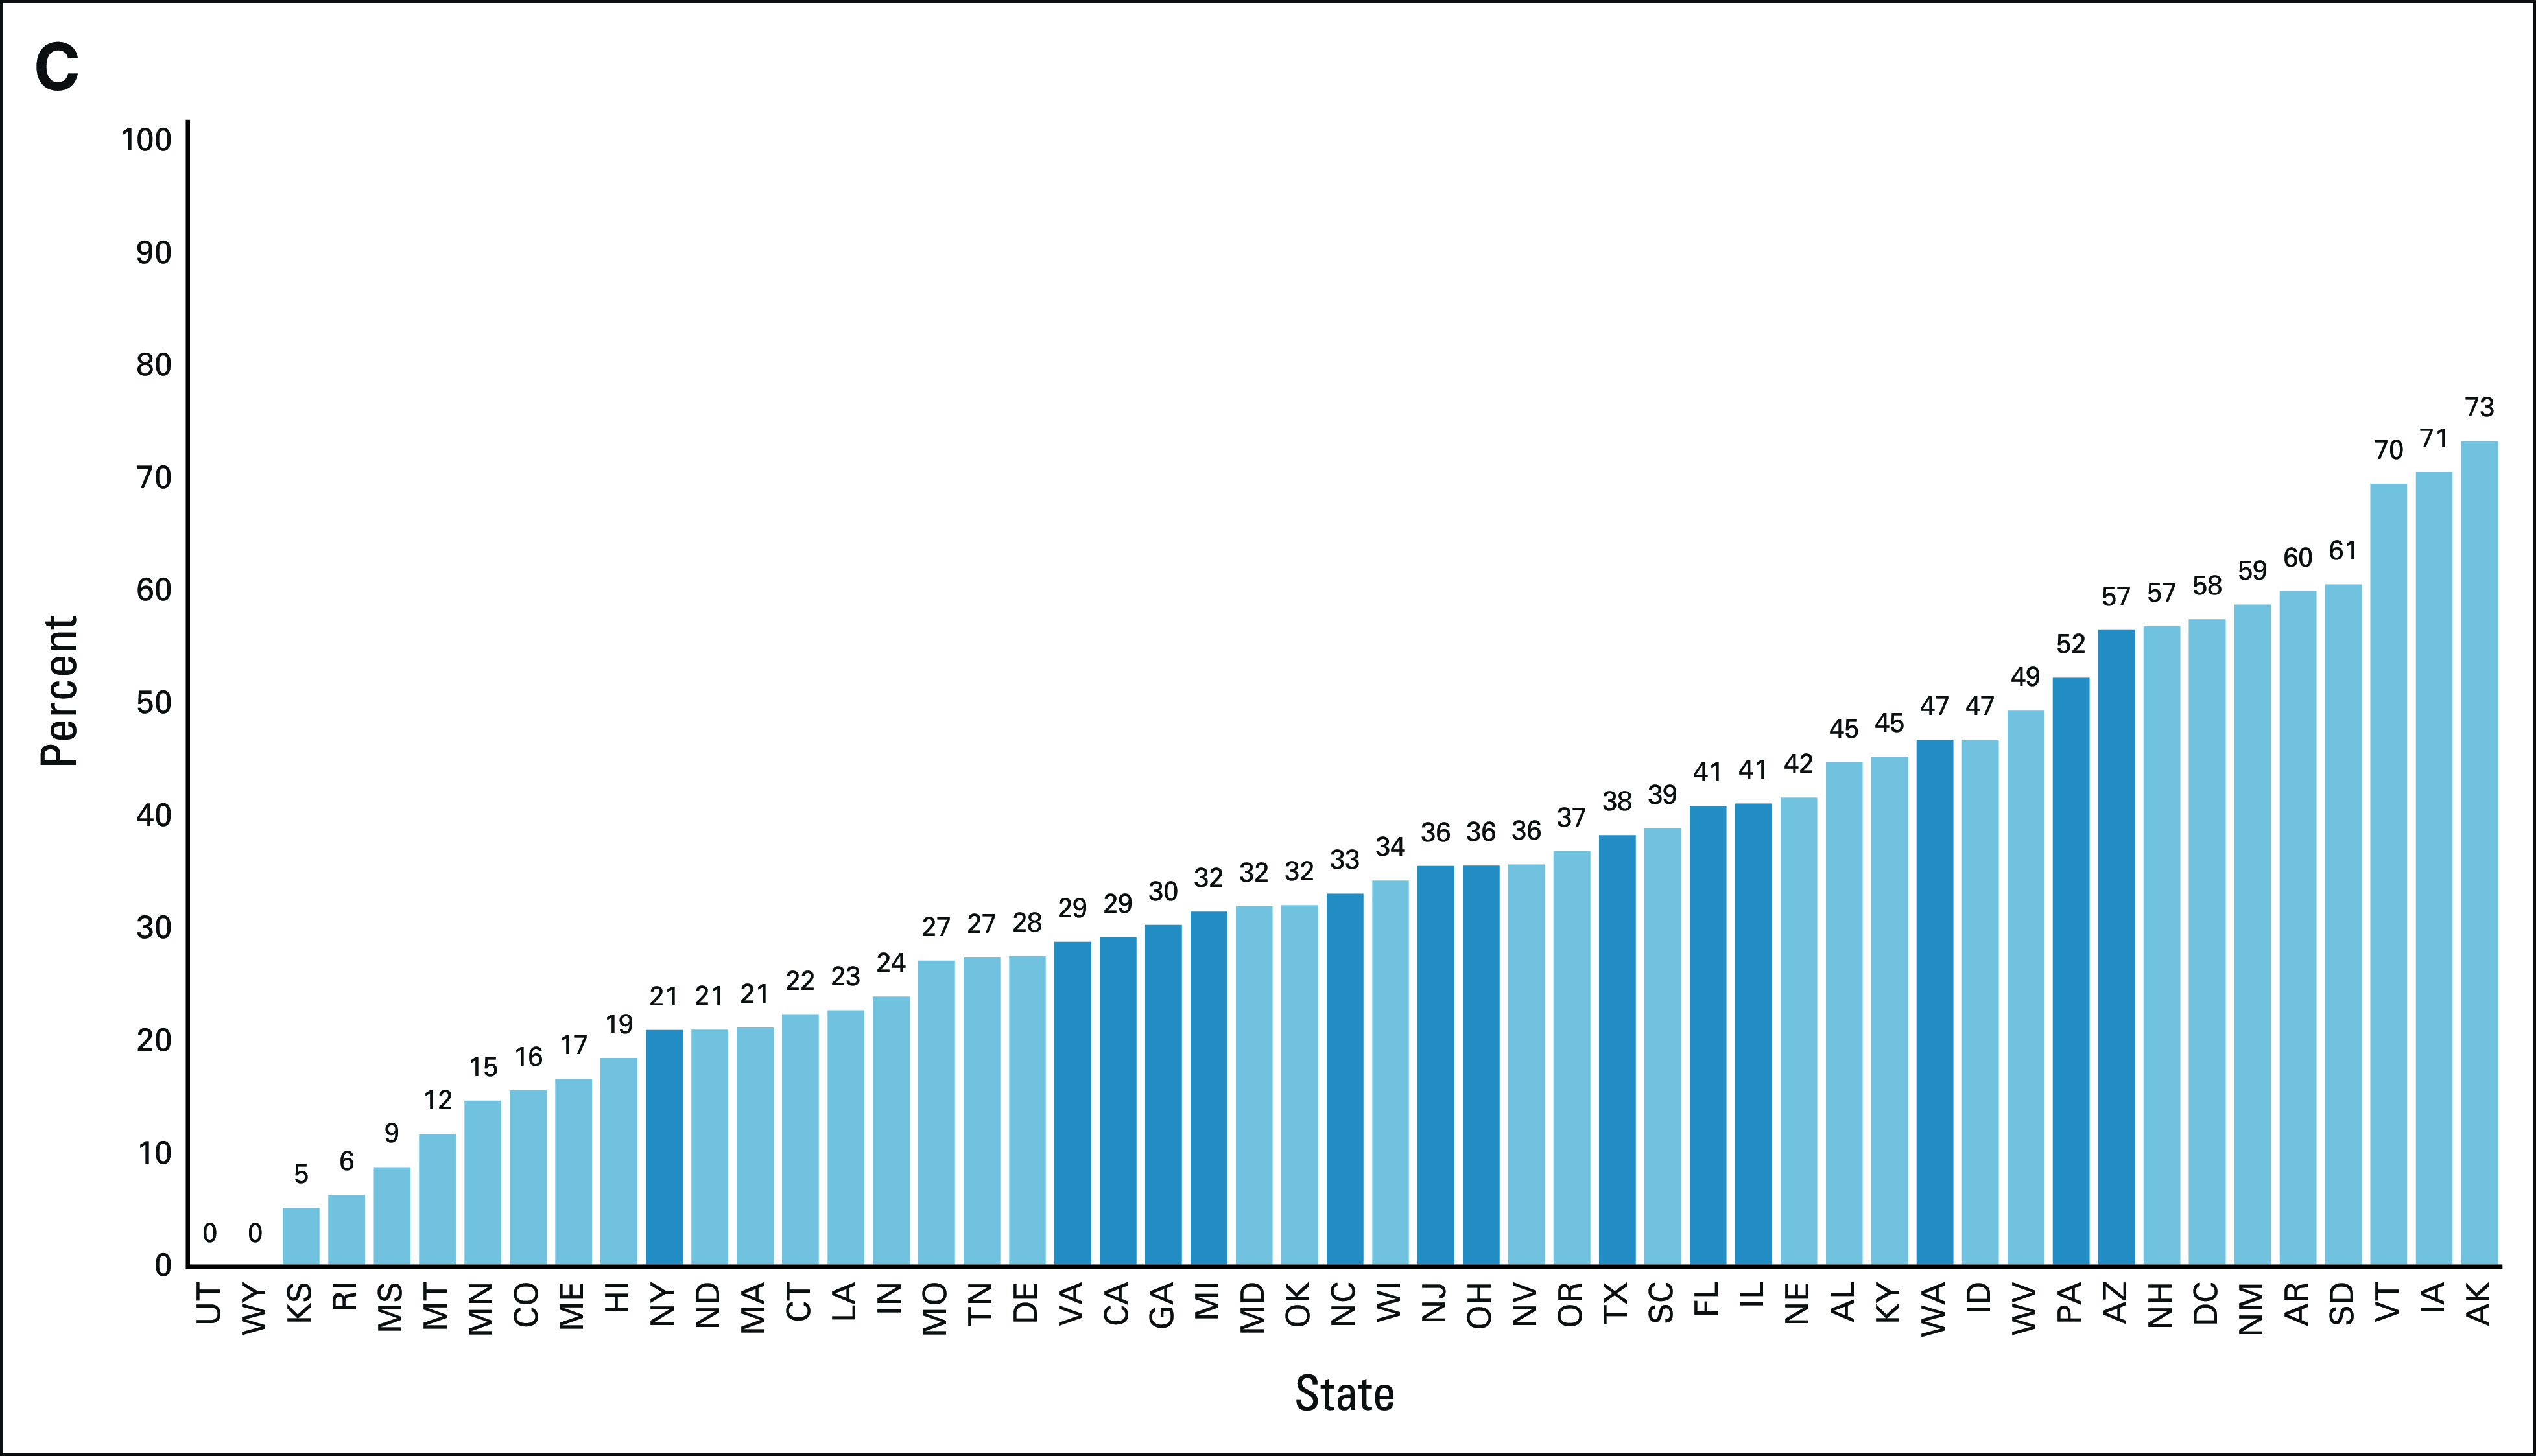
Share of oncologists in practices with medically integrated dispensing by state, 2019: (A) share of oncologists in practices with medically integrated dispensing, (B) share of community oncologists in practices with medically integrated dispensing, and (C) share of hospital-based oncologists in practices with medically integrated dispensing. NOTES: Dark blue bars indicate states with population of more than seven million in 2019.
Rates of uptake of the dispensing model also varied considerably across states. Among community practices, 10 states plus DC showed zero prevalence and zero growth between 2010 and 2019 (Data Supplement). At the other extreme, 19 states showed ≥ 30% annual growth during this period. Populous states with the most rapid uptake included, among community practices, Illinois, Virginia, and Washington, and among hospital-based practices, Ohio, Pennsylvania, and Florida (Data Supplement).
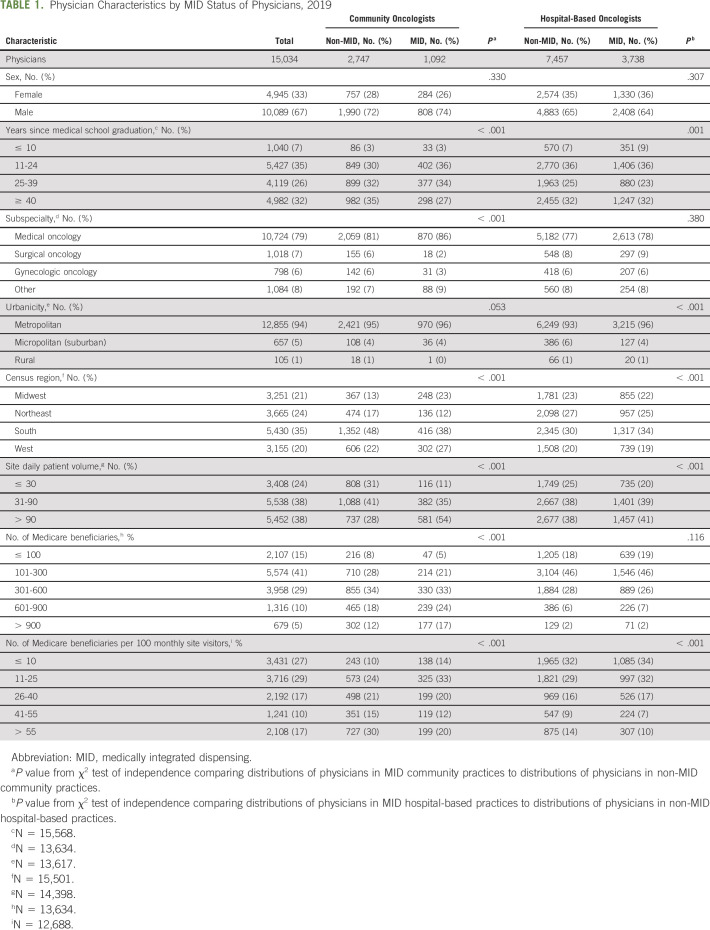
Both community and hospital-based oncologists in practices with medically integrated dispensing tended to be high-volume practices (P < .001; Table 1). The share of Medicare beneficiaries in a physician's patient panel (approximated by the number of Medicare beneficiaries per 100 monthly site visitors) was smaller for dispensing oncologists than nondispensing oncologists (P < .001).
TABLE 1.
Physician Characteristics by MID Status of Physicians, 2019
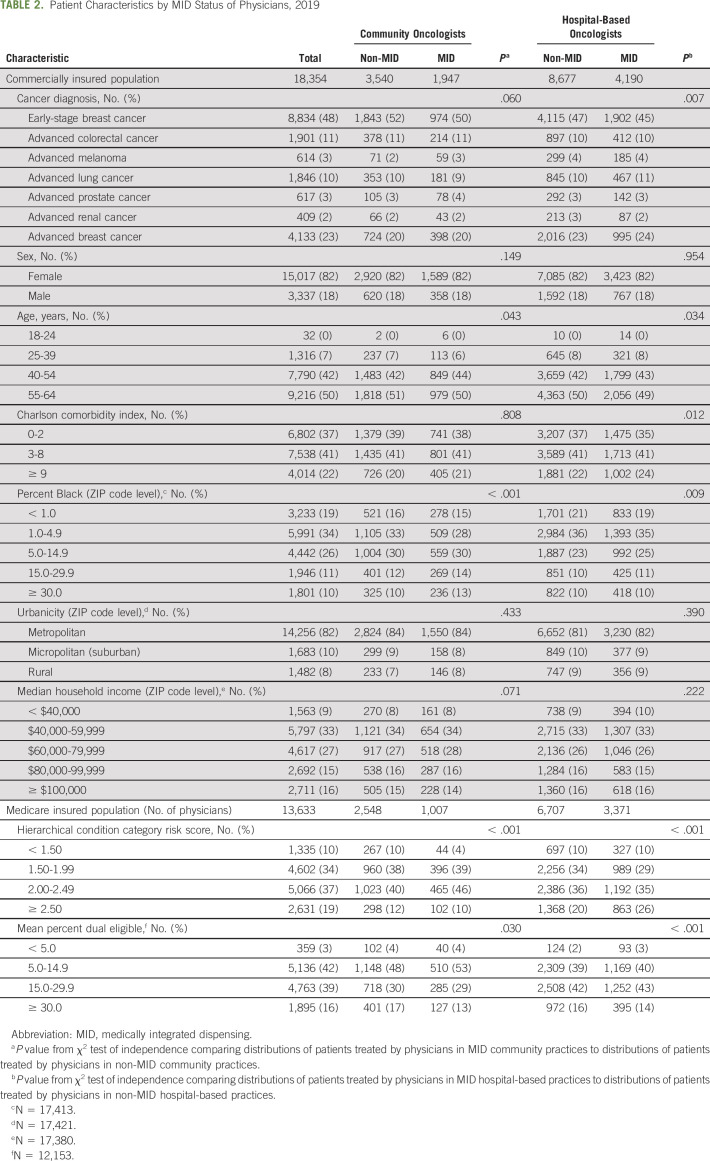
Patients who saw dispensing oncologists were clinically and socially more vulnerable than those who saw nondispensing oncologists (Table 2). This was evidenced by a greater share of Medicare insured patients with higher HCC risk scores (P < .001) and a greater share of commercially insured patients with a higher Charlson comorbidity index (P < .001 for hospital-based oncologists). A higher share of commercially insured patients who saw dispensing oncologists lived in areas with greater % Black population (P < .001).
TABLE 2.
Patient Characteristics by MID Status of Physicians, 2019
DISCUSSION
Between 2010 and 2019, there was significant expansion of medically integrated dispensing as a care and business model in oncology. The share of oncologists in dispensing practices increased by 151%, from 12.8% to 32.1%. Among community oncologists—who account for 26% of oncologists but are estimated to treat 55% of patients with cancer14—dispensing rose 272%, from 7.6% to 28.3%. Among hospital-based practices, dispensing rose 82%, from 18.3% to 33.4%. Although these estimates of prevalence and uptake are more modest than previously reported in trade publications and convenience-sample surveys,4-7 they nevertheless show that medically integrated dispensing is reaching a substantial and growing number of Americans.
The patients treated by oncologists in dispensing practices were different from those treated by oncologists in nondispensing practices. Patients treated by dispensing oncologists were on average more clinically complex and more likely to live in areas with greater % Black population. If there are significant differences in the quality of care between dispensing and nondispensing practices, these differences could exacerbate—or be used to mitigate—inequities in access to high-quality cancer care. These disparities will be a critical trend to monitor and an important topic for future research.
There was also substantial heterogeneity across states in the prevalence and uptake of medically integrated dispensing. In 2019, there were nine states with ≥ 50% share of oncologists in dispensing practices, and between 2010 and 2019, 19 states experienced ≥ 30% annual increases in the share of community oncologists with dispensing capabilities. By contrast, the share of dispensing community oncologists in 10 other states plus DC stayed flat at 0%. These variations and their causes warrant further investigation.
Differences across states are likely the result of a complex combination of factors. State laws banning prescriber ownership of pharmacies or limiting the size of their stake in pharmacies likely play an important role in curbing the growth of dispensing among community practices. During the study period, Massachusetts, Montana, and New Hampshire, for example, prohibited prescriber ownership of pharmacies23-25 and also showed zero prevalence of medically integrated dispensing in community practices. Some states have laws prohibiting prescribers from dispensing drugs at their practices but do not prohibit prescriber ownership of pharmacies.
Another factor is state variation in the penetration of oncology networks such as Integrated Oncology Network26 and US Oncology.27 These networks piggyback on existing relationships with oncology practices. Developed by drug wholesalers such as AmerisourceBergen, McKesson, and Cardinal, these networks have historically served as linchpin distributors of infused anticancer drugs to practices participating in their networks. With the increasing importance of oral oncology drugs, these networks are facilitating the adoption of in-office dispensing systems and point-of-care pharmacies by providing administrative and contracting support.28,29
A final important factor is the integration of previously independent oncology practices into hospitals and health systems. This trend, known as vertical integration, has become an important market force in oncology over the past 10 years,30 and rates of oncology practice acquisitions have varied widely across states.31-33 Acquisitions reduce the number of community oncology practices, replacing them with hospital-based practices. These hospital-based practices are more likely to offer on-site pharmacies because of existing infrastructure and access to financial support from the parent hospital or health system, as well as the powerful incentives offered by 340B participation. The community oncology practices that remain are driven to consolidate to stay financially viable. These larger independent practices are more likely to adopt medically integrated dispensing because of higher patient volumes and higher expected returns from a pharmacy. They are also better able to afford the fixed costs associated with pharmacy setup. Vertical integration thus drives pharmacy integration of both hospital-based and community oncology practices.
Previous research on various forms of vertical integration has identified some negative consequences of integration. Physician-hospital integration has been found to drive up hospital prices and, in some cases, drive down quality of care.34,35 Research on the integration of physician practices with ancillary services such as imaging and laboratories finds that physicians order more imaging studies and laboratory tests after integration.36-39 There is, therefore, good reason to be concerned that the integration of oncology practices with pharmacies could lead to distortions in prescribing. Integration could spur overprescribing since each additional prescription contributes to more overall revenue. It could also lead to inappropriate prescribing if there are greater profit margins from oral products relative to IV substitutes that may be more clinically appropriate. There is already some evidence that oncologists change their prescribing in response to changes in reimbursements for infused anticancer therapies.40 Prescribing distortions created by medically integrated dispensing will be particularly heightened in community practices, where pharmacy revenues accrue directly to prescribers.
At the same time, there may be some benefits from physician-pharmacy integration if the integration is truly clinical and not simply financial. A shared medical record can facilitate communication between clinicians and pharmacy services, and improve patient monitoring. This care coordination could boost responsiveness to patient needs and disease progression, and avert drug toxicity. It could reduce the time from diagnosis to treatment and lower barriers to medication uptake and adherence, improving clinical outcomes.
Moreover, by increasing the incentive to prescribe oral therapies, medically integrated dispensing could offset existing distortions in the prescribing of IV administered anticancer therapies. The cost plus reimbursement system for IV therapies—typically the drug's average sales price plus 6%—heavily favors the prescribing of these therapies over oral therapies, and virtually all oncology practices provide and bill for IV medications that they administer in-office. The countervailing incentive provided by an integrated pharmacy could reduce distortions in IV prescribing and facilitate adoption of highly effective targeted oral therapies.
This analysis has several limitations. First, we may not have identified all practices affiliated with hospitals or health systems, erroneously classifying some as community practices. This would bias our statistical tests toward finding no difference between community and hospital-based practices. Second, we may not have identified all practices with dispensing capabilities if the listed pharmacy address was not close to the practice address. This would underestimate the prevalence of medically integrated dispensing. Finally, our commercially insured patient sample included only those diagnosed with the six cancer types most likely to be treated with oral therapies. For the Medicare patient population, we only had oncologist-level aggregate data for patients with any cancer diagnosis. Thus, the two patient populations are not directly comparable.
In conclusion, the prevalence of medically integrated dispensing among oncology practices has increased significantly over the past 10 years. This emerging practice model has the potential to improve care coordination, enhance patient monitoring, prevent toxicity, and reinforce medication uptake and adherence. Ideally, medically integrated dispensing would also accelerate the appropriate use of novel oral anticancer agents and counteract existing distortions in IV treatment. However, this model might also result in overprescribing and inappropriate prescribing of oral therapies. Given the increasing adoption of medically integrated dispensing in both community and hospital settings, the full implications of this new care model will be important to monitor and evaluate on an ongoing basis.
ACKNOWLEDGMENT
The authors are grateful to the NIHCM Foundation for financial support of this project. The authors thank Kathryn Cowie, Alexander O'Donnell, and Alice Rossmann for their research assistance.
Ravi B. Parikh
Stock and Other Ownership Interests: Merck, Google, GNS Healthcare, Onc.AI
Consulting or Advisory Role: GNS Healthcare, Cancer Study Group, Onc.AI, Thyme Care, Humana, NanOlogy, Merck
Research Funding: Humana
Patents, Royalties, Other Intellectual Property: Technology to integrate patient-reported outcomes into electronic health record algorithms
Travel, Accommodations, Expenses: The Oncology Institute of Hope and Innovation
Michael J. Fisch
Employment: AIM Specialty Health
Stock and Other Ownership Interests: Anthem
Patents, Royalties, Other Intellectual Property: Healthcore, Inc, A subsidiary of Anthem, Inc
Open Payments Link: https://openpaymentsdata.cms.gov/physician/767578https://openpaymentsdata.cms.gov/physician/767578
David Debono
Employment: Anthem
Stock and Other Ownership Interests: Lilly
Justin Bekelman
Stock and Other Ownership Interests: Reimagine Care
Honoraria: National Comprehensive Cancer Network
Consulting or Advisory Role: UnitedHealthcare, Reimagine Care
Stephanie Schauder
Employment: Anthem, Inc, Piedmont Plastic Surgery & Dermatology (I)
Research Funding: Anthem, Inc
Travel, Accommodations, Expenses: Anthem, Inc
Gosia Sylwestrzak
Other Relationship: Anthem, Inc
John J. Barron
Research Funding: HealthCore (Inst)
Other Relationship: Anthem, Inc
Rebecca Cobb
Employment: Anthem
Stock and Other Ownership Interests: Unknown
Research Funding: Anthem
Travel, Accommodations, Expenses: Anthem
Dima M. Qato
Consulting or Advisory Role: AbbVie
Mireille Jacobson
Other Relationship: Opioid Litigation on Behalf of Plaintiffs, UCI Health
No other potential conflicts of interest were reported.
AUTHOR CONTRIBUTIONS
Conception and design: Genevieve P. Kanter, Ravi B. Parikh, David Debono, Stephanie Schauder, Gosia Sylwestrzak, John J. Barron
Financial support: Genevieve P. Kanter, Gosia Sylwestrzak
Administrative support: Genevieve P. Kanter, Gosia Sylwestrzak
Provision of study materials or patients: David Debono, Gosia Sylwestrzak, Dima M. Qato
Collection and assembly of data: Genevieve P. Kanter, Ravi B. Parikh, Yao Xu, Stephanie Schauder, Gosia Sylwestrzak, Rebecca Cobb
Data analysis and interpretation: Genevieve P. Kanter, Ravi B. Parikh, Michael J. Fisch, David Debono, Justin Bekelman, Yao Xu, Gosia Sylwestrzak, John J. Barron, Dima M. Qato, Mireille Jacobson
Manuscript writing: All authors
Final approval of manuscript: All authors
Accountable for all aspects of the work: All authors
AUTHORS' DISCLOSURES OF POTENTIAL CONFLICTS OF INTEREST
Trends in Medically Integrated Dispensing Among Oncology Practices
The following represents disclosure information provided by authors of this manuscript. All relationships are considered compensated unless otherwise noted. Relationships are self-held unless noted. I = Immediate Family Member, Inst = My Institution. Relationships may not relate to the subject matter of this manuscript. For more information about ASCO's conflict of interest policy, please refer to www.asco.org/rwc or ascopubs.org/op/authors/author-center.
Open Payments is a public database containing information reported by companies about payments made to US-licensed physicians (Open Payments).
Ravi B. Parikh
Stock and Other Ownership Interests: Merck, Google, GNS Healthcare, Onc.AI
Consulting or Advisory Role: GNS Healthcare, Cancer Study Group, Onc.AI, Thyme Care, Humana, NanOlogy, Merck
Research Funding: Humana
Patents, Royalties, Other Intellectual Property: Technology to integrate patient-reported outcomes into electronic health record algorithms
Travel, Accommodations, Expenses: The Oncology Institute of Hope and Innovation
Michael J. Fisch
Employment: AIM Specialty Health
Stock and Other Ownership Interests: Anthem
Patents, Royalties, Other Intellectual Property: Healthcore, Inc, A subsidiary of Anthem, Inc
Open Payments Link: https://openpaymentsdata.cms.gov/physician/767578https://openpaymentsdata.cms.gov/physician/767578
David Debono
Employment: Anthem
Stock and Other Ownership Interests: Lilly
Justin Bekelman
Stock and Other Ownership Interests: Reimagine Care
Honoraria: National Comprehensive Cancer Network
Consulting or Advisory Role: UnitedHealthcare, Reimagine Care
Stephanie Schauder
Employment: Anthem, Inc, Piedmont Plastic Surgery & Dermatology (I)
Research Funding: Anthem, Inc
Travel, Accommodations, Expenses: Anthem, Inc
Gosia Sylwestrzak
Other Relationship: Anthem, Inc
John J. Barron
Research Funding: HealthCore (Inst)
Other Relationship: Anthem, Inc
Rebecca Cobb
Employment: Anthem
Stock and Other Ownership Interests: Unknown
Research Funding: Anthem
Travel, Accommodations, Expenses: Anthem
Dima M. Qato
Consulting or Advisory Role: AbbVie
Mireille Jacobson
Other Relationship: Opioid Litigation on Behalf of Plaintiffs, UCI Health
No other potential conflicts of interest were reported.
REFERENCES
- 1.Dillmon MS, Kennedy EB, Anderson MK, et al. : Patient-centered standards for medically integrated dispensing: ASCO/NCODA standards. J Clin Oncol 38:633-644, 2020 [DOI] [PubMed] [Google Scholar]
- 2.Mitchell AP, Rotter JS, Patel E, et al. : Association between reimbursement incentives and physician practice in oncology. JAMA Oncol 5:893-899, 2019 [DOI] [PMC free article] [PubMed] [Google Scholar]
- 3.Jacobson M, O'Malley AJ, Earle CC, et al. : Does reimbursement influence chemotherapy treatment for cancer patients? Health Aff (Millwood) 25:437-443, 2006 [DOI] [PubMed] [Google Scholar]
- 4.Munger MA, Ruble JH, Nelson SD, et al. : National evaluation of prescriber drug dispensing. Pharmacotherapy 34:1012-1021, 2014 [DOI] [PubMed] [Google Scholar]
- 5.Genentech: Genentech Oncology Trend Report. San Francisco, CA, Genentech, 2019 [Google Scholar]
- 6.Tom B: In-Office Dispensing Is a Better Value, 2016. OncLive.com, https://www.onclive.com/publications/oncology-business-news/2016/august-2016/inoffice-dispensing-is-better-value [Google Scholar]
- 7.Harrison L: A Look at Medically Integrated Dispensing, Part One: How Practices and Patients Benefit, 2020. Amerisourcebergen.com, https://www.besse.com/insights/a-look-at-medically-integrated-dispensing-part-1-how-practices-and-patients-benefit [Google Scholar]
- 8.OneKey : Healthcare Databases and Solutions. https://www.onekeydata.com/ [Google Scholar]
- 9.Valdez S, Jacobson M: Assessing the quality of SK&A's office-based physician database for identifying oncologists. Med Care Res Rev 79:317-327, 2022 [DOI] [PMC free article] [PubMed] [Google Scholar]
- 10.Rhodes KV, Kenney GM, Friedman AB, et al. : Primary care access for new patients on the eve of health care reform. JAMA Intern Med 174:861-869, 2014 [DOI] [PubMed] [Google Scholar]
- 11.Craig S, Grennan M, Martinez J, et al. : Using Machine Learning Models to Predict Physician-Hospital Integration, 2020. https://faculty.wharton.upenn.edu/wp-content/uploads/2020/08/VI_method.pdf [Google Scholar]
- 12.Agency for Health Care Research and Quality : Compendium of US Health Systems. https://www.ahrq.gov/chsp/data-resources/compendium.html [Google Scholar]
- 13.American Medical Association . AMA Physician Masterfile. https://www.ama-assn.org/about/masterfile/ama-physician-masterfile [Google Scholar]
- 14.Community Oncology Alliance : FACT Sheet: What Is Community Oncology? 2017. https://communityoncology.org/wp-content/uploads/2017/08/What-is-Comm-Onc.pdf [Google Scholar]
- 15.National Council for Prescription Drug Programs. https://www.ncpdp.org/ [Google Scholar]
- 16.Raffo J: MATCHIT: Stata module to match two datasets based on similar text patterns. Statistical Software Components S457992, Boston College Department of Economics, Revised May 20, 2020. https://ideas.repec.org/c/boc/bocode/s457992.html
- 17.US Department of Agriculture : Economic Research Service. Rural-Urban Commuting Area Codes. https://www.ers.usda.gov/data-products/rural-urban-commuting-area-codes.aspx [Google Scholar]
- 18.Centers for Medicare and Medicaid Services : Medicare Provider Utilization and Payment Data: Physician and Other Supplier. https://www.cms.gov/Research-Statistics-Data-and-Systems/Statistics-Trends-and-Reports/Medicare-Provider-Charge-Data/Physician-and-Other-Supplier [Google Scholar]
- 19.Centers for Medicare and Medicaid Services . Risk Adjustment. https://www.cms.gov/Medicare/Health-Plans/MedicareAdvtgSpecRateStats/Risk-Adjustors [Google Scholar]
- 20.Gondhi S, Wright AA, Landrum MB, et al. : Assessment of patient attribution to care from medical oncologists, surgeons, or radiation oncologists after newly diagnosed cancer. JAMA Netw Open 4:e218055, 2021 [DOI] [PMC free article] [PubMed] [Google Scholar]
- 21.Quan H, Sundararajan V, Halfon P, et al. : Coding algorithms for defining comorbidities in ICD-9-CM and ICD-10 administrative data. Med Care 43:1130-1139, 2005 [DOI] [PubMed] [Google Scholar]
- 22.Li B, Evans D, Faris P, et al. : Risk adjustment performance of Charlson and Elixhauser comorbidities in ICD-9 and ICD-10 administrative databases. BMC Health Serv Res 8:12, 2008 [DOI] [PMC free article] [PubMed] [Google Scholar]
- 23.247 Mass Code Regs 6.01. https://www.mass.gov/regulations/247-CMR-600-registration-management-and-operation-of-a-pharmacy-or-pharmacy-department
- 24.Mont Code Ann § 37-2-103 (LexisNexis). https://leg.mt.gov/bills/mca/title_0370/chapter_0020/part_0010/section_0030/0370-0020-0010-0030.html
- 25.NH Rev Stat Ann § 318:29 (LexisNexis). https://law.justia.com/codes/new-hampshire/2021/title-xxx/title-318/section-318-29/
- 26.Integrated Oncology Network . https://ionetwork.com/about-ion/
- 27.US Oncology . https://usoncology.com/
- 28.McKesson : Medication Dispensing. https://www.mckesson.com/Resources/Medication-Dispensing/ [Google Scholar]
- 29.Amerisource Bergen : Optimizing Access and Purchasing Power. https://www.amerisourcebergen.com/provider-solutions/physician-practice-solutions/optimizing-access-and-purchasing-power [Google Scholar]
- 30.Nikpay SS, Richards MR, Penson D: Hospital-physician consolidation accelerated in the past decade in cardiology, oncology. Health Aff (Millwood) 37:1123-1127, 2018 [DOI] [PubMed] [Google Scholar]
- 31.Community Oncology Alliance : Community Oncology Practice Impact Report. Washington, DC, Community Oncology Alliance, 2016 [Google Scholar]
- 32.Community Oncology Alliance : Community Oncology Practice Impact Report. Washington, DC, Community Oncology Alliance, 2018 [Google Scholar]
- 33.Community Oncology Alliance : Community Oncology Practice Impact Report. Washington, DC, Community Oncology Alliance, 2020 [Google Scholar]
- 34.Baker LC, Bundorf MK, Kessler DP: Vertical integration: Hospital ownership of physician practices is associated with higher prices and spending. Health Aff (Millwood) 33:756-763, 2014 [DOI] [PubMed] [Google Scholar]
- 35.Post B, Buchmueller T, Ryan AM: Vertical integration of hospitals and physicians: Economic theory and empirical evidence on spending and quality. Med Care Res Rev 75:399-433, 2018 [DOI] [PubMed] [Google Scholar]
- 36.Baker LC: Acquisition of MRI equipment by doctors drives up imaging use and spending. Health Aff (Millwood) 29:2252-2259, 2010 [DOI] [PubMed] [Google Scholar]
- 37.Mitchell JM: Utilization trends for advanced imaging procedures: Evidence from individuals with private insurance coverage in California. Med Care 46:460-466, 2008 [DOI] [PubMed] [Google Scholar]
- 38.Bishop TF, Federman AD, Ross JS: Laboratory test ordering at physician offices with and without on-site laboratories. J Gen Intern Med 25:1057-1063, 2010 [DOI] [PMC free article] [PubMed] [Google Scholar]
- 39.Scott E, Mitchell JM: Ownership of clinical laboratories by referring physicians: Effect on utilization, charges, and profitability. Med Care 32:164-174, 1994 [DOI] [PubMed] [Google Scholar]
- 40.Jacobson M, O'Malley AJ, Earle CC, et al. : Does reimbursement influence chemotherapy treatment for cancer patients? Health Aff (Millwood) 25:437-443, 2006 [DOI] [PubMed] [Google Scholar]


