

Abstract

The advancement in nanoscale electrochemical tools has offered the opportunity to better understand heterogeneity at electrochemical interfaces. Scanning electrochemical cell microscopy (SECCM) has been increasingly used for revealing local kinetics and the distribution of active sites in electrocatalysis. Constant-contact scanning and hopping scanning are the two commonly used modes. The former is intrinsically faster, whereas the latter enables full voltammetry at individual locations. Herein, we revisit a less used mode that combines the advantages of hopping and constant-contact scan, resulting in a faster voltammetric mapping. In this mode, the nanodroplet cell in SECCM maintains contact with the surface during the scanning and makes intermittent pauses for local voltammetry. The elimination of frequent retraction and approach greatly increases the speed of mapping. In addition, iR correction can be readily applied to the voltammetry, resulting in more accurate measurements of the electrode kinetics. This scanning mode is demonstrated in the oxidation of a ferrocene derivative on HOPG and hydrogen evolution reaction (HER) on polycrystalline Pt, serving as model systems for outer-sphere and inner-sphere electron transfer reactions, respectively. While the kinetics of the inner-sphere reaction is consistent spatially, heterogeneity is observed for the kinetics of HER, which is correlated with the crystal orientation of Pt.
Keywords: scanning electrochemical probe microscopy, polycrystalline Pt, electron back-scattered diffraction, Tafel analysis, iR drop, SECCM
Electrochemical interfaces are fundamentally important in many electrochemical energy storage and conversion devices, including fuel cells, batteries, and electrolyzers.1,2 Functional electrochemical interfaces are inherently complex and often show a high degree of heterogeneity in surface structures, including different crystal facets, grain boundaries, and heterojunctions.3−5 Elucidating the structure–activity relationship at complex electrochemical interfaces is crucial in designing better electrochemical devices.6,7 Unfortunately, conventional bulk electrochemical techniques only measure an averaged activity over an entire electrode with different surface structures. The structure–activity information is lost during the averaging, hindering elucidation of the active sites at the electrochemical interfaces.
Nanoscale scanning electrochemical probe microscopies have been developed to enable local electrochemical measurements to reveal the structure–activity relationship without ensemble averaging.8−11 Among them, scanning electrochemical cell microscopy (SECCM) can reveal the heterogeneity at the electrode surface in electrocatalysis, battery, and other physical electrochemical interfacial processes.12−27 SECCM uses a droplet cell at the end of a glass pipet to confine the electrochemistry to be local within the droplet. Two SECCM scanning modes have been used in most of the reports. One is the constant-contact mode, in which the conductance between a dual-barrel pipet is monitored while the droplet is directly raster-scanned on the substrate with constant contact, as shown in Figure 1a.13,28,29 During the scan, the substrate current is recorded continuously at a constant electrode potential. While constant-contact raster scanning is fast, repetition of the scan in the same area at various potentials is needed to obtain an i–V relationship. Therefore, the voltage resolution in the i–V relationship is often low as it is limited by the number of repetitions.
Figure 1.

Schematics of different scan modes in SECCM: (a) constant-contact scan mode; (b) hopping scan mode; (c) constant-contact voltammetric scan mode. (d) Schematic of dual-barrel SECCM setup.
Another mode is the hopping scan, in which a nanopipet (often a single-barrel one) with the droplet cell is “hopped” between different locations during mapping, as shown in Figure 1b.30 When the droplet approaches and contacts the substrate surface, a faradaic current or double-layer charging current will flow, which serves as the feedback to pause the probe.17 Local electrochemical measurements, including cyclic voltammetry (CV), can be performed when the pipet/droplet is transiently landed at the surface. The pipet is then retracted and hopped to a new location for the subsequent voltammetric measurement. In this mode, the voltage resolution in the i–V relationship is usually high, limited only by the voltammetric scan rate and the data sampling rate. For example, a scan rate of 2 V/s and 1.93 kHz sampling rate will result in a voltage resolution of 1.03 mV. However, the hopping scan requires retraction and approaching at each location, limiting the speed of the overall mapping.
A rarely used mode developed by Güell, Kim, and co-workers, called SECCM-CV, combines the advantage of constant-scan and hopping scan modes.31 This mode is shown in Figure 1c, and the feedback mechanism is the same as the constant-contact scan mode. The pipet is controlled to oscillate vertically, which causes a periodic deformation of the nanodroplet cell significantly only when the droplet contacts the substrate. This periodic deformation results in a periodic conductance change between the two barrels, which is sensitively measured by a lock-in amplifier and used as feedback to maintain consistent droplet contact during the probe scanning (Figure 1d). The nanopipet/droplets make frequent pauses at predefined locations for local voltammetry. In this mode, the voltage resolution in the i–V relationship is high like in the hopping mode, but the overall scanning speed is faster because the frequent approaching and retraction of the nanopipet is eliminated. Additionally, we have recently demonstrated that the solution resistance can be monitored in the dual-barrel pipet setup, enabling iR correction for more accurate electrode kinetics measurement.32 Herein, we apply this faster scanning mode to study the heterogeneity of electrochemical reactions on the electrode surface.
We first validate the SECCM-CV scan mode using an outer-sphere redox molecule: (ferrocenylmethyl) trimethylammonium (FcTMA+). A dual-barrel nanopipet with a ∼960 nm diameter opening was used (scanning electron microscopy image shown in Figure S1). Figure 2a shows three examples of local voltammograms during the constant-contact voltammetric scan. As expected, the current increases as the potential approaches the formal potential of FcTMA+, reaching a limiting current at E > 0.4 V. We observe a small peak at ∼0.33 V in the voltammogram, and this peak is higher in some locations. The presence of the peak cannot be attributed to the transient diffusion behavior because a steady state is expected with the dimension of the nanopipet at the experimental scan rate.32 These peaks are attributed to FcTMA+ adsorption on HOPG, as a previous study has shown that ∼10% of a monolayer can adsorb on HOPG.33Figure 2b–d shows the current maps obtained at different potentials. At 0.33 V, ∼1 pA current differences are observed (Figure 2b), likely reflecting the different adsorption behavior of FcTMA+ on different regions. The cause of this small different adsorption behavior is not clear, likely due to the difference in the local defect density. Nonetheless, the relatively consistent mass-transfer-limiting current shown in Figure 2c suggests the integrity of the pipet is consistent during the constant-contact voltammetric mapping. The half-wave potential (E1/2) at individual locations is shown in Figure 2d, which varies within 5 mV, further suggesting that the voltammetric mapping is consistent for this fast electron transfer redox molecule. These results are comparable to those observed by Unwin and co-workers.31 The additional electrochemical current at ∼0.1 V in the voltammogram is due to the impurity from the commercial FcTMACl (>98%), as can be observed from the voltammogram using purified FcTMAPF6, as shown in Figure S2. A voltammetric movie summarizing the current map as potential continuously sweeps is included as Movie S1.
Figure 2.
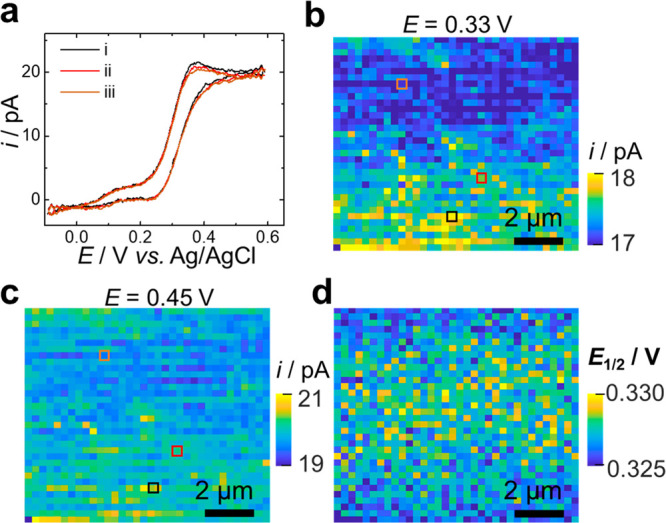
Electrochemical imaging of FcTMA+ oxidation on HOPG using constant contact SECCM-CV mode. (a) Example local cyclic voltammograms acquired by SECCM-CV mode, and the corresponding pixel positions were indicated as colored squares in (b,c). (b,c) Current maps at different applied potentials. (d) Half-wave potential (E1/2) map. Solution: 2 mM FcTMA+ and 10 mM KCl. Scan rate: 1 V/s.
After the validation, we applied the SECCM-CV mode in mapping the activity hydrogen evolution reaction (HER) on polycrystalline Pt, which serves as a model reaction for inner-sphere electron transfer and electrocatalysis. One advantage of using a dual-barrel pipet for SECCM mapping to study the electrocatalytic activity is that the solution resistance can be monitored experimentally, which allows the correction of iR drop for more accurate kinetics measurement, as we have shown recently.32 Specifically, the solution resistance (Rs) can be calculated using the potential bias between the barrels (V2), the current measured from the substrate (i1), and the current measured from the common reference electrode (i2):
| 1 |
The solution resistance calculated using eq 1 during a local voltammetric measurement of HER on Pt is shown in Figure 3a, and the corresponding i–V curves before and after the iR correction are shown in Figure 3b. As the potential is swept negative of −0.4 V vs Ag/AgCl, the local current increases due to the proton reduction and reaches a mass-transfer-limiting plateau of ∼1.7 nA. In the HER region, the solution resistance increases as expected (Figure 3a) because the concentration of H+ is lower near the electrode during HER, resulting in a higher local solution resistance. The electrode potential at the working electrode after iR correction (VWE) can be obtained as we described previously via32
| 2 |
Note that eq 2 not only corrects the iR drop but also corrects the potential drop due to the applied bias between the barrel. The corrected voltammogram is shown as the red curve in Figure 3b. Further Tafel analysis using the iR-corrected voltammogram is shown in Figure 3c, in which the kinetic current is separated from the overall current using34
| 3 |
In eq 3, the ik is the kinetic current, itotal is the total current, and ilim is the mass-transfer-limited current. The Tafel analysis for the voltammogram in Figure 3b yields a Tafel slope of 105 mV/dec.
Figure 3.

(a) Solution resistance during the voltammetric scan. (b) Voltammogram before and after the iR correction. (c) Tafel plot of the kinetic current (ik) to obtain the Tafel slope from linear fitting (dashed line).
A current map using the SECCM-CV showing the spatial distribution of HER activity is displayed in Figure 4a,b, which can be divided into four regions corresponding to different grains as detected from the colocalized crystal orientation map obtained via electron back-scattered diffraction (EBSD) in Figure 4c. A voltammetric movie summarizing the HER local current as a function of potential is shown as Movie S2. At high overpotentials when HER is under mass transfer control (i.e., −0.7 V), the currents at all grains are similar, indicating the consistency of the pipet during the constant-contact SECCM-CV scan. The HER kinetics can be qualitatively assessed by comparing the current at low overpotentials, where the contribution of mass transfer is small. As shown in Figure 4d, the HER activity is followed by grain 1 > grain 4 > grain 2 ≅ grain 3, as indicated by the currents at −0.45 and −0.55 V. This trend can also be observed in the current map (Figure 4a,b). The higher activity from grain 1 is also exemplified by its smaller Tafel slope, as shown in the map in Figure 4e, suggesting a transition of rate-determining steps from the Volmer step to the Heyrovsky step.35 The facet-dependent HER activity on Pt has been studied using single-crystal electrodes, which shows that Pt(110) has the fastest HER kinetics in acid among all three low-index facets.36−38 All of the grains we assessed here are high-index facets, but we observe that the grains closer to the edge of the inverse pole figure, e.g., grain 3 in Figure 4c, show a lower HER activity. The electrochemical mapping coupled with colocalized crystal orientation mapping will allow accessing high activity facets in this pseudo-single-crystal approach as first demonstrated by Aaronson et al.39
Figure 4.

Electrochemical imaging of hydrogen evolution reaction at polycrystalline Pt maps. (a,b) Current maps at −0.4 and −0.55 V (vs Ag/AgCl). (c) Colocalized crystal orientation maps from EBSD. (d) Histograms of current distribution on different grains. Solution: 10 mM HClO4, 10 mM KCl. Scan rate: 2 V/s. (e) Map of Tafel slope.
The constant-contact SECCM-CV mode combines the advantages of high voltage resolution of the hopping scan and the high speed of the constant-contact scan. For example, for the maps in Figure 2, which consist of 1156 local voltammograms, 52 min would be needed using the hopping scan mode with 2 μm/s approaching rate, 5 μm/s retracting rates, 2 μm retraction, and 5 μm/s lateral scan rate. In the SECCM-CV mode, 25 min was spent for the entire scan. This decrease in scanning time would be even more significant when a larger number of local voltammetric scans were to be obtained. In the constant-contact SECCM-CV scan, 92% of the total time is spent on the voltammetry in Figure 2, and the total time can be further shortened by increasing the potential scan rate. To increase the scanning speed, Unwin and co-workers have demonstrated a spiral scan pattern to achieve rates approaching 4 s per frame.40 This scan mode can be directly applied to the new scan mode reported here to increase the scan speed further. Another benefit of the constant-contact SECCM-CV mode, shared with the hopping can mode, is that the scope of electrochemical techniques can be readily extended beyond voltammetry, which can include chronopotentiometry, differential pulse voltammetry, and electrochemical impedance.41−43 One potential concern of the constant-contact scan is that the droplet is dragged on the substrate during the lateral scan, which might cause the extension of the droplet to the residual electrolyte at the previous locations. Note that the footprint of the constant-contact scan in the scanning electron microscopy will not reveal whether this droplet extension occurs during individual voltammetric measurements. The fast rate of evaporation of the nanodroplet is likely to break this extension of droplet connection if any.
In conclusion, we demonstrated the constant-contact SECCM-CV mapping mode in SECCM for faster electrochemical imaging in measuring the oxidation of FcTMA+ and hydrogen evolution reaction on Pt. While the activity for FcTMA+ oxidation is relatively consistent across HOPG, the HER activity is highly correlated with the crystal orientation of Pt. This rarely used SECCM-CV mode allows faster voltammetric mapping than the hopping mode. The ability to rapidly obtain high-density four-dimensional electrochemical data (current as a function of x, y, and potential) offers opportunities for high-throughput electrocatalyst screening when combined with colocalized characterization of the electrocatalysts.
Acknowledgments
Acknowledgment is made to the Donors of the American Chemical Society Petroleum Research Fund for support of this research (61155-DNI5).
Supporting Information Available
The Supporting Information is available free of charge at https://pubs.acs.org/doi/10.1021/acsmeasuresciau.2c00012.
Author Contributions
† Y.W. and M.L. contributed equally.
The authors declare no competing financial interest.
Supplementary Material
References
- Wu F.; Maier J.; Yu Y. Guidelines and Trends for Next-Generation Rechargeable Lithium and Lithium-Ion Batteries. Chem. Soc. Rev. 2020, 49 (5), 1569–1614. 10.1039/C7CS00863E. [DOI] [PubMed] [Google Scholar]
- Stamenkovic V. R.; Strmcnik D.; Lopes P. P.; Markovic N. M. Energy and Fuels from Electrochemical Interfaces. Nat. Mater. 2017, 16 (1), 57–69. 10.1038/nmat4738. [DOI] [PubMed] [Google Scholar]
- Saqib M.; Fan Y.; Hao R.; Zhang B. Optical Imaging of Nanoscale Electrochemical Interfaces in Energy Applications. Nano energy 2021, 90, 106539. 10.1016/j.nanoen.2021.106539. [DOI] [Google Scholar]
- Bentley C. L.; Kang M.; Unwin P. R. Nanoscale Surface Structure-Activity in Electrochemistry and Electrocatalysis. J. Am. Chem. Soc. 2019, 141 (6), 2179–2193. 10.1021/jacs.8b09828. [DOI] [PubMed] [Google Scholar]
- Carvalho O. Q.; Adiga P.; Murthy S. K.; Fulton J. L.; Gutiérrez O. Y.; Stoerzinger K. A. Understanding the Role of Surface Heterogeneities in Electrosynthesis Reactions. iScience 2020, 23 (12), 101814. 10.1016/j.isci.2020.101814. [DOI] [PMC free article] [PubMed] [Google Scholar]
- Trindell J. A.; Duan Z.; Henkelman G.; Crooks R. M. Well-Defined Nanoparticle Electrocatalysts for the Refinement of Theory. Chem. Rev. 2020, 120 (2), 814–850. 10.1021/acs.chemrev.9b00246. [DOI] [PubMed] [Google Scholar]
- Farias M. J. S.; Cheuquepan W.; Camara G. A.; Feliu J. M. Disentangling Catalytic Activity at Terrace and Step Sites on Selectively Ru-Modified Well-Ordered Pt Surfaces Probed by Co Electro-Oxidation. ACS Catal. 2016, 6 (5), 2997–3007. 10.1021/acscatal.6b00439. [DOI] [Google Scholar]
- Polcari D.; Dauphin-Ducharme P.; Mauzeroll J. Scanning Electrochemical Microscopy: A Comprehensive Review of Experimental Parameters from 1989 to 2015. Chem. Rev. 2016, 116 (22), 13234–13278. 10.1021/acs.chemrev.6b00067. [DOI] [PubMed] [Google Scholar]
- Ryu C. H.; Nam Y.; Ahn H. S. Modern Applications of Scanning Electrochemical Microscopy in the Analysis of Electrocatalytic Surface Reactions. Chin. J. Catal. 2022, 43 (1), 59–70. 10.1016/S1872-2067(21)63948-7. [DOI] [Google Scholar]
- Kang M.; Perry D.; Bentley C. L.; West G.; Page A.; Unwin P. R. Simultaneous Topography and Reaction Flux Mapping at and around Electrocatalytic Nanoparticles. ACS Nano 2017, 11 (9), 9525–9535. 10.1021/acsnano.7b05435. [DOI] [PubMed] [Google Scholar]
- Sun T.; Wang D.; Mirkin M. V.; Cheng H.; Zheng J.-C.; Richards R. M.; Lin F.; Xin H. L. Direct High-Resolution Mapping of Electrocatalytic Activity of Semi-Two-Dimensional Catalysts with Single-Edge Sensitivity. Proc. Natl. Acad. Sci. U.S.A. 2019, 116 (24), 11618–11623. 10.1073/pnas.1821091116. [DOI] [PMC free article] [PubMed] [Google Scholar]
- Williams C. G.; Edwards M. A.; Colley A. L.; Macpherson J. V.; Unwin P. R. Scanning Micropipet Contact Method for High-Resolution Imaging of Electrode Surface Redox Activity. Anal. Chem. 2009, 81 (7), 2486–95. 10.1021/ac802114r. [DOI] [PubMed] [Google Scholar]
- Unwin P. R.; Güell A. G.; Zhang G. Nanoscale Electrochemistry of Sp(2) Carbon Materials: From Graphite and Graphene to Carbon Nanotubes. Acc. Chem. Res. 2016, 49 (9), 2041–8. 10.1021/acs.accounts.6b00301. [DOI] [PubMed] [Google Scholar]
- Mefford J. T.; Akbashev A. R.; Kang M.; Bentley C. L.; Gent W. E.; Deng H. D.; Alsem D. H.; Yu Y.-S.; Salmon N. J.; Shapiro D. A.; Unwin P. R.; Chueh W. C. Correlative Operando Microscopy of Oxygen Evolution Electrocatalysts. Nature 2021, 593 (7857), 67–73. 10.1038/s41586-021-03454-x. [DOI] [PubMed] [Google Scholar]
- Tao B.; Yule L. C.; Daviddi E.; Bentley C. L.; Unwin P. R. Correlative Electrochemical Microscopy of Li-Ion (De)Intercalation at a Series of Individual Particles. Angew. Chem., Int. Ed. 2019, 58 (14), 4606–4611. 10.1002/anie.201814505. [DOI] [PMC free article] [PubMed] [Google Scholar]
- Makarova M. V.; Amano F.; Nomura S.; Tateishi C.; Fukuma T.; Takahashi Y.; Korchev Y. E. Direct Electrochemical Visualization of the Orthogonal Charge Separation in Anatase Nanotube Photoanodes for Water Splitting. ACS Catal. 2022, 12 (2), 1201–1208. 10.1021/acscatal.1c04910. [DOI] [Google Scholar]
- Wang Y.; Gordon E.; Ren H. Mapping the Potential of Zero Charge and Electrocatalytic Activity of Metal-Electrolyte Interface Via a Grain-by-Grain Approach. Anal. Chem. 2020, 92 (3), 2859–2865. 10.1021/acs.analchem.9b05502. [DOI] [PubMed] [Google Scholar]
- Bentley C. L.; Kang M.; Unwin P. R. Scanning Electrochemical Cell Microscopy: New Perspectives on Electrode Processes in Action. Curr. Opin. Electrochem. 2017, 6 (1), 23–30. 10.1016/j.coelec.2017.06.011. [DOI] [Google Scholar]
- Yule L. C.; Daviddi E.; West G.; Bentley C. L.; Unwin P. R. Surface Microstructural Controls on Electrochemical Hydrogen Absorption at Polycrystalline Palladium. J. Electroanal. Chem. 2020, 872, 114047. 10.1016/j.jelechem.2020.114047. [DOI] [Google Scholar]
- Wahab O. J.; Kang M.; Unwin P. R. Scanning Electrochemical Cell Microscopy: A Natural Technique for Single Entity Electrochemistry. Curr. Opin. Electrochem. 2020, 22, 120–128. 10.1016/j.coelec.2020.04.018. [DOI] [Google Scholar]
- Hill J. W.; Hill C. M. Directly Visualizing Carrier Transport and Recombination at Individual Defects within 2d Semiconductors. Chem. Sci. 2021, 12 (14), 5102–5112. 10.1039/D0SC07033E. [DOI] [PMC free article] [PubMed] [Google Scholar]
- Choi M.; Siepser N. P.; Jeong S.; Wang Y.; Jagdale G.; Ye X.; Baker L. A. Probing Single-Particle Electrocatalytic Activity at Facet-Controlled Gold Nanocrystals. Nano Lett. 2020, 20 (2), 1233–1239. 10.1021/acs.nanolett.9b04640. [DOI] [PMC free article] [PubMed] [Google Scholar]
- Gao R.; Edwards M. A.; Qiu Y.; Barman K.; White H. S. Visualization of Hydrogen Evolution at Individual Platinum Nanoparticles at a Buried Interface. J. Am. Chem. Soc. 2020, 142 (19), 8890–8896. 10.1021/jacs.0c02202. [DOI] [PubMed] [Google Scholar]
- Lu X.; Li M.; Peng Y.; Xi X.; Li M.; Chen Q.; Dong A. Direct Probing of the Oxygen Evolution Reaction at Single NiFe2O4 Nanocrystal Superparticles with Tunable Structures. J. Am. Chem. Soc. 2021, 143 (41), 16925–16929. 10.1021/jacs.1c08592. [DOI] [PubMed] [Google Scholar]
- Yu Y.; Zhang K.; Parks H.; Babar M.; Carr S.; Craig I. M.; Van Winkle M.; Lyssenko A.; Taniguchi T.; Watanabe K.; Viswanathan V.; Bediako D. K. Tunable Angle-Dependent Electrochemistry at Twisted Bilayer Graphene with Moire Flat Bands. Nat. Chem. 2022, 14 (3), 267–273. 10.1038/s41557-021-00865-1. [DOI] [PubMed] [Google Scholar]
- Wang Y.; Gordon E.; Ren H. Mapping the Nucleation of H2 Bubbles on Polycrystalline Pt Via Scanning Electrochemical Cell Microscopy. J. Phys. Chem. Lett. 2019, 10 (14), 3887–3892. 10.1021/acs.jpclett.9b01414. [DOI] [PubMed] [Google Scholar]
- Li M.; Ye K.-H.; Qiu W.; Wang Y.; Ren H. Heterogeneity between and within Single Hematite Nanorods as Electrocatalysts for Oxygen Evolution Reaction. J. Am. Chem. Soc. 2022, 144 (12), 5247–5252. 10.1021/jacs.2c00506. [DOI] [PubMed] [Google Scholar]
- Ebejer N.; Schnippering M.; Colburn A. W.; Edwards M. A.; Unwin P. R. Localized High Resolution Electrochemistry and Multifunctional Imaging: Scanning Electrochemical Cell Microscopy. Anal. Chem. 2010, 82 (22), 9141–9145. 10.1021/ac102191u. [DOI] [PubMed] [Google Scholar]
- Güell A. G.; Ebejer N.; Snowden M. E.; Macpherson J. V.; Unwin P. R. Structural Correlations in Heterogeneous Electron Transfer at Monolayer and Multilayer Graphene Electrodes. J. Am. Chem. Soc. 2012, 134 (17), 7258–7261. 10.1021/ja3014902. [DOI] [PubMed] [Google Scholar]
- Chen C.-H.; Jacobse L.; McKelvey K.; Lai S. C. S.; Koper M. T. M.; Unwin P. R. Voltammetric Scanning Electrochemical Cell Microscopy: Dynamic Imaging of Hydrazine Electro-Oxidation on Platinum Electrodes. Anal. Chem. 2015, 87 (11), 5782–5789. 10.1021/acs.analchem.5b00988. [DOI] [PubMed] [Google Scholar]
- Güell A. G.; Cuharuc A. S.; Kim Y.-R.; Zhang G.; Tan S.-y.; Ebejer N.; Unwin P. R. Redox-Dependent Spatially Resolved Electrochemistry at Graphene and Graphite Step Edges. ACS Nano 2015, 9 (4), 3558–3571. 10.1021/acsnano.5b00550. [DOI] [PubMed] [Google Scholar]
- Blount B.; Juarez G.; Wang Y.; Ren H. iR Drop in Scanning Electrochemical Cell Microscopy. Faraday Discuss. 2022, 233, 149–162. 10.1039/D1FD00046B. [DOI] [PubMed] [Google Scholar]
- Cuharuc A. S.; Zhang G.; Unwin P. R. Electrochemistry of Ferrocene Derivatives on Highly Oriented Pyrolytic Graphite (HOPG): Quantification and Impacts of Surface Adsorption. Phys. Chem. Chem. Phys. 2016, 18 (6), 4966–4977. 10.1039/C5CP06325F. [DOI] [PubMed] [Google Scholar]
- Hill C. M.; Kim J.; Bard A. J. Electrochemistry at a Metal Nanoparticle on a Tunneling Film: A Steady-State Model of Current Densities at a Tunneling Ultramicroelectrode. J. Am. Chem. Soc. 2015, 137 (35), 11321–11326. 10.1021/jacs.5b04519. [DOI] [PubMed] [Google Scholar]
- Shinagawa T.; Garcia-Esparza A. T.; Takanabe K. Insight on Tafel Slopes from a Microkinetic Analysis of Aqueous Electrocatalysis for Energy Conversion. Sci. Rep. 2015, 5 (1), 13801. 10.1038/srep13801. [DOI] [PMC free article] [PubMed] [Google Scholar]
- Kobayashi S.; Tryk D. A.; Uchida H. Enhancement of Hydrogen Evolution Activity on Pt-Skin/Pt3Co [(111), (100), and (110)] Single Crystal Electrodes. Electrochem. Commun. 2020, 110, 106615. 10.1016/j.elecom.2019.106615. [DOI] [Google Scholar]
- Marković N. M.; Grgur B. N.; Ross P. N. Temperature-Dependent Hydrogen Electrochemistry on Platinum Low-Index Single-Crystal Surfaces in Acid Solutions. J. Phys. Chem. B 1997, 101 (27), 5405–5413. 10.1021/jp970930d. [DOI] [Google Scholar]
- Leiva E. P. M.; Santos E.; Iwasita T. The Effect of Adsorbed Carbon Monoxide on Hydrogen Adsorption and Hydrogen Evolution on Platinum. J. Electroanal. Chem. Interfacial Electrochem. 1986, 215 (1–2), 357–367. 10.1016/0022-0728(86)87028-0. [DOI] [Google Scholar]
- Aaronson B. D. B.; Chen C.-H.; Li H.; Koper M. T. M.; Lai S. C. S.; Unwin P. R. Pseudo-Single-Crystal Electrochemistry on Polycrystalline Electrodes: Visualizing Activity at Grains and Grain Boundaries on Platinum for the Fe2+/Fe3+ Redox Reaction. J. Am. Chem. Soc. 2013, 135 (10), 3873–3880. 10.1021/ja310632k. [DOI] [PubMed] [Google Scholar]
- Momotenko D.; Byers J. C.; McKelvey K.; Kang M.; Unwin P. R. High-Speed Electrochemical Imaging. ACS Nano 2015, 9 (9), 8942–8952. 10.1021/acsnano.5b02792. [DOI] [PubMed] [Google Scholar]
- Cheng L.; Jin R.; Jiang D.; Zhuang J.; Liao X.; Zheng Q. Scanning Electrochemical Cell Microscopy Platform with Local Electrochemical Impedance Spectroscopy. Anal. Chem. 2021, 93 (49), 16401–16408. 10.1021/acs.analchem.1c02972. [DOI] [PubMed] [Google Scholar]
- Daviddi E.; Gonos K. L.; Colburn A. W.; Bentley C. L.; Unwin P. R. Scanning Electrochemical Cell Microscopy (SECCM) Chronopotentiometry: Development and Applications in Electroanalysis and Electrocatalysis. Anal. Chem. 2019, 91 (14), 9229–9237. 10.1021/acs.analchem.9b02091. [DOI] [PubMed] [Google Scholar]
- Hutton L. A.; Newton M. E.; Unwin P. R.; Macpherson J. V. Factors Controlling Stripping Voltammetry of Lead at Polycrystalline Boron Doped Diamond Electrodes: New Insights from High-Resolution Microscopy. Anal. Chem. 2011, 83 (3), 735–45. 10.1021/ac101626s. [DOI] [PubMed] [Google Scholar]
Associated Data
This section collects any data citations, data availability statements, or supplementary materials included in this article.