Abstract
Accumulation of pathological tau aggregates is a prominent feature in tauopathies that leads during the course of the diseases to neuronal dysfunction before and cell death after. Microglia and astrocytes have been described as playing important roles in synaptic spreading of toxic tau in several neurodegenerative diseases (NDs). Here, we have investigated the immunological and biochemical properties of aggregated tau species in different brain cell types in tau‐induced neurodegenerative diseases such as Alzheimer's disease (AD), progressive supranuclear palsy (PSP), and dementia with Lewy bodies (DLB). Additionally, we examined nuclear size, nuclear density, and chromatin compaction in neuronal and glial cells from diseased brain tissues. Microscopic‐histological examination was performed using in‐house mouse monoclonal antibodies for toxic tau conformers (TTC‐M1 and TTC‐M2) and tau oligomers (TOMA1‐4). By immunohistochemistry and co‐immunofluorescence assays using TOMA/TTC‐Ms and cell‐type specific markers for neurons, astrocytes, and microglia, we observed that TOMA/TTC‐Ms were immunoreactive to diverse tau species in different cell types. Analysis of colocalization coefficients indicated an increased pathological tau deposition mainly in the neurons. Western blot analysis of brain homogenates using TOMA/TTC‐Ms revealed distinct patterns of tau aggregation in each disease, suggesting that TOMA/TTC‐Ms can distinguish between different tau aggregates present in different tauopathies. Additionally, using DAPI staining, we observed that neuronal and astrocytic nuclei had significantly greater nuclear area and increased chromatin compaction in AD cortices compared to non‐demented controls. In contrast, reduction in nuclear density/area and more relaxed chromatin was noticed in DLB neurons, astrocytes and microglia and PSP astrocytes and microglia. Cell‐type specific tropism of toxic tau species in tauopathies will provide a greater understanding of the involvement of different brain cell types in tau pathology. In this study, we observed that each disease presented cell‐type specific nuclear phenotype and tau deposition pattern.
Keywords: glia, neuron, nuclei, tau conformers, tauopathies
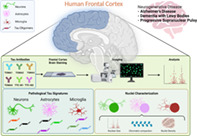
Schematic depicting characterization of pathological tau signatures and nuclear alterations in neurons, astrocytes and microglia in neurodegenerative diseases.
1. INTRODUCTION
Neurodegenerative diseases (NDs) are a major cause of morbidity and mortality in the aging population, with its treatment being one of the greatest challenges today. NDs encompass a multitude of cerebral proteinopathies which are characterized by the deposition of insoluble protein aggregates in neurons and non‐neuronal cells leading to cognitive, motor, and behavioral deficits [1]. Advances in neuropathology have allowed for a classification system for NDs grouping them based on varying protein accumulation. One of such groups is tauopathies [2, 3]: NDs characterized by the accumulation of misfolded microtubule‐associated protein tau. Tauopathies include more than 20 clinicopathological entities, including Alzheimer's disease (AD) and progressive supranuclear palsy (PSP). Other proteinopathies, such as dementia with Lewy bodies (DLB), belong to the group of alpha‐synucleinopathies [4]. However, tau pathology is a frequent comorbidity in multiple neurodegenerative diseases, as observed also in DLB [5]. Since most of the abnormal protein aggregation in NDs occurs in the cytoplasm, research has primarily focused on the biochemistry of the cytoplasmic compartment of the cell. However, recent data indicates that disease progression may also lie within the nucleus via changes in splicing, expression, and regulation of the genes that encode for disease‐relevant proteins. The discovery that abnormal protein aggregation also occurred in the nucleus was initially made in Huntington's disease [6], which pushed research toward studying nuclear changes and the role it plays in ND progression. The debate is unresolved on whether nuclear changes result in intranuclear pathogenic events or if nuclear alterations are the consequences of the neurodegenerative process itself. While the chronology of the cause‐and‐effect relationship is still unknown, studying the nucleus in these NDs could lead to the development of specific therapies that might have the ability to target and correct specific disease‐related gene expressions.
The various neurodegenerative diseases are all characterized by unique histopathological changes but result in an overall generalizable change in cell morphology with loss of synapses, retraction of dendrites, axonal degeneration, and cell body shrinkage. Tauopathies are characterized by the aggregation of misfolded tau proteins. In tauopathies, misfolded tau proteins detach from the microtubule, destabilizing it and compromising the structure of cytoskeleton, resulting in nuclear dissolution [7]. Alternatively, misfolded tau can modify neuronal signaling, leading to pathological changes that result in the symptoms of dementia or mitochondrial dysfunction and cell death [8]. Although, the exact path by which pathological tau causes neuronal death is still unclear, all the proposed mechanisms result in eventual increased cell death, a characteristic of NDs. This process of cell death leads to chromosomal dissolution, nuclear shrinkage, and ultimately nuclear dissolution resulting in the overall characteristic cortical shrinkage.
In addition to the changes caused by tau aggregation, tauopathies are also characterized by a dysfunction in Lamin, the filamentous meshwork that provides support for highly condensed heterochromatic DNA and its attachment to the nuclear envelope [8]. The dysfunction of Lamin leads to the relaxation of heterochromatic DNA, which eventually results in neuronal death. Recent studies have shown that irregular protein folding results in lamina dysregulation concentrated in the nucleus. This dysregulation promotes cell death and genome instability [9] in tauopathies, demonstrating that Lamin pathology plays a role in tau‐mediated neurotoxicity [10, 11]. This provides strong evidence for an alternative pathway for tau‐mediated neuronal death that can be utilized for the treatment of neurodegenerative disorders.
Neuroinflammation, alongside misfolded protein deposition, is associated with neurodegenerative diseases. Microglia and astrocytes are key regulators of inflammatory responses in the central nervous system (CNS) in response to oligomeric tau [12, 13, 14, 15, 16]. The activation of microglia and astrocytes is heterogeneous and traditionally dichotomized into neuroprotective and neurotoxic phenotypes [17]. This phenomenon has been most thoroughly researched in Alzheimer's disease [18]. These immunological protective activities involve the activation of microglia to a disease‐associated microglia (DAM) state. When factors such as aging, genetic susceptibility, along with insufficient microglial functionality accumulate, tau pathology mounts in neurons. The resulting pathology induces microglia into an inflammatory state through which neuronal injury is compounded. This classification system of different phenotypes is a simple means of grouping the different phenotypes that these cells can acquire during the progression of these diseases. The dysfunction of these immune‐resolution processes during late‐stage disease progression eventually leads to irreversible neuronal loss that is characteristic of NDs as a whole.
Previous studies suggest that tau is present in human brain nuclei [19, 20] and that its aggregation occurs in both neuronal cytoplasm and nuclei [20]. However, the exact mechanism and characteristics of this toxicity remains unclear. While studies have investigated the cellular characteristics of neurons in neurodegenerative diseases, the current study takes on the novel task of comparing and characterizing nuclear changes and pathological tau signatures in neurons, astrocytes, and microglia. Understanding the changes seen in various cell types in tauopathies, can reveal a greater range of mechanisms to target for therapeutic purposes, expanding the possibilities of treatment.
Recently, we reported that conformation‐specific mouse monoclonal antibodies generated against tau oligomers, TOMA1 and TOMA2, selectively detect aggregated tau pathology in the brain tissues of P301L mice and human AD, ALS, FTD and Huntington's disease patients [20, 21, 22]. Here, we report the generation of two more clones of TOMAs, TOMA3 and TOMA4 along with two other mouse monoclonal antibodies that recognize toxic tau conformations, TTC‐M1 and TTC‐M2. In addition to characterizing all the new antibodies, we have further expanded our analyses of TOMA1 and TOMA2 in a cohort of pathologically diagnosed AD, DLB and PSP patients. In this study we evaluate and compare nuclear size, nuclear density, chromatin compaction grade and cell‐type‐specific tau deposition in AD, DLB and PSP cortical sections. New evidence of distinct pathological phenotypes in each disease urges investigators to analyze cell pathology within the context of each ND. Furthermore, this approach could explore pathological phenotypes of TDP‐43 and α‐synuclein proteins, establishing cell‐type vulnerability pattern in other neurodegenerative diseases, such as frontotemporal dementia (FTD) and Parkinson disease (PD). With the use of newly developed antibodies specific for different conformers of tau, we studied the cell‐type‐specific deposition of toxic tau species, revealing a deep difference in immunoreactivity between neurons, astrocytes, and microglia within the human brain.
2. METHODS AND MATERIALS
2.1. Human tissue processing
Postmortem frontal cortex tissue from subjects with AD, DLB, PSP and age‐matched controls (Ctr) was provided as frozen blocks by the University of Kentucky Alzheimer's Disease Center Tissue Bank and Oregon Brain Bank after approval by the Institutional Ethics Committee (Table 1). The samples were homogenized in 1× phosphate‐buffered saline (PBS) mixed with a protease inhibitor cocktail (Roche) and phosphatase inhibitor (Sigma) at a 1:3 (w/v) dilution of brain tissue:PBS. Samples were then centrifuged at 11,000g for 20 min at 4°C. The supernatants (PBS‐soluble fractions) were aliquoted, snap‐frozen in liquid nitrogen, and stored at −80°C. The pellets (insoluble fractions) were resuspended in homogenization buffer (1× PBS), aliquoted and frozen at −80°C until use [20].
TABLE 1.
Brain tissues analyzed in this study from diseased and age‐matched control subjects
| Clinical diagnosis | Case number | Age | Sex | PMI (h) | Braak stage (0–6) |
|---|---|---|---|---|---|
| Control | 1092 | 86 | F | 1.75 | 1 |
| Control | 1106 | 79 | M | 1.75 | 2 |
| Control | 1153 | 75 | F | 3.50 | 1 |
| Control | 1170 | 84 | F | 2.50 | 1 |
| Control | 1925 | 88 | F | 19.00 | N/A |
| Control | 1965 | 89 | F | 5.50 | N/A |
| AD | 1104 | 90 | M | 3.25 | 6 |
| AD | 1120 | 83 | F | 4.75 | 6 |
| AD | 1154 | 86 | M | 3.25 | 6 |
| DLB | 887 | 67 | F | 12.00 | N/A |
| DLB | 1316 | 87 | M | 6 | N/A |
| DLB | 2083 | 71 | M | 6 | 5 |
| DLB | 2140 | 89 | M | 3.00 | N/A |
| PSP | 1569 | 66 | F | 12.00 | N/A |
| PSP | 1972 | 79 | F | 6.00 | N/A |
| PSP | 2010 | 84 | M | 4.5 | N/A |
| PSP | 2114 | 79 | M | 12 | 3 |
| PSP | 2121 | 85 | M | 7 | 4 |
2.2. Generation of TTC‐M antibodies
Mouse monoclonal TTC‐M antibodies were generated by GenScript (NJ, USA). Recombinant tau oligomers were prepared following our published protocol [23] and used as antigen. Briefly, purified lyophilized monomeric tau was dissolved in 1× PBS keeping the final concentration 0.5 mg/ml and stirred overnight in a fume hood at room temperature. The resulting tau oligomers were purified by fast protein liquid chromatography (Superdex 200 HR 10/30 column: GE Healthcare). The tau oligomers were characterized as described [24]. The TTC‐Ms were generated by GenScript through clonal selection of hybridoma cells and their cultured media were received. After multiple screenings of several clones, TTC‐M1 and TTC‐M2 were chosen. The specificity of TTC‐M1 and TTC‐M2 were determined by enzyme‐linked immunosorbent assay, dot blots and WB using oligomeric and monomeric tau. Aβ oligomers were used to rule out their cross‐reactivity to other amyloid oligomers.
2.3. Generation of TOMAs
All the four clones of TOMAs were generated as we discussed previously for the first TOMA (Diana 2014). Briefly, recombinant tau oligomers (discussed above) mixed with Freund's complete adjuvant were used as antigen. Following clonal selection of hybridoma cells, four clones (TOMA1‐4) were chosen based on thorough characterization. The four clones were sequenced and used for generating stable cell lines by GenScript. All the antibodies used in this study are purified and produced by GenScript.
2.4. Immunolabeling of fixed human brain sections
Frozen human brain sections were first fixed in chilled 20% methanol for 20 min and then permeabilized in 70% ETOH for 5 min. After 1‐h blocking in PBS/5% goat serum at RT, the sections were incubated for 10 min with 0.1% (w/v) Sudan Black B solution to quench any autofluorescence. After further washing in PBS, the sections were incubated in primary antibodies diluted in Ab diluent overnight at 4°C. Immunolabeling for TOMA1 (1:100), TOMA2 (1:250), TOMA3 (1:200), TOMA4 (1:100), TTC‐M1 (1:1000, Genscript) and TTC‐M2 (1:1000, Genscript) was performed in all cases. The next day, sections were washed three times in PBS (5 min each), and secondary antibodies were applied as described for Alexa Fluor 633 goat anti‐mouse IgG for TOMAs, TTC‐M1 and TTC‐M2 (1:1000, A21052, Thermo Fisher Scientific). After further washing in PBS, the sections were incubated for 30 min with AffiniPure Fab Fragment goat anti‐mouse IgG (1:30, 115‐007‐003, Jackson ImmunoResearch). One more PBS wash was completed before overnight incubation at 4°C for respective primary staining of neurons: recombinant anti‐NeuN ab rabbit Alexa Fluor 488 (1:250, ab190195, Abcam); astrocytes: anti‐GFAP ab chicken (1:500, ab4676, Abcam); and microglia: Iba1 Polyclonal guinea pig antiserum (1:100, 234004, Synaptic Systems) with purified anti‐Tau5 (1:300, 806402, BioLegend), phosphoS139 Histone H2A.X (1:100, ab206898, Abcam). The next day, sections were washed three times in PBS (5 min each), and secondary antibodies were applied as described for goat pAb to chicken IgY Alexa Fluor 488 (1:1000, ab150169, Abcam) for astrocytes and goat pAb to guinea pig IgG Alexa Fluor 488 (1:1000, ab150185, Abcam) for microglia in addition to secondary Alexa Fluor 568 goat anti‐mouse (1:1000, A11031, Thermo Fisher Scientific) on all slides. After a final wash in PBS, the slides were then mounted with Prolong Gold Antifade with DAPI (Thermo Fisher Scientific P36931) to stain the nuclei as previously described [20]. Cell markers used include: NeuN, glial fibrillary acidic protein (GFAP) and Iba1 derived from different species compared to TOMA/TTC‐Ms to reduce as many non‐specific immunoreactions and overlapping signals as possible. Labeled primary have been used to minimize secondary antibodies use.
2.5. Immunofluorescence imaging and analysis
Micrographs from human tissue samples were obtained from three independent experiments with similar results, and all figures show representative micrographs. All pictures were captured with Keyence BZ‐X700 microscope from Keyence Company. Analyses of nuclei and TTCs foci were performed on a BZ‐X Analyzer using three regions of interest (ROIs) for each set of experiments. Area, area ratio, integrated density, and number and density of nuclei were measured and stored. Pearson's coefficient correlation (PCC) analysis has been performed with FIJI ImageJ (NIH Software).
2.6. Immunohistochemistry of human brain tissue
Immunohistochemistry (IHC) was performed on frozen brain sections. In brief, sections were fixed with chilled methanol followed by blocking with goat serum for 1 h. Next, sections were incubated with primary antibodies TOMA1 (1:350), TOMA2 and TOMA3 (1:450), TOMA4 (1:250), TTC‐M1 (1:1000), TTC‐M2 (1:1500) and Tau5 (1:500) overnight at 4°C. The next day, sections were washed in PBS three times (10 min each) and then incubated with biotinylated goat anti‐mouse IgG secondary antibody (1:200, Vectastain ABC Kit, #PK4002, Vector Laboratories) for 1 h at room temperature. Sections were then washed four times (10 min each) in PBS and incubated with ABC solution (Vector Laboratories) for 1 h according to the manufacturer's instructions. Next, sections were counterstained with hematoxylin (Vector Laboratories, H‐3401) for nuclei staining and mounted. Images were acquired with a Keyence BZ‐800 Microscope using 40× objective and analyzed using BZ‐X Analyzer.
2.7. Brain homogenates and western blotting
Western blot analyses were performed with brain homogenates from Ctr, AD, DLB and PSP human tissues. Approximately 10 μg of protein preparations were loaded on precast NuPAGE 4%–12% Bis–Tris gels (Invitrogen) for sodium dodecyl sulfate polyacrylamide gel electrophoresis. Proteins were subsequently transferred onto nitrocellulose membranes and blocked overnight in 10% nonfat dry milk at 4°C. Membranes were then probed for 1 h at RT using primary antibodies against TOMA1 (1:100), TOMA2 (1:100), TOMA3 (1:100), TOMA4 (1:100), TTC‐M1 (1:1000), TTC‐M2 (1:10,000) and Pan‐Tau (1:10,000, Tau13 Biolegend—835204), GAPDH (1:1000) diluted in 5% nonfat dry milk. TOMA/TTC‐Ms immunoreactivities were detected with a horseradish peroxidase (HRP)‐conjugated anti‐rabbit IgG (1:6000, GE Healthcare). Immunoreactivity for other antibodies was detected using an anti‐mouse IgG (1:6000, GE Healthcare) diluted in 5% nonfat milk. Enhanced chemiluminescence (ECL) plus (GE Healthcare) was used for band visualization. GAPDH was probed to normalize and quantify proteins, respectively.
2.8. Precision of the procedure used to estimate the total number of nuclei in Ctr, AD, DLB and PSP brain sections
To evaluate the precision of the estimates of the total number of nuclei, the mean of the coefficients of error (CEs) of the induvial estimates, CE, was calculated for each group. The relative variance of the estimate of density was calculated as the square of the coefficient of error, CE (CE is the standard error of the mean divided by the mean, SEM/mean) of the 18 measures of numerical density made in each case. The relative variance of the estimate, CE2, was estimated with the quadratic approximation formula of Gundersen et al. using a smoothness factor m = 0 [25, 26, 27] and a shape factor (b) given by equation:
shape factor (b), nuclear area (A) and nuclear perimeter (p). Nuclear morphology depends on shape factor (b) determination factor [25, 26]. Intra‐subjects CE estimated CEAD1154: 0.024, CEAD1120: 0.024, CEAD1104: 0.022, Mean CEAD: 0.023. CEDLB887: 0.036, CEDLB2140: 0.030; Mean CEDLB: 0.033. CEPSP1569: 0.030, CEPSP2010: 0.030, CEPSP1972: 0.034; Mean CEPSP: 0.031.
2.9. Statistical analysis and reproducibility
GraphPad 9.0 Software was used to generate graphs and perform statistical analyses. All data are presented as means ± SD (standard deviation) and were analyzed using GraphPad Prism Software 6.0. Statistical analyses among case numbers within each group were carried out using Student's t‐tests or one‐way analyses of variance (ANOVAs). Groups were compared with one‐way ANOVA using neurodegenerative disease as the independent variable. Colocalization profiles were produced using NIH Software ImageJ FIJI, and Pearson's colocalization coefficient (PCC) was presented as an averaged coefficient of determination, R 2. As with morphometric analysis, statistical analyses among case numbers within each group were carried out using Student's t‐tests or one‐way analyses of variance (ANOVAs), and groups were compared with one‐way ANOVA using neurodegenerative disease as the independent variable.
3. RESULTS
3.1. Identification of different tau variants in AD, DLB and PSP brain cortices
The immunoreactivity of TTC‐M1 and TTC‐M2 antibodies to tau deposits was evaluated in neurons, astrocytes, and microglia by co‐immunofluorescence (Co‐IF). We evaluated the specificity of TTC‐M1 and TTC‐M2 staining in Ctr, AD, PSP and DLB brain sections by co‐staining with a commercial tau antibody (Tau5). To measure the grade of colocalization, Pearson's correlation coefficient (PCC) was measured and plotted. Co‐IF showed positive tau aggregates in AD, DLB and PSP tissues. TTC‐M1 and TTC‐M2 showed a stronger immunoreactivity in AD and PSP tissues compared to DLB (Figure 1A,C). PCC analysis showed a significant colocalization in all the diseases of TTC‐M1 with NeuN in AD (p = 0.0001), DLB (p = 0.0019) and PSP (p < 0.0001) (Figure 1B) and TTC‐M2 with NeuN in AD (p = 0.0011) and PSP (p = 0.0188) (Figure 1D). There was no significance observed in the colocalization of TTC‐M2 with NeuN in DLB compared to the controls. These results indicate that there are greater TTC‐M immunoreactive tau deposits in the human cortical neurons of diseased brains compared to the controls.
FIGURE 1.
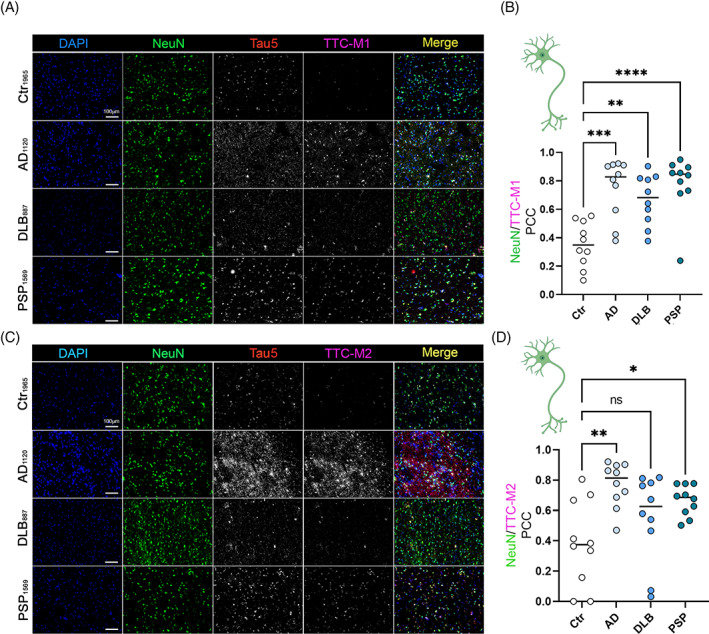
Deposition of tau conformers in neurons. Immunofluorescence staining of AD, DLB, and PSP brain cortices with antibodies for toxic tau conformers TTC‐M1 (A), TTC‐M2 (C) and NeuN for neurons (magnification: 20×, white scale bar: 100 μm). (B) Bar graph of NeuN/TTC‐M1 colocalization in Ctr, AD, DLB and PSP brains. (D) bar graph of NeuN/TTC‐M2 colocalization in Ctr, AD, DLB and PSP brains. Analysis was conducted via one‐way ANOVA *p < 0.05; **p < 0.01; ***p < 0.001; ****p < 0.0001.
Similar approach and analysis were adopted to evaluate TTC‐M1 and TTC‐M2 immunoreactivity for astrocytic tau deposition. Significant colocalization of TTC‐M1 with GFAP in AD (p < 0.0001) and DLB (p = 0.0001) was observed (Figure 2A,B). No significant correlation between TTC‐M1 and GFAP was observed in PSP brains compared to Ctr brains. Interestingly, no correlation between TTC‐M2 and GFAP was observed in any pathology (Figure 2C,D). These results suggest that TTC‐M1, but not TTC‐M2, recognizes tau aggregates in astrocytes, indicating the presence of TTC‐M1 positive tau oligomers in neurons and astrocytes of the diseased brains.
FIGURE 2.
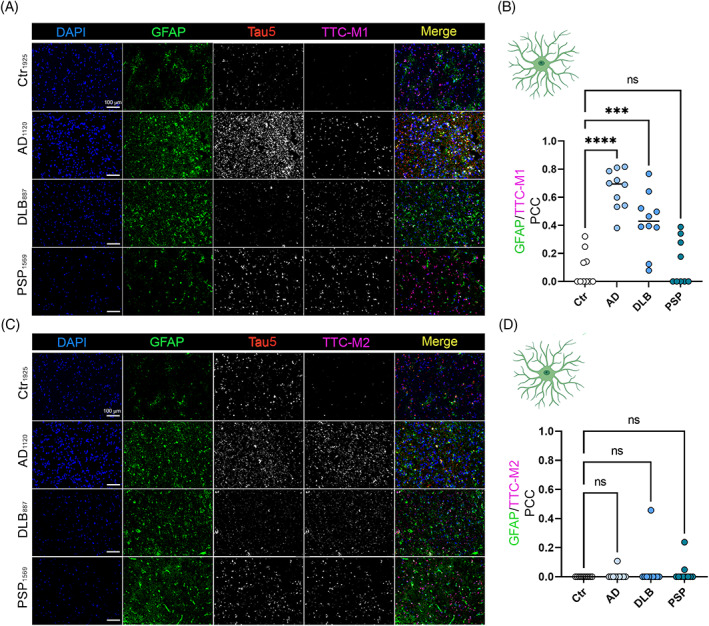
Deposition of tau conformers in astrocytes. Immunofluorescence staining of AD, DLB, and PSP cortices with antibodies for toxic tau conformers TTC‐M1 (A)/TTC‐M2 (C) and GFAP for astrocytes (magnification: 20×, white scale bar: 100 μm). (B) Bar graph of GFAP/TTC‐M1 colocalization in Ctr, AD, DLB and PSP brains. (D) bar graph of GFAP/TTC‐M2 colocalization in Ctr, AD, DLB and PSP brains. Analysis was conducted via one‐way ANOVA *p < 0.05; **p < 0.01; ***p < 0.001; ****p < 0.0001.
In microglia Co‐IF, we observed a positive correlation between Iba1 and TTC‐M1 staining in AD (p < 0.0001), DLB (p < 0.0001) and PSP (p < 0.0001) but with a large PCC variation (Figure 3A,B) among microglia cells analyzed. The only significant correlation of TTC‐M2 and Iba1 was seen in DLB microglia (p = 0.0266). No significant positive correlation in AD and PSP microglial cells was detected. The trend of colocalization of tau deposits in glial cells confirmed that specific tau aggregates are associated with immune response cells, indicating a disease‐specific immunomodulation. Colocalization PCC comparison dot plots of neurons, astrocytes and microglia stained with TTC‐M1 and TTC‐M2 Abs is represented in Figure S1.
FIGURE 3.
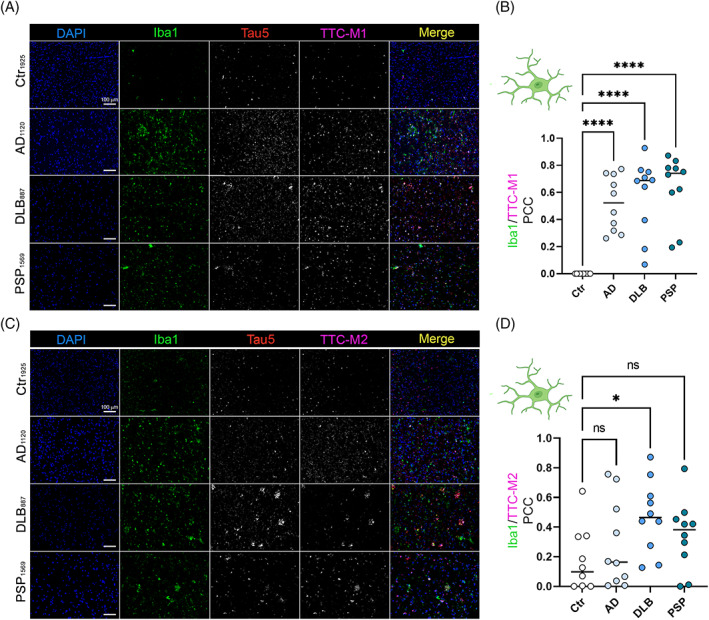
Deposition of tau conformers in microglia. Immunohistochemistry staining of neurodegenerative disease cases (AD, DLB, and PSP) with toxic tau conformers TTCM1 (A)/TTCM2 (C) and Iba1 for microglia (magnification: 20×, white scale Bar: 100 μm). (B) Bar graph of Iba1/TTC‐M1 colocalization in Ctr, AD, DLB and PSP brains. (D) Bar graph of Iba1/TTC‐M2 colocalization in Ctr, AD, DLB and PSP brains. Analysis was conducted via one‐way ANOVA *p < 0.05; **p < 0.01; ***p < 0.001; ****p < 0.0001.
3.2. Immunological distinction of tau aggregates by TOMAs in AD, DLB and PSP brain cortices
To immunologically distinguish tau aggregates from different tauopathies, we investigated and compared the pattern of TOMA immunoreactivity for tau oligomers. In Co‐IF analysis of AD, DLB and PSP brain cortices, each of the TOMA antibodies was applied separately in combination with each cell‐type marker. Immunofluorescence signal was measured by PCC analysis for each TOMA in either neurons, astrocytes, or microglia. In AD, all TOMAs showed a positive immunoreactivity in neurons (Figure 4A). TOMA1, TOMA3 and TOMA4 showed tau oligomers in neuronal cell bodies and neuronal projections. TOMA2 showed a positive signal predominantly located in the cell bodies and neuronal nuclei. TOMA3 showed higher PCC in neurons compared to TOMA2 while TOMA1 and TOMA4 showed a low colocalization in the neurons (Figure 4D). In astrocytes, only TOMA1 showed certain degree of colocalization (Figure 4B,E). TOMA2, TOMA3 and TOMA4 did not show positive correlation in astrocytes. On the contrary, microglia showed positive colocalization with TOMA2 and TOMA3 and a lower level with TOMA4 and TOMA1 (Figure 4C–F). In summary, TOMAs showed a significantly higher positive correlation between colocalizing with microglia compared to astrocytes. Tau5 versus TOMAs PCC was measured to confirm the specificity between in‐house TOMAs and commercial tau Ab (Figure 4G).
FIGURE 4.
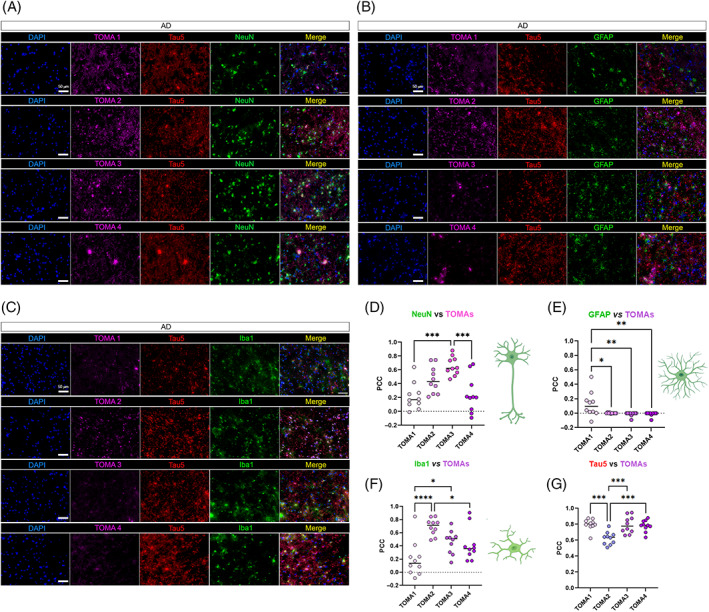
TOMAs signatures in AD brain cortices. (A) Representative co‐IF of TOMA1‐4 (magenta) from the top to the bottom with NeuN (green), Tau5 (red) and nuclei (DAPI—blue). Magnification 40×, white scale bar, 50 μm. (B) Representative co‐IF of TOMA1‐4 (magenta) with GFAP (green), Tau5 (red) and nuclei (DAPI—blue). Magnification 40×, white scale bar, 50 μm. (C) Representative co‐IF of TOMA1‐4 (magenta) with Iba1 (green), Tau5 (red) and nuclei (DAPI—blue). Magnification 40×, white scale bar, 50 μm. All channels are represented singularly and merged. All the images are obtained from the same case number (D) NeuN/TOMAs PCC dot plots in 10 neurons. (E) GFAP/TOMAs PCC dot plots in 10 astrocytes. (F) NeuN/TOMAs PCC dot plots in 10 microglial cells (G) Tau5/TOMAs PCC dot plots in 10 regions of interests of AD tissue. Analysis was conducted via one‐way ANOVA and Tukey's multiple comparison test *p < 0.05; **p < 0.01; ***p < 0.001; ****p < 0.0001.
The same approach was used in DLB brains (Figure 5). DLB neurons showed immunoreactivity and colocalization with all TOMAs (Figure 5A,D). Astrocytes were positively correlated with TOMA1, TOMA3 and TOMA4 but not with TOMA2 (Figure 5B,E). In DLB, microglia co‐stained with TOMA2 showed a strong immunoreactivity and colocalization, compared to TOMA1, TOMA3 and TOMA4 (Figure 5C,F). Tau 5 was used as the control antibody in all the TOMA and cell marker combinations showing the specificity of TOMAs for recognizing oligomeric tau in different cell types in DLB (Figure 5G).
FIGURE 5.
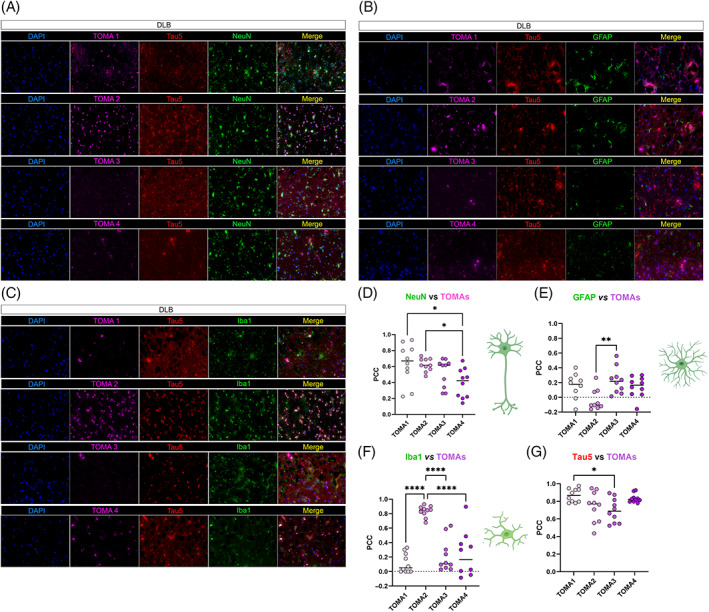
TOMAs signatures in DLB brain cortices. (A) Representative co‐IF of TOMA1‐4 (magenta) from the top to the bottom with NeuN (green), Tau5 (red) and nuclei (DAPI—blue). Magnification 40×, white scale bar, 50 μm. (B) Representative co‐IF of TOMA1‐4 (magenta) with GFAP (green), Tau5 (red) and nuclei (DAPI—blue). Magnification 40×, white scale bar, 50 μm. (C) Representative co‐IF of TOMA1‐4 (magenta) with Iba1 (green), Tau5 (red) and nuclei (DAPI—blue). Magnification 40×, white scale bar, 50 μm. All channels are represented singularly and merged. All the images are obtained from the same case number. (D) NeuN/TOMAs PCC dot plots in 10 neurons. (E) GFAP/TOMAs PCC dot plots in 10 astrocytes. (F) NeuN/TOMAs PCC dot plots in 10 microglial cells. (G) Tau5/TOMAs PCC dot plots in 10 regions of interests of DLB tissue. Analysis was conducted via one‐way ANOVA and Tukey's multiple comparison test *p < 0.05; **p < 0.01; ***p < 0.001; ****p < 0.0001.
In PSP neurons, all TOMAs showed strong immunoreactivity and colocalization (Figure 6A,D) with TOMA 1, 2, and 3 showing moderate signal in astrocytes (Figure 6B,E). In microglia, TOMA2 and TOMA3 showed strong colocalization and TOMA1 showed moderate signal compared to TOMA4 (Figure 6C,F). Tau5 and TOMAs PCC were measured and reported (Figure 6G).
FIGURE 6.
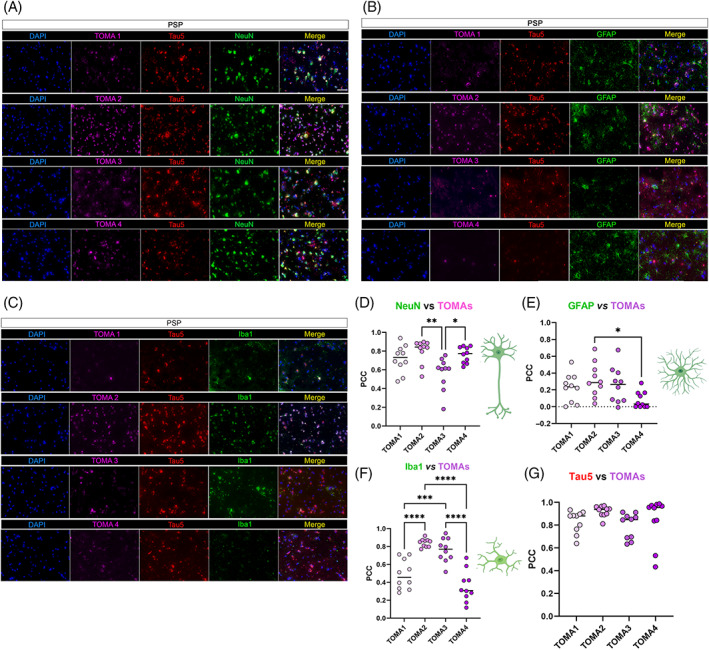
TOMAs signatures in PSP brain cortices. (A) Representative co‐IF of TOMA1‐4 (magenta) from the top to the bottom with NeuN (green), Tau5 (red) and nuclei (DAPI—blue). Magnification 40×, white scale bar, 50 μm. (B) Representative co‐IF of TOMA1‐4 (magenta) with GFAP (green), Tau5 (red) and nuclei (DAPI—blue). Magnification 40×, white scale bar, 50 μm. (C) Representative co‐IF of TOMA1‐4 (magenta) with Iba1 (green), Tau5 (red) and nuclei (DAPI—blue). Magnification 40×, white scale bar, 50 μm. All channels are represented singularly and merged. All the images are obtained from the same case number (D) NeuN/TOMAs PCC dot plots in 10 neurons. (E) GFAP/TOMAs PCC dot plots in 10 astrocytes. (F) NeuN/TOMAs PCC dot plots in 10 microglial cells. (G) Tau5/TOMAs PCC dot plots in 10 regions of interests of PSP tissue. Analysis was conducted via one‐way ANOVA and Tukey's multiple comparison test *p < 0.05; **p < 0.01; ***p < 0.001; ****p < 0.0001.
Overall, the immunoreactivity of all the TOMAs was strongest in AD and PSP neurons and was comparatively higher than the signal observed in DLB neurons. TOMA1 detected neuronal tau more strongly in DLB and PSP compared to AD. TOMA2 showed more affinity for microglial tau aggregates, while TOMA3 and TOMA4 mostly detected neuronal tau aggregates in all the three pathologies. These results suggest that in each disease analyzed there are different tau depositions signatures based on cell‐types indicating that different tau variants accumulate in neurons, astrocytes, and microglia. Cell‐type TOMA/TTC‐Ms immunoreactivity is summarized based on PCC values in Figure 7. Clustered PCC Dot plots of TAOs in NeuN, GFAP and Iba1 positive cells in AD, DLB and PSP brains are presented in Figure S2.
FIGURE 7.
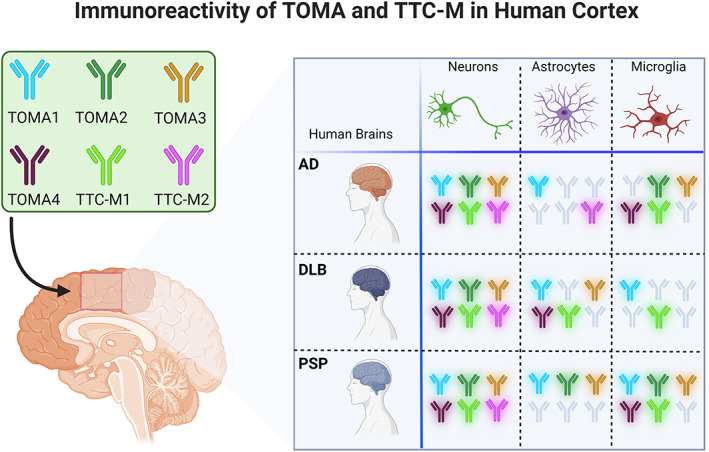
Cell‐specific immunoreactivity of TOMA/TTC‐Ms in AD, DLB and PSP. Graphical representation of TOMAs and TTC‐Ms abs immunoreactivity in each cell‐type (neurons, microglia, and astrocytes) in each diseases studied AD, DLB and PSP. Abs have been included in the diagram considering a PCC higher than 0.2.
3.3. Tau oligomers present different patterns in AD, DLB and PSP brain homogenates
AD, DLB and PSP brain cortices were also analyzed by IHC using TTC‐M and TOMA antibodies (Figure 8). In AD (Figure 8B), we observed strong immunoreactivity of all TOMAs (i–iv) detecting tau in the projections and cell bodies. TOMA2 (ii) strongly reacted in the projections and nuclei. The signal for TTC‐M2 (vi) was robust, found mainly in the cell body and projections, while TTC‐M1 (v) signal was weak and mostly punctate. In DLB (Figure 8C) and PSP (Figure 8D), TOMA1 (i) reactivity was comparable to AD, while TOMA2 (ii) showed a very dense signal in the cell nuclei. In all three pathologies, TOMA3 (iii) signal was primarily observed in the projections and TOMA4 (iv) immunoreactivity was mostly detected in the perinuclear region appearing as small puncta. Similar to AD, TTC‐M1 showed punctate signal in DLB (Figure 8C). However, we did not observe any comparable signal from TTC‐M1 in PSP. TTC‐M2 showed moderate signal in DLB, while in PSP a dense and diffused signal was observed within the cells. As expected, the control brain tissue did not show any noticeable immunoreactivity with these antibodies (Figure 8A), except for with TOMA2. Overall, TOMA1 and TOMA2 detected neuronal tau aggregates in all the three pathologies. They also detected tau in the oligodendrocytes. On the contrary, TOMA2 selectively detected cytoplasmic as well as nuclear tau, unlike of any other TOMA. More interestingly, TOMA2 detected glial tau in both AD and DLB (Figure 8E,F) confirming our observation in immunofluorescence analyses (Figures 5 and 6). Commercial Ab Tau5 was used as control antibody showing pathological tau aggregates in these tauopathies (Figure 8G).
FIGURE 8.
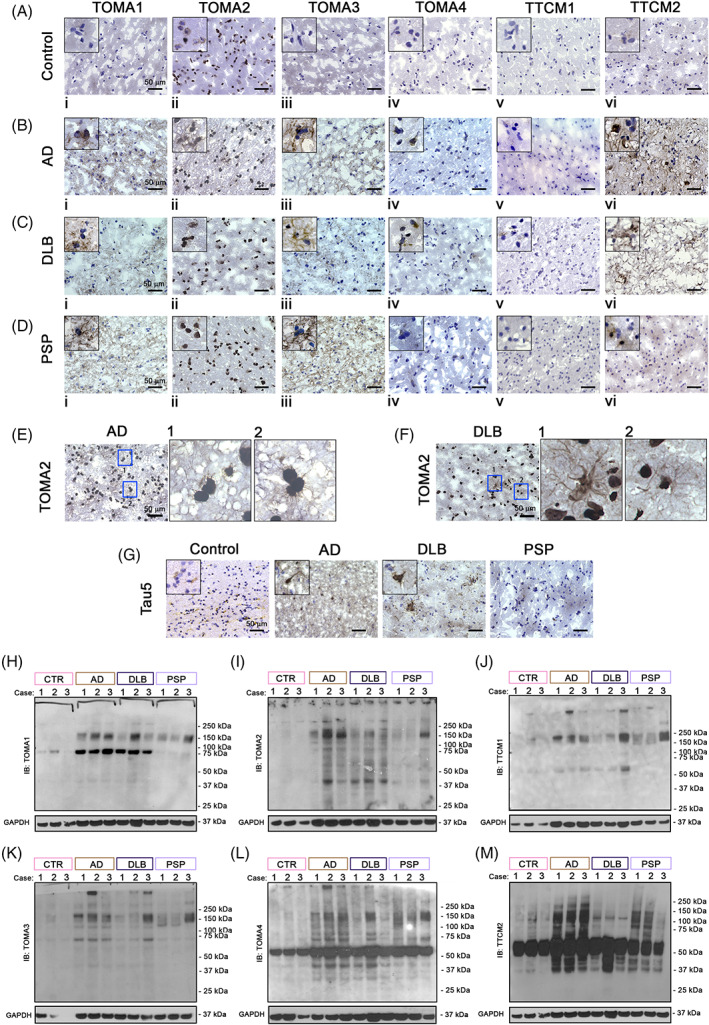
Differential tau oligomeric patterns in AD, DLB and PSP brain homogenates. Immunohistochemistry of Ctr (A), AD (B), DLB (C) and PSP (D) brain cortical sections with TOMA1, TOMA2, TOMA3, TOMA4, TTC‐M1, TTC‐M2 abs. Magnification 40×, black scale bar 50 μm. Top left of each image represent an inset 20× zoomed from the original frame. (E) TOMA2 IHC in AD brains, magnification 40×, black scale bar 50 μm, blue boxes are represented with 20× zoomed inset 1 and 2. (F) TOMA2 IHC in DLB brains, magnification 40×, black scale bar 50 μm, blue boxes are represented with 20× zoomed inset 1 and 2. Western blot analyses of AD, DLB and PSP brain homogenates (G) Tau5 IHC in Ctr, AD, DLB, PSP cortical sections. Magnification 40×, black scale bar 50 μm. Top left of each image represent an inset 20× zoomed from the original frame. (H) TOMA1 IB in brain homogenates of Ctr, AD, DLB and PSP cortices. (I) TOMA2 IB in brain homogenates of Ctr, AD, DLB and PSP cortices. (J) TTC‐M1 IB in brain homogenates of Ctr, AD, DLB and PSP cortices. (K) TOMA3 IB in brain homogenates of Ctr, AD, DLB and PSP cortices. (L) TOMA4 IB in brain homogenates of Ctr, AD, DLB and PSP cortices. (M) TTC‐M2 IB in brain homogenates of Ctr, AD, DLB and PSP cortices
We confirmed our histological observations by immunoblotting brain homogenates from AD, DLB and PSP cortices (Figure 8H–M). All the TOMA/TTC‐Ms detected tau oligomers at different molecular weights. In AD and DLB, TOMA1 and TOMA2 recognized tau aggregates of similar molecular weights at 75 and 150 kDa (Figure 8H,I). However, a strong 75 kDa band was noticed in both AD and DLB cases, but not in PSP cases. TOMA3 and TTC‐M1 detected similar patterns of tau species (Figure 8J,K). TOMA4 (Figure 8L) and TTC‐M2 (Figure 8M) recognized multiple tau species above 50 kDa form and HMW species in the homogenates of the three diseases. Moreover, TOMA4 recognized several HMW and LMW tau species in both AD and PSP. Interestingly, we observed TOMA/TTC‐Ms differences in the banding pattern over 50 kDa across the three diseases. Collectively, each TOMA/TTC‐M recognizes aggregated tau species of different molecular weights with some degree of overlap. IB of secondary Ab alone and Tau13 Ab are presented in Figure S3.
3.4. Tauopathies are characterized by cell‐type dependent differences in nuclear size, nuclear density and chromatin compaction
Tauopathies, as well as NDs in general, are characterized in late disease stages, by neuronal death and chronic glial activation [18]. To evaluate and compare differences in cell‐type number, nuclear size, and chromatin compaction level, we performed a Co‐IF in brain cortical sections from Ctr, AD, PSP, and DLB cases using cell‐type markers (NeuN‐neurons, GFAP‐astrocytes, and Iba1‐microglia) with DAPI (nuclear staining). These were then measured using the BX‐Analyzer Keyence software for the following parameters: nuclear density (cell‐type number), nuclear averaged area (NAA, μm2) and DAPI integration density (chromatin compaction level). Total nuclear analysis was conducted in 18 ROIs for each group and 6887 Ctr nuclei, 9747 AD nuclei, 7611 DLB nuclei and 4590 PSP nuclei. Total nuclear density analysis (Figure 9A) was significantly increased in AD sections and significantly reduced in PSP brains, while no significant change was noted in DLB compared to the Ctr. Representative nuclear staining images in human brains is presented in Figure 9B. A significant increase in NAA was noted in AD, while both DLB and PSP showed reduced NAA (Figure 9C) indicating an alteration of nuclear activities. These nuclear differences are represented in IF images in Figure 9D. This increase in AD nuclei size is associated with increased chromatin compaction, and the reduction of NAA in DLB and PSP is associated with a lower level of chromatin compaction (Figure 9E). Representative confocal micrographs of cortical nuclei are presented in Figure 9F. Together, we observed that AD nuclei are larger with a higher level of heterochromatin compared to DLB and PSP, which showed a significant shrinkage of NAA and much more relaxed chromatin level (euchromatin). These data suggest a disease‐specific signature of nuclear abnormality. Nuclear density, NAA and chromatin compaction are broken down by neurodegenerative disease cases analyzed as represented in Figure S4 and broken down by cell‐type and cases as presented in Figure S5.
FIGURE 9.
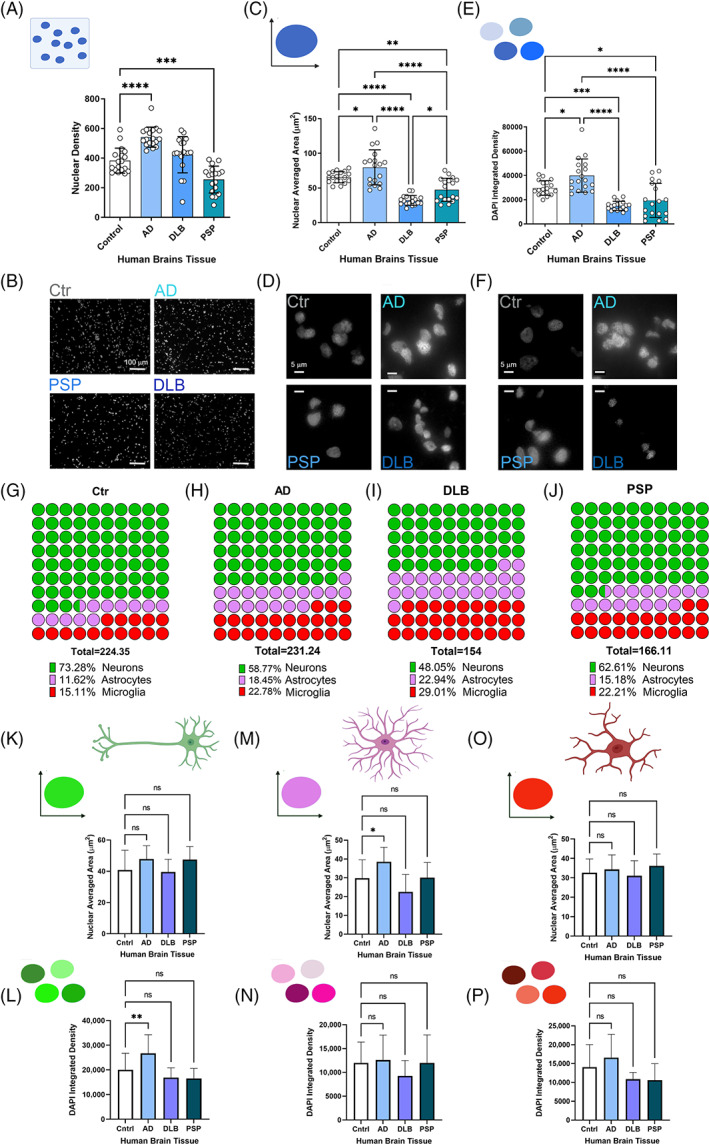
Nuclear size, nuclear density, and chromatin compaction of neurons, astrocytes, and microglia in Ctr, AD, DLB and PSP brains. (A) Bar graph of nuclear density in Ctr, AD, DLB and PSP brains. (B) Nuclear tissue density represented by DAPI staining (gray) of Ctr, AD, DLB and PSP (magnification: 20×, white scale bar: 100 mm). (C) Bar graph of nuclear averaged area in Ctr, AD, DLB and PSP brains. (D) Representative micrographs for the size comparison of nuclei (DAPI staining—gray) in Ctr, AD, DLB and PSP (magnification: 40×, white scale bar: 5 μm). (E) Bar graph of DAPI integrated density based on control and neurodegenerative disease cases. (F) Representative micrographs for the DAPI fluorescent intensities comparison of nuclei (DAPI staining—gray) in Ctr, AD, DLB and PSP (magnification: 40×, white scale bar: 5 μm). Analysis was conducted via one‐way ANOVA *p < 0.05; **p < 0.01; ***p < 0.001; ****p < 0.0001. (G) Parts of total representation of neurons, astrocytes, and microglia percentage within Ctr brain cortex. (H) Parts of total representation of neurons, astrocytes, and microglia percentage within AD brain cortex. (I) Parts of total representation of neurons, astrocytes, and microglia percentage within DLB brain cortex. (J) Parts of total representation of neurons, astrocytes, and microglia percentage within PSP brain cortex. Bar graphs of nuclear averaged area in neuron (K) astrocytes (M) and microglia (O). DAPI integrated density based on control and neurodegenerative disease cases broken up by cell type: Neuron (L), astrocyte (N) and microglia (P). Analysis was conducted via one‐way ANOVA Dunnett's multiple comparison test: *p < 0.05; **p < 0.01; ***p < 0.001; ****p < 0.0001.
While it is known that the size and shape of the nucleus is strictly regulated, the mechanisms and functions of nuclear size and shape regulation remains poorly understood. Many cancers are diagnosed and staged based on graded increases in nuclear size. Moreover, changes in nuclear size play an important role in subnuclear chromatin organization and gene expression. Nuclear size can be regulated by nuclear envelope structural elements and cell cycle events may influence nuclear morphologies. These aspects have been not investigated in this study but open the possibilities to investigate deeply known altered nuclear elements, such as nuclear size and shape alterations, which are mainly investigated in cancer [27]. To determine the percentage of different cell types in each brain tissue examined, we measured the number of each cell type separately in respect to total cells from region of interests on cortical region (20× magnification field). A sustained decrease in AD neurons was noted by almost 6% compared to Ctr, while DLB neurons were substantially decreased by 16%. On the totality neurons represented 74% in Ctr, 58.7% in AD and 48% in DLB. PSP neuronal count showed a reduction of more than 10% compared to the Ctr case% (Figure 9G,H, green spots). Astrocytes and microglia showed increase in AD (7% and 8%, respectively), DLB (12% and 14%, respectively) and increase in PSP microglia (7%) and in astrocytes (4%) when compared to Ctr (Figure 9G–J, pink spot astrocytes and red spots microglia). These data showed an interesting disease‐specific pattern in terms of cell‐types. As expected, we observed a reduction in neurons and an increase in glial cells but with a different magnitude in AD and DLB. In DLB, particularly, more than 50% of the cells with altered nuclear measurements were glial cells, indicating that each disease, in this case the cortical region, has a specific signature in terms of nuclear characteristics and cell‐type occurrence.
To evaluate in which cell types specifically these nuclear changes occur, we isolated the data in neurons, astrocytes, and microglia separately. Overall, the increase in NAA was mostly associated with neuron and astrocytes (Figure 9K,M) while no relevant differences were observed in microglia NAA among the cases (Figure 9O). Chromatin compaction level was high in AD neurons and microglia while it was lower in DLB and PSP (Figure 9L,P). No relevant differences were noted in astrocyte chromatin compaction levels (Figure 9N). The NAA and chromatin compaction grade for the three cell types in AD, DLB, PSP and Ctr are summarized in Figure 10 diagram. All these nuclear alterations were associated with double‐strand DNA damage grade (Figure S6). To measure DNA damage grade, already observed in several neurodegenerative disease [28], we performed a co‐IF with pH2A.X (marker of ds DNA damage) [29] in neurons, astrocytes, and microglia of Ctr, AD, DLB, and PSP. In previous study we observed higher levels of pH2A.X in AD compared to Ctr brains [30], here in addition, we observed a cell‐type dependent vulnerability to DNA damage with different levels, higher in microglia and neurons then astrocytes.
FIGURE 10.
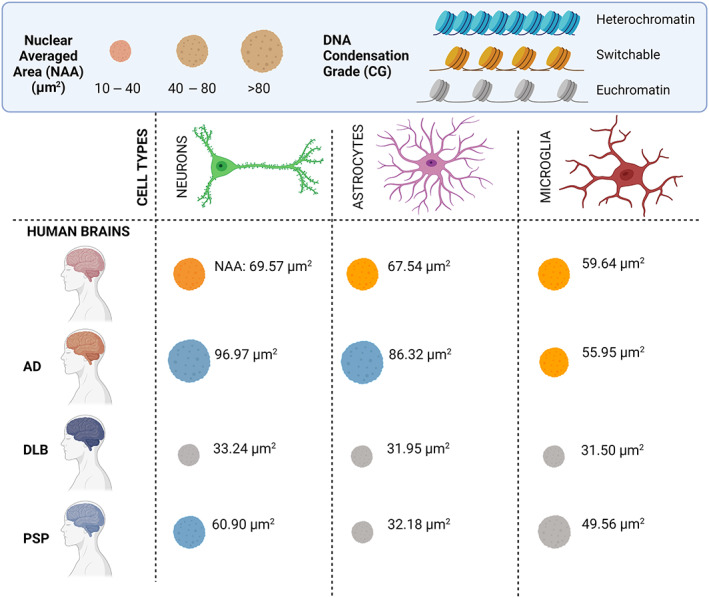
Graphic of nuclei properties in human diseased brains. Nuclear averaged area (NAA) and chromatin compaction grade (CG) in neurons (green), astrocytes (pink) and microglia (red) cells are grouped in three main clusters. Nuclei size is partitioned in small (10–40 μm2), medium (40–80 μm2) and large (>80 μm2) nuclei groups. DNA CG in heterochromatin (DNA transcription repressed—light green), switchable (intermediate state of DNA transcription—orange) and euchromatin (DNA actively transcribed—gray). NAA reported in the graphic represents an average of each disease included in the study: Ctr, AD, DLB and PSP. Graphic is created with BioRender software.
4. DISCUSSION
Accumulation of pathological tau aggregates in neurons and glial cells is a prominent feature of tauopathies [3]. We previously showed that TOMA1 and TOMA2 recognized oligomeric tau in P301L tauopathy mouse model and AD, ALS and FTD postmortem brain tissues [20, 21]. Here, we report two groups of monoclonal antibodies generated in‐house; one group recognizing oligomeric tau, TOMAs and another group recognizing toxic conformation of tau (TTC‐M). Collectively, TOMA/TTC‐Ms recognize different variants of aggregated tau species in tauopathy brain tissues. Using TOMA/TTC‐Ms in immunofluorescence in combination with markers for neurons, astrocytes, and microglia, we observed that different cell types vary in the type of aggregated tau species as well as in the degree of tau deposition.
Tau pathology in glial cells is a characteristic feature of certain tauopathies. In recent years, the contribution of astrocytes and microglia in tau‐induced degeneration has received much attention. Tau deposition in astrocytes and the involvement of astrocytes in the uptake and spread of pathological tau has been observed [31]. Several astrocyte phenotypes have been identified, with each having functional alterations that impedes their ability to support properly neurons and/or cause neurotoxicity [32]. Similarly, microglial activation can exacerbate tau pathology by damaging dendrites and axons in a mouse model of tauopathy [33]. Such synaptic pathology preceded neuronal degeneration in this mouse model. Microglia can internalize pathological tau seed and improper processing of the seed can promote tau seeding and aggregation in adjacent cells [34]. Here, we have extended our investigation on these novel anti‐tau antibodies for their ability to detect cell‐type specific tau aggregates. While we observed strong immunoreactivity of TTC‐M1 for neuronal tau in AD, DLB and PSP, immunoreactivity to astrocytic tau deposits was only present in AD and DLB. TTC‐M2 signal was strongly noted for neuronal tau in AD and PSP only. Interestingly, this antibody did not detect any astrocytic tau in any of the pathologies. Both TTC‐M1 and M2 showed substantial differences in detecting microglial tau in all the pathologies. These results indicate their preference for tau aggregates in cell‐specific manner.
All the four TOMA antibodies differed in recognizing tau deposits. TOMA1 strongly detected neuronal tau in DLB, and PSP compared to AD, while it showed moderate immunoreactivity for microglial tau in PSP only. TOMA2 showed strong signal for microglial tau in all AD, DLB and PSP and moderately for neuronal tau in all the three pathologies. On the contrary, TOMA3 was strongly immunoreactive for neuronal in the three diseases and to some extent in microglia in AD and PSP. TOMA4 signal was variable being strongest in the neuronal tau in PSP and having little to no reactivity in either microglia or astrocytes, respectively. TOMA/TTC‐Ms cell‐type profiles is graphically expressed in Figure 7.
The majority of the studies on tau monoclonal antibodies focus on their ability to bind to the extracellular tau seeds, neutralize them and thus halt the transmission of tau pathology [35]. Few other studies have also demonstrated the ability of other tau antibodies to be internalized into human neuroblastoma cells, where they bind and neutralize pathological tau aggregates, specifically paired helical filament [36, 37]. However, whether these antibodies act via binding to intracellular or extracellular tau aggregates is yet to be investigated. We previously showed that passive immunotherapy with TOMA (which is referred to here as TOMA1) reversed both locomotor and memory deficits for 60 days accompanied with reduced tau oligomers levels but not NFTs or tau monomer in P301L transgenic mouse model of tauopathy [21]. In this study, we reported that tauopathies differ in terms of their clinical manifestations as well as characteristic tau pathology in terms of cell‐type nuclear morphology and cell‐type tau deposits. High resolution structural studies like cryo‐EM provided the field with unparallel information that tau filaments, which constitute different hallmark tau pathologies, are structurally different in AD, PSP, Pick's disease, corticobasal degeneration, and chronic traumatic encephalopathy [38, 39, 40, 41, 42, 43]. However, what is still unknown is whether tau oligomers observed in multiple tauopathies are different in terms of their structure and conformation, features which can modulate their immunological detection as well as their bioactivity. Further, the contribution of tau isoforms in the pathological aggregates are different in different tauopathies. To this end, developing antibodies that specifically target the pathological form of tau aggregates and further identify their different conformations is of great interest. The antibodies investigated in this study show differences in their immunoreactivity to tau oligomers thus aiding in selective recognition of tau aggregate patterns in different brain cell types.
Nuclear shrinkage and deformity are reported in several neuropathologies, such as diseases associated with polyglutamine repeat inclusions, Machado‐Joseph disease (MJD) and Huntington’ disease (HD) [44, 45]. Here, we studied previously unreported nuclear traits associated with AD, DLB and PSP Our overall analysis revealed nuclei morphometric alteration in DLB and PSP. Nuclear density, nuclear averaged area, and DAPI integration showed significant decreases in these two pathologies. This observation was in line with observed chromosomal dissolution, nuclear shrinkage, and eventual nuclear dissolution that may result in cerebellar shrinkage. On the other hand, a significant increase in nuclear size was observed in AD, indicating an early nuclear hypertrophic change that is speculated to stall the progression of disease. This increase in neurons as well as in glial cells further support the idea that mounting glial response is what allows certain patients with asymptomatic Alzheimer's to normally function despite the presence of AD lesions. The increase in glial cells allows for greater compacting of Aβ aggregates in dense core plaques that can be shielded from neurons [17]. In our study, this hypertrophic reaction in AD only remained consistent in terms of nuclear density among all cell types. When further broken down by cell type, DLB and PSP showed no significant changes in any characteristic. Nuclear size (area) and DNA compaction grade in neurons, astrocytes, and microglia of Ctr, AD, PSP and DLB brains are summarized in Figure 2 showing the distinctive pattern of nuclear morphology in the three pathologies.
In our previous study, we showed abnormal nuclear morphology in AD, FTD and ALS and we observed an increment of DAPI integrated density in HEK cells treated with exogenous recombinant Tau oligomers [20], supporting our observation of higher DAPI intensity in AD brains in this study. Previously, using inducible‐tau HEK cells model, we observed a reduction of euchromatin trimethylated Histone H3K4 (H3K4me3) and higher chromatin compaction in P301L tau expressing models compared to WT controls. This observation supports the hypothesis that a higher heterochromatin (chromatin condensate state) is present in AD compared to PSP and DLB. These epigenomic signatures have been observed in AD brains, where high levels of H3K9me3 have been detected [46]. However, further studies are needed for dissecting out the extent of nuclear trophism in these diseases more precisely.
In conclusion, these observations suggest that AD, PSP and DLB present case‐specific nuclear morphological signatures and cell‐type tropism of toxic tau oligomers. For this reason, gaining greater comprehension into the interplay of these antibodies and cell‐type may provide a new avenue for treatment and can give greater insight into more appropriate personalized therapeutic frameworks.
AUTHOR CONTRIBUTIONS
Conceptualization: Mauro Montalbano and Rakez Kayed. Methodology: Mauro Montalbano and Rakez Kayed. Investigation: Mauro Montalbano, Lajja Majmundar, Leiana Fung, Urmi Sengupta and Rakez Kayed. Writing—Original Draft: Lajja Majmundar, Mauro Montalbano. Writing—Review & Editing: All authors. Funding Acquisition: Rakez Kayed. Resources: Rakez Kayed. Supervision: Mauro Montalbano and Rakez Kayed.
CONFLICT OF INTEREST
None.
Supporting information
Figure S1. Colocalization PCC comparison on neurons, astrocytes and microglia stained with TTC‐M1 and TTC‐M2 Abs. Ordinary one‐way ANOVA and Šidák's multiple comparison test performed in AD we observed significant differences in the following comparison: GFAP/TTC‐M1 versus GFAP/TTC‐M2 (****adjusted p < 0.000), Iba1/TTC‐M1 versus Iba1/TTC‐M2 (*p = 0.0194). In PSP we observed the following significant differences: Iba1/TTC‐M1 versus Iba1/TTC‐M2 (**p = 0.0019). In DLB we observed significant difference in GFAP/TTC‐M1 versus GFAP/TTC‐M2 (**p = 0.0015).
Figure S2. Dot plots of PCC between NeuN, GFAP and Iba1 with tau oligomeric antibodies in AD, DLB and PSP brains.
Figure S3. Immunoblot of brain homogenates with Anti‐Mouse alone to reveal possible not specific secondary Ab bands. Tau13 Ab has been used to evaluate total tau levels in brain homogenates.
Figure S4. Nuclear size, nuclear density, and chromatin compaction broken down by neurodegenerative disease. Bar graphs of nuclear density, nuclear averaged area, and DAPI integrated density based on control and neurodegenerative disease case number. Analysis was conducted via one‐way ANOVA *p < 0.05; **p < 0.01; ***p < 0.001; ****p < 0.0001.
Figure S5. Nuclear size, nuclear density, and chromatin compaction broken down by neurodegenerative disease cases and cell type. Bar graphs of nuclear density, nuclear averaged area, and DAPI integrated density for neurons, astrocytes, and microglia based on control and neurodegenerative disease case number. Analysis was conducted via one‐way ANOVA *p < 0.05; **p < 0.01; ***p < 0.001; ****p < 0.0001.
Figure S6. Double‐Strand DNA Damage in AD, DLB and PSP. (A) Representative IF of pH2A.X in Ctr, AD, DLB and PSP neurons. (B) Representative IF of pH2A.X in Ctr, AD, DLB and PSP astrocytes. (C) Representative IF of pH2A.X in Ctr, AD, DLB and PSP microglia. Magnification, 40× and white scale bar 100 μm. (D) Graphical representation (parts of whole) of dsDNA damage fluorescent signal in neurons, astrocytes, and microglia of single case of Ctr, AD, DLB, and PSP case analyzed. Parts of whole cake graph is represented by percentage of number of pH2A.X positive cells to the totality of neurons, astrocytes, and microglia, respectively. Graphs obtained with GraphPad 9.0 software.
ACKNOWLEDGMENTS
We thank the members of the Kayed lab for their support and help. This work was supported by National Institute of Health grants (Rakez Kayed): AG054025, RF1AG077484, AG072458, AG055771, R01AG077253, AG060718, and the Mitchell Center for Neurodegenerative Diseases. Mauro Montalbano is supported by Alzheimer's Association Fellowship Grant AARF‐21‐720991. Urmi Sengupta is supported by T32‐AG067952.
Montalbano M, Majmundar L, Sengupta U, Fung L, Kayed R. Pathological tau signatures and nuclear alterations in neurons, astrocytes and microglia in Alzheimer's disease, progressive supranuclear palsy, and dementia with Lewy bodies. Brain Pathology. 2023;33(1):e13112. 10.1111/bpa.13112
Funding information Alzheimer's Association, Grant/Award Number: AARF‐21‐720991; National Institutes of Health ‐ NIH, Grant/Award Numbers: AG054025, AG055771, AG060718, AG067952, AG072458, R01AG077253; T32‐AG067952; Mitchell Center for Neurodegenerative Diseases
DATA AVAILABILITY STATEMENT
The datasets used and/or analyzed in this current study are available from the corresponding author.
REFERENCES
- 1. Goedert M. Chapter 4—neurodegeneration and the ordered assembly of tau. In: Wolfe Michael S., editor. The molecular and cellular basis of neurodegenerative diseases. Elsevier ‐ Academic Press 360 Park Ave; New York NY, 10010 United States; 2018. p. 81–98. 10.1016/B978-0-12-811304-2.00004-3 [DOI] [Google Scholar]
- 2. Arendt T, Stieler JT, Holzer M. Tau and tauopathies. Brain Res Bull. 2016;126(Pt 3):238–92. 10.1016/j.brainresbull.2016.08.018 [DOI] [PubMed] [Google Scholar]
- 3. Kovacs GG. Tauopathies. Handb Clin Neurol. 2017;145:355–68. 10.1016/B978-0-12-802395-2.00025-0 [DOI] [PubMed] [Google Scholar]
- 4. Spillantini MG, Goedert M. The alpha‐synucleinopathies: Parkinson's disease, dementia with Lewy bodies, and multiple system atrophy. Ann N Y Acad Sci. 2000;920:16–27. 10.1111/j.1749-6632.2000.tb06900.x [DOI] [PubMed] [Google Scholar]
- 5. Leuzy A, Chiotis K, Lemoine L, Gillberg PG, Almkvist O, Rodriguez‐Vieitez E, et al. Tau PET imaging in neurodegenerative tauopathies—still a challenge. Mol Psychiatry. 2019;24(8):1112–34. 10.1038/s41380-018-0342-8 [DOI] [PMC free article] [PubMed] [Google Scholar]
- 6. Davies SW, Turmaine M, Cozens BA, DiFiglia M, Sharp AH, Ross CA, et al. Formation of neuronal intranuclear inclusions underlies the neurological dysfunction in mice transgenic for the HD mutation. Cell. 1997;90(3):537–48. 10.1016/s0092-8674(00)80513-9 [DOI] [PubMed] [Google Scholar]
- 7. Chi H, Chang H‐Y, Sang T‐K. Neuronal cell death mechanisms in major neurodegenerative diseases. Int J Mol Sci. 2018;19(10):3082. 10.3390/ijms19103082 [DOI] [PMC free article] [PubMed] [Google Scholar]
- 8. Camozzi D, Capanni C, Cenni V, Mattioli E, Columbaro M, Squarzoni S, et al. Diverse Lamin‐dependent mechanisms interact to control chromatin dynamics. Focus on laminopathies. Nucleus. 2014;5(5):427–40. 10.4161/nucl.36289 [DOI] [PMC free article] [PubMed] [Google Scholar]
- 9. Strasser C, Grote P, Schäuble K, Ganz M, Ferrando‐May E. Regulation of nuclear envelope permeability in cell death and survival. Nucleus. 2012;3(6):540–51. 10.4161/nucl.21982 [DOI] [PMC free article] [PubMed] [Google Scholar]
- 10. Frost B, Bardai FH, Feany MB. Lamin dysfunction mediates neurodegeneration in tauopathies. Curr Biol. 2016;26(1):129–36. 10.1016/j.cub.2015.11.039 [DOI] [PMC free article] [PubMed] [Google Scholar]
- 11. Montalbano M, McAllen S, Sengupta U, Puangmalai N, Bhatt N, Ellsworth A, et al. Tau oligomers mediate aggregation of RNA‐binding proteins Musashi1 and Musashi2 inducing Lamin alteration. Aging Cell. 2019;18:e13035. 10.1111/acel.13035 [DOI] [PMC free article] [PubMed] [Google Scholar]
- 12. Morales I, Jiménez JM, Mancilla M, Maccioni RB. Tau oligomers and fibrils induce activation of microglial cells. J Alzheimers Dis. 2013;37(4):849–56. 10.3233/JAD-131843 [DOI] [PubMed] [Google Scholar]
- 13. Deczkowska A, Keren‐Shaul H, Weiner A, Colonna M, Schwartz M, Amit I. Disease‐associated microglia: a universal immune sensor of neurodegeneration. Cell. 2018;173(5):1073–81. 10.1016/j.cell.2018.05.003 [DOI] [PubMed] [Google Scholar]
- 14. Cai Z, Hussain MD, Yan L‐J. Microglia, neuroinflammation, and beta‐amyloid protein in Alzheimer's disease. Int J Neurosci. 2014;124(5):307–21. 10.3109/00207454.2013.833510 [DOI] [PubMed] [Google Scholar]
- 15. Hansen DV, Hanson JE, Sheng M. Microglia in Alzheimer's disease. J Cell Biol. 2018;217(2):459–72. 10.1083/jcb.201709069 [DOI] [PMC free article] [PubMed] [Google Scholar]
- 16. Rangaraju S, Dammer EB, Raza SA, Rathakrishnan P, Xiao H, Gao T, et al. Identification and therapeutic modulation of a pro‐inflammatory subset of disease‐associated‐microglia in Alzheimer's disease. Mol Neurodegener. 2018;13(1):24. 10.1186/s13024-018-0254-8 [DOI] [PMC free article] [PubMed] [Google Scholar]
- 17. Jiwaji Z, Tiwari SS, Aviles‐Reyes RX, Hooley M, Hampton D, Torvell M, et al. Reactive astrocytes acquire neuroprotective as well as deleterious signatures in response to Tau and Aß pathology. Nat Commun. 2022;13(1):135. 10.1038/s41467-021-27702-w [DOI] [PMC free article] [PubMed] [Google Scholar]
- 18. Kwon HS, Koh S‐H. Neuroinflammation in neurodegenerative disorders: the roles of microglia and astrocytes. Transl Neurodegener. 2020;9(1):42. 10.1186/s40035-020-00221-2 [DOI] [PMC free article] [PubMed] [Google Scholar]
- 19. Brady RM, Zinkowski RP, Binder LI. Presence of tau in isolated nuclei from human brain. Neurobiol Aging. 1995;16(3):479–86. [DOI] [PubMed] [Google Scholar]
- 20. Montalbano M, McAllen S, Puangmalai N, Sengupta U, Bhatt N, Johnson OD, et al. RNA‐binding proteins Musashi and tau soluble aggregates initiate nuclear dysfunction. Nat Commun. 2020;11(1):4305. 10.1038/s41467-020-18022-6 [DOI] [PMC free article] [PubMed] [Google Scholar]
- 21. Castillo‐Carranza DL, Sengupta U, Guerrero‐Munoz MJ, Lasagna‐Reeves CA, Gerson JE, Singh G, et al. Passive immunization with tau oligomer monoclonal antibody reverses tauopathy phenotypes without affecting hyperphosphorylated neurofibrillary tangles. J Neurosci. 2014;34(12):4260–72. 10.1523/JNEUROSCI.3192-13.2014 [DOI] [PMC free article] [PubMed] [Google Scholar]
- 22. Vuono R, Winder‐Rhodes S, de Silva R, Cisbani G, Drouin‐Ouellet J, REGISTRY Investigators of the European Huntington's Disease Network , et al. The role of tau in the pathological process and clinical expression of Huntington's disease. Brain. 2015;138(Pt 7):1907–18. 10.1093/brain/awv107 [DOI] [PMC free article] [PubMed] [Google Scholar]
- 23. Lasagna‐Reeves CA, Castillo‐Carranza DL, Sengupta U, Sarmiento J, Troncoso J, Jackson GR, et al. Identification of oligomers at early stages of tau aggregation in Alzheimer's disease. FASEB J. 2012;26(5):1946–59. 10.1096/fj.11-199851 [DOI] [PMC free article] [PubMed] [Google Scholar]
- 24. Sengupta U, Carretero‐Murillo M, Kayed R. Preparation and characterization of tau oligomer strains. Methods Mol Biol. 2018;1779:113–46. 10.1007/978-1-4939-7816-8_9 [DOI] [PubMed] [Google Scholar]
- 25. Pincus Z, Theriot JA. Comparison of quantitative methods for cell‐shape analysis. J Microsc. 2007;227(Pt 2):140–56. 10.1111/j.1365-2818.2007.01799.x [DOI] [PubMed] [Google Scholar]
- 26. Chen S, Zhao M, Wu G, Yao C, Zhang J. Recent advances in morphological cell image analysis. Comput Math Methods Med. 2012;2012:101536. 10.1155/2012/101536 [DOI] [PMC free article] [PubMed] [Google Scholar]
- 27. Jevtić P, Edens LJ, Vuković LD, Levy DL. Sizing and shaping the nucleus: mechanisms and significance. Curr Opin Cell Biol. 2014;28:16–27. 10.1016/j.ceb.2014.01.003 [DOI] [PMC free article] [PubMed] [Google Scholar]
- 28. Coppedè F, Migliore L. DNA damage in neurodegenerative diseases. Mutat Res. 2015;776:84–97. 10.1016/j.mrfmmm.2014.11.010 [DOI] [PubMed] [Google Scholar]
- 29. Podhorecka M, Skladanowski A, Bozko P. H2AX phosphorylation: its role in DNA damage response and cancer therapy. J Nucleic Acids. 2010;2010. 10.4061/2010/920161 [DOI] [PMC free article] [PubMed] [Google Scholar]
- 30. Farmer KM, Ghag G, Puangmalai N, Montalbano M, Bhatt N, Kayed R. P53 aggregation, interactions with tau, and impaired DNA damage response in Alzheimer's disease. Acta Neuropathol Commun. 2020;8(1):132. 10.1186/s40478-020-01012-6 [DOI] [PMC free article] [PubMed] [Google Scholar]
- 31. Nolan A, de Paula Franca Resende E, Petersen C, Neylan K, Spina S, Huang E, et al. Astrocytic tau deposition is frequent in typical and atypical Alzheimer disease presentations. J Neuropathol Exp Neurol. 2019;78(12):1112–23. 10.1093/jnen/nlz094 [DOI] [PMC free article] [PubMed] [Google Scholar]
- 32. Reid MJ, Beltran‐Lobo P, Johnson L, Perez‐Nievas BG, Noble W. Astrocytes in tauopathies. Front Neurol. 2020;11:572850. 10.3389/fneur.2020.572850 [DOI] [PMC free article] [PubMed] [Google Scholar]
- 33. Yoshiyama Y, Higuchi M, Zhang B, Huang SM, Iwata N, Saido TC, et al. Synapse loss and microglial activation precede tangles in a P301S tauopathy mouse model. Neuron. 2007;53(3):337–51. 10.1016/j.neuron.2007.01.010 [DOI] [PubMed] [Google Scholar]
- 34. Hopp SC, Lin Y, Oakley D, Roe AD, DeVos SL, Hanlon D, et al. The role of microglia in processing and spreading of bioactive tau seeds in Alzheimer's disease. J Neuroinflammation. 2018;15(1):269. 10.1186/s12974-018-1309-z [DOI] [PMC free article] [PubMed] [Google Scholar]
- 35. Weisová P, Cehlár O, Škrabana R, Žilková M, Filipčík P, Kováčech B, et al. Therapeutic antibody targeting microtubule‐binding domain prevents neuronal internalization of extracellular tau via masking neuron surface proteoglycans. Acta Neuropathol Commun. 2019;7(1):129. 10.1186/s40478-019-0770-y [DOI] [PMC free article] [PubMed] [Google Scholar]
- 36. Shamir DB, Rosenqvist N, Rasool S, Pedersen JT, Sigurdsson EM. Internalization of tau antibody and pathological tau protein detected with a flow cytometry multiplexing approach. Alzheimers Dement. 2016;12(10):1098–107. 10.1016/j.jalz.2016.01.013 [DOI] [PMC free article] [PubMed] [Google Scholar]
- 37. Gu J, Congdon EE, Sigurdsson EM. Two novel tau antibodies targeting the 396/404 region are primarily taken up by neurons and reduce tau protein pathology. J Biol Chem. 2013;288(46):33081–95. 10.1074/jbc.M113.494922 [DOI] [PMC free article] [PubMed] [Google Scholar]
- 38. Falcon B, Zhang W, Schweighauser M, Murzin AG, Vidal R, Garringer HJ, et al. Tau filaments from multiple cases of sporadic and inherited Alzheimer's disease adopt a common fold. Acta Neuropathol. 2018;136(5):699–708. 10.1007/s00401-018-1914-z [DOI] [PMC free article] [PubMed] [Google Scholar]
- 39. Falcon B, Zhang W, Murzin AG, Murshudov G, Garringer HJ, Vidal R, et al. Structures of filaments from Pick's disease reveal a novel tau protein fold. Nature. 2018;561(7721):137–40. 10.1038/s41586-018-0454-y [DOI] [PMC free article] [PubMed] [Google Scholar]
- 40. Fitzpatrick AWP, Falcon B, He S, Murzin AG, Murshudov G, Garringer HJ, et al. Cryo‐EM structures of tau filaments from Alzheimer's disease. Nature. 2017;547(7662):185–90. 10.1038/nature23002 [DOI] [PMC free article] [PubMed] [Google Scholar]
- 41. Shi Y, Zhang W, Yang Y, Murzin AG, Falcon B, Kotecha A, et al. Structure‐based classification of tauopathies. Nature. 2021;598(7880):359–63. 10.1038/s41586-021-03911-7 [DOI] [PMC free article] [PubMed] [Google Scholar]
- 42. Falcon B, Zivanov J, Zhang W, Murzin AG, Garringer HJ, Vidal R, et al. Novel tau filament fold in chronic traumatic encephalopathy encloses hydrophobic molecules. Nature. 2019;568(7752):420–3. 10.1038/s41586-019-1026-5 [DOI] [PMC free article] [PubMed] [Google Scholar]
- 43. Zhang W, Tarutani A, Newell KL, Murzin AG, Matsubara T, Falcon B, et al. Novel tau filament fold in corticobasal degeneration. Nature. 2020;580(7802):283–7. 10.1038/s41586-020-2043-0 [DOI] [PMC free article] [PubMed] [Google Scholar]
- 44. Uchihara T, Iwabuchi K, Funata N, Yagishita S. Attenuated nuclear shrinkage in neurons with nuclear aggregates—a morphometric study on pontine neurons of Machado‐Joseph disease brains. Exp Neurol. 2002;178(1):124–8. 10.1006/exnr.2002.8028 [DOI] [PubMed] [Google Scholar]
- 45. Riguet N, Mahul‐Mellier AL, Maharjan N, Burtscher J, Croisier M, Knott G, et al. Nuclear and cytoplasmic huntingtin inclusions exhibit distinct biochemical composition, interactome and ultrastructural properties. Nat Commun. 2021;12(1):6579. 10.1038/s41467-021-26684-z [DOI] [PMC free article] [PubMed] [Google Scholar]
- 46. Lee MY, Lee J, Hyeon SJ, Cho H, Hwang YJ, Shin JY, et al. Epigenome signatures landscaped by histone H3K9me3 are associated with the synaptic dysfunction in Alzheimer's disease. Aging Cell. 2020;19(6):e13153. 10.1111/acel.13153 [DOI] [PMC free article] [PubMed] [Google Scholar]
Associated Data
This section collects any data citations, data availability statements, or supplementary materials included in this article.
Supplementary Materials
Figure S1. Colocalization PCC comparison on neurons, astrocytes and microglia stained with TTC‐M1 and TTC‐M2 Abs. Ordinary one‐way ANOVA and Šidák's multiple comparison test performed in AD we observed significant differences in the following comparison: GFAP/TTC‐M1 versus GFAP/TTC‐M2 (****adjusted p < 0.000), Iba1/TTC‐M1 versus Iba1/TTC‐M2 (*p = 0.0194). In PSP we observed the following significant differences: Iba1/TTC‐M1 versus Iba1/TTC‐M2 (**p = 0.0019). In DLB we observed significant difference in GFAP/TTC‐M1 versus GFAP/TTC‐M2 (**p = 0.0015).
Figure S2. Dot plots of PCC between NeuN, GFAP and Iba1 with tau oligomeric antibodies in AD, DLB and PSP brains.
Figure S3. Immunoblot of brain homogenates with Anti‐Mouse alone to reveal possible not specific secondary Ab bands. Tau13 Ab has been used to evaluate total tau levels in brain homogenates.
Figure S4. Nuclear size, nuclear density, and chromatin compaction broken down by neurodegenerative disease. Bar graphs of nuclear density, nuclear averaged area, and DAPI integrated density based on control and neurodegenerative disease case number. Analysis was conducted via one‐way ANOVA *p < 0.05; **p < 0.01; ***p < 0.001; ****p < 0.0001.
Figure S5. Nuclear size, nuclear density, and chromatin compaction broken down by neurodegenerative disease cases and cell type. Bar graphs of nuclear density, nuclear averaged area, and DAPI integrated density for neurons, astrocytes, and microglia based on control and neurodegenerative disease case number. Analysis was conducted via one‐way ANOVA *p < 0.05; **p < 0.01; ***p < 0.001; ****p < 0.0001.
Figure S6. Double‐Strand DNA Damage in AD, DLB and PSP. (A) Representative IF of pH2A.X in Ctr, AD, DLB and PSP neurons. (B) Representative IF of pH2A.X in Ctr, AD, DLB and PSP astrocytes. (C) Representative IF of pH2A.X in Ctr, AD, DLB and PSP microglia. Magnification, 40× and white scale bar 100 μm. (D) Graphical representation (parts of whole) of dsDNA damage fluorescent signal in neurons, astrocytes, and microglia of single case of Ctr, AD, DLB, and PSP case analyzed. Parts of whole cake graph is represented by percentage of number of pH2A.X positive cells to the totality of neurons, astrocytes, and microglia, respectively. Graphs obtained with GraphPad 9.0 software.
Data Availability Statement
The datasets used and/or analyzed in this current study are available from the corresponding author.


