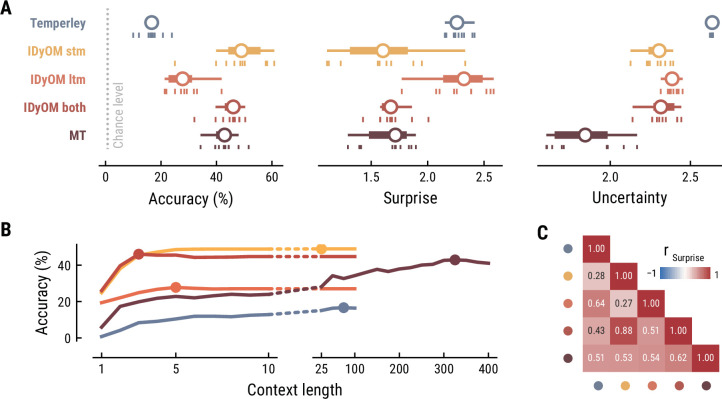
Appendix 1—figure 2. Model performance on the musical stimuli used in the EEG study.
(A) Comparison of music model performance in predicting upcoming note pitch, as composition-level accuracy (left; higher is better), median surprise across notes (middle; lower is better), and median uncertainty across notes (right). Context length for each model is the best performing one across the range shown in (B). Vertical bars: single compositions, circle: median, thick line: quartiles, thin line: quartiles ±1.5 × interquartile range. (B) Accuracy of note pitch predictions (median across 10 compositions) as a function of context length and model class (same color code as (A)). Dots represent maximum for each model class. (C) Correlations between the surprise estimates from the best models.

