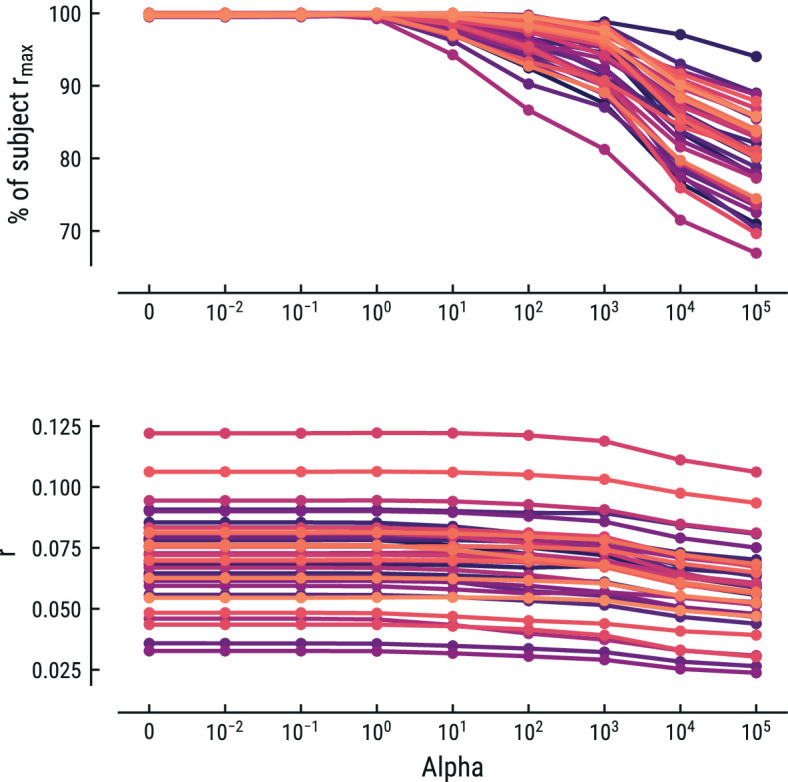
Appendix 1—figure 5. Comparison of the predictive performance on the MEG data using ridge-regularized regression, with the optimal cost hyperparameter alpha estimated using nested cross-validation.

Results are shown for the best-performing model (MT, context length of 8 notes). Each line represents one participant. Lower panel: raw predictive performance (r). Upper panel: predictive performance expressed as percentage of a participant’s maximum.
