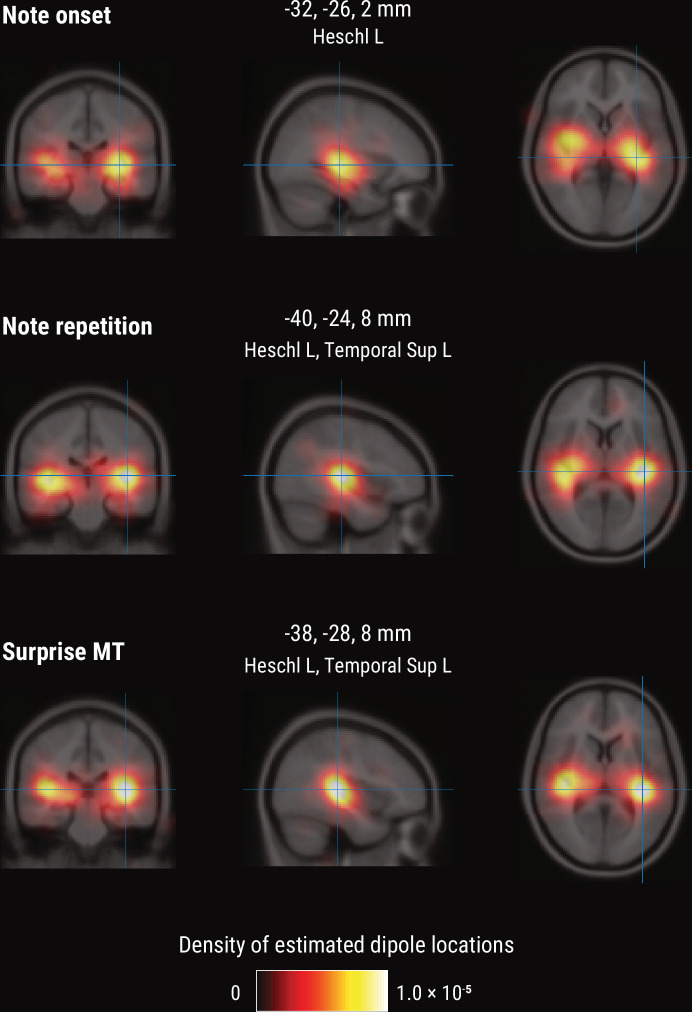
Figure 7. Source-level results for the MEG TRF data.
Volumetric density of estimated dipole locations across participants in the time window of interest identified in Figure 5 (180–240ms), projected on the average Montreal Neurological Institute (MNI) template brain. MNI coordinates are given for the density maxima with anatomical labels from the Automated Anatomical Labeling atlas.

