Abstract
Targeted quantification of glycoproteins has not reached its full potential because of limitations of the existing analytical workflows. In this study, we introduce a targeted microflow LC–MS/MS-PRM method for the quantification of multiple glycopeptides in unfractionated serum samples. The entire preparation of 16 samples in a batch is completed within 3 h, and the LC–MS quantification of all the glycoforms in a sample is completed in 15 min in triplicate, including online capture and desalting. We demonstrate applicability of the workflow on a multiplexed quantification of eight N-glycoforms of immunoglobulin G (IgG) together with two O-glycoforms of hemopexin (HPX). We applied the assay to a serologic study of fibrotic liver disease in patients of HCV etiology. The results document that specific IgG- and HPX-glycoforms detect efficiently fibrotic disease of different degree, and suggest that the LC–MS/MS-PRM assays may provide rapid and reproducible biomarker assay targeting simultaneously the N- and O-glycoforms of the peptides. We propose that such high throughput multiplexed methods may advance the clinical use of the LC–MS/MS assays.
Subject terms: Glycobiology, Analytical biochemistry
Introduction
Hepatocellular carcinoma (HCC) is a major human health burden accounting for approximately 90% of primary liver cancer, it is the 3rd most common cause of cancer-related death worldwide, and the global death rate is projected to reach one million by 20301–3. A large majority of these cases are associated with hepatitis B and C infections, and association with nonalcoholic fatty liver disease (NAFLD) and nonalco-holic steatohepatitis (NASH) is increasing. Changes in glycosylation in serum proteins are often associated with HCC development where glycosylation can act as a critical regulatory mechanism4. Modification of proteins by glycosylation regulates many biological processes including protein folding, stability, or host–pathogen interactions5. For example, glycosylation of the N297 of human IgG is known to modulate interactions with the Fc receptors and subsequent biological and therapeutic responses6–8. It is therefore of considerable interest to quantify accurately the IgG glycoforms.
Studies from our and other laboratories have shown that glycosylation of immunoglobulins and various liver secreted proteins provides a means of serologic detection of fibrotic liver disease9–16. N-glycosylation of immunoglobulin G (IgG), in particular, has been studied extensively9,13,14 but targeted LC–MS/MS quantification of the IgG N297 glycoforms, known to regulate interactions with the Fc receptors and subsequent biological responses has been somewhat limited in the context of liver fibrosis10,11,17,18. We have introduced assays for the monitoring of liver fibrosis by quantification of mucin-type O-glycoforms of hemopexin (HPX)19,20. The studies jointly suggest that LC–MS quantification of the N- and O- protein glycoforms could serve as a useful tool for the monitoring of progression of the fibrotic liver disease provided that the assays become accurate, fast and reproducible. This would fulfil an urgent need for well-qualified biomarker(s) for non-invasive early detection of HCC.
Here we build on our earlier studies20,21 to introduce a multiplexed microflow LC–MS/MS-PRM (mLC-MS/MS) assay for simultaneous quantification of the N-glycoforms of IgG and sialylated O-glycoforms of HPX. Our optimized method allows complete processing (reduction, alkylation and tryptic digestion of proteins) of the unfractionated serum samples in approximately 3 h using Pressure Cycling Technology (Barocycler NEP2320 EXT, Pressure BioSciences, South Easton, MA)19 which is followed by a 5 min analysis of each sample by a targeted LC–MS/MS-PRM assay with online analyte capture, desalting, and gradient elution. We used the method to quantify selected IgG N-glycoforms and HPX O-glycoforms in serum samples of patients with HCV-induced fibrotic liver disease, using a capillary flow LC system (Dionex Ultimate 3000) and Q Exactive-HF mass spectrometer (Thermo). We demonstrate utility of the method in a high-throughput serologic screening setup which opens up the potential for clinically relevant serologic screening of glycopeptide biomarker candidates in the fibrotic liver disease.
Experimental section
Materials and reagents
Ammonium bicarbonate, DL-dithiothreitol (DTT), iodoacetamide (IAA) (Sigma-Aldrich, St. Louis, Missouri, USA); mass spec grade Trypsin/Lys-C mix (Promega, Madison, WI, USA). LC/MS grade Water, 0.1% formic acid in Acetonitrile (ACN), 0.1% formic acid in Water (Thermo Fisher Scientific, Waltham, MA, USA). Acclaim PepMap 100 column, PepMap Trap Cartridge (Thermo Fisher Scientific, Waltham, MA, USA).
Sample processing
Serum samples from control, fibrosis and cirrhosis groups were processed directly by trypsin digestion, without any enrichment step20. Briefly, serum samples (2 µl each) were diluted 1:70 with 25 mM ammonium bi-carbonate; and treated with 5 mM DTT at 60OC for 1 h, followed by 15 mM iodoacetamide for 20 min at RT in the dark, then 5 mM DTT for 20 min at RT. Proteins in a fixed volume of samples from above (20 µL of the reduced and alkylated diluted serum sample) were digested with mass spectrometry grade Trypsin/Lys-C mix (1 µg) at 37 °C in a Barocycler (60 cycles, 1 min hold at 30kpsi). The peptides were analyzed by LC–MS/MS without any additional processing steps.
Micro-flow LC–MS/MS-PRM
LC–MS/MS analysis was performed using capillary-flow Ultimate 3000 RSLCnano chromatography system and a Q-Exactive HF Mass Spectrometer (Thermo) with a nanospray source housing a multinozzle M3 emitter spray tip (Newomics, Berkeley, CA, USA)21. The samples were loaded onto a PepMap C18 Cartridge (1 mm x 5 mm) and desalted using a sample loading pump at 10 μl/min flow rate 0–1 min with 0.1% formic acid in water, following which the peptides were eluted at a 5 μl/min flowrate. A C18 Acclaim PepMap 100 75 μm × 2 cm nanoViper column was directly connected to the multinozzle emitter. A schematic of the gradient (Supplementary Fig. S1) consists of a 1–2.5 min linear gradient of 1–15% ACN in 0.1% aqueous formic acid, followed by 30 s to 90% ACN, then hold at 90% ACN for 1 min, and equilibration of the column for 1 min at 0% ACN. The valve is switched at the equilibration step, and the trap column is equilibrated at 10 μl/min flow rate making it ready for the next sample injection.
A Parallel Reaction Monitoring (PRM) workflow was used for scheduled MS/MS fragmentation of target ions (isolation window m/z 2.0, HCD fragmentation, resolution 30 K). Table 1 shows the peptide glycoforms analyzed in this study, MS data collection parameters, and transitions used for the quantitation. We analyzed simultaneously selected IgG N-glycoforms of the peptide EEQYNSTYR (G0, G0N, G0FN, G0F, G1, G1N, G1FN, G1F), and mono- and di-sialyated HPX O-glycopeptide TPLPPTSAHGNVAEGETKPDPVTER HexNAc(1)Hex(1)Neu5Ac(1), HexNAc(1)Hex(1)Neu5Ac(2)11,20,21. The respective glycan structures are shown in Table 1.
Table 1.
MS data collection parameters for a targeted PRM analysis, and the transitions used for quantitation of the tryptic glycopeptides of IgG and HPX.
| Glycopeptide | Glycan structure | Mass [m/z] | CS [z] | Polarity | Start (min) | End (min) | NCE | Transitions |
|---|---|---|---|---|---|---|---|---|
| G0- EEQYN297STYR |

|
830.001 | 3 | + | 1 | 2.5 | 12 | 1141.2–1143.2 |
| G0N-EEQYN297STYR |

|
897.694 | 3 | + | 1 | 2.5 | 12 | 1242.6–1244.6 |
| G0FN-EEQYN297STYR |

|
946.38 | 3 | + | 1 | 2.5 | 12 | 1317.3–1319.3 |
| G0F-EEQYN297STYR |

|
878.687 | 3 | + | 1 | 2.5 | 12 | 1215.7–1217.7 |
| G1- EEQYN297STYR |

|
884.018 | 3 | + | 1 | 2.5 | 12 | 1141.2–1143.2 |
| G1N- EEQYN297STYR |

|
951.712 | 3 | + | 1 | 2.5 | 12 | 1242.6–1244.6 |
| G1FN- EEQYN297STYR |

|
1000.398 | 3 | + | 1 | 2.5 | 12 | 1317.3–1319.3 |
| G1F- EEQYN297STYR |

|
932.704 | 3 | + | 1 | 2.5 | 12 | 1215.7–1217.7 |
| HexNAc(1)Hex(1)Neu5Ac(1) T24PLPPTSAHGNVAEGETKPDPVTER |
|
843.6 | 4 | + | 2.4 | 4 | 20 | 905.5–907.0 |
| HexNAc(1)Hex(1)Neu5Ac(2) T24PLPPTSAHGNVAEGETKPDPVTER |

|
916.4 | 4 | + | 2.4 | 4 | 20 | 905.5–907.0 |
|
IgG peptide GPSVFPLAPSSK |
593.8 | 2 | + | 2.6 | 4 | 35 | 417.9–419.9, 699.0–701.0, 846.0–848.0 |
*HexNAc: blue rectangle (GlcNAc), yellow rectangle (GalNAc).
Hex: green circle (Man), yellow circle (Gal).
Red triangle (Fuc).
Purple diamond (Neu5Ac).
The glycan structure of the peptides is shown.*
Study population
The sample set was described in our previous study22. Briefly, serum samples of participants in the HALT-C trial, whose fibrotic status was determined by ISHAK score based on liver biopsy, were obtained from the central repository at the National Institute of Diabetes and Digestive and Kidney Diseases (NIDDK). The HALT-C trial is a prospective randomized controlled trial of 1050 patients that evaluated the effect of long-term low-dose peginterferon alpha-2a in patients who failed initial anti-HCV therapy with interferon23. All the patients in our study were from the control arm of the trial and were compared to disease-free controls frequency matched on age, race and gender; that the controls donated blood samples at Georgetown University (GU) in line with an approved IRB protocol. In this study, we analyzed 15 disease free controls, 15 HCV fibrotic (Ishak score 3–4), and 15 HCV cirrhotic (ISHAK score 5–6) patients. (Supplementary Table S1).
Data analysis
LC–MS/MS data were processed by Quan Browser (Thermo) to deduce the peak areas based on the listed transition ions (Table 1). The peak areas of the IgG glycoforms were normalized against the log2 peak area of an internal IgG peptide GPSVFPLAPSSK, quantified simultaneously. The internal peptide peak area was calculated by summing the intensity of three product ions. For the measure of O-HPX the ratio of disialoT-(HexNAc(1)Hex(1)Neu5Ac(2) over monosialoT-HexNAc(1)Hex(1)Neu5Ac(1) was calculated based on their respective peak areas and defined as S-HPX, as described previously20.
Statistical analysis of the datasets was performed using GraphPad Prism software (v9.4.1). The distribution of normalized peak areas of the IgG glycoforms, and S-HPX were compared between the disease groups, and the data was visualized by a nested Tukey plot. The descriptive statistics such as minimum, maximum, mean, and standard deviation were summarized for each analyte. One-way ANOVA tests, two-sample t-tests, and the area under the receiver operating characteristic curve (AuROC) along with sensitivity and specificity were used to evaluate the ability of each analyte to separate the disease groups. In parallel, Kruskal–Wallis and Wilcoxon tests were used to account for non-normality in analytes. A two-sided significance level of 0.05 was used for statistical significance.
Institutional review board statement
The study was conducted according to the guidelines of the Declaration of Helsinki, and approved by the Institutional Review Board of Georgetown University, IRB code: 2008-549, study: Glycans in Hepatocellular Carcinoma22. All participants provided written informed consent.
Results and discussion
In this study, a multiplexed microflow LC–MS/MS PRM method was developed to quantify simultaneously selected IgG N-glycopeptides and sialylated HPX O-glycopeptides in a 5 min run at a 5 µl/min flow rate. We do this because the fibrotic liver pathology leads to changes in the secreted proteome and its glycosylation which can be efficiently captured by serologic analysis of the glycopeptides. Our prior studies showed that both N-glycosylation and O-glycosylation pathways are altered20,22,24,25 and we expected that their simultaneous quantification will provide an improved reflection of the liver pathology. However, fast and robust analytical methods is a prerequisite for a clinically relevant assay which prompted us to optimize this multiplexed fast method.
A standard QE-HF mass spectrometer coupled to Dionex capillary flow LC system proved adequate as the analytical equipment of choice, and the introduction of the analytes to the MS was improved by the use of a multinozzle M3 emitter spray tip (Newomics)21. The higher flow rate in mFlow-LC reduces the gradient time in comparison to traditional nanoflow LC–MS/MS, and increases the reproducibility and robustness of the measurements26,27. Use of a multinozzle emitter tip that splits the flow evenly into multiple smaller streams enhance the ionization efficiency28. This helped us develop a fast, robust method for a multiplex analysis of N- and O-glycopeptides in one analytical run using commonly available equipment. This means that this type of assay can now be adapted for clinical-type sample screening in other laboratories which is one of the goals of our study. Since the IgG and HPX proteins are abundant in serum, the readily available QE-HF mass spectrometer is fully adequate compared to more sensitive mass analyzers on the market or used in our previous studies11,20,21,25. To achieve time efficiency, sample preparation from crude serum was performed without any pre-fractionation steps using pressure cycling in a barocycler. This enabled us to complete the sample preparation and MS sample analysis on the same day. The throughput could be further improved by implementing fast reduction, alkylation and sample digestion in one-step using accelerated barocycler techniques29,30.
LC–MS analysis was performed using an efficient 5 min microflow gradient. Online analyte captures and desalting was achieved using a trap cartridge at 10 µl min flow rate, followed by analysis using a column connected directly to a multinozzle spray emitter. Sample elution was performed with a 2 min gradient, followed by column regeneration for 1 min, and equilibration for 1 min which is used simultaneously for the next sample loading. This allowed us to complete a sample-run in triplicate in 15 min. This is a highly efficient setup especially in view of the fact that we multiuplex quantification of relevant N- and O-glycopeptides in the same run. Quantification of sialylated O-glycoforms of HPX was performed as it is a potential biomarker; we did not observe changes in sialylated N-glycoforms of IgG in the context of fibrotic liver disease, thus it was not a target in current analysis.
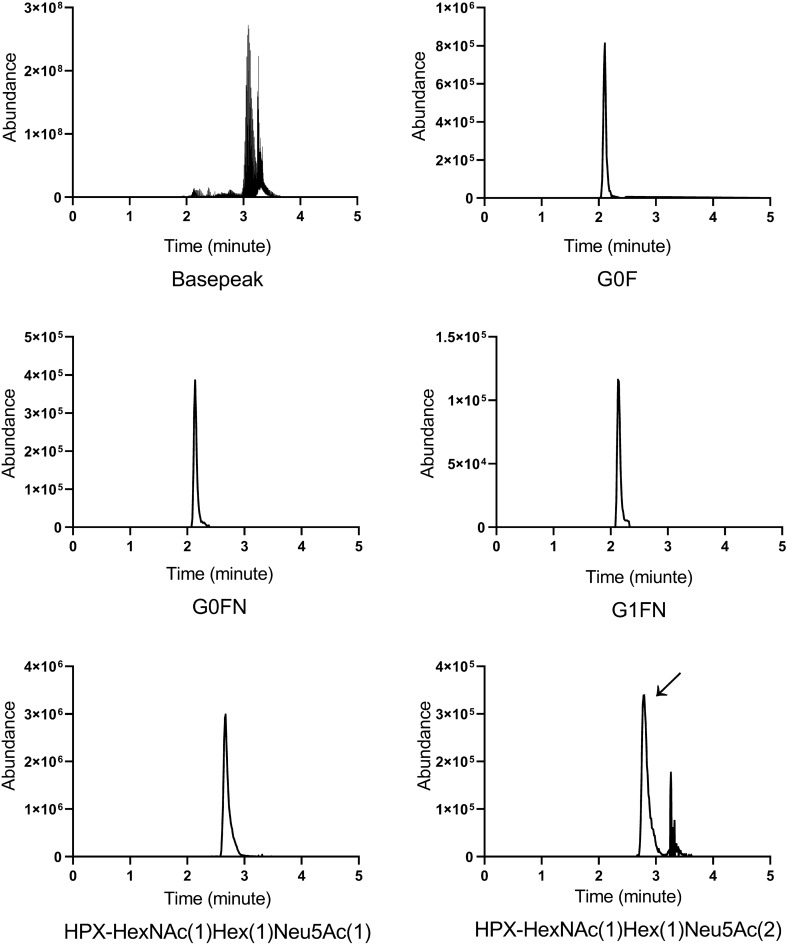
We targeted selected glycoforms of IgG N-glycopetide EEQYN297STYR, namely G0-HexNAc(4)Hex(3), G0N-HexNAc(5)Hex(3), G0F-HexNAc(4)Hex(3)Fuc(1), G0FN-HexNAc(5)Hex(3)Fuc(1), G1-HexNAc(4)Hex(4), G1F-HexNAc(4)Hex(4)Fuc(1), G1FN-HexNAc(5)Hex(4)Fuc(1), and G1N-HexNAc(5)Hex(4); together with the O-HPX glycoforms HexNAc(1)Hex(1)Neu5Ac(1) and HexNAc(1)Hex(1)Neu5Ac(2) of peptide T24PLPPTSAHGNVAEGETKPDPVTER in a multiplexed format (respective glycan structures shown in Table 1). The product ions for the IgG N-glycopeptides were collected at low energy HCD setting11. The peak areas of G0, G0N, G0F, and G0FN were calculated from the product ions which resulted from a selective loss of one HexNAc from the parent glycopeptide; the G1, G1F, G1FN, and G1N products resulted from the loss of one HexNAc-Hex fragment. The peak areas of the O-HPX glycoforms were calculated from the loss of the glycan resulting in a peptide backbone transition20. The elution profiles of selected informative analytes are shown in Fig. 1.
Figure 1.
Representative extracted ion chromatograms showing the elution of selected IgG and HPX glycoforms.
The fast microflow gradient assures that the retention times of the analytes are consistent between the runs (Fig. 2). Peak elution times for the G0 and G1 analytes were 2.16 ± 0.05 min; G0F, G0N, G1F, and G1N 2.16 ± 0.04 min; G0FN and G1FN 2.20 ± 0.04 min; HPX-HexNAc(1)Hex(1)Neu5A(1) 2.73 ± 0.05 min and HPX-HexNAc(1)Hex(1)Neu5A(2) 2.84 ± 0.04 min. Overall, the observed drift of the peak retention time of < 0.1 min over 180 injections demonstrates excellent chromatographic reproducibility.
Figure 2.
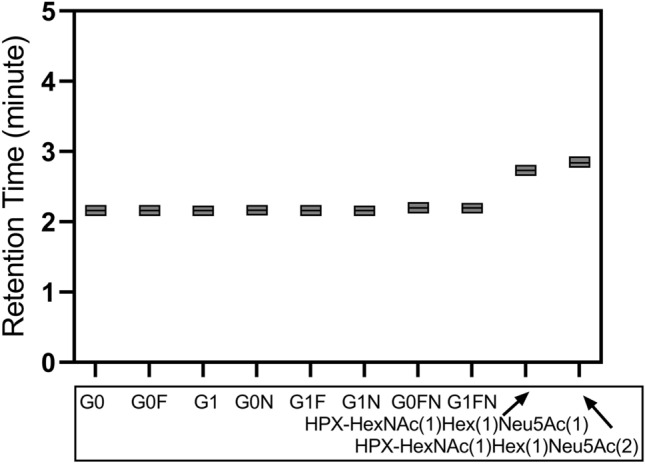
Observed retention times of the IgG and HPX glycopeptides. Each box represents the elution time spread (y-axis) of the indicated glycopeptide (x-axis), and the mean RT is indicated by a line in the box.
As a proof of principle, we used the assay to quantify the analytes in the serum of fibrotic (n = 15) and cirrhotic (n = 15) hepatitis C patients compared to a group of disease-free controls (n = 15). The peak areas of the IgG N-glycoforms were normalized to the average peak area of an internal IgG peptide. S-HPX was used as the measure of the O-HPX glycoforms, as described in the methods20,21. Statistical analyses were performed to assess the association between the analytes and disease groups and the mean, standard deviation and p-values from one-way ANOVA analysis is shown in Table 2. The observed p-values for the analytes G0F, G0FN, G1FN, and S-HPX were < 0.001.
Table 2.
Differences in the analyte distributions in controls and fibrotic or cirrhotic disease groups.
| Marker | Mean ± SD | p value | ||
|---|---|---|---|---|
| CTRL | FIB | CIR | ANOVA (Kruskal–Wallis) | |
| G0 | 7955 ± 3670 | 12,648 ± 4832 | 16,861 ± 8479 | 0.001 (0.001) |
| G0N | 41,232 ± 22,263 | 69,968 ± 31,380 | 98,070 ± 52,119 | 0.001 (0.001) |
| G0F | 53,845 ± 23,051 | 105,243 ± 38,999 | 133,037 ± 63,708 | < 0.001 (< 0.001) |
| G0FN | 19,124 ± 9444 | 47,675 ± 22,405 | 57,712 ± 19,918 | < 0.001 (< 0.001) |
| G1 | 7278 ± 2825 | 9044 ± 2242 | 11,782 ± 3796 | 0.001 (0.003) |
| G1N | 44,160 ± 18,270 | 49,241 ± 15,714 | 67,025 ± 29,678 | 0.018 (0.077) |
| G1F | 72,900 ± 24,774 | 88,383 ± 21,241 | 110,607 ± 39,967 | 0.005 (0.012) |
| G1FN | 10,280 ± 3953 | 16,698 ± 6450 | 20,071 ± 3816 | < 0.001 (< 0.001) |
| Mono-sialyated-HPX | 150,977,194 ± 42,469,521 | 106,900,429 ± 39,350,120 | 78,181,642 ± 34,237,671 | < 0.001 (< 0.001) |
| di-sialyated-HPX | 30,787,118 ± 9,482,062 | 30,177,484 ± 10,252,754 | 39,805,422 ± 10,405,085 | 0.020 (0.011) |
| S-HPX | 0.09 ± 0.0296 | 0.173 ± 0.163 | 0.349 ± 0.188 | < 0.001 (< 0.001) |
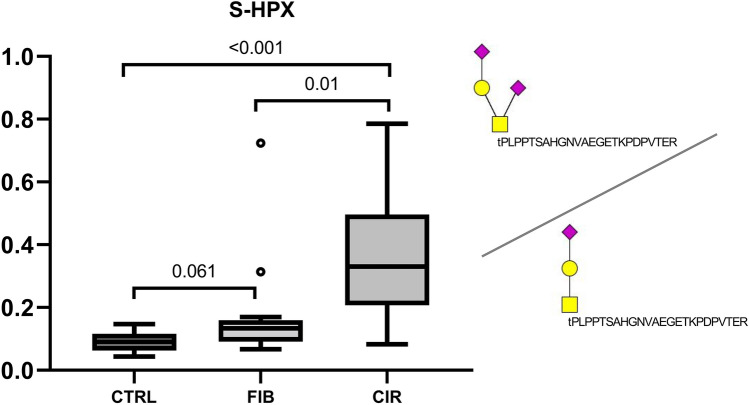
T-test was performed to assess the association of each analytes between control vs fibrosis, fibrosis vs cirrhosis, and control vs cirrhosis groups (Supplementary Results—Table S2). All of the analytes measured in this study separated control vs cirrhosis group (p ≤ 0.004, except G1N p = 0.017). Most IgG analytes did not separate efficiently fibrotic and cirrhotic patients (p > 0.05), except G1 (p = 0.02) and G1N (0.05). But they (except G1 and G1N) separate the controls from the fibrotic group. The G0FN (p < 0.001) and G0F (p < 0.001) glycoforms separate these two groups most efficiently as shown by a nested tukey plot (Fig. 3); please see supplementary figure S2 for the other IgG analytes. To the contrary, the S-HPX separates efficiently the fibrosis and cirrhosis groups (p = 0.01) but is less efficient in separating the control and fibrosis groups groups (Fig. 4).
Figure 3.
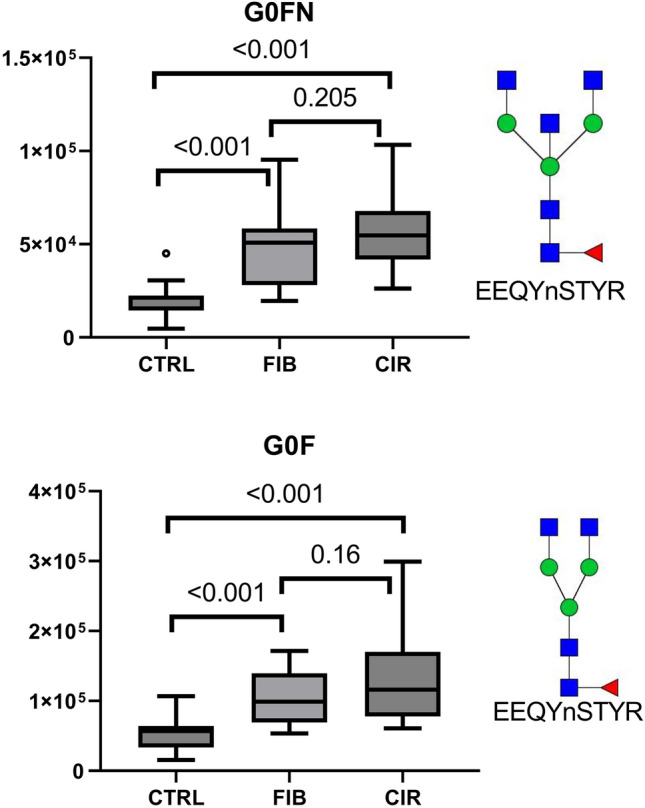
Quantification of the IgG glycoforms in control (CTRL n = 15), fibrosis (FIB n = 15), and cirrhosis (CIR n = 15) patients. IgG1 N-glycoforms G0FN, and G0F increase significantly in the fibrotic patients compared to the control group. The blue rectangle represents HexNAc (GlcNAc), green circle Hex (Man), and red triangle Fuc.
Figure 4.
Quantification of S-HPX in the control, fibrosis, and cirrhosis groups (n = 15 each). S-HPX increases significantly in cirrhosis group compared to control (p < 0.001) and fibrosis (0.01) groups. The yellow rectangle represents HexNAc (GalNAc), yellow circle Hex (Gal), and purple diamond Neu5Ac.
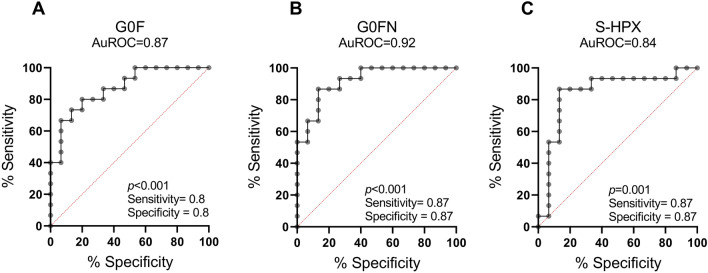
The results from above statistical analysis indicate that a combination of the IgG G0FN and G0F with S-HPX may provide an efficient way to assess progression of the fibrotic liver disease from mild to advanced stages. The independent AuROC analyses using the two IgG N-glycoforms to compare normal vs. fibrotic groups and S-HPX to compare the fibrotic vs. cirrhotic groups confirms that. The G0FN and G0F glycoforms achieve AuROCs of 0.92 and 0.87, respectively, in separating the fibrosis from control groups and the S-HPX separated cirrhosis from control with AuROC of 0.84 (Fig. 5 and Supplementary Table S3).
Figure 5.
AuROC analyses of the IgG glycoforms G0FN (A) and G0F (B) between the liver fibrosis and control groups, and of the S-HPX (C) between the fibrosis and cirrhosis groups.
To summarize, we optimized multiplex analysis of the N-glycoforms of IgG and O-glycoforms of HPX in one analytical run. The simultaneous analysis of the two classes of glycosylated peptides is informative for serologic assessment of liver fibrosis and is completed in 5 min which further reduces time of analysis by 8 min compared to our previous report21, a 2.5-fold improvement in time efficiency. We also transferred the analyses to a common LC–MS/MS platform which can be adopted for routine testing. This study measured the N- and O- glycoforms in one LC–MS run which allowed an efficient serologic quantitative assessment of the advancing liver fibrosis by assessment of the two independent glycosylation pathways simultaneously. We propose that the use of the IgG G0FN and G0F in combination with S-HPX can be readily evaluated as a means of non-invasive serologic assessment of liver fibrosis in large clinically relevant datasets. We anticipate that the microflow LC–MS/MS-PRM methods will be a useful avenue for the quantification of various glycopeptides in biological and clinical materials.
Supplementary Information
Acknowledgements
Further support was provided by the Office of The Director, National Institutes of Health under Award Number S10OD023557 supporting the operation of the Clinical and Translational Glycoscience Research Center, and Georgetown University, CCSG Grant P30 CA51008 (to Lombardi Comprehensive Cancer Center) supporting the Proteomics and Metabolomics Shared Resource.
Author contributions
Conceptualization, A.P., M.S.; methodology, A.P., M.S., and J.B.; investigation, A.P., L.Z., and J.B.; formal analysis, A.P., L.Z., J.A.; resources, R.G.; data curation, A.P. and J.A.; writing—original draft preparation, A.P.; review and editing, A.P., J.A. and R.G.; supervision; project administration, R.G.; funding acquisition, R.G. All authors have read and agreed to the published version of the manuscript.
Funding
National Institutes of Health, U01CA230692, R01CA238455 and R01CA135069.
Data availability
The mass spectrometry data have been deposited to the jPOST repository31. The accession numbers are JPST001900 for jPOST and PXD037687 for ProteomeXchange. https://repository.jpostdb.org/preview/8780388286356d3f10eb5c. Access key: 1144.
Competing interests
The authors declare no competing interests.
Footnotes
Publisher's note
Springer Nature remains neutral with regard to jurisdictional claims in published maps and institutional affiliations.
Supplementary Information
The online version contains supplementary material available at 10.1038/s41598-023-27382-0.
References
- 1.Ginès P, et al. Liver cirrhosis. Lancet (London, England) 2021;398:1359–1376. doi: 10.1016/S0140-6736(21)01374-X. [DOI] [PubMed] [Google Scholar]
- 2.Yang JD, et al. A global view of hepatocellular carcinoma: trends, risk, prevention and management. Nat. Rev. Gastroenterol. Hepatol. 2019;16:589–604. doi: 10.1038/s41575-019-0186-y. [DOI] [PMC free article] [PubMed] [Google Scholar]
- 3.El-Serag HB, Rudolph KL. Hepatocellular carcinoma: epidemiology and molecular carcinogenesis. Gastroenterology. 2007;132:2557–2576. doi: 10.1053/j.gastro.2007.04.061. [DOI] [PubMed] [Google Scholar]
- 4.Mehta A, Herrera H, Block T. Glycosylation and liver cancer. Adv. Cancer Res. 2015;126:257–279. doi: 10.1016/bs.acr.2014.11.005. [DOI] [PMC free article] [PubMed] [Google Scholar]
- 5.Schjoldager KT, Narimatsu Y, Joshi HJ, Clausen H. Global view of human protein glycosylation pathways and functions. Nat. Rev. Mol. Cell Biol. 2020;21:729–749. doi: 10.1038/s41580-020-00294-x. [DOI] [PubMed] [Google Scholar]
- 6.Anthony RM, Wermeling F, Ravetch JV. Novel roles for the IgG Fc glycan. Ann. NY Acad. Sci. 2012;1253:170–180. doi: 10.1111/j.1749-6632.2011.06305.x. [DOI] [PubMed] [Google Scholar]
- 7.Arnold JN, Wormald MR, Sim RB, Rudd PM, Dwek RA. The impact of glycosylation on the biological function and structure of human immunoglobulins. Annu. Rev. Immunol. 2007;25:21–50. doi: 10.1146/annurev.immunol.25.022106.141702. [DOI] [PubMed] [Google Scholar]
- 8.Reusch D, Tejada ML. Fc glycans of therapeutic antibodies as critical quality attributes. Glycobiology. 2015;25:1325–1334. doi: 10.1093/glycob/cwv065. [DOI] [PMC free article] [PubMed] [Google Scholar]
- 9.Scott DA, et al. GlycoFibroTyper: a novel method for the glycan analysis of igg and the development of a biomarker signature of liver fibrosis. Front. Immunol. 2022;13:797460. doi: 10.3389/fimmu.2022.797460. [DOI] [PMC free article] [PubMed] [Google Scholar]
- 10.Yuan W, Sanda M, Wu J, Koomen J, Goldman R. Quantitative analysis of immunoglobulin subclasses and subclass specific glycosylation by LC-MS-MRM in liver disease. J. Proteomics. 2015;116:24–33. doi: 10.1016/j.jprot.2014.12.020. [DOI] [PMC free article] [PubMed] [Google Scholar]
- 11.Sanda M, Goldman R. Data independent analysis of IgG glycoforms in samples of unfractionated human plasma. Anal. Chem. 2016;88:10118–10125. doi: 10.1021/acs.analchem.6b02554. [DOI] [PMC free article] [PubMed] [Google Scholar]
- 12.Vanderschaeghe D, et al. GlycoFibroTest is a highly performant liver fibrosis biomarker derived from DNA sequencer-based serum protein glycomics. Mol. Cell. Proteomics. 2009;8:986–994. doi: 10.1074/mcp.M800470-MCP200. [DOI] [PMC free article] [PubMed] [Google Scholar]
- 13.Klein A, Carre Y, Louvet A, Michalski J-C, Morelle W. Immunoglobulins are the major glycoproteins involved in the modifications of total serum N-glycome in cirrhotic patients. Proteomics. Clin. Appl. 2010;4:379–393. doi: 10.1002/prca.200900133. [DOI] [PubMed] [Google Scholar]
- 14.Vanderschaeghe D, et al. Endoglycosidase S enables a highly simplified clinical chemistry procedure for direct assessment of serum IgG undergalactosylation in chronic inflammatory disease. Mol. Cell. Proteomics. 2018;17:2508–2517. doi: 10.1074/mcp.TIR118.000740. [DOI] [PMC free article] [PubMed] [Google Scholar]
- 15.Yuan W, Benicky J, Wei R, Goldman R, Sanda M. Quantitative analysis of sex-hormone-binding globulin glycosylation in liver diseases by liquid chromatography-mass spectrometry parallel reaction monitoring. J. Proteome Res. 2018;17:2755–2766. doi: 10.1021/acs.jproteome.8b00201. [DOI] [PMC free article] [PubMed] [Google Scholar]
- 16.Sanda M, Zhang L, Edwards NJ, Goldman R. Site-specific analysis of changes in the glycosylation of proteins in liver cirrhosis using data-independent workflow with soft fragmentation. Anal. Bioanal. Chem. 2017;409:619–627. doi: 10.1007/s00216-016-0041-8. [DOI] [PMC free article] [PubMed] [Google Scholar]
- 17.de Haan N, Falck D, Wuhrer M. Monitoring of immunoglobulin N- and O-glycosylation in health and disease. Glycobiology. 2020;30:226–240. doi: 10.1093/glycob/cwz048. [DOI] [PMC free article] [PubMed] [Google Scholar]
- 18.Plomp R, Bondt A, de Haan N, Rombouts Y, Wuhrer M. Recent advances in clinical glycoproteomics of immunoglobulins (Igs) Mol. Cell. Proteomics. 2016;15:2217–2228. doi: 10.1074/mcp.O116.058503. [DOI] [PMC free article] [PubMed] [Google Scholar]
- 19.Sanda M, Pompach P, Benicky J, Goldman R. LC-MS3 quantification of O-glycopeptides in human serum. Electrophoresis. 2013;34:2342–2349. doi: 10.1002/elps.201200658. [DOI] [PMC free article] [PubMed] [Google Scholar]
- 20.Sanda M, et al. Increased sialylation of site specific O-glycoforms of hemopexin in liver disease. Clin. Proteomics. 2016;13:24. doi: 10.1186/s12014-016-9125-x. [DOI] [PMC free article] [PubMed] [Google Scholar]
- 21.Panigrahi, A. et al. A rapid LC-MS/MS-PRM assay for serologic quantification of sialylated O-HPX glycoforms in patients with liver fibrosis. Molecules27, (2022). [DOI] [PMC free article] [PubMed]
- 22.Benicky J, Sanda M, Pompach P, Wu J, Goldman R. Quantification of fucosylated hemopexin and complement factor H in plasma of patients with liver disease. Anal. Chem. 2014;86:10716–10723. doi: 10.1021/ac502727s. [DOI] [PMC free article] [PubMed] [Google Scholar]
- 23.Di Bisceglie AM, et al. Prolonged therapy of advanced chronic hepatitis C with low-dose peginterferon. N. Engl. J. Med. 2008;359:2429–2441. doi: 10.1056/NEJMoa0707615. [DOI] [PMC free article] [PubMed] [Google Scholar]
- 24.Darebna P, et al. Changes in the expression of N- and O-glycopeptides in patients with colorectal cancer and hepatocellular carcinoma quantified by full-MS scan FT-ICR and multiple reaction monitoring. J. Proteomics. 2017;153:44–52. doi: 10.1016/j.jprot.2016.09.004. [DOI] [PMC free article] [PubMed] [Google Scholar]
- 25.Ma J, Sanda M, Wei R, Zhang L, Goldman R. Quantitative analysis of core fucosylation of serum proteins in liver diseases by LC-MS-MRM. J. Proteomics. 2018;189:67–74. doi: 10.1016/j.jprot.2018.02.003. [DOI] [PMC free article] [PubMed] [Google Scholar]
- 26.Bian, Y. et al. Robust, reproducible and quantitative analysis of thousands of proteomes by micro-flow LC-MS/MS. Nat. Commun.11, (2020). [DOI] [PMC free article] [PubMed]
- 27.Kuster B, et al. Robust microflow LC-MS/MS for proteome analysis: 38,000 runs and counting. Anal. Chem. 2021;93:3686–3690. doi: 10.1021/acs.analchem.1c00257. [DOI] [PMC free article] [PubMed] [Google Scholar]
- 28.Chen Y, Mao P, Wang D. Quantitation of intact proteins in human plasma using top-down parallel reaction monitoring-MS. Anal. Chem. 2018;90:10650–10653. doi: 10.1021/acs.analchem.8b02699. [DOI] [PMC free article] [PubMed] [Google Scholar]
- 29.Guo T, et al. Rapid mass spectrometric conversion of tissue biopsy samples into permanent quantitative digital proteome maps. Nat. Med. 2015;21:407–413. doi: 10.1038/nm.3807. [DOI] [PMC free article] [PubMed] [Google Scholar]
- 30.Lucas N, et al. Accelerated Barocycler Lysis and extraction sample preparation for clinical proteomics by mass spectrometry. J. Proteome Res. 2019;18:399–405. doi: 10.1021/acs.jproteome.8b00684. [DOI] [PubMed] [Google Scholar]
- 31.Okuda S, et al. jPOSTrepo: an international standard data repository for proteomes. Nucleic Acids Res. 2017;45:D1107–D1111. doi: 10.1093/nar/gkw1080. [DOI] [PMC free article] [PubMed] [Google Scholar]
Associated Data
This section collects any data citations, data availability statements, or supplementary materials included in this article.
Supplementary Materials
Data Availability Statement
The mass spectrometry data have been deposited to the jPOST repository31. The accession numbers are JPST001900 for jPOST and PXD037687 for ProteomeXchange. https://repository.jpostdb.org/preview/8780388286356d3f10eb5c. Access key: 1144.


