Abstract
Long waiting times in outpatient clinics have multiple adverse effects on patients and their attendants, staff and hospital management. Several approaches practiced to manage the cycle time have been proposed. The purpose of this study was to evaluate the impact of implementing closed-loop based multiple approaches together. This study was conducted in Aravind Eye Hospital (AEH), Madurai, India where several approaches to manage cycle times have been implemented over the years. Scheduling system was introduced to manage COVID-19 specific norms. We compared the cycle times in general outpatient clinics in a regime in which multiple approaches were practiced together before and after introducing scheduling to regimes in which individual approaches were practiced. We analysed how the cycle time varied by patient load. Cycle time for all patient days when the combined approach was used was 19% lower than baseline, and better than under each of the individual approaches. The outcome sustained even during the COVID-19 pandemic that necessitated additional processes and procedures. Therefore, implementing multiple approaches can be more effective to reduce the cycle time than implementing individual approaches
Keywords: Cycle time, evidence based management, COVID-19, systematic approach, closed-loop outpatient clinic
Background
Long patient wait times are non-value added times in outpatient clinics (OPCs), which result in prolonged cycle times, inefficiencies, overworked staff and, most importantly, unhappy patients.1 Wait times are caused by an imbalance between the numbers of patients arriving at each service station and the number being examined within a specified time frame.2 Collectively, wait times at multiple stations of the examination process often account for more than half of the cycle time,3 which is the total time spent between registration and the end of the patient visit. In general, patients prefer to continue in a hospital for further treatment only if they feel satisfied with their experience in the OPC.4 Therefore, it is important for hospitals to focus on managing wait times, thereby improving patient satisfaction and increasing service demand.
In order to manage wait times and find ways to reduce them, we need to recognise that hospitals are complex systems with several subsystems.5 Patients pass through a series of stations at the OPC, including registration, identifying insurance and financial status, recording vital signs and history, investigations and finally the doctor’s examination. Furthermore, wait times at different stations influence each other and often the interactions between them are difficult to track.
Generally, OPCs are designed as open-loop systems, which means that clinicians are unable to modify the system based on ongoing feedback about performance outcomes such as wait times. In such a system, clinicians are allowed to assign a patient to the next station after completing service at a given station without knowing this patient’s wait time at the next station. Assigning patients without knowing about the status at downstream stations creates an imbalance and unnecessary queues in the system. At the same time, resources that are unused during periods of slack cannot be used in the future.6
Several factors contribute to the wait time. Patient volume varies throughout the year, which makes it difficult to plan resources. Uneven arrival patterns of patients create imbalance within the system. Hospitals that offer appointments face challenges due to no-shows, late patient arrivals, late arrival of doctors and so on. When a patient with multiple pathologies is referred to another clinic, the patient is added to the existing queue in the other clinic. Inability to coordinate in assigning patients to the appropriate resources, lack of clarity about whether returning patients need to go through all the stations, and difficulty in mobilizing additional resources when needed, all contribute to wait times.
There is considerable interest in improving the cycle time at OPCs. A set of studies have developed simulation models of scheduling, resource allocation or patient flow.7 -9 For instance, a discrete event simulation model was developed to test individual strategies for improving patient turnaround times, and design of experiment was employed to assess the joint effect of multiple factors. The recommendations were subsequently deployed in an eye hospital.9 Additionally, several hospitals have used continuous quality improvement approaches such as Lean – eliminating waste throughout the process; Six Sigma – eliminating the causes of defects; and Plan-Do-Study-Act (PDSA) – testing new ideas and strategies.1,3,10
In studies conducted in 2014-201511 -14 at Aravind Eye Hospital (AEH), Madurai, India, Munavalli et al identified ways to improve patient flow and wait times, following closed-loop theory. In their analysis, the authors noted the necessity and importance of migrating OPCs from open-loop to closed-loop systems. A closed-loop system synchronizes the status of upstream stations with those of downstream stations. Munavalli et al11 recommended a resource planning model (RPM) that sized resources according to demand in the short term and could reduce cycle time by 23%, from 120 to 92 min. By comparison, an integral patient scheduling (IPS) model coupled with assessment of the actual system status of all departments in the OPC14 resulted in a 12% reduction of cycle time, from 120 to 105 min. The real-time coordination (RTC) model12 reduced cycle time by 29%, from 120 to 85 min. Each of these models was implemented one at a time after being evaluated in simulations. Among these models, the RTC model, which provides feedback when the output deviates from the internally defined standard, was found to be most efficient and patient-friendly, with greater reduction in wait times.
The literature on managing cycle time is abundant; however, it is mostly based on simulation, and lacks comprehensive solutions that would be practically feasible in outpatient clinics.7 Also, most studies are based on hospitals that practice an appointment system. A few studies discuss implementation but discuss only one approach, addressing a part of the whole problem. Implementing these approaches individually is not desirable in practice. Research15,16 shows that optimal patient flow can only be achieved when resource allocation, scheduling policy and patient flow patterns are analysed and addressed together. This integrated approach, however, is rarely implemented or compared to individual approaches.
Outpatient clinics at Aravind Eye Hospital (AEH) are only walk-ins and do not allow appointments. The closed-loop theory based approaches that Munavalli et al11 –14 experimented with were operationalized in AEH’s processes and software systems with appropriate customization. The introduction of electronic medical record system in 2015 enabled more real-time interactions. When COVID-19 forced a reduction in patient load to maintain social distance and sanitation, AEH introduced a new scheduling system in May 2020, which allowed a limited number of patients to be registered per hour and still maintaining efficiency.
In hospitals, optimization models are generally implemented but no follow-up is conducted. Studying the long term outcome of the implementation of these models would provide various dimensions to the study, as well as support for determining their robustness and applicability. As a result, the same optimization models can be applied to a variety of workflows, and fine-tuned based on the feedback.
The aim of the current study was to determine the impact on the cycle time of practicing multiple approaches concurrently, compared to the results of previous studies that assessed implementation of one approach at a time, at AEH Madurai. In addition, we assessed the impact after introducing a scheduling system over the existing approaches, to manage the new norms of the Covid-19 pandemic.
Materials and Methods
Study setting
A retrospective descriptive study was conducted at AEH, Madurai, the first hospital of the Aravind Eye Care System (AECS), India, established in 1976. AECS has a network of 7 tertiary, 6 secondary, 6 community and 104 primary eye care centres in Tamil Nadu, Andhra Pradesh and Pondicherry states in southern India. In April 1 2019 to March 31 2020, over 4.6 million outpatient visits were handled and over 500,000 eye care treatment procedures were performed at AECS facilities.
In the study site at AEH Madurai, 670,073 outpatients were examined in 2019-2020, at an average of 2160 per day. At the beginning of COVID-19 the outpatient volume dropped to 5%, but improved as the lockdown was eased and more transport facilities became available. Approximately 70% of the regular patient volumes were examined during the study period August to November 2020.
Aravind outpatient workflow
Over a period of time, AEH has optimized its workflow to reduce patient wait time and cycle time. We will first explain the working and the workflow at AEH and then the existing optimization technique used by AEH are explained.
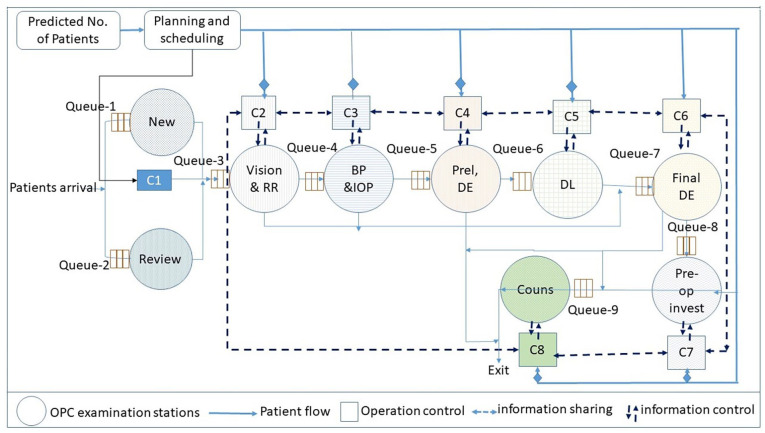
The outpatient service at AEH Madurai is open from 7 am to 6 pm, Monday-Saturday. Patients come as walk-ins, according to their convenience. Outpatients visiting the hospital for the first time are asked to fill out the registration form with patient information, as well as provide consent to administer necessary drugs and conduct required investigations. A unique identification number (UIN) is generated for each new patient, and the patient is assigned to one of four general clinics according to patient load. Patients who come for review examinations are registered using their previous UIN and assigned to the appropriate clinics based on the details of their previous visits. As part of the registration process, a list of stations is generated according to the patient's complaint, previous visit advice and protocol. This list directs the patient where to go next. All patients undergo vision test (V), refraction (RR), intraocular pressure (IOP) measurement, blood pressure (BP) measurement, preliminary examination (Prel), dilation (DL) for fundus examination, doctor examination (DE), Pre-operative investigation (Pre-op invest) and finally counselling (Couns) (Figure 1). The patient workflow in the OPC starts with registration and finishes with the final examination. A patient after registration (either new or review) moves through various departments in any of the pathways: V-IOP-RR-BP-Prel-DL-DE-Couns. IOP and blood pressure are checked for patients over 40 years of age. RR is checked for all the patients with presenting vision of less than 6/6 (20/20) as well as based on the doctor’s advice.
Figure 1.
Functional and operational structure of a closed-loop outpatient clinic (OPC) for assigning the patients to the next station.
Existing optimization techniques practiced at AEH Madurai for managing cycle time
Information technology-based solutions were implemented in 1991 to manage all patient care areas including registration, billing, clinic management, medical records, counselling, inpatients reservation, admission, operation room, inpatient ward and so on. The platform was replaced in 2016 with eyeNotes, a comprehensive system developed by AEH that includes patient care management and electronic medical records. eyeNotes was developed using Microsoft (MS) technology (asp.net) and Google Angular for frontend with MS SQL server 2016 database at the backend. HTML, MS SQL server reporting services and Google chart for reports and dashboards. These systems improved overall efficiency by enabling capture of necessary data as part of patient flow and interaction of patients at various stations and real-time information for managing operations, planning and decision-making.
During the early 1990s AEH also adopted problem-solving methods. Problem areas that are identified for improvement are discussed during the weekly managers meeting following a structured process. In recent years, Lean, Six Sigma and Plan-Do-Study-Act methods have been used. The following are some of the main strategies that have been introduced.
Annual prediction
To manage uncertain inflow of walk-in patients, at the beginning of each year AEH undertakes an exercise (Figure 2) to develop an annual calendar (Annexure) of daily anticipated patients load in a systematic way. The calendar is used as a reference for operational and resource planning and is regularly updated to current reality.
Figure 2.
Outpatients load calendar development process.
Predictive resource planning
Based on the predicted patient load and arrival pattern of patients, monthly manpower resource needs are scheduled. A daily meeting is held to review the patient load, confirm the availability of resources as required by planning, and arrange alternative or additional resources when necessary. The patient demand is analysed timeslot wise in a day (short term) and depending on the demand the resources like doctors and paramedics are allocated to the departments. The resources are allocated in such a way that the patient flow is continuous throughout.
Managing uneven arrival of patients
To manage peak loads, AEH follows ‘Zero @ 10 am’, a goal of completing examinations of all patients registered before 9 am by 10 am. This enables capacity to be available for patients coming during peak hours, which are 9 am to 12 noon. In addition, postoperative and local patients are encouraged to arrive in the afternoon hours, which are post-peak.
Integrated patient scheduling
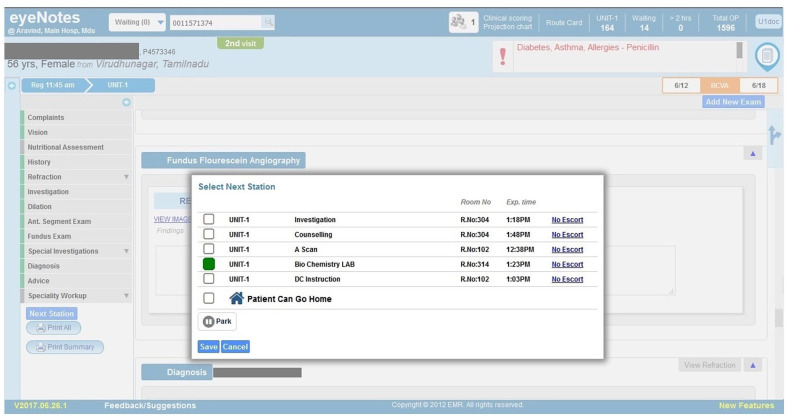
EMR gives real-time information about patients waiting as well as active resources available, which allows the system to implement a closed loop for providing reliable, accurate and real-time information on cycle times. For example, after a patient completes an examination at each station, the EMR indicates to the provider pending examinations with approximate time required for a new patient arriving at each station (Figure 3). This technique uses the system status in real time and schedules the patients to the pathways or departments so that the patient’s wait time and cycle time is minimized.
Figure 3.
Assigning next station based on expected time.
Real-time coordination
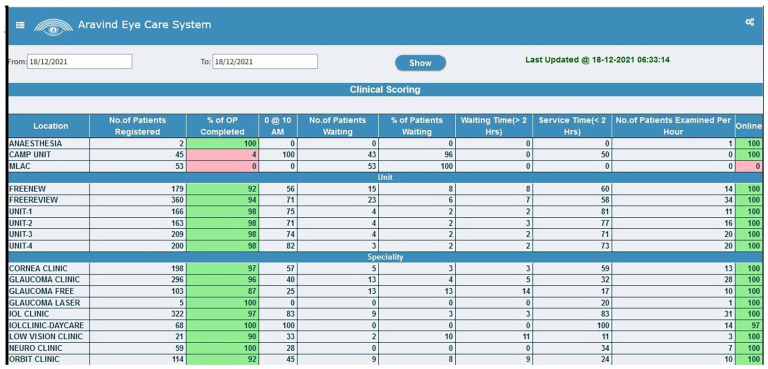
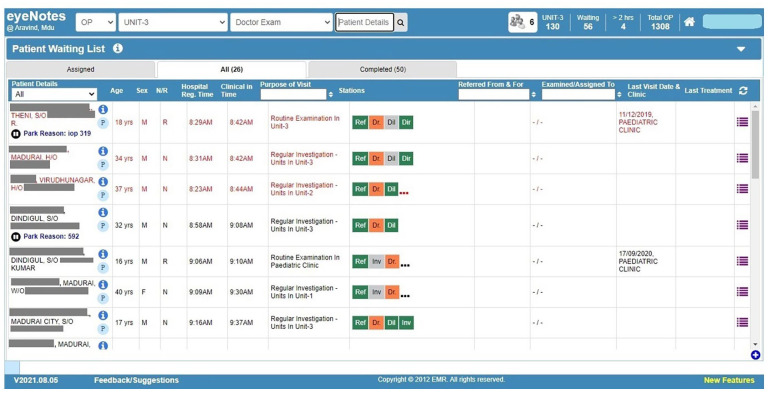
Several practices are followed in real time to manage cycle times. These include segregating patients based on their condition, prioritizing and allocating patients to the right resources, assigning and keeping the next patient ready close to the examination cubicle to avoid time spent in transporting patients and so forth. Further, dashboards (Figure 4) and real-time information are used to assign patients to the next station based on their expected wait time and alerts are generated to indicate excessive waiting time (Figure 5). The coordinator of respective outpatient clinic plan the resources required on the previous day as well as coordinate real-time to ensure adequate resources are available to handle the current patients load. Ophthalmologists or technicians who examine the patient in the current station will choose and assign to the next station in the EMR using the details of pending stations with approximate waiting time expected for each stations. Assigning to specific resource is done by the coordinator (allied ophthalmic personnel or mid-level ophthalmic personnel, who were recruited after completion of higher secondary [12 years of] schooling and trained at AEH for 2 years) of the respective station based on the patient’s condition and their judgement. Patient care managers, who had management education background and underwent fellowship programme in eye hospital management at AEH, support these coordinators and oversee overall patient flow.
Figure 4.
Dashboard for patient care staff to monitor patients waiting time.
Figure 5.
Patients waiting at the assigned examination station: Patients highlighted in red exceeded the standard cycle time.
Introduction of separate refraction clinic
One-third of patients registered for general outpatient services are in the age group 15-40 years, and primarily come for refraction services. A separate refraction clinic was set up to avoid including them with others who undergo more investigation before the final examination.
Proposed optimization technique to manage COVID19 norms
Scheduling for registration
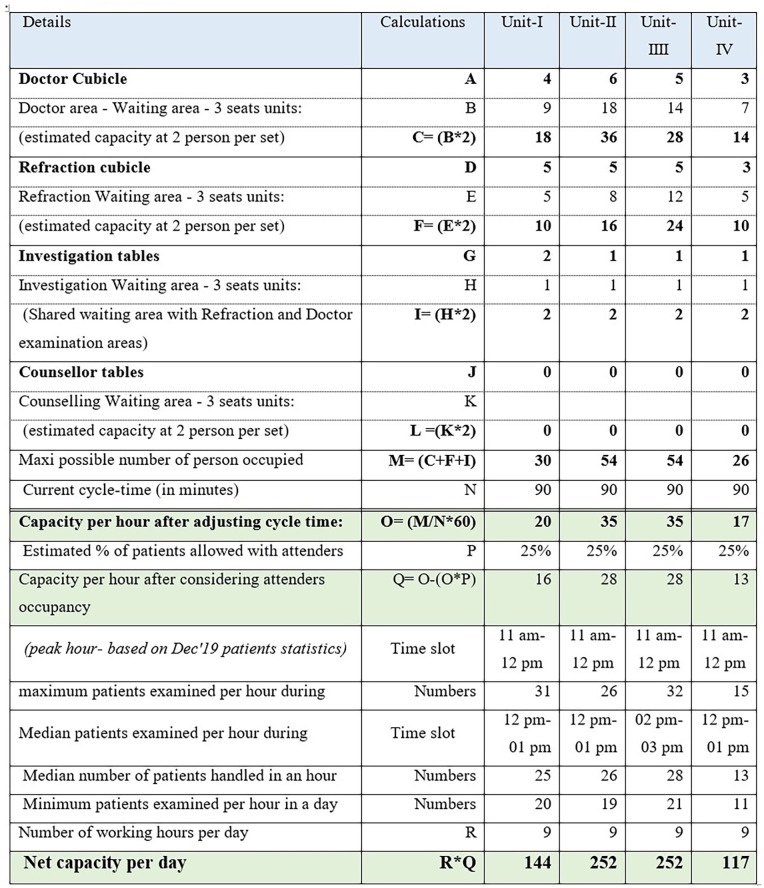
Although AEH normally does not operate with an appointment system, to comply with COVID-19 social distancing norms and government health agendas, AEH implemented scheduling with the aim of dispersing patient arrivals during the day. Based on an audit of the available physical capacity in terms of cubicles, chairs, equipment, service time at each station and past productivity, AEH determined the potential number of patients who could be seen during each time slot (Figure 6) by applying restrictions to ensure social distancing and other norms. Based on our findings, the capacity to handle patients for a day following new norms was approximately the same or slightly higher than the maximum number of patients handled in a day previously. We sent a text message to all patients who were due for follow-up visits with instructions to call a particular number and schedule the visit according to the availability of the slot. Video-conference link was shared to patients who could not travel due to travel restrictions. To receive phone calls and schedule visits, a team was assigned. Patients were allowed only after hand wash and temperature screening. Those who arrived without scheduling were asked to book their timeslot at the scheduling counter and wait until their scheduled time for registration. During the pandemic, all patients had their general health assessed and their information was recorded on forms that were scanned and uploaded.
Figure 6.
Illustrative worksheet for capacity estimation based on new norms after COVID-19.
After COVID19, AEH continued to follow standard protocol with the incorporation of a scheduling system, restriction of attendants, self-declaration for COVID19 exposure, general health screening and cleaning of equipment after each examination.
Sample and Study Design
In this study we included all 59,205 encounters of patients examined at general outpatient clinics from August to November 2020, all 77,098 encounters during August to November 2019 and all 89,421 encounters during August to November 2014. We obtained information on the duration of registration, final examination and counselling, as well as the details of technicians and doctors. In addition, data were obtained on expected and actual number of outpatients during 2019. Data were also gathered on outpatient arrival patterns for the study period (Aug-Nov 2019 and Aug-Nov 2020), and for 2014 as a baseline period that was also used by Munavalli et al. 11-14
Data Collection
Data were extracted from the EMR (eyeNotes) database, running on Microsoft SQL 2016 server. The system captures details of patient visits from registration to completion of examination. As the patient moved from station to station, start and completion times, findings by technicians and doctors, prescriptions, advice and details of investigations and treatment procedures were recorded automatically.
Variable definitions
Patient load
To allow comparison with past studies11 -13 all dates were classified into three categories based on the number of patients encounters. Dates with less than 1601 patients encounters were labelled ‘Low’, 1601-2000 patients encounters were labelled ‘Medium’ and >2000 patients encounters were labelled ‘High’.
Cycle time
The total duration between the time a patient registers and the time an examiner selects ‘patient can go home’ in the system after the examination has been completed.
Wait time
The total duration of the time interval between the time of assignment and starting time for each service.
Data Analysis
We computed mean cycle times for each of the three levels of patient load during the study period and compared it with 2014 levels obtained from published studies. Accuracy of patient load predictions and arrival patterns of patients were also analysed. Further, actual utilisation of resources at different times was analysed.
The data from legacy databases was exported into Stata format through Stata Transfer. Testing for normality was performed using the Shapiro-Wilk test. Mean (SD) and frequency (percentage) calculations were performed. All the statistical analyses were done by STATA (14.0, Texas, USA).
Results
There were 59,205 patient encounters during August 1, 2020 to November 30, 2020, 77,098 patient encounters during August 1, 2019 to November 30, 2019 and 89,421 encounters during August 1, 2014 to November 2014.
Cycle-time comparison
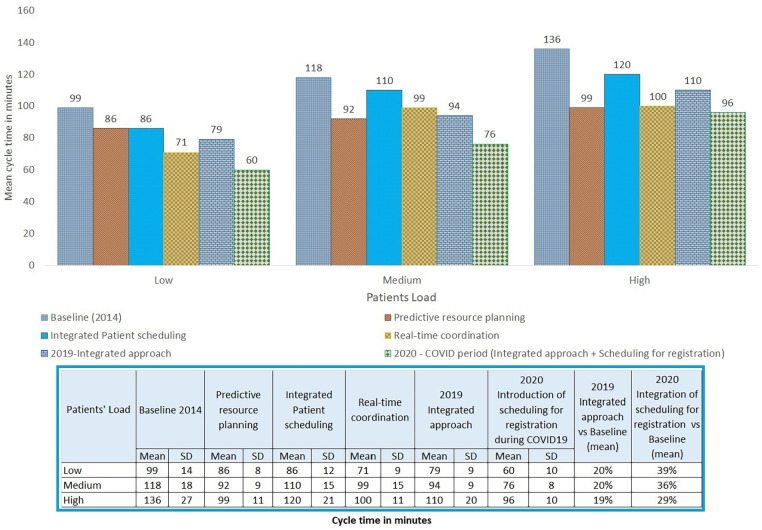
We compared mean cycle time of baseline model with five optimization techniques that are in use at AEH: predictive resource planning,11 integrated patient scheduling,14 real-time coordination,12 integrated approach (includes predictive resource planning + integrated patient scheduling + real time coordination) and integrated approach combined with scheduling for registration.
Figure 7 compares the cycle times in 2014 reported in past studies with the cycle times in 2019 and 2020 obtained during the current study. Treating 2014 as a baseline, mean cycle times were significantly reduced in 2019 by 20% (from 99 to 79 min), 20% (from 118 to 94 min) and 19% (from 136 to 110 min) for low, medium and high patient load days, and in 2020 by 39% (from 99 to 60 min), 36% (from 118 to 76 min) and 29% (from 136 to 96 min) respectively. The mean cycle time was less in 2020 compared to baseline and all studied approaches and the reductions were statistically significant (P < .05). Similarly, the mean cycle time in 2019 was less compared to baseline and two of the three studied approaches. The differences was statistically significant (P < .05).
Figure 7.
Comparison of mean cycle times for different patient load days. 2019-Integrated approach and 2020-COVID period are based on current study. All others are based on published studies.
Accuracy of date-level projection of outpatient load
Table 1 shows the accuracy of outpatient load projection. The variations over the predicted patients load were within 20% on 93% of the days and within 10% on 65% of the days. AEH considers a 10% variation on prediction to be manageable, and there were more than 10% variations on 8% of the days.
Table 1.
Accuracy of outpatient load projections compared to actual number of patients registered for the year 2019.
| (Actual–projected)/projected % | No. of days | % of days |
|---|---|---|
| 50%-55% | 1 | 0.3 |
| 61%-65% | 3 | 1.0 |
| 71%-75% | 5 | 1.6 |
| 76%-80% | 9 | 2.9 |
| 81%-85% | 22 | 7.0 |
| 86%-90% | 45 | 14.4 |
| 91%-95% | 60 | 19.2 |
| 96%-100% | 64 | 20.4 |
| 101%-105% | 47 | 15.0 |
| 106%-110% | 31 | 9.9 |
| 111%-115% | 13 | 4.2 |
| 115%-120% | 8 | 2.6 |
| >120% | 5 | 1.6 |
| Grand total | 313 | 100 |
Arrival Pattern of Patients
As shown in Table 2, peak hours were between 9:00 am and 12:00 noon. These account for around 45% of the total number of patients registered in a day. Patient arrival patterns were almost similar in 2020 and 2019, but when compared to 2014, 8% of the patients shifted to after 01:00 pm.
Table 2.
Arrival pattern of patients of outpatients registered during August to November.
| Registration time | 2020 |
2019 |
2014 |
|||
|---|---|---|---|---|---|---|
| % | Cum % | % | Cum % | % | Cum % | |
| 07:00 am-08:00 am | 7 | 7 | 8 | 8 | 13 | 13 |
| 08:00 am-09:00 am | 11 | 18 | 10 | 18 | 12 | 25 |
| 09:00 am-10:00 am | 14 | 32 | 13 | 31 | 16 | 41 |
| 10:00 am-11:00 am | 15 | 47 | 14 | 46 | 17 | 58 |
| 11:00 am-12:00 pm | 16 | 63 | 16 | 61 | 14 | 72 |
| 12:00 pm-01:00 pm | 11 | 74 | 11 | 73 | 8 | 81 |
| 01:00 pm-02:00 pm | 7 | 81 | 8 | 81 | 5 | 86 |
| 02:00 pm-03:00 pm | 7 | 88 | 7 | 88 | 6 | 92 |
| 03:00 pm-04:00 pm | 7 | 95 | 7 | 95 | 5 | 97 |
| 04:00 pm-05:00 pm | 4 | 99 | 4 | 99 | 2 | 99 |
| 05:00 pm-06:00 pm | 1 | 100 | 1 | 100 | 1 | 100 |
| Total | 100 | 100 | 100 | |||
Highlighted cells denote the shift of patients’ arrival towards afternoon hours.
We compared the cycle time between 2019 and 2020 based on the arrival pattern of patients and the size of patient load. Table 3 shows that patients registered between 10:00 am and 1:00 pm spent more time on average compared to other patients. In addition, the average cycle time during the medium patient load was 15 min more than for the high patient load, it was 31 min more compared to the average cycle time in low patient load days in 2019. A major difference was found between 11 am and 1 pm for both medium and high patient loads. Compared to 2019, cycle time was 19 min less during low patient load, 18 min less during medium patient load, and 14 min less during high patient load and 36 min less overall.
Table 3.
Average cycle time based on the arrival time for different levels of patient load in 2019 versus 2020.
| Arrival time | 2019 |
2020 |
||||||
|---|---|---|---|---|---|---|---|---|
| Low | Medium | High | Total | Low | Medium | High | Total | |
| 07:00 am-08:00 am | 01:33 | 01:38 | 01:42 | 01:41 | 01:00 | 01:04 | 01:15 | 01:02 |
| 08:00 am-09:00 am | 01:17 | 01:30 | 01:37 | 01:34 | 00:58 | 01:04 | 01:15 | 01:01 |
| 09:00 am-10:00 am | 01:17 | 01:33 | 01:47 | 01:42 | 01:01 | 01:17 | 01:29 | 01:09 |
| 10:00 am-11:00 am | 01:26 | 01:38 | 01:57 | 01:51 | 01:05 | 01:23 | 01:45 | 01:14 |
| 11:00 am-12:00 pm | 01:19 | 01:47 | 02:14 | 02:05 | 01:07 | 01:35 | 02:05 | 01:21 |
| 12:00 pm-01:00 pm | 01:31 | 01:48 | 02:16 | 02:07 | 01:06 | 01:33 | 02:18 | 01:20 |
| 01:00 pm-02:00 pm | 01:18 | 01:30 | 01:49 | 01:43 | 01:00 | 01:18 | 01:43 | 01:09 |
| 02:00 pm-03:00 pm | 00:59 | 01:13 | 01:24 | 01:20 | 00:51 | 01:02 | 01:10 | 00:56 |
| 03:00 pm-04:00 pm | 00:58 | 01:05 | 01:12 | 01:09 | 00:46 | 00:51 | 00:55 | 00:48 |
| After 04:00 pm | 00:38 | 00:46 | 00:50 | 00:48 | 00:35 | 00:38 | 00:39 | 00:36 |
| Grand total | 01:19 | 01:34 | 01:50 | 01:44 | 01:00 | 01:16 | 01:36 | 01:08 |
Highlighted cells denote the patients spent more than 10 min on average cycle time for the respective cohort.
Human Resource Utilization
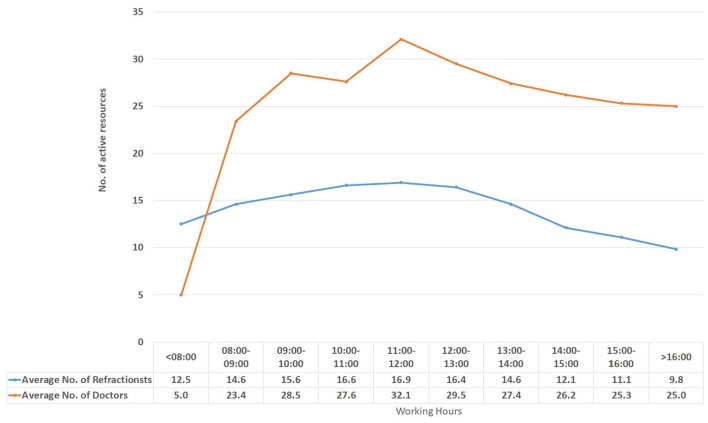
Figure 8 shows the number of doctors and refractionists that examined patients during the day in general outpatient clinics. It can be observed that more resources were engaged during the peak hours from 09:00 am to 12:00 noon.
Figure 8.
Average number of active resources that handled patient loads during a day.
Discussion
Our analysis found that implementing an integrated closed-loop based approach for optimizing outpatient clinic (OPC) operations resulted in a sustained improvement in cycle times and further improvements after introducing scheduling system.
A hospital that does not use an appointment system should practice predicting the OPC patient loads based on its historical experience, which can help with resource planning. Regular review and adjustment of the prediction approach would further improve its accuracy. Our analysis of prediction accuracy of patient loads (Table 1) reveals that at AEH the patient load exceeded prediction by more than 10% on only 8% of the working days.
When the system is not streamlined, uneven arrival patterns of outpatients at registration can cause disruption. Arrival patterns often depend on patients’ preferences, as well as the availability and cost of public transportation to the hospital at specific times. In addition, compared to secondary centre, a tertiary centre get more patients from long distance who generally prefer to arrive in morning hours so that they could return to home by evening. These patterns can be observed in historical data. Our data indicate that most AEH patients arrive in the morning, which is common to many hospitals. Comparison of arrival patterns (Table 2) shows a shift in patients arriving in the late afternoon from 19% in 2014 to 27% in 2020; this is in part a result of a continuous effort by AEH. According to our analysis of average cycle time relative to arrival times of patients (Table 3), patients arriving during peak hours spent considerably more time than those who arrived during nonpeak hours. Arrival patterns can be improved by introducing a scheduling system and encouraging patients from the local area and post-operative patients to avoid peak workdays and hours. During COVID, patients learned the importance of scheduling to ensure timely care and avoid a crowded environment. Scheduling did not significantly affect arrival patterns, indicating that peak-hours slots were optimally utilized but it is expected to become more streamlined as demand increases. With the implementation of a scheduling system, the capacity determined per day in compliance with COVID19 was found to be equivalent to or slightly higher than traditional patient volumes. Thus, introducing a scheduling system streamlines patient flow while managing volume at the same time. COVID19 travel restrictions reduced patient volume to about 70% of normal during the study period.
An additional source of patient load at a clinic is cross-referral of patients for an additional opinion or further treatment. At AEH this is a common practice: one-third of patients are cross-referred to more than one clinic. As a result, procedures have been put in place to manage cross-referrals efficiently. For instance, details including the time required to undergo an examination in the next clinic are determined, since the patient will be added to the queue of the next clinic. Patients are offered the option of scheduling an examination on another day unless it is an urgent situation. Cross-referral of patients after 4 pm is generally discouraged.
Inadequacy in staffing can have adverse impact on the patient flow17 and there the right mix of human resources can minimize waiting times and ensure a smooth flow of patients. Human resource planning becomes more efficient when patient load and arrival patterns are accurately predicted. It is important to plan for additional resources during peak hours and when there is uncertainty about the patient load. Equally, it is imperative to develop a plan for utilizing the resources that are not required by outpatient clinics. Adding additional resources to the operation during peak hours would help improve the process.18 This was confirmed in our study. Our analysis of HR utilization (Figure 8) shows that active resource utilization varies throughout the day, and all scheduled resources are actively engaged during peak hours.
Real time coordination of patient flow reduces unnecessary examinations and repetitions. This requires access to patient records, patient condition and treatment advised on previous visit and so on to route the patient. Apart from real-time information, coordinators need to play a crucial role in this regard. It is possible to replace the manual coordination with a system-based allocation using artificial intelligence.19
Reducing waiting times is the most effective way to improve cycle time and patient satisfaction. A study on waiting times found that patients spend around 89.4% of their time waiting for services.20 In another study, reducing the proportion of waiting time on cycle time from 73% to 43% reduced the cycle time from 189 to 85 min.3 A management case study based on an eye hospital reported 119 minutes as average cycle time.21 The results (Figure 7) of integrated approach showed that the average cycle time was 79, 94 and 110 min for low, medium and high patient load days, respectively in 2019. Introduction of scheduling system to integrated approach brought down the cycle time by 39% (from 96 to 60 min), 36% (from 118 to 76 min) 29% (from 136 to 96 min) respectively during low, medium and high patient load days when compared with baseline data. It is likely that review patients will experience shorter cycle times since some of the steps may be either not necessary or faster with previous visits’ reports. Our analysis (not included in results) of cycle times between review patients and new patients reveals that review patients spend 6-8 min shorter on average than new patients.
Hospitals should keep the pace of patients exit equal or greater than the number of patients arriving at a clinic at a given time interval for achieving a meaningful cycle time, which can be one and a half to two times the overall service time. However, it is more important to work towards improvements following possible strategies, even if it is a small improvement like a 10 minute reduction in cycle time, would enhance efficiency, create more space for more patients, and improve patient satisfaction.
AEH has developed a systematic and evidence-based framework that is suited to hospitals that do not follow an appointment system and face a highly variable and unpredictable patient load. Having access to precise and timely data empowered the concerned staff and enabled predicting, planning, making collaborative decisions on-the-spot, and supporting ongoing decisions. Practicing these approaches without real-time information was challenging but as electronic medical records became more prevalent, data was captured and kept up to date at all times and real-time monitoring became possible. Real-time information was made available for coordinators as well as care providers and patient care managers who are supposed to act based on the current status. A standard training to use the EMR for capturing clinical notes, assigning patients to next station, using the information given in the dashboard for managing the patient flow were given to all staff who were already doing these works manually. A literature review22 of articles on the benefits of EMR found that wait times are reduced in many settings. EMR enabled real-time management of patient flow and resource allocation at AEH, which led to reduced cycle times.
This study contributes to the closed-loop theory that using multiple approaches make the system more efficient than they are practiced individually. Scheduling enabled more realistic prediction of resources required based on the feedback on number of patients scheduled in different timeslots from the system and allot the resources accordingly.
A strength of this study is that it compared the cycle time after full implementation of various models with that achieved by independent approaches. The research also demonstrated that the system could operate in a complex environment such as the COVID-19 pandemic. Possible potential confounding factors that could have influenced cycle times are changes in patient profile, experience levels of doctors and technicians, and changes in medical technologies. However, the influence of these factors is expected to be small as the study was conducted in general outpatient eye clinics with only small changes in patient profile, resources posted and technologies used during the 2014-2020 period. While cycle time management is important, it should not be at the expense of quality time spent with the care provider. Although measuring patient satisfaction was left out of the study, AEH conducted a regular patient satisfaction survey which has shown no change in satisfaction levels. This study has demonstrated how following an integrated approach could improve cycle time, but it was based on a tertiary eye hospital's experience, which should be taken into account while applied in other settings. The proportion of patient load shifted to more towards medium and high patient load category in 2019 and 2020. Further investigation might be worthwhile as the difference of cycle time in patient load between high and low patient days is substantial.
Conclusion
Longer cycle times in hospitals are a major concern for outpatients. Using different models in combination leads to reduced cycle times. The COVID-19 pandemic forced the health industry to devise new approaches to deliver care more efficiently. New norms emphasized practicing of closed loop more intensively to ensure timely service of patients, and to accommodate the next batch of patients promptly. The integrated approach, coupled with scheduling, contributed to sustaining efficiency. Maintaining current methods will help ensure that the system will remain effective after the pandemic.
Supplemental Material
Supplemental material, sj-jpg-1-his-10.1177_11786329221145858 for Managing Outpatient Cycle Times in Hospitals Using Integrated Closed-Loop Approaches by Ganesh-Babu B Subburaman, Jyoti R Munavalli, Thulasiraj Ravilla, Helen Mertens, Carroll Webers, Shyam Vasudeva Rao and Frits van Merode in Health Services Insights
Annexure
Annual calendar of expected outpatients load: shows the anticipated number of patients, special events and colour coding by load category.
Footnotes
Funding: The author(s) received no financial support for the research, authorship, and/or publication of this article.
The author(s) declared no potential conflicts of interest with respect to the research, authorship, and/or publication of this article.
Author Contributions: GBS,JRM,TR and FVM conceived and designed the study. GBS data acquisition and performed the study. GBS,JRM and FVM analysed and interpreted the data. GBS wrote the manuscript. GBS,JRM,TR,HM,CW,SVR and FVM reviewed the manuscript. All authors read and approved the manuscript.
Ethical Considerations: The study was performed with adherence to the tenets of the Declaration of Helsinki. Ethical clearance was obtained from the institutional ethics committee at Aravind Eye Hospital, Madurai.
ORCID iDs: Jyoti R Munavalli  https://orcid.org/0000-0002-0811-1499
Frits van Merode  https://orcid.org/0000-0003-1918-3487
Supplemental Material: Supplemental material for this article is available online.
References
- 1. Robinson J, Porter M, Montalvo Y, Peden CJ. Losing the wait: improving patient cycle time in primary care. BMJ open Qual. 2020;9:e000910. [DOI] [PMC free article] [PubMed] [Google Scholar]
- 2. Hanning M. Maximum waiting-time guarantee – a remedy to long waiting lists?: Assessment of the swedish waiting-time guarantee policy 1992-1996. Acta Univ Ups. 2005;41:106. [Google Scholar]
- 3. Dhar S, Michel R, Kanna B. Improving visit cycle time using patient flow analysis in a high-volume inner-city hospital-based ambulatory clinic serving minority New Yorkers. J Healthc Qual. 2011;33:23-28. [DOI] [PubMed] [Google Scholar]
- 4. Pandit A. Impact of OPD Waiting Time on Patient Satisfaction. Int Educ Res J. 2018; 2:86-90. [Google Scholar]
- 5. Mahajan A, Islam SD, Schwartz MJ, Cannesson M. A hospital is not just a factory, but a complex adaptive system – implications for perioperative care. Anesth Analg. 2017;125:333-341. [DOI] [PubMed] [Google Scholar]
- 6. Viberg N, Forsberg BC, Borowitz M, Molin R. International comparisons of waiting times in health care—limitations and prospects. Health Policy 2013;112:53-61. [DOI] [PubMed] [Google Scholar]
- 7. Hong TS, Shang PP, Arumugam M, Yusuff RM. Use of simulation to solve outpatient clinic problems: a review of the literature. South African J Ind Eng. 2013;24:1-2. [Google Scholar]
- 8. Jamjoom A, Abdullah M, Abulkhair M, Alghamdi T, Mogbil A. Improving outpatient waiting time using simulation approach. 2014 European Modelling Symposium, Pisa, Italy, October 21-23, 2014. IEEE; 2014:117-125. [Google Scholar]
- 9. Pan C, Zhang D, Kon AWM, Wai CSL, Ang WB. Patient flow improvement for an ophthalmic specialist outpatient clinic with aid of discrete event simulation and design of experiment. Health Care Manag Sci. 2015;18:137-155. [DOI] [PubMed] [Google Scholar]
- 10. Cheung YY, Goodman EM, Osunkoya TO. No more waits and delays: streamlining workflow to decrease patient time of stay for image-guided musculoskeletal procedures. Radiographics. 2016;36:856-871. [DOI] [PubMed] [Google Scholar]
- 11. Munavalli JR, Rao SV, Srinivasan A, Manjunath U, van Merode GG. A Robust predictive resource planning under demand uncertainty to improve waiting times in outpatient clinics. J Health Manag. 2017;19:563-583. [DOI] [PMC free article] [PubMed] [Google Scholar]
- 12. Munavalli JR, Rao SV, Srinivasan A, van Merode GG. An intelligent real-time scheduler for out-patient clinics: a multi-agent system model. Health Informatics J. 2020;26:2383-2406. [DOI] [PubMed] [Google Scholar]
- 13. Munavalli JR. Real-time scheduling in outpatient clinics. Doctoral thesis. Maastricht University. [Google Scholar]
- 14. Munavalli JR, Rao SV, Srinivasan A, van Merode GG. Integral patient scheduling in outpatient clinics under demand uncertainty to minimize patient waiting times. Health Informatics J. 2020;26:435-448. [DOI] [PubMed] [Google Scholar]
- 15. Sun J, Lin Q, Zhao P, et al. Reducing waiting time and raising outpatient satisfaction in a Chinese public tertiary general hospital-an interrupted time series study. BMC Public Health. 2017;17:668. [DOI] [PMC free article] [PubMed] [Google Scholar]
- 16. White DL, Froehle CM, Klassen KJ. The effect of integrated scheduling and capacity policies on clinical efficiency. Prod Oper Manag. 2011;20:442-55. [Google Scholar]
- 17. Sriram S, Noochpoung R. Determinants of hospital waiting time for outpatient care in India: how demographic characteristics, hospital ownership, and ambulance arrival affect waiting tim. Int J Community Med Public Heal. 2018;5:2692. [Google Scholar]
- 18. Reese HD, Anandhan V, Perez E, Novoa C. Improving patient waiting time at a pure walk-in clinic. 2017 Winter Simulation Conference (WSC), Las Vegas, NV, USA, 3–6 December, 2017. IEEE; 2017. [Google Scholar]
- 19. Li X, Tian D, Li W, et al. Artificial intelligence-assisted reduction in patients’ waiting time for outpatient process: a retrospective cohort study. BMC Health Serv Res. 2021;21):1-11. [DOI] [PMC free article] [PubMed] [Google Scholar]
- 20. Xie Z, Or C. Associations between waiting times, service times, and patient satisfaction in an endocrinology outpatient department: a time study and questionnaire survey. Inquiry. 2017;54: 1-10. [DOI] [PMC free article] [PubMed] [Google Scholar]
- 21. Lowalekarand H, Ravichandra N. Managing the outpatient department waiting time at Rajas Eye Hospital. Int Med J. 2012;4:36-46. [Google Scholar]
- 22. Jawhari B, Ludwick D, Keenan L, Zakus D, Hayward R. Benefits and challenges of EMR implementations in low resource settings: a state-of-the-art review. BMC Med Inform Decis Mak. 2016;16:1-12. [DOI] [PMC free article] [PubMed] [Google Scholar]
Associated Data
This section collects any data citations, data availability statements, or supplementary materials included in this article.
Supplementary Materials
Supplemental material, sj-jpg-1-his-10.1177_11786329221145858 for Managing Outpatient Cycle Times in Hospitals Using Integrated Closed-Loop Approaches by Ganesh-Babu B Subburaman, Jyoti R Munavalli, Thulasiraj Ravilla, Helen Mertens, Carroll Webers, Shyam Vasudeva Rao and Frits van Merode in Health Services Insights


