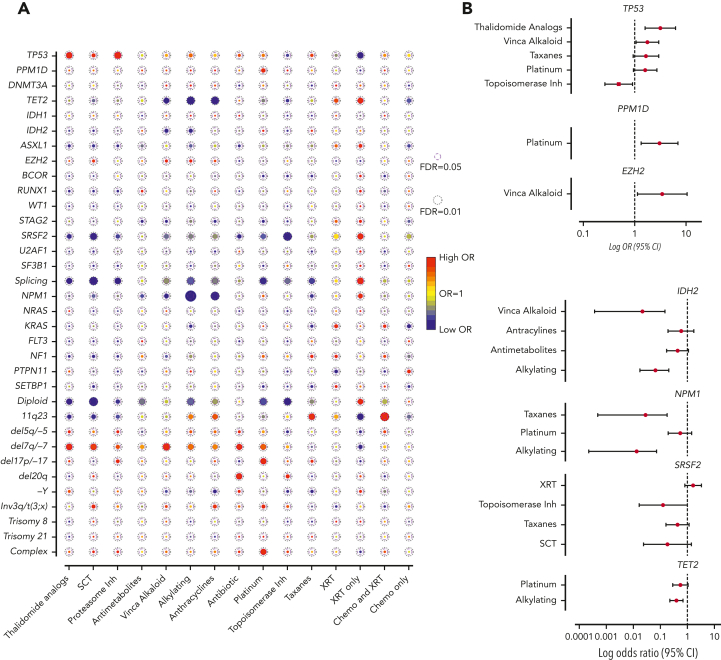
Figure 2.
Association between cancer gene mutations and prior exposures. (A) The bubble plot showing univariate correlation between gene mutations and major chromosome abnormalities with prior exposures. Some of the genes are also grouped by their functional pathways. Splicing gene includes (SF3B1, SRSF2, U2AF1, and ZRSR2). The size of the bubbles represents the degree of statistical significance measured by FDR. The color of the bubble represents the degree of correlation based on the log OR; red color indicates positive correlation and green color indicates negative correlation. (B) Log OR (and 95% CI) with gene mutations and prior exposures after adjusting for confounding effect from multiple exposures with multilogistic regression analysis. Results of positive associations are shown in the top panel and negative associations are shown in the bottom panel. For full results, refer to supplemental Table 4. FDR, false discovery rate; SCT, stem cell transplant; XRT, radiotherapy.

