

Abstract
Lonely people tend to evaluate social exchanges negatively and to display difficulties in interactions. Interpersonal synchronization is crucial for achieving positive interactions, promoting affinity, closeness, and satisfaction. However, little is known about lonely individuals’ ability to synchronize and about their brain activity while synchronizing. Following the screening of 303 participants, we recruited 32 low and 32 high loneliness participants. They were scanned while engaged in movement synchronization, using a novel dyadic interaction paradigm. Results showed that high loneliness individuals exhibited a reduced ability to adapt their movement to their partner’s movement. Intriguingly, during movement adaptation periods, high loneliness individuals showed increased activation in the action observation (AO) system, specifically in the inferior frontal gyrus and the inferior parietal lobule. They did not show increased activation in the dorsomedial prefrontal cortex, which in the context of synchronization was suggested to be related to gap-monitoring. Based on these findings, we propose a model according to which lonely people may require stronger activation of their AO system for alignment, to compensate for some deficiency in their synchronization ability. Despite this hyperactivation, they still suffer from reduced synchronization capacity. Consequently, synchronization may be a relevant intervention area for the amelioration of loneliness.
Keywords: inferior frontal gyrus, inferior parietal lobule, interpersonal synchronization, mirror neuron system, social interaction
Introduction
Loneliness is a subjective experience of social isolation (Weiss 1973), perceiving one’s relations as lacking (Perlman and Peplau 1981). Loneliness is highly prevalent (Wilson and Moulton 2010; Victor and Yang 2012; Beutel et al. 2017; Barreto et al. 2021) and has gained public and academic attention as it was shown to harm mental and physical health (Cacioppo et al. 2010; Holwerda et al. 2014; Valtorta et al. 2016; Lim et al. 2020).
Lonely people demonstrate deficits that make engaging in meaningful relationships harder. They experience more negative feelings during interactions (Hawkley et al. 2003) and report lower relationship satisfaction, more conflict, and less self-disclosure and closeness (Mund et al. 2022). Lonely people also maintain larger interpersonal distance (Lieberz et al. 2021), even from friends (Saporta et al. 2021). A potential component of the failure to fully engage in interactions may be related to difficulties in synchronization. Interpersonal motor synchrony is defined as the alignment in time of the movements of interacting individuals (Chartrand and Lakin 2013). Synchronization widely occurs naturally, and people coordinate their movement despite not being instructed to (Richardson et al. 2005, 2007). It has been suggested that synchronization evolved to provide important adaptive values (Duranton and Gaunet 2016; Launay et al. 2016), including achieving emotional alignment (Hatfield et al. 1994) and developing social bonds (Feldman 2007; Atzil et al. 2011, 2014; Atzil and Gendron 2017). Indeed, it was found to promote increased liking and affiliation (Hove and Risen 2009; Rabinowitch and Knafo-Noam 2015), rapport (Vacharkulksemsuk and Fredrickson 2012), trust (Launay et al. 2013), empathy (Koehne et al. 2016), connection (Marsh et al. 2009), compassion (Valdesolo and DeSteno 2011), excitement (Noy et al. 2015), and prosocial behavior, even among infants (Cirelli et al. 2014; for a recent review, see Hoehl et al. 2021). It was suggested that perceived social bonding is associated with better synchronization capabilities (Cacioppo and Cacioppo 2012) and lonely people showed impaired spontaneous smile mimicry (Arnold and Winkielman 2021). However, despite its significance to achieving significant social interaction, little is known about the ability of lonely people to synchronize with interacting partners.
Synchronization involves several neural networks, most famous of which is the mirror neuron system (MNS), which includes neurons in the action observation (AO) network, activated both by execution of goal-directed actions and by observation of such actions by another (Rizzolatti et al. 2001; Rizzolatti and Craighero 2004). Two main areas in the AO system are the inferior frontal gyrus (IFG) and the inferior parietal lobule (IPL) (Iacoboni et al. 2001; Lestou et al. 2008; Pilgramm et al. 2009), and both have been found to be involved in synchronization (Cacioppo, Cacioppo, et al., 2014a; Cacioppo, Zhou, et al., 2014b; Fairhurst et al. 2013; Jasmin et al. 2016; Jiang et al. 2012; Osaka et al. 2015). Notably, a recent brain model suggested that the AO system is one of three core components of social alignment, which mediate all types of synchrony, from movement to emotional and cognitive alignment (Shamay-Tsoory et al. 2019). In addition to the AO system, this model suggested the existence of a gap-monitoring system, which detects the gap between self and others, comprising the dorsomedial prefrontal cortex (dmPFC), the dorsal anterior cingulate cortex (dACC), and the anterior insula (AI). The model also suggested the existence of a reward system, which signals if the gap is optimal, comprising the orbitofrontal cortex (OFC), the ventromedial PFC (vmPFC), and ventral striatum (VS) (Shamay-Tsoory et al. 2019).
Intriguingly, some overlap exists between the alignment networks and the brain areas involved in loneliness. Among high loneliness individuals, there is a decrease in white matter density in the IFG (Tian et al. 2014) and the bilateral IPL (Nakagawa et al. 2015). Lesions to the right IFG were associated with decreased loneliness scores, suggesting that the activity of this area in intact brains is related to increased loneliness (Cristofori et al. 2019). Moreover, there is also evidence for the involvement of brain regions that are part of the proposed gap-monitoring and reward systems in loneliness. White matter density is lower among high loneliness individuals in the AI and the dmPFC (Tian et al. 2014; Nakagawa et al. 2015), and high loneliness was associated with lesions to the right AI (Cristofori et al. 2019). Lonely individuals showed reduced self–other representational similarity in the medial PFC (Courtney and Meyer 2020). They also exhibited blunted functional connectivity between the AI and occipitoparietal regions during trust decisions (Lieberz et al. 2021). Low loneliness individuals had altered functionality of the VS when viewing pleasant social pictures (Cacioppo et al. 2009) and pictures of close others (Inagaki et al. 2015). (See Lam et al. 2021 for a recent review of structural and functional studies of loneliness.)
Based on these findings, the current study examined whether high loneliness individuals show impaired interpersonal synchronization during social interactions. The study used an interactive computerized paradigm, which enables neuroimaging acquisition from participants, as they engage in a joint activity that becomes increasingly synchronized (Marton-Alper et al. 2020). During the study, individuals were scanned using functional magnetic resonance imaging (fMRI) while interacting nonverbally by controlling the movement of differently colored circles. The task included three conditions. A random control condition (random), in which the scanned participant controlled the movement of one circle and a computer controlled the second circle; a free movement condition (free) in which both participants saw the circles moved by themselves and by the other participant and were instructed to move freely; and a synchronized movement condition (sync) in which they were asked to coordinate their movement with the other participant. The random condition was designed to make it impossible to synchronize, as the movement of the computer-controlled circle was fully randomized and therefore completely unpredictable. In the free condition, spontaneous synchronization could occur. The sync condition was expected to yield the highest level of synchronization. In this study, we used two measures of synchrony. We assessed the zero-lag correlation score, which is a dyad measurement of the synchronization achieved, previously used with this paradigm (Marton-Alper et al. 2020). In addition, we focused on a measure of following periods. This is a newly developed individual measurement of the relative contribution of each of the dyad members to the achieved synchronization. While the zero-lag correlation score is a valuable measurement for the level of synchronization a dyad achieves, it does not allow a differentiation of the relative contribution of each of the participants to this synchronization. Both members of the dyad will obtain the same zero-lag correlation score, even though one may have contributed far more to the synchronization, by adjusting his or her movement more. In contrast, durations of following periods are calculated separately for each participant and provide a better measure of the effort each participant was putting into synchronizing with his/her partner. Obtaining such an individual measure is important since we aimed to examine individual brain activation. For this reason, we created the following periods measurement. Based on the various social impairments experienced by lonely people, it was hypothesized that, as compared to low loneliness participants, high loneliness participants would show diminished ability to synchronize as reflected by a lower zero-lag correlation score. Importantly, we hypothesized they would show diminished following periods, indicating that they contribute less to the achieved synchronization. This was hypothesized to occur in both the free and the sync conditions.
We also measured the level of enjoyment experienced by the participants throughout the task. We hypothesized that the enjoyment level would be highest in the sync condition, followed by the free condition and lastly by the random condition. Based on previous findings that lonely individuals enjoy social interactions less (Hawkley et al. 2003; Mund et al. 2022), we hypothesized that high loneliness individuals would report lower enjoyment scores in the free and sync conditions when compared to low loneliness individuals.
From a neural perspective, the study first aimed to seek support for the interpersonal synchronization neural model. As such, it was hypothesized that during synchronized movement we would see the involvement of the AO system, focusing primarily on the IFG and IPL, as well as the gap-monitoring system (dmPFC, dACC, and AI) and the reward system (VS, vmPFC, and OFC). These regions were expected to be involved in both spontaneous (free movement) and intentional synchronization. Second, as there is some evidence that these areas may be structurally or functionally different among lonely individuals, we hypothesized that differences between high loneliness and low loneliness individuals would also be found in these regions of interest during synchronization.
Materials and methods
Participants
About 303 participants were recruited using social media advertisements. Respondents were screened for the following criteria: (i) fluency in Hebrew; (ii) right-hand dominance; (iii) no medication use (except for oral contraceptives); (iv) no history of neurological disorders or psychiatric problems; (v) no conditions that prevented scanning (e.g. a pacemaker, claustrophobia); and (vi) normal or corrected-to-normal vision, including no color blindness. In addition, all participants filled the UCLA loneliness questionnaire (Russell 1996); see details below. The mean UCLA score in the large sample was 40.809 (SD = 10.071), median score = 39, and mode = 36. This median score was in accordance with previous findings on similar populations (Russell 1996). To determine the desired sample size, we used G*Power (Faul et al. 2007). Based on a previously reported effect of loneliness on the neural processing of social stimuli, 0.46 (Cacioppo et al. 2009), with α = 0.05 and power = 0.95, the minimal sample size for a between-subject design was 52 participants. We decided to use a larger sample, in order to allow for potential dropouts or participants that would have to be excluded due to head movements, abnormal neurological findings, or technical issues. We screened 303 participants and 68 healthy participants met the selection criteria. Since the study aimed to compare low and high loneliness individuals, half of the group that was recruited had a loneliness score that was higher than the mean score in the larger sample (≥41) and the other half had a loneliness score that was lower than the mean score in the larger sample (<41). Participants were assigned to same-gender dyads. Since the focus of the analysis was not on the dyad level, we did not specifically recruit dyads according to their loneliness level. Therefore, some dyads had two low loneliness participants (6 dyads), some dyads had two high loneliness participants (6 dyads), and the majority had one low and one high loneliness participant (22 dyads). During data analysis, one participant was excluded due to a neurological finding in the anatomical scan. Another participant was excluded since there was an unexplained scan artifact. Two participants were excluded due to excessive head movement during scanning (>2.5 mm/°). Out of the excluded participants, three were female (two reported high loneliness and one reported low loneliness) and one was male (reported low loneliness). Dyad partners of the excluded participants were not excluded from analysis, as exclusion reasons were related to the fMRI scanning and not to the excluded participants’ behavior. Therefore, the analyzed sample included 64 participants (45 females, age 18–35, mean age = 25.41, SD = 4.20). The study was approved by the ethics committee of Tel Aviv University and the institutional review board at the Sheba Tel Hashomer medical center and was conducted in accordance with the latest revision of the Declaration of Helsinki. Participants provided written informed consent to participate in the study.
Experimental procedure
Each dyad was invited to the center at the same time. It was confirmed that there was no prior acquaintance between them. After joint debriefing, one participant entered the scanner, and the other participant went into a room adjacent to the fMRI scanner control room. Both participants completed the synchronization task (see below), after which the participant in the scanner remained for an anatomical scan. Subsequently, participants switched places and repeated the task. Monetary compensation was provided for participation, in the amount of 150 NIS, the equivalent of about £35 or $48.
Measures
Synchronization task
To measure real-time synchronization among interacting participants, the study used a computer-based movement synchronization multiagent paradigm (Marton-Alper et al. 2020). This game allows individuals to interact nonverbally by controlling the movement of circle-shaped figures with different colors. The displays are fully synchronized as the computers are connected via a closed network. During the game, each player faces a screen with a rectangle presented on it. The participants are instructed to imagine that the rectangle represents a room. At the beginning of the game, two circles appear on the screens, and each player is assigned one of them (blue, red). Participants are instructed to imagine that the circle represents them, as they are moving in the room. The participant in the scanner uses the response box, while the participant outside the scanner uses a keyboard to control the movement of the circles.
The task includes three conditions. (i) Random condition—each participant controls the movement of the circle that was assigned to them. The other circle’s movement is controlled by the computer and is randomized. The participants are aware that the other circle is controlled by a computer. (ii) Free condition—each participant controls the movement of the circle that was assigned to them, and the other circle is controlled by the other participant. Participants are aware that the other circle is controlled by the other participant and are instructed to move their circle freely. (iii) Sync condition—this condition is similar to the free condition; however, the participants are instructed to synchronize their movement to the best of their ability. The order of the conditions was maintained for all participants as was established in a previous study (Marton-Alper et al. 2020) so that instructed synchrony will not affect the emergence of spontaneous synchrony right after it.
Prior to entering the scanner, participants received an explanation about the task and were shown the response box they would be using. Each condition was scanned in a separate run and contained three blocks. At the beginning of each block, a fixation point appeared on the screen for 12 s, followed by the presentation of an instruction slide (5 s), after which the participants performed the task for 45 s. After this, participants were given 10 s to rate how much they enjoyed the game. Figure 1 presents an illustration of the task design.
Fig. 1.
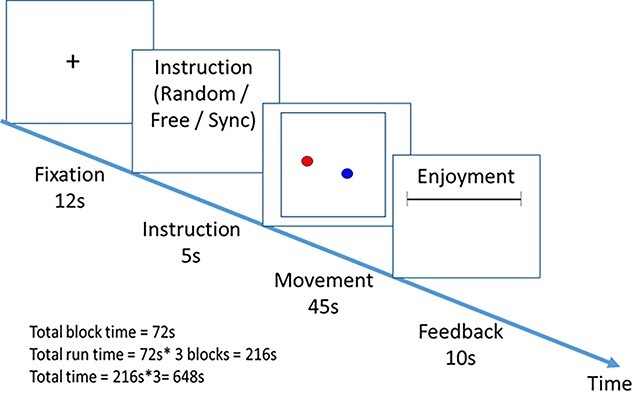
Illustration of the task design.
The movement of the circle assigned to the participant outside the scanner was controlled using the 1–4 keys on a keyboard, and the movement of the circle assigned to the participant inside the scanner was controlled using the 4 keys of the response box. Each key represented a direction (left, up, right, down) and combinations of two keys were allowed (e.g. left + up = diagonal left). Communication between each client and the server was executed asynchronously at about 5 Hz, and postprocessing interpolation of all data was conducted at a rate of 5 Hz, such that data for all participants shared matching sample times. The movement of each circle was determined by the vector sum of movements in the four major directions. These sums were calculated based on durations of key presses during the intervals between consecutive samples (~200 ms). “Down” durations were subtracted from “up” durations, and “left” durations were subtracted from “right” durations. The resulting differences were then multiplied by a constant factor to determine the extent of movement (in pixels) in each axis.
Synchronization measurements
Following periods
As mentioned above, it was especially important to differentiate the individual contribution of the participants to the synchronization because this study aimed to examine individual brain activation. Therefore, we have created a new synchronization measurement termed “following periods.”
To measure the relative contribution of each participant to the achieved synchronization, we examined periods during which a participant actively adapted his or her movement to that of his or her partner. As mentioned above, each participant’s location was recorded at a sampling frequency of 5 Hz, yielding 5*45 = 225 samples per block. From this data, we calculated changes in locations between consecutive samples and used these differences to identify the direction in which each participant had moved during each interval between consecutive samples. There are eight possible movement directions (0°, 45°, 90°, 135°, 180°, 225°, 270°, and 315°). The net change in location between two consecutive samples is a vector sum of the products of directions selected by the participant within that interval, multiplied by their durations. This sum does not necessarily coincide with one of the eight aforementioned directions. Therefore, actual directions were “rounded” to the closest main direction. Periods during which the two dyad members were moving in the same direction were then identified. Within these periods, we projected participants’ locations onto their (common) direction of movement. Relative to the direction of movement, the person who was “behind” was considered to be the one that was following the person who was “in front.” For example, if the direction of movement was right, or 90°, the person whose location was more to the right was considered “in front.” A following period for participant 1 was defined as the period in which participant 1 was the one following participant 2. A total following score was calculated, summing up the following periods per participant and per condition. A higher score would indicate that a participant spent more time actively aligning their movement direction with the movement of the other participant.
Zero-lag correlation
We also analyzed participants’ behavior using a previously created dyad measurement of synchronization, the zero-lag correlation score (Marton-Alper et al. 2020). This measurement is based on a directional correlation (Nagy et al. 2010) between the movements of the two participants. Directional correlation is the cosine of the angle between the velocities of each pair of players. The directional correlation between participant i and participant j is given by  , where <vi,vj> is the inner product of the velocities of the two participants, and |vi| and |vj| are the magnitudes of the velocities of participant i and participant j, respectively. Higher correlation indicates stronger synchronization. The zero-lag correlations were calculated using sliding windows of 21 samples (i.e. ±2 s around a given sample). Figure 2 presents an example of the synchronization score calculated over time for one of the dyads.
Fig. 2.

Example of the zero-lag correlation scores calculated over time for one dyad. The blocks of random condition (left), free condition (middle), and sync condition (right) are presented. The X axis represents the time in seconds, and the Y axis is the zero-lag correlation score.
Zero-lag synchronization periods
Since we aimed to identify neural activity during periods in which synchronization took place, we identified zero-lag synchronization periods—periods in time where the zero-lag correlation score was sufficiently high. These periods were defined by a combination of three parameters: (i) zero-lag correlation score threshold; (ii) minimal synchronization duration—the minimal continuous period in seconds in which the zero-lag correlation score had to be above the threshold. This allowed for the identification of periods where synchronization was taking place, in contrast to points in time in which movement was coordinated by chance; (iii) maximal synchronization intermission—the maximal period in seconds within the minimal synchronization duration, in which the zero-lag correlation score could drop below the threshold. This allowed us to consider periods as synchronization periods even if one of the participants, for example, paused to assess the movement of the other participant. A total zero-lag synchronization periods score was calculated, summing up the zero-lag synchronization periods per participant and per condition.
To identify the optimal parameter combination for zero-lag correlation score threshold, minimal synchronization duration, and maximal synchronization intermission, we first selected the zero-lag correlation threshold, which was determined based on the median zero-lag correlation score in the sync condition, 0.5. We then analyzed all the possible combinations of synchronization duration and maximal intermission that resulted in at least one synchronization period per participant in the free movement and the sync conditions. Finally, we identified which parameter combination results in the best discrimination between the random condition and the free movement/sync condition. In the free movement condition, the best discrimination from the random condition was found with the parameters—synchronization duration = 5 s and maximal intermission = 3 s (marked by the red ellipses in Fig. 3). In the sync condition, the best discrimination from the random condition was found with the parameters—synchronization duration = 8.2 s and maximal intermission = 2.6 s (marked by the blue ellipses in Fig. 3). However, using these parameters resulted in no zero-lag synchronization periods in the free movement condition. There was an additional local maximum for the discrimination using the parameters—synchronization duration = 4.8 s and maximal intermission = 2.2 s (marked by the dotted blue ellipses in Fig. 3)—and we chose to use this value as it was also close to the values identified in the free movement condition.
Fig. 3.

Zero-lag synchronization periods parameter selection. First, the zero-lag correlation score threshold was identified using the median zero-lag correlation score in the sync condition (0.5). Then the zero-lag synchronization periods score was identified for all possible combinations of the three parameters—the zero-lag correlation score (0.5), synchronization durations, and maximal intermission. This was calculated for the sync, free, and random conditions. The goal was to identify a combination of values that best discriminates the sync or free conditions from the random condition. The charts display a “heat map” of the difference in zero-lag synchronization periods score between A) the sync and random condition and B) the free and random condition, for each combination of synchronization durations (in the y axis) and maximal intermission (in the x axis). Larger differences are yellow; smaller differences are blue. The best discrimination between the free and random condition (the largest difference in zero-lag synchronization periods) is marked in the red ellipse. The best discrimination between the sync and random condition (the largest difference in zero-lag synchronization periods) is marked in the blue ellipse. The selected value is based on a local maximum of discrimination in the sync > rand conditions and is marked by a dotted blue ellipse.
Enjoyment ratings
Participants’ enjoyment ratings in each of the blocks were used to calculate an average enjoyment score in each condition for each participant.
Loneliness measurement
To assess levels of loneliness, participants completed the UCLA loneliness scale version 3 (Russell 1996). The UCLA loneliness scale was initially developed in 1978 (Russell et al. 1978) and has since been revised twice to improve its validity and reliability. In the current version, the respondent is asked to rate the frequency of loneliness-related experiences. Some items refer to negative experiences, for example “How often do you feel left out?” and some items refer to positive experiences, for example “How often do you feel part of a group of friends?”. Each item is rated on a scale of 1 (never) to 4 (often), and after reversing the questions that relate to positive experiences, a total loneliness score (20–80) is calculated. The mean score in the UCLA scale in the study was 41.938 (SD = 12.952) and the median score was 38. As explained in the participants section, participants filled out the UCLA scale during screening, and then two groups were recruited, based on their loneliness score. Comparing high and low loneliness groups was done in multiple past studies (e.g. Cacioppo et al. 2015, 2016; Arnold and Winkielman 2021). The mean loneliness scores in the low and high loneliness groups were 30.593 (SD = 4.550) and 53.281 (SD = 7.385), respectively.
Additional measurements
Depression, autism-like tendencies, and empathy were measured to test whether findings were specific to loneliness. To assess levels of depression, participants were administered the Beck Depression Inventory version II (BDI-II) (Beck et al. 1996). The mean score was 10.625 (SD = 8.316). The low loneliness group had a significantly lower depression score (mean = 7.188, SD = 6.098) when compared to the high loneliness group (mean = 14.063, SD = 8.886) [t(62) = 3.609, P = 0.001, Cohen’s d = 0.902]. Participants were split into high and low depression groups based on the median BDI score (median = 9). To assess levels of autism-like tendencies, participants were administered the Autism Quotient (AQ) scale (Baron-Cohen et al. 2001). The mean score was 18.172 (SD = 6.232). The low loneliness group had a significantly lower AQ score (mean = 16.125, SD = 5.514) when compared to the high loneliness group (mean = 20.219, SD = 6.612) [t(62) = 2.762, P = 0.008, Cohen’s d = 0.672]. Participants were split into high and low autism-related traits groups based on the median AQ score (median = 18). To assess levels of empathy, participants were administered the Interpersonal Reactivity Index (Davis 1983). The mean score was 67.438 (SD = 12.173). There was no significant difference in IRI between the low loneliness group (mean = 68.719, SD = 12.376) and the high loneliness group (mean = 66.156, SD = 12.024) [t(62) = 0.840, P = 0.404]. Participants were split into high and low empathy groups based on the median IRI score (median = 68).
Data analysis
Behavioral data analysis
Behavioral data were analyzed by calculating mixed-design analyses of variance (ANOVAs), with either following score (the sum of all following periods per participant per condition), zero-lag correlation score or enjoyment score as the dependent variable, condition (random, free, or sync) as the within-subject repeated measure, and loneliness group (high, low) as the between-subject factor. Additional analyses included t-tests and bivariate Pearson correlations. P-values < 0.05 (two-tailed) were considered significant. Effect sizes were estimated using partial eta squared (ηp2) or Cohen’s d. Cronbach’s Alpha was calculated on the UCLA loneliness scale as a measure of its reliability. All statistical analyses were performed using SPSS 25.0. As each participant performed the synchronization task twice, once outside the scanner and once inside the scanner, scanning order was used as a between-subject control variable to test if it impacted the results.
MRI data acquisition
MRI was conducted using a 3T Siemens Magnetom Prisma Scanner (Siemens Medical Solutions, Erlangen, Germany) at the Strauss Imaging Center on the campus of Tel Aviv University. Images were acquired using a 64-channel head coil. Every session included 3D-anatomical scanning and functional imaging. Anatomical scans were obtained using a T1-weighted 3D MP2RAGE (TR—2.53 s; TE—2.99 ms; flip angle—7°, 176 sagittal slices; spatial resolution—1 × 1 × 1 mm3). During task performance, behavioral judgment was collected via a fiber optic response pad (Current Designs, Inc. PA, USA). Functional MRI was acquired by multiband echo planar imaging (mb-EPI) pulse sequence for simultaneous excitation for multiple slices with the following parameters: TR = 2 s, TE = 30 ms, band factor = 2, Ipat = 2, isotropic spatial resolution of 2 mm3 (no gaps).
MRI data preprocessing and analysis
FMRI data were preprocessed and analyzed using the Statistical Parametric Mapping toolbox for MATLAB (SPM12: Wellcome Trust Center for Neuroimaging, University College London). Preprocessing of functional scans included quality assurance, slice timing correction, realignment and unwarping, coregistration, normalization to a standard T1 template (MNI), and smoothing. Head movement was assessed and corrected. 3D statistical parametric maps were calculated separately for each subject using a general linear model (GLM). First-level contrasts of interest were calculated (see below), and then we used a one-sample t-test analysis on the second level. All GLM analyses were thresholded at a family-wise error (FWE) corrected whole-brain P value < 0.05 after an initial cluster-forming height threshold of P < 0.001. We contrasted each of the conditions in which participants had been interacting with each other (sync or free, separately) with the random condition. Obtained whole-brain analyses were masked with the activation map obtained for the sync/free condition minus its baseline (P < 0.05), to ensure that the resulting differences were due to activation in that condition rather than deactivation in the random condition. To determine whether scanning order had impacted the results, we also performed second-level analyses in which scanning order was included as a between-subject factor, and a two-sample t-test was conducted to compare the two scanning order groups.
Two types of whole-brain analyses were implemented at the individual level. First, to validate the proposed neural model for interpersonal synchronization and to explore the three conditions of the task, regardless of the actual behavior of the subjects in each task condition, we carried out an initial contrast between the task conditions. We contrasted individual brain activity throughout the sync condition with the random condition (total run duration sync > random) as the main contrast of interest on the first level and then used a one-sample t-test analysis on the second level. A similar analysis was done for the free condition (total run duration free > random). The contrasts used the onsets and durations of the task condition, summing up the three movement trials of 45 s each. Second, to explore brain activation during following periods, we contrasted individual brain activity for following periods in the sync condition > following periods in the random condition as the main contrast of interest on the first level. This contrast used the following periods onsets and durations, as identified in the method described in Section Following Periods. However, in the random condition, there were hardly any periods of time that could be considered as “following.” This was expected because by design in the random condition it was not possible to intentionally follow as the movement of the second circle was completely random. Nevertheless, to calculate the main contrast of interest, the onsets and durations of following periods had to be specified also for the random condition. We thus decided to use the same onsets and durations of following periods as identified in the sync condition. This way, we assured similar durations of time periods being analyzed in the sync and in the random condition. For example, if a following period was identified for a specific user between seconds 3 and 7 of the sync condition, the contrast defined second 3 as an onset and 4 s as the duration, in both the random and the sync conditions. A similar analysis was done for the free condition following periods free condition > following periods random condition. Similarly, we analyzed individual brain activity for zero-lag synchronization periods in the sync > random contrast as well as in the free > random contrast.
We also conducted an ROI analysis focused on the difference between high and low loneliness participants. Our hypothesis focused on the brain regions suggested to be involved in synchronization (dmPFC, dACC, AI, IFG, IPL, premotor cortex, OFC, vmPFC, VS). Out of those, we identified the ROIs in which activation was confirmed in the whole-brain analysis of following periods and of zero-lag synchronization periods as described above, as this analysis established their relevance to brain activity during following periods or zero-lag synchronization periods. Anatomical ROIs were then defined using the Automated Anatomical Labeling atlas version 3 (Rolls et al. 2020). Beta values were extracted and then used to test differences between the high and low loneliness groups using independent samples t-tests. False discovery rate (FDR) correction was used for multiple comparisons. P values smaller than 0.05 after correction were considered significant.
Results
Behavioral data
The reliability of the UCLA Loneliness Scale was excellent (Cronbach’s Alpha = 0.957).
To test potential differences between males and females, we ran independent sample t-tests with loneliness scores, following scores in the sync condition, enjoyment scores in the sync condition, or zero-lag correlation scores in the sync condition as the dependent variables, and sex as the between-subject factor. These analyses yielded no significant differences between sexes (P > 0.142). We thus ran the following analyses on both females and males together.
A mixed-design ANOVA with following score as the dependent variable was employed. The analysis yielded significant main effects of condition [F(1.148,71.152) = 149.431, P < 0.001, ηp2 = 0.707] and of loneliness [F(1.148,71.152) = 4.764, P = 0.033, ηp2 = 0.071]. A significant interaction between condition and loneliness was also found [F(1.148,71.152) = ;5.503, P = 0.018, ηp2 = 0.082]. Following score was significantly higher in the sync condition compared with the random condition [t(62) = 11.911, P < 0.001, Cohen’s d = 2.088] and compared with the free condition [t(62) = 12.300, P < 0.001, Cohen’s d = 2.117]. The difference between the free and the random condition was not significant (P = 0.696). Follow-up analysis revealed that the high loneliness group showed a lower following score in the sync condition compared with the low loneliness group [t(62) = 2.373, P = 0.021, Cohen’s d = 0.593]; see Fig. 4. Similarly, a significant negative correlation was found between loneliness and the following score in the sync condition (r(62) = −0.319, P = 0.01).
Fig. 4.

High loneliness group had a lower following score in the sync condition. Following score was higher in the sync condition, compared to free and random condition. Error bars = 95% confidence level (cl).
A mixed-design ANOVA with zero-lag correlation score as the dependent variable yielded a significant main effect of condition [F(1.706,105.784) = 343.110, P < 0.001, ηp2 = 0.847]. No other main effects or interactions were significant (P > 0.404). As expected, the zero-lag correlation was significantly higher in the sync condition (M = 0.522, SD = 0.165) compared with the free condition (M = 0.011, SD = 0.149) [t(62) = 19.231, P < 0.001, Cohen’s d = 3.251] and compared with the random conditions (M = 0.008, SD = 0.078) [t(62) = 24.110, P < 0.001, Cohen’s d = 3.983]. There was no significant difference between the free and random conditions (P = 0.902). When comparing high and low loneliness groups’ zero-lag correlations scores, there was no significant difference in any of the conditions (P ≥ 0.344).
Furthermore, we explored differences in enjoyment between the conditions. A mixed-design ANOVA with the enjoyment score as the dependent variable was employed. The analysis yielded a significant main effect of condition [F(1.761,109.167) = 8.856, P < 0.001, ηp2 = 0.125]. No other main effects or interactions were significant (P > 0.162). Enjoyment level in the sync condition (M = 62.787, SD = 19.956) was higher when compared to the random condition (M = 54.037, SD = 24.359) [t(62) = 3.657, P = 0.001, Cohen’s d = 0.393]. The enjoyment level in the free condition (M = 60.208, SD = 22.219) was also higher when compared to the random condition [t(62) = 2.803, P = 0.007, Cohen’s d = 0.265]. The difference between the enjoyment levels in the free condition and the sync condition was not significant (P = 0.136). When comparing high and low loneliness groups’ enjoyment scores, there was no significant difference in any of the conditions (P ≥ 0.173).
To confirm no difference existed between participants who were scanned first and those participants who were scanned second in parameters of age and loneliness, we ran t-tests with UCLA loneliness score and age as the dependent variables, and order as the between-subject factor. These analyses yielded no significant differences between the two groups (P > 0.544). When including order as an additional between-subject factor in the mixed-design ANOVAs reported above (with following score or zero-lag correlation score or enjoyment score as the dependent variable), the main effects and/or interactions reported were not impacted by order, and no interactions or main effects with order were found (P > 0.072).
To test whether the findings were specific to loneliness, we repeated the mixed-design ANOVAs reported above (with following scores or zero-lag correlation scores or enjoyment scores as the dependent variable), this time with depression, autism-like tendencies, or empathy as the between-subject factor instead of loneliness. The analyses did not yield significant main effects for depression, autism-like tendencies, or empathy, or did they yield significant interactions (P > 0.08).
Neuroimaging analysis
Whole-brain analysis comparing activity patterns between the total run duration of the sync condition and the random condition showed that during the sync condition there was increased activation in the right IPL (58, −46, 32), right IFG opercular part (50, 18, 34), left IPL (−56, −58, 28), and dmPFC (18, 60, 24). In addition, there was increased activation in left superior cerebellum (−22, −76, −34) and the middle and superior temporal gyrus/STS (46, −24, −6); see Fig. 5 and Table 1. A similar whole-brain analysis was conducted, comparing activity patterns between the total run duration of the free condition and the random condition. During the free condition, there was increased activation in the right supramarginal gyrus and right IPL (52, –44, 24) and the lateral surface of the superior frontal gyrus extending to the mPFC (18, 56, 22). Additional activation was detected in the supplementary motor area (16, −2, 74); see Fig. 6 and Table 1. We repeated the analyses, including scanning order as a between-subject factor, conducting a two-sample t-test analysis on the second level, and no significant differences in activation were found. These findings show that areas in the AO network and the gap-monitoring network were active throughout both the sync condition and the free condition.
Fig. 5.

Brain activation in the sync condition > random condition contrast, during the total run duration, across loneliness groups. Contrast thresholded at P < 0.001 for the illustration. MNI coordinates of axial/coronal/sagittal view—(5, −40, 40).
Table 1.
Whole-brain analysis sync condition > random condition throughout the entire condition duration and free movement condition > random condition throughout the entire condition duration.
| Region | Cluster size (voxel) | MNI coordinates | Peak T | ||
|---|---|---|---|---|---|
| X | Y | Z | |||
| Sync > Random | |||||
| Right supramarginal gyrus [right angular gyrus, rIPL] | 1164 | 58 | −46 | 32 | 6.87 |
| Left superior cerebellum | 457 | −22 | −76 | −34 | 6.53 |
| rIFG—opercular part [precentral gyrus, middle frontal gyrus] | 1409 | 50 | 18 | 34 | 6.50 |
| Left angular gyrus [lIPL, left supramarginal gyrus, left temporal middle gyrus] | 536 | −56 | −58 | 28 | 6.31 |
| Right superior frontal gyrus [dmPFC] | 868 | 18 | 60 | 24 | 5.88 |
| Right superior temporal gyrus/STS | 161 | 46 | −24 | −6 | 5.55 |
| Free > Random | |||||
| Right superior frontal gyrus [dlPFC, mPFC] | 1072 | 18 | 56 | 22 | 6.72 |
| Right supramarginal gyrus [right angular gyrus, rIPL] | 459 | 52 | −44 | 24 | 6.26 |
| Supplementary motor area | 277 | 16 | −2 | 74 | 5.59 |
Notes: Contrast thresholded at P < 0.001. Only clusters with FWE-corrected Ps < 0.05 on peak level are listed. Brain region of the peak voxel is stated followed by additional regions, which are contained in the cluster in square brackets.
Fig. 6.

Brain activation in the free condition > random condition contrast, during the total run duration, across loneliness groups. Contrast thresholded at P < 0.001 for the illustration. MNI coordinates of axial/coronal/sagittal view—(5, −40, 40).
To analyze the differences in brain activation during periods in which the scanned participant was actively aligning his or her movement with the other participant (as opposed to the entire run duration of each condition, regardless of the specific behavior of the participant in that time), a whole-brain analysis was conducted comparing activity patterns during following periods in the sync condition (see explanation in Section Following Periods) and parallel periods of time during the random condition. This yielded significant clusters in the right IPL (54, −42, 48), the left IPL (−56, −46, 38), the right IFG opercular part (42, 8, 50), and the dmPFC, extending also into the lateral surface of the superior frontal gyrus (14, 26, 62). In addition, there was increased activation in the superior cerebellum (−18, −78, −26) and the right middle occipital gyrus (38, −84, 22). See Fig. 7 and Table 2. A similar analysis of the free condition compared to the random condition did not yield significant clusters. We repeated the analyses, including scanning order as a between-subject factor and conducting a two-sample t-test analysis on the second level, and no significant differences in activation were found. These findings show that areas in the AO network and the gap-monitoring network were active throughout following periods in the sync condition.
Fig. 7.

Brain activation in the sync > random following periods contrast, thresholded at P < 0.001 for illustration. MNI coordinates of axial/coronal/sagittal view—(5, −40, 40).
Table 2.
Whole-brain analysis, following periods in the sync condition > random condition.
| Region | Cluster size (voxel) | MNI coordinates | Peak T | ||
|---|---|---|---|---|---|
| X | Y | Z | |||
| Left superior cerebellum | 381 | −18 | −78 | −26 | 7.36 |
| Right supramarginal gyrus [rIPL, right angular gyrus] | 764 | 54 | −42 | 48 | 7.14 |
| Right middle occipital gyrus | 1199 | 38 | −84 | 22 | 6.84 |
| Superior frontal gyrus [dmPFC] | 503 | 14 | 26 | 62 | 6.44 |
| lIPL [left angular gyrus] | 260 | −56 | −46 | 38 | 6.31 |
| rIFG, opercular part [precentral gyrus] | 849 | 42 | 8 | 50 | 5.89 |
Notes: Contrast thresholded at P < 0.001. Only clusters with FWE-corrected Ps < 0.05 on peak level are listed. Brain region of the peak voxel is stated followed by additional regions, which are contained in the cluster in square brackets.
To analyze the differences in brain activation during zero-lag synchronization periods, a whole-brain analysis was conducted comparing activity patterns during zero-lag synchronization periods in the sync condition (see explanation in Section Zero-lag synchronization periods) and parallel periods of time during the random condition. This yielded significant clusters in the right IPL (56, −42, 48), left IPL (−56, −46, 40), right IFG, opercular part (38, 10, 24), and the right dmPFC (6, 36, 34); see Fig. 8. The detailed results of this analysis are described in Table 3.
Fig. 8.

Whole-brain analysis of zero-lag synchronization periods in the sync > random contrast thresholded at P < 0.001 for illustration. MNI coordinates of axial/coronal/sagittal view—(5, −40, 40).
Table 3.
Whole-brain analysis zero-lag synchronization periods in the sync condition > random condition.
| Region | Cluster size (voxel) | MNI coordinates | Peak T | ||
|---|---|---|---|---|---|
| X | Y | Z | |||
| Left superior cerebellum | 460 | −16 | −78 | −28 | 7.105 |
| Right middle occipital gyrus | 1275 | 36 | −86 | −4 | 7.069 |
| Right supramarginal gyrus [rIPL, right angular gyrus | 646 | 56 | −42 | 48 | 6.762 |
| Superior frontal gyrus [dmPFC] | 720 | 14 | 16 | 62 | 6.695 |
| lIPL | 231 | −56 | −46 | 40 | 5.782 |
| rIFG, opercular part [precentral gyrus] | 687 | 38 | 10 | 24 | 6.486 |
| Superior medial frontal gyrus [dmPFC] | 216 | 6 | 36 | 34 | 5.972 |
Notes: Contrast thresholded at P < 0.001. Only clusters with FWE-corrected Ps < 0.05 on peak level are listed. Brain region of the peak voxel is stated followed by additional regions, which are contained in the cluster in square brackets.
A similar analysis comparing activity patterns during the free condition and parallel periods of time during the random condition did not yield significant clusters in the regions of interest.
As whole-brain analysis confirmed activation in the IPL, the IFG, and dmPFC during following periods, beta values were extracted from the sync > random following periods contrast using the relevant anatomical ROIs. An independent samples t-test analysis revealed a significant difference in activation between the high loneliness group, which had a higher activation in the left IFG (M = 0.254, SD = 0.375) compared to the low loneliness group (M = 0.023, SD = 0.349) (t(62) = 2.547, P = 0.013, P(corr) = 0.040, Cohen’s d = 0.637). Similarly, in the right IPL, the high loneliness group had a higher activation (M = 0.528, SD = 0.567) compared to the low loneliness group (M = 0.216, SD = 0.432) (t(62) = 2.478, P = 0.016, P(corr) = 0.040, Cohen’s d = 0.619). The differences in the dmPFC, lIPL, and the rIFG were not significant (P > 0.151, P(corr) > 0.188). T-tests were FDR corrected for multiple comparisons; P(corr) represents the corrected P value. See Fig. 9 and Table 4 for detailed results. No significant correlations were found between the activity in the ROIs and loneliness scores during following periods in the sync > random contrast (P > 0.09).
Fig. 9.

High loneliness group presents a higher activation in the lIFG and rIPL during following periods. Error bars = 95% confidence level (cl).
Table 4.
Comparing high and low loneliness groups in regions of interest activity during following periods.
| ROI | Low loneliness (M ± SD) | High loneliness (M ± SD) | t-test | FDR-corrected P value |
|---|---|---|---|---|
| lIFG | 0.023 ± 0.349 | 0.254 ± 0.375 | (t(62) = 2.547, P = 0.013) | 0.040* |
| rIPL | 0.216 ± 0.432 | 0.528 ± 0.567 | (t(62) = 2.478, P = 0.016) | 0.040* |
| rIFG | 0.192 ± 0.329 | 0.332 ± 0.367 | (t(62) = 1.609, P = 0.113) | 0.188 |
| lIPL | 0.117 ± 0.565 | 0.319 ± 0.589 | (t(62) = 1.401, P = 0.166) | 0.208 |
| dmPFC | 0.259 ± 0.592 | 0.378 ± 0.488 | (t(62) = 0.877, P = 0.384) | 0.384 |
* P < 0.05.
To test whether the findings with regard to ROI activity during following periods were specific to loneliness, we repeated the t-test analyses reported above, this time with either depression, autism-like tendencies, or empathy as the between-subject factor instead of loneliness. After FDR correction, none of the analyses yielded significant differences between high and low depression, autism-like tendencies, or empathy groups (P > 0.017, P(corr) > 0.085). The detailed results of this analysis are described in Tables 5–7.
Table 5.
Comparing high and low depression groups in regions of interest activity during following periods.
| ROI | Low loneliness (M ± SD) | High loneliness (M ± SD) | t-test | FDR-corrected P value |
|---|---|---|---|---|
| lIPL | 0.087 ± 0.609 | 0.340 ± 0.533 | (t(62) = 1.772, P = 0.081) | 0.405 |
| lIFG | 0.088 ± 0.415 | 0.186 ± 0.339 | (t(62) = 1.045, P = 0.300) | 0.750 |
| dmPFC | 0.295 ± 0.549 | 0.341 ± 0.542 | (t(62) = 0.337, P = 0.737) | 0.847 |
| rIFG | 0.252 ± 0.328 | 0.272 ± 0.379 | (t(62) = 0.228, P = 0.820) | 0.847 |
| rIPL | 0.359 ± 0.537 | 0.384 ± 0.519 | (t(62) = 0.194, P = 0.847) | 0.847 |
Table 7.
Comparing high and low empathy groups in regions of interest activity during following periods.
| ROI | Low loneliness (M ± SD) | High loneliness (M ± SD) | t-test | FDR-corrected P value |
|---|---|---|---|---|
| rIPL | 0.531 ± 0.571 | 0.222 ± 0.433 | (t(62) = 2.443, P = 0.017) | 0.085 |
| lIPL | 0.292 ± 0.601 | 0.148 ± 0.562 | (t(62) = 0.991, P = 0.326) | 0.565 |
| lIFG | 0.182 ± 0.439 | 0.098 ± 0.311 | (t(62) = 0.897, P = 0.373) | 0.565 |
| rIFG | 0.297 ± 0.393 | 0.229 ± 0.314 | (t(62) = 0.759, P = 0.452) | 0.565 |
| dmPFC | 0.325 ± 0.558 | 0.312 ± 0.535 | (t(62) = 0.090, P = 0.928) | 0.928 |
Table 6.
Comparing high and low autism-related tendencies groups in regions of interest activity during following periods.
| ROI | Low loneliness (M ± SD) | High loneliness (M ± SD) | t-test | FDR-corrected P value |
|---|---|---|---|---|
| dmPFC | 0.389 ± 0.531 | 0.247 ± 0.552 | (t(62) = 1.051, P = 0.297) | 0.737 |
| rIFG | 0.297 ± 0.356 | 0.228 ± 0.352 | (t(62) = 0.781, P = 0.438) | 0.737 |
| rIPL | 0.407 ± 0.469 | 0.337 ± 0.579 | (t(62) = 0.529, P = 0.599) | 0.737 |
| lIFG | 0.161 ± 0.354 | 0.116 ± 0.405 | (t(62) = 0.473, P = 0.638) | 0.737 |
| lIPL | 0.193 ± 0.402 | 0.242 ± 0.723 | (t(62) = 0.337, P = 0.737) | 0.737 |
As whole-brain analysis also confirmed activation in the IPL, the IFG, and dmPFC during zero-lag synchronization periods, beta values were extracted from the sync > random zero-lag synchronization periods contrast using the relevant anatomical ROIs. An independent samples t-test analysis revealed no significant differences in activation between the high loneliness group and low loneliness group (P > 0.228). The detailed results of this analysis are described in Table 8.
Table 8.
Comparing high and low loneliness groups in regions of interest activity during zero-lag synchronization periods.
| ROI | Low loneliness (M ± SD) | High loneliness (M ± SD) | t-test | FDR-corrected P value |
|---|---|---|---|---|
| lIFG | 0.042 ± 0.283 | 0.089 ± 0.224 | (t(62) = 0.735, P = 0.465) | 0.981 |
| rIPL | 0.203 ± 0.342 | 0.229 ± 0.287 | (t(62) = 0.335, P = 0.739) | 0.981 |
| rIFG | 0.142 ± 0.275 | 0.135 ± 0.219 | (t(62) = 0.100, P = 0.921) | 0.981 |
| lIPL | 0.129 ± 0.387 | 0.126 ± 0.316 | (t(62) = 0.042, P = 0.966) | 0.981 |
| dmPFC | 0.160 ± 0.386 | 0.158 ± 0.253 | (t(62) = 0.024, P = 0.981) | 0.981 |
Discussion
In this study, we set out to examine whether lonely individuals have a reduced ability to synchronize with others. Furthermore, we tested a proposed neural model for interpersonal synchronization and explored the neural activation related to synchronization in high and low loneliness individuals. Using a novel computerized fMRI paradigm, we were able to measure neural activity during naturalistic, live interaction of participating dyads.
Our initial hypothesis regarding the following periods was confirmed, as the high loneliness group showed a lower level of ability to synchronize, which was reflected by their lower following scores in the sync condition. This observation supports previous findings with regard to the social impairments of lonely individuals (Mund et al. 2022) and sheds additional light on the underlying mechanisms that may inhibit positive social interaction for lonely individuals. If lonely individuals have difficulties in aligning themselves with others, they will most likely miss out on the social benefits of synchronization such as increased connection, engagement, satisfaction, liking, and affiliation (Hoehl et al. 2021), which in turn may result in their more negative reports of their interactions.
The neuroimaging findings support the model proposed for interpersonal synchrony (Shamay-Tsoory et al. 2019). When examining whole-brain activity during synchronization, activations were observed in the IFG and IPL (related to the AO system) as well as in the dmPFC (related to the gap-monitoring system). These findings, which are based on measuring brain activity during a naturalistic and interactive interpersonal synchronization, further strengthen the notion that motor interpersonal synchronization does not involve only sensorimotor components, but that indeed additional neural networks are recruited. Specifically, our study provides support for the existence of the proposed gap-monitoring system, which assists in obtaining synchronization.
Intriguingly, when examining high and low loneliness individuals engaged in active synchronization using the measurement of following periods, high loneliness was related to increased neural activity in the IPL and the IFG. This suggests that high loneliness individuals need to activate their AO system more when they are asked to synchronize their movement, compared to low loneliness individuals. These hyperactivations may be related to social impairment in loneliness. Recently, it was suggested that the AO system contributes not only to motor alignment but also to emotional and cognitive alignment (Shamay-Tsoory et al. 2019). While this study focused only on motor alignment, these findings could potentially extend to other types of social interaction as well, a notion that should be explored in future studies. Similar findings of AO-increased activation were reported also for other conditions. For example, Minichino and Cadenhead (2017) proposed that hyperactive states of the AO may be related to the social deficits in schizophrenia and to chronic activation and dysregulation of other biobehavioral systems, including the hypothalamic–pituitary–adrenal axis (HPA), metabolic, and immune systems. Increased activation of the IFG was also found among individuals with ASD when they were required to identify face targets, despite lower accuracy in the task (Dichter et al. 2009). This was attributed to an attempt to compensate for an impairment in related cognitive processes due to cortical inefficiency. Similar hyperactivation of the AO was found in multiple studies in ASD (for a recent review, refer to Chan and Han 2020). Moreover, previous studies showed that lonely people have a reduction in fractional atrophy of white matter tracts linked to the IFG (Tian et al. 2014) as well as decreased white matter density in the IPL (Nakagawa et al. 2015), which may further reduce the effectiveness of the AO system. No differences were found in the dmPFC activity between high and low loneliness individuals. This may suggest that while the AO system is hyperactive, there may be an intact gap-monitoring system among lonely individuals. In essence, the results of this study suggest that lonely people may be exerting more neural effort in the AO system; however, despite this, they still achieve less optimal behavioral outcomes (Fig. 10).
Fig. 10.
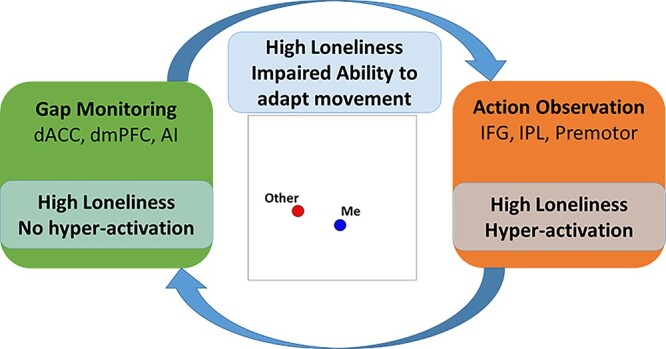
Proposed model of impaired synchronization in high loneliness individuals. The gap-monitoring system may be functioning properly; however, there appears to be hyperactivation of the AO system, potentially to compensate for the impaired ability. Despite this hyperactivation, lonely individuals still experience difficulties in adapting their movement.
The finding that the AO system was hyperactive during following periods among high loneliness individuals could potentially have alternative explanations. Specifically, the IFG and the IPL were also considered parts of neural pathways of inhibitory control (e.g. Cai et al. 2016), and it could be claimed that lonelier individuals employ more inhibition during synchronization and this results in the heightened activation of these ROIs. This would be in accordance with the evolutionary theory of loneliness (ETL), which predicts that loneliness will result in a conflict around approach and avoidance (Cacioppo, Cacioppo, et al., 2014a; Cacioppo, Zhou, et al., 2014b). That said, recent studies question the role of these areas in inhibition control (e.g. Kolodny et al. 2017; Thunberg et al. 2020). Therefore, additional studies are required to determine if indeed the activity in these areas may have been related to inhibition.
Involvement of regions associated with the reward system (OFC, vmPFC, VS), which was also proposed in the interpersonal synchronization model (Shamay-Tsoory et al. 2019) to be important for the achievement of synchronization through signaling that optimal alignment was achieved, was not identified in this study. This may speak against the involvement of the reward system in movement synchronization, but it is also possible that longer periods of optimal alignment are required to stimulate the reward system. In addition, there is recent evidence that multiband sequences have lower power to detect reward-associated striatal activation (Srirangarajan et al. 2021).
It should be noted that contrary to our hypothesis, there were no differences in the zero-lag correlation score between the high and low loneliness groups. While whole-brain analyses confirmed activation of the IFG, IPL, and dmPFC during zero-lag synchronization periods, we did not detect differences between high and low loneliness individuals in the activity of these ROIs during zero-lag synchronization periods. Conversely, group differences were detected for the following periods. This can potentially be attributed to the fact that the zero-lag correlation is a dyad measurement, which does not reflect the individual contribution of each of the dyad members to the synchronization achieved. It is possible that high loneliness individuals contributed less to the synchronization, while their dyad partners compensated for their difficulties, which resulted in intact dyadic performance. We could not effectively test this option because we did not specifically divide dyads according to their loneliness level and thus most dyads in the study consisted of mixed partners. Future studies can further test this possibility by specifically recruiting dyads in which both members report high loneliness versus dyads in which both members report low loneliness.
As expected, participants’ enjoyment ratings were higher in the sync condition compared to the random condition. However, participants also reported enjoying the free condition more than the random condition. Therefore, it is possible that the increased enjoyment reported was not necessarily due to synchronization, but rather more related to the fact that participants knew they were interacting with a human. Moreover, despite previous accounts of lonely people reporting lower enjoyment from social interaction, and in contrast to our hypothesis, in our study, there were no significant differences in reported enjoyment between the high and low loneliness groups in any of the conditions. While other studies also failed to find a direct relation between enjoyment and loneliness (e.g. Nezlek et al. 2002), it is also possible lonely individuals may have not enjoyed this interaction less since it was a virtual interaction, in which they typically feel more comfortable (Nowland et al. 2018). In addition, loneliness may be more related to other aspects of the experience, such as level of closeness or satisfaction from the interaction relationship (Mund et al. 2022), which were not measured in the current study.
Notably, group differences were specific for loneliness and not observed when we examined related constructs such as depression, autism-like tendencies, or empathy. This further attests to the notion that loneliness is a unique construct, worthy of specific scientific attention (Russell et al. 1980; Cacioppo et al. 2006).
During the free condition, we did not observe spontaneous synchronization, across both loneliness groups. Nonetheless, when examining the brain activity during the entire free condition and contrasting it with the control condition, it was apparent that brain regions relevant to synchronization were recruited, namely the IPL and the PFC. Therefore, it is possible that participants were recruiting the relevant regions but not to an extent that allows actual detectable synchronization. It is conceivable that the observed activations are related to the operation of the default mode network (DMN) (Raichle et al. 2001; Buckner et al. 2008), which is closely linked to social cognition (Mars et al. 2012; Smallwood et al. 2021). This might explain the difference between the free condition and the random condition as participants knew that they are interacting with another person in the free condition. It is noteworthy that the activations in the PFC during the free condition were more lateral than in the sync condition, including the superior and dorsolateral parts of the PFC. The dlPFC was previously linked to approach–avoidance motivation conflict (Spielberg et al. 2012; Ironside et al. 2020; Rolle et al. 2021), and it is possible that this explains the activations during the free condition.
The finding that the high loneliness group showed a lower level of following in the sync condition was also evident in a significant correlation between loneliness and the following scores in the sync condition. However, differences between high and low loneliness groups in the IPL and the IFG activity during following periods in the sync condition were not significant when using correlations. Given that we used a prestratified parallel-group design and that in general, the UCLA loneliness scale is skewed, with fewer people receiving high scores (Russell 1996), a comparison between the two groups may be more accurate.
The sample in the study was not balanced in terms of sex, with more females participating. While we did not find any significant differences between males and females in loneliness levels, as well as in following scores, enjoyment scores, and zero-lag correlation scores in the sync condition, future studies should strive to examine more thoroughly if the association between loneliness and social synchronization differs between women and men.
Reservations concerning the use of a naturalistic paradigm are warranted. While it has benefits in terms of validity and reliability, each participant interacted with a specific participant, and it may be claimed that his or her behavior could be different if he or she were to interact with different participants. To minimize the impact of this issue, we chose to focus on an individual measurement of contribution to the synchronization and the related neural activations and not the dyad measurement. That said, further research may be needed to confirm the findings of the study also in a more controlled setting. In addition, participants performed the task twice, and it could be claimed that this would impact their neural and behavioral results. However, scanning order did not impact any of the behavioral or neuroimaging analyses, and therefore it appears that this does not limit the ability to interpret the results.
In conclusion, we propose that lonely individuals may have an underlying impairment in interpersonal synchronization. We further propose that this is related to a hyperactivation of the AO system during synchronization, potentially as a compensation attempt for their impaired ability. Our study suggests that despite this hyperactivation, high loneliness individuals still achieve less optimal behavioral outcomes. Building on a model according to which all levels of alignment are related and involve the AO system (Shamay-Tsoory et al. 2019; Kogler et al. 2020; Palagi et al. 2020), we suggest that these difficulties could potentially extend to emotional and cognitive synchronization as well, a hypothesis that future studies could explore. Given the cross-sectional design of our study, our findings do not allow casual inferences about the relationship of loneliness and synchronization. Therefore, our findings cannot determine whether loneliness results in difficulties in synchronization, whether difficulties in synchronization lead to increased loneliness, or whether this is a reciprocal process. However, the findings do suggest that interpersonal synchronization may be a relevant area of intervention to ameliorate loneliness. Interventions focusing on improving lonely individuals’ ability to individually contribute to synchronization may be effective, leading to improvement in the way lonely people experience social interactions and relationships, resulting in increased sense of affinity, closeness, and satisfaction.
Contributor Information
Nira Saporta, School of Psychological Sciences, University of Haifa, 199 Aba Khoushy Ave., Mount Carmel, Haifa 3498838, Israel.
Dirk Scheele, Research Section Medical Psychology, Department of Psychiatry and Psychotherapy, University Hospital Bonn, Venusberg-Campus 1, 53127 Bonn, Germany; Department of Psychiatry, School of Medicine and Health Sciences, University of Oldenburg, Ammerländer Heerstrasse 114-118, 26129 Oldenburg, Germany.
Jana Lieberz, Research Section Medical Psychology, Department of Psychiatry and Psychotherapy, University Hospital Bonn, Venusberg-Campus 1, 53127 Bonn, Germany.
Michael Nevat, School of Psychological Sciences, University of Haifa, 199 Aba Khoushy Ave., Mount Carmel, Haifa 3498838, Israel.
Alisa Kanterman, School of Psychological Sciences, University of Haifa, 199 Aba Khoushy Ave., Mount Carmel, Haifa 3498838, Israel.
René Hurlemann, Department of Psychiatry, School of Medicine and Health Sciences, University of Oldenburg, Ammerländer Heerstrasse 114-118, 26129 Oldenburg, Germany; Research Center Neurosensory Science, University of Oldenburg, Ammerländer Heerstrasse 114-118, 26129 Oldenburg, Germany.
Simone G Shamay-Tsoory, School of Psychological Sciences, University of Haifa, 199 Aba Khoushy Ave., Mount Carmel, Haifa 3498838, Israel.
Funding
German-Israel Foundation for Scientific Research and Development (GIF, I-1428-105.4/2017).
Conflicts of interest statement
The authors declare no conflict of interest.
Data availability
The behavioral data of the current study as well as the beta values extracted from the regions of interest are openly available in https://github.com/SANSlabHaifa/Alone_again. The unthresholded statistical maps of the fMRI results can be accessed at https://neurovault.org/collections/11618/.
Institutional review board statement
The study was approved by the ethics committee of Tel Aviv University and the institutional review board at the Sheba Tel Hashomer medical center (approval number SMC-17-4132) and was conducted according to the guidelines of the Declaration of Helsinki.
Informed consent statement
Informed consent was obtained from all subjects involved in the study.
References
- Arnold AJ, Winkielman P. Smile (but only deliberately) though your heart is aching: loneliness is associated with impaired spontaneous smile mimicry. Soc Neurosci. 2021:16(1):26–38. [DOI] [PubMed] [Google Scholar]
- Atzil S, Gendron M. Bio-behavioral synchrony promotes the development of conceptualized emotions. Curr Opin Psychol. 2017:17:162–169. [DOI] [PMC free article] [PubMed] [Google Scholar]
- Atzil S, Hendler T, Feldman R. Specifying the neurobiological basis of human attachment: brain, hormones, and behavior in synchronous and intrusive mothers. Neuropsychopharmacology. 2011:36(13):2603–2615. [DOI] [PMC free article] [PubMed] [Google Scholar]
- Atzil S, Hendler T, Feldman R. The brain basis of social synchrony. Soc Cogn Affect Neurosci. 2014:9(8):1193–1202. [DOI] [PMC free article] [PubMed] [Google Scholar]
- Baron-Cohen S, Wheelwright S, Skinner R, Martin J, Clubley E. The autism-spectrum quotient (AQ): evidence from asperger syndrome/high-functioning autism, malesand females, scientists and mathematicians. J Autism Dev Disord. 2001:31(1):5–17. [DOI] [PubMed] [Google Scholar]
- Barreto M, Victor C, Hammond C, Eccles A, Richins MT, Qualter P. Loneliness around the world: age, gender, and cultural differences in loneliness. Personal Individ Differ. 2021:169:110066. [DOI] [PMC free article] [PubMed] [Google Scholar]
- Beck AT, Steer RA, Brown GK. Manual for the Beck depression inventory-II. Vol. 1996. San Antonio, TX: Psychological Corporation; 1996 [Google Scholar]
- Beutel ME, Klein EM, Brähler E, Reiner I, Jünger C, Michal M, Wiltink J, Wild PS, Münzel T, Lackner KJ. Loneliness in the general population: prevalence, determinants and relations to mental health. BMC Psychiatry. 2017:17(1):97. [DOI] [PMC free article] [PubMed] [Google Scholar]
- Buckner RL, Andrews-Hanna JR, Schacter DL. The brain’s default network: anatomy, function, and relevance to disease. Ann N Y Acad Sci. 2008:1124(1):1–38. [DOI] [PubMed] [Google Scholar]
- Cacioppo S, Cacioppo JT. Decoding the invisible forces of social connections. Front Integr Neurosci. 2012:6:51. [DOI] [PMC free article] [PubMed] [Google Scholar]
- Cacioppo JT, Hawkley LC, Ernst JM, Burleson M, Berntson GG, Nouriani B, Spiegel D. Loneliness within a nomological net: an evolutionary perspective. J Res Pers. 2006:40(6):1054–1085. [Google Scholar]
- Cacioppo JT, Norris CJ, Decety J, Monteleone G, Nusbaum H. In the eye of the beholder: individual differences in perceived social isolation predict regional brain activation to social stimuli. J Cogn Neurosci. 2009:21(1):83–92. [DOI] [PMC free article] [PubMed] [Google Scholar]
- Cacioppo JT, Hawkley LC, Thisted RA. Perceived social isolation makes me sad: 5-year cross-lagged analyses of loneliness and depressive symptomatology in the Chicago health, aging, and social relations study. Psychol Aging. 2010:25(2):453–463. [DOI] [PMC free article] [PubMed] [Google Scholar]
- Cacioppo JT, Cacioppo S, Boomsma DI. Evolutionary mechanisms for loneliness. Cognit Emot. 2014a:28(1):3–21. [DOI] [PMC free article] [PubMed] [Google Scholar]
- Cacioppo S, Zhou H, Monteleone G, Majka EA, Quinn KA, Ball AB, Norman GJ, Semin GR, Cacioppo JT. You are in sync with me: neural correlates of interpersonal synchrony with a partner. Neuroscience. 2014b:277:842–858. [DOI] [PubMed] [Google Scholar]
- Cacioppo JT, Cacioppo S, Capitanio JP, Cole SW. The neuroendocrinology of social isolation. Annu Rev Psychol. 2015:66(1):733–767. [DOI] [PMC free article] [PubMed] [Google Scholar]
- Cacioppo S, Bangee M, Balogh S, Cardenas-Iniguez C, Qualter P, Cacioppo JT. Loneliness and implicit attention to social threat: a high-performance electrical neuroimaging study. Cogn Neurosci. 2016:7(1–4):138–159. [DOI] [PubMed] [Google Scholar]
- Cai Y, Li S, Liu J, Li D, Feng Z, Wang Q, Chen C, Xue G. The role of the frontal and parietal cortex in proactive and reactive inhibitory control: a transcranial direct current stimulation study. J Cogn Neurosci. 2016:28(1):177–186. [DOI] [PubMed] [Google Scholar]
- Chan MMY, Han YMY. Differential mirror neuron system (MNS) activation during action observation with and without social-emotional components in autism: a meta-analysis of neuroimaging studies. Mol Autism. 2020:11(1):1–18. [DOI] [PMC free article] [PubMed] [Google Scholar]
- Chartrand TL, Lakin JL. The antecedents and consequences of human behavioral mimicry. Annu Rev Psychol. 2013:64(1):285–308. [DOI] [PubMed] [Google Scholar]
- Cirelli LK, Einarson KM, Trainor LJ. Interpersonal synchrony increases prosocial behavior in infants. Dev Sci. 2014:17(6):1003–1011. [DOI] [PubMed] [Google Scholar]
- Courtney AL, Meyer ML. Self-other representation in the social brain reflects social connection. J Neurosci. 2020:40(29):5616–5627. [DOI] [PMC free article] [PubMed] [Google Scholar]
- Cristofori I, Pal S, Zhong W, Gordon B, Krueger F, Grafman J. The lonely brain: evidence from studying patients with penetrating brain injury. Soc Neurosci. 2019:14(6):663–675. [DOI] [PubMed] [Google Scholar]
- Davis MH. Measuring individual differences in empathy: evidence for a multidimensional approach. J Pers Soc Psychol. 1983:44(1):113. [Google Scholar]
- Dichter GS, Felder JN, Bodfish JW. Autism is characterized by dorsal anterior cingulate hyperactivation during social target detection. Soc Cogn Affect Neurosci. 2009:4(3):215–226. [DOI] [PMC free article] [PubMed] [Google Scholar]
- Duranton C, Gaunet F. Behavioural synchronization from an ethological perspective: overview of its adaptive value. Adapt Behav. 2016:24(3):181–191. [Google Scholar]
- Fairhurst MT, Janata P, Keller PE. Being and feeling in sync with an adaptive virtual partner: brain mechanisms underlying dynamic cooperativity. Cereb Cortex. 2013:23(11):2592–2600. [DOI] [PubMed] [Google Scholar]
- Faul F, Erdfelder E, Lang A-G, Buchner A. G*power 3: a flexible statistical power analysis program for the social, behavioral, and biomedical sciences. Behav Res Methods. 2007:39(2):175–191. [DOI] [PubMed] [Google Scholar]
- Feldman R. Parent–infant synchrony: biological foundations and developmental outcomes. Curr Dir Psychol Sci. 2007:16(6):340–345. [Google Scholar]
- Hatfield E, Cacioppo JT, Rapson RL. Emotional contagion. Studies in emotion and social interaction. Cambridge: Cambridge University Press; 1994 [Google Scholar]
- Hawkley LC, Burleson MH, Berntson GG, Cacioppo JT. Loneliness in everyday life: cardiovascular activity, psychosocial context, and health behaviors. J Pers Soc Psychol. 2003:85(1):105. [DOI] [PubMed] [Google Scholar]
- Hoehl S, Fairhurst M, Schirmer A. Interactional synchrony: signals, mechanisms and benefits. Soc Cogn Affect Neurosci. 2021:16(1–2):5–18. [DOI] [PMC free article] [PubMed] [Google Scholar]
- Holwerda TJ, Deeg DJH, Beekman ATF, van Tilburg TG, Stek ML, Jonker C, Schoevers RA. Feelings of loneliness, but not social isolation, predict dementia onset: results from the Amsterdam study of the elderly (AMSTEL). J Neurol Neurosurg Psychiatry. 2014:85(2):135–142. [DOI] [PubMed] [Google Scholar]
- Hove MJ, Risen JL. It’s all in the timing: interpersonal synchrony increases affiliation. Soc Cogn. 2009:27(6):949–960. [Google Scholar]
- Iacoboni M, Koski LM, Brass M, Bekkering H, Woods RP, Dubeau M-C, Mazziotta JC, Rizzolatti G. Reafferent copies of imitated actions in the right superior temporal cortex. Proc Natl Acad Sci. 2001:98(24):13995–13999. [DOI] [PMC free article] [PubMed] [Google Scholar]
- Inagaki TK, Muscatell KA, Irwin MR, Moieni M, Dutcher JM, Jevtic I, Breen EC, Eisenberger NI. The role of the ventral striatum in inflammatory-induced approach toward support figures. Brain Behav Immun. 2015:44:247–252. [DOI] [PMC free article] [PubMed] [Google Scholar]
- Ironside M, Amemori K, McGrath CL, Pedersen ML, Kang MS, Amemori S, Frank MJ, Graybiel AM, Pizzagalli DA. Approach-avoidance conflict in major depressive disorder: congruent neural findings in humans and nonhuman primates. Biol Psychiatry. 2020:87(5):399–408. [DOI] [PMC free article] [PubMed] [Google Scholar]
- Jasmin KM, McGettigan C, Agnew ZK, Lavan N, Josephs O, Cummins F, Scott SK. Cohesion and joint speech: right hemisphere contributions to synchronized vocal production. J Neurosci. 2016:36(17):4669–4680. [DOI] [PMC free article] [PubMed] [Google Scholar]
- Jiang J, Dai B, Peng D, Zhu C, Liu L, Lu C. Neural synchronization during face-to-face communication. J Neurosci. 2012:32(45):16064–16069. [DOI] [PMC free article] [PubMed] [Google Scholar]
- Koehne S, Hatri A, Cacioppo JT, Dziobek I. Perceived interpersonal synchrony increases empathy: insights from autism spectrum disorder. Cognition. 2016:146:8–15. [DOI] [PubMed] [Google Scholar]
- Kogler L, Müller VI, Werminghausen E, Eickhoff SB, Derntl B. Do I feel or do I know? Neuroimaging meta-analyses on the multiple facets of empathy. Cortex. 2020:129:341–355. [DOI] [PMC free article] [PubMed] [Google Scholar]
- Kolodny T, Mevorach C, Shalev L. Isolating response inhibition in the brain: parietal versus frontal contribution. Cortex. 2017:88:173–185. [DOI] [PubMed] [Google Scholar]
- Lam JA, Murray ER, Kasey EY, Ramsey M, Nguyen TT, Mishra J, Martis B, Thomas ML, Lee EE. Neurobiology of loneliness: a systematic review. Neuropsychopharmacology. 2021:46(11):1873–1887. [DOI] [PMC free article] [PubMed] [Google Scholar]
- Launay J, Dean RT, Bailes F. Synchronization can influence trust following virtual interaction. Exp Psychol. 2013:60(1):53–63. [DOI] [PubMed] [Google Scholar]
- Launay J, Tarr B, Dunbar RIM. Synchrony as an adaptive mechanism for large-scale human social bonding. Ethology. 2016:122(10):779–789. [Google Scholar]
- Lestou V, Pollick FE, Kourtzi Z. Neural substrates for action understanding at different description levels in the human brain. J Cogn Neurosci. 2008:20(2):324–341. [DOI] [PubMed] [Google Scholar]
- Lieberz J, Shamay-Tsoory SG, Saporta N, Esser T, Kuskova E, Stoffel-Wagner B, Hurlemann R, Scheele D. Loneliness and the social brain: how perceived social isolation impairs human interactions. Adv Sci. 2021:8(21):2102076. [DOI] [PMC free article] [PubMed] [Google Scholar]
- Lim MH, Eres R, Vasan S. Understanding loneliness in the twenty-first century: an update on correlates, risk factors, and potential solutions. Soc Psychiatry Psychiatr Epidemiol. 2020:55(7):793–810. [DOI] [PubMed] [Google Scholar]
- Mars RB, Neubert F-X, Noonan MP, Sallet J, Toni I, Rushworth MFS. On the relationship between the “default mode network” and the “social brain”. Front Hum Neurosci. 2012:6:189. [DOI] [PMC free article] [PubMed] [Google Scholar]
- Marsh KL, Richardson MJ, Schmidt RC. Social connection through joint action and interpersonal coordination. Top Cogn Sci. 2009:1(2):320–339. [DOI] [PubMed] [Google Scholar]
- Marton-Alper IZ, Gvirts-Provolovski HZ, Nevat M, Karklinsky M, Shamay-Tsoory SG. Herding in human groups is related to high autistic traits. Sci Rep. 2020:10(1):1–15. [DOI] [PMC free article] [PubMed] [Google Scholar]
- Minichino A, Cadenhead K. Mirror neurons in psychiatric disorders: from neuroception to bio-behavioral system dysregulation. Neuropsychopharmacology. 2017:42(1):366. [DOI] [PMC free article] [PubMed] [Google Scholar]
- Mund M, Weidmann R, Wrzus C, Johnson MD, Bühler JL, Burriss RP, Wünsche J, Grob A. Loneliness is associated with the subjective evaluation of but not daily dynamics in partner relationships. Int J Behav Dev. 2022:46(1):28–38. [Google Scholar]
- Nagy M, Ákos Z, Biro D, Vicsek T. Hierarchical group dynamics in pigeon flocks. Nature. 2010:464(7290):890–893. [DOI] [PubMed] [Google Scholar]
- Nakagawa S, Takeuchi H, Taki Y, Nouchi R, Sekiguchi A, Kotozaki Y, Miyauchi CM, Iizuka K, Yokoyama R, Shinada T, et al. White matter structures associated with loneliness in young adults. Sci Rep. 2015:5(1):1–11. [DOI] [PMC free article] [PubMed] [Google Scholar]
- Nezlek JB, Richardson DS, Green LR, Schatten-Jones EC. Psychological well-being and day-to-day social interaction among older adults. Pers Relat. 2002:9(1):57–71. [Google Scholar]
- Nowland R, Necka EA, Cacioppo JT. Loneliness and social internet use: pathways to reconnection in a digital world? Perspect Psychol Sci. 2018:13(1):70–87. [DOI] [PubMed] [Google Scholar]
- Noy L, Levit-Binun N, Golland Y. Being in the zone: physiological markers of togetherness in joint improvisation. Front Hum Neurosci. 2015:9:187. [DOI] [PMC free article] [PubMed] [Google Scholar]
- Osaka N, Minamoto T, Yaoi K, Azuma M, Shimada YM, Osaka M. How two brains make one synchronized mind in the inferior frontal cortex: fNIRS-based hyperscanning during cooperative singing. Front Psychol. 2015:6:1811. [DOI] [PMC free article] [PubMed] [Google Scholar]
- Palagi E, Celeghin A, Tamietto M, Winkielman P, Norscia I. The neuroethology of spontaneous mimicry and emotional contagion in human and non-human animals. Neurosci Biobehav Rev. 2020:111:149–165. [DOI] [PubMed] [Google Scholar]
- Perlman D, Peplau LA. Toward a social psychology of loneliness. Pers Relat. 1981:3:31–56. [Google Scholar]
- Pilgramm S, Lorey B, Stark R, Munzert J, Zentgraf K. The role of own-body representations in action observation: a functional MRI study. Neuroreport. 2009:20(11):997–1001. [DOI] [PubMed] [Google Scholar]
- Rabinowitch T-C, Knafo-Noam A. Synchronous rhythmic interaction enhances children’s perceived similarity and closeness towards each other. PLoS One. 2015:10(4):e0120878. [DOI] [PMC free article] [PubMed] [Google Scholar]
- Raichle ME, MacLeod AM, Snyder AZ, Powers WJ, Gusnard DA, Shulman GL. A default mode of brain function. Proc Natl Acad Sci. 2001:98(2):676–682. [DOI] [PMC free article] [PubMed] [Google Scholar]
- Richardson MJ, Marsh KL, Schmidt RC. Effects of visual and verbal interaction on unintentional interpersonal coordination. J Exp Psychol Hum Percept Perform. 2005:31(1):62–79. [DOI] [PubMed] [Google Scholar]
- Richardson MJ, Marsh KL, Isenhower RW, Goodman JRL, Schmidt RC. Rocking together: dynamics of intentional and unintentional interpersonal coordination. Hum Mov Sci. 2007:26(6):867–891. [DOI] [PubMed] [Google Scholar]
- Rizzolatti G, Craighero L. The mirror-neuron system. Annu Rev Neurosci. 2004:27(1):169–192. [DOI] [PubMed] [Google Scholar]
- Rizzolatti G, Fogassi L, Gallese V. Neurophysiological mechanisms underlying the understanding and imitation of action. Nat Rev Neurosci. 2001:2(9):661–670. [DOI] [PubMed] [Google Scholar]
- Rolle CE, Pedersen ML, Johnson N, Amemori K, Ironside M, Graybiel AM, Pizzagalli DA, Etkin A. The role of the dorsal–lateral prefrontal cortex in reward sensitivity during approach–avoidance conflict. Cereb Cortex. 2021. 10.1093/cercor/bhab292. [DOI] [PMC free article] [PubMed] [Google Scholar]
- Rolls ET, Huang C-C, Lin C-P, Feng J, Joliot M. Automated anatomical labelling atlas 3. NeuroImage. 2020:206:116189. [DOI] [PubMed] [Google Scholar]
- Russell D. UCLA loneliness scale (version 3): reliability, validity, and factor structure. J Pers Assess. 1996:66(1):20–40. [DOI] [PubMed] [Google Scholar]
- Russell D, Peplau LA, Ferguson ML. Developing a measure of loneliness. J Pers Assess. 1978:42(3):290–294. [DOI] [PubMed] [Google Scholar]
- Russell D, Peplau LA, Cutrona CE. The revised UCLA loneliness scale: concurrent and discriminant validity evidence. J Pers Soc Psychol. 1980:39(3):472. [DOI] [PubMed] [Google Scholar]
- Saporta N, Scheele D, Lieberz J, Stuhr-Wulff F, Hurlemann R, Shamay-Tsoory SG. Opposing association of situational and chronic loneliness with interpersonal distance. Brain Sci. 2021:11(9):1135. [DOI] [PMC free article] [PubMed] [Google Scholar]
- Shamay-Tsoory SG, Saporta N, Marton-Alper IZ, Gvirts HZ. Herding brains: a core neural mechanism for social alignment. Trends Cogn Sci. 2019:23(3):174–186. [DOI] [PubMed] [Google Scholar]
- Smallwood J, Bernhardt BC, Leech R, Bzdok D, Jefferies E, Margulies DS. The default mode network in cognition: a topographical perspective. Nat Rev Neurosci. 2021:22(8):503–513. [DOI] [PubMed] [Google Scholar]
- Spielberg JM, Miller GA, Warren SL, Engels AS, Crocker LD, Banich MT, Sutton BP, Heller W. A brain network instantiating approach and avoidance motivation. Psychophysiology. 2012:49(9):1200–1214. [DOI] [PMC free article] [PubMed] [Google Scholar]
- Srirangarajan T, Mortazavi L, Bortolini T, Moll J, Knutson B. Multi-band FMRI compromises detection of mesolimbic reward responses. NeuroImage. 2021:244:118617. [DOI] [PMC free article] [PubMed] [Google Scholar]
- Thunberg C, Messel MS, Raud L, Huster RJ. tDCS over the inferior frontal gyri and visual cortices did not improve response inhibition. Sci Rep. 2020:10(1):1–10. [DOI] [PMC free article] [PubMed] [Google Scholar]
- Tian Y, Liang S, Yuan Z, Chen S, Xu P, Yao D. White matter structure in loneliness: preliminary findings from diffusion tensor imaging. Neuroreport. 2014:25(11):843–847. [DOI] [PubMed] [Google Scholar]
- Vacharkulksemsuk T, Fredrickson BL. Strangers in sync: achieving embodied rapport through shared movements. J Exp Soc Psychol. 2012:48(1):399–402. [DOI] [PMC free article] [PubMed] [Google Scholar]
- Valdesolo P, DeSteno D. Synchrony and the social tuning of compassion. Emotion. 2011:11(2):262–266. [DOI] [PubMed] [Google Scholar]
- Valtorta NK, Kanaan M, Gilbody S, Ronzi S, Hanratty B. Loneliness and social isolation as risk factors for coronary heart disease and stroke: systematic review and meta-analysis of longitudinal observational studies. Heart. 2016:102(13):1009–1016. [DOI] [PMC free article] [PubMed] [Google Scholar]
- Victor CR, Yang K. The prevalence of loneliness among adults: a case study of the United Kingdom. J Psychol. 2012:146(1–2):85–104. [DOI] [PubMed] [Google Scholar]
- Weiss RS. Loneliness: the experience of emotional and social isolation. In: Loneliness: the experience of emotional and social isolation. Cambridge: The MIT Press; 1973 [Google Scholar]
- Wilson C, Moulton B. Loneliness among older adults: a national survey of adults 45+. Washington, DC: AARP; 2010 [Google Scholar]
Associated Data
This section collects any data citations, data availability statements, or supplementary materials included in this article.
Data Availability Statement
The behavioral data of the current study as well as the beta values extracted from the regions of interest are openly available in https://github.com/SANSlabHaifa/Alone_again. The unthresholded statistical maps of the fMRI results can be accessed at https://neurovault.org/collections/11618/.