

Abstract
Genetic variation in genes regulating metabolism may be advantageous in some settings but not others. The non-failing adult heart relies heavily on fatty acids as a fuel substrate and source of ATP. In contrast, the failing heart favors glucose as a fuel source. A bootstrap analysis for genes with deviant allele frequencies in cardiomyopathy cases versus controls identified the MTCH2 gene as having unusual variation. MTCH2 encodes an outer mitochondrial membrane protein, and prior genome-wide studies associated MTCH2 variants with body mass index, consistent with its role in metabolism. We identified the referent allele of rs1064608 (p.Pro290) as being overrepresented in cardiomyopathy cases compared to controls, and linkage disequilibrium analysis associated this variant with the MTCH2 cis eQTL rs10838738 and lower MTCH2 expression. To evaluate MTCH2, we knocked down Mtch in Drosophila heart tubes which produced a dilated and poorly functioning heart tube, reduced adiposity and shortened life span. Cardiac Mtch mutants generated more lactate at baseline, and they displayed impaired oxygen consumption in the presence of glucose but not palmitate. Treatment of cardiac Mtch mutants with dichloroacetate, a pyruvate dehydrogenase kinase inhibitor, reduced lactate and rescued lifespan. Deletion of MTCH2 in human cells similarly impaired oxygen consumption in the presence of glucose but not fatty acids. These data support a model in which MTCH2 reduction may be favorable when fatty acids are the major fuel source, favoring lean body mass. However, in settings like heart failure, where the heart shifts toward using more glucose, reduction of MTCH2 is maladaptive.
Graphical abstract
Graphical Abstract.

Introduction
MTCH2 encodes an outer mitochondrial membrane protein belonging to the solute carrier 25 (SLC25) family (1). In humans, single nucleotide polymorphisms (SNPs) around and in MTCH2 have been associated with body mass index (BMI) (2–4). The intronic MTCH2 variant rs10838738 associates with BMI in both adults and children, and this variant is linked to increased MTCH2 mRNA expression in adipose tissue suggesting a role for MTCH2 in metabolic regulation (5–8). Deletion of Mtch2 in mice produces early embryonic lethality (9). Mice lacking Mtch2 in skeletal and cardiac muscle are resistant to high fat diet and have increased lean mass (10). These mice also have excess energy expenditure, elevated serum lactate and hyperdynamic cardiac contractility (10). Overexpression of Mtch2 produced mice with fatty livers and high levels of fatty acid synthase (11). In Caenorhabditis elegans, RNAi-mediated knockdown of the MTCH2 ortholog, mtch-1, similarly reduced overall adiposity levels, and mtch-1 overexpression led to excess lipid accumulation in worms (12). These phenotypes point to a fundamental role for MTCH2 in metabolic homeostasis in which reduced MTCH2 favors lean mass and elevated MTCH2 promotes adiposity.
In a search for genetic modifiers of heart failure, we now identified MTCH2 as having deviant non-synonymous variation in humans with cardiomyopathy compared to a population without heart failure. Cardiomyopathy is a leading cause of heart failure, affecting approximately 1 in 250–500 adults (13). Under normal conditions, the healthy adult heart relies heavily on fatty acids and oxidative phosphorylation as its major source of ATP (14). In contrast, the failing heart shifts to glucose and glycolysis as a primary source of ATP, and this fuel shift is a shared feature across all forms of advanced heart failure (15–17). The failing heart’s increased reliance on glycolysis is not matched by an increase in mitochondrial oxidation of pyruvate derived from glycolysis, resulting in lactate accumulation and reduced oxygen consumption. Specifically, we identified overrepresentation of the referent allele of rs1064608 (MTCH2 p.Pro290). However, it is the non-referent (MTCH2 p.Pro290Ala) allele that was previously associated with increased BMI (18), as well as rs10838738, which falls within a non-coding region (2). The two SNPs, rs10838738 and rs1064608 (MTCH2 p.Pro290Ala) are in near complete linkage disequilibrium (LD), and importantly, rs10838738 is a cis eQTL for increased MTCH2 expression in skeletal muscle, consistent with the referent haplotype having comparatively lower expression. These findings suggest MTCH2 reduction is protective for obesity but may not be beneficial in the setting of heart failure.
To evaluate the role of MTCH2 in the heart, we generated Drosophila with cardiac-specific knockdown of the MTCH2 ortholog Mtch. Cardiac Mtch knockdowns developed cardiomyopathy, reduced adiposity and shortened lifespan. Cardiac Mtch-knockdown flies, as well as MTCH2-deleted HEK293 human cells, had increased lactate and less ATP production in the presence of glucose but not fatty acids. We identified reduced mitochondrial pyruvate dehydrogenase (PDH) activity as a feature of MTCH2 reduction. We showed that inhibition of pyruvate dehydrogenase kinase (PDK), which normally inhibits PDH, in cardiac Mtch-knockdown flies improved lifespan and the substrate-dependent oxygen consumption rates (OCRs). The results support a model in which lower MTCH2 expression is beneficial in the setting of high fat diet where it associates with lean mass, but this same haplotype is maladaptive in heart failure, when the heart becomes more reliant on glycolysis for function.
Results
Aberrant MTCH2 variation in the cardiomyopathies
We previously searched for modifiers of cardiomyopathy by identifying genes with deviant protein-coding variation in cardiomyopathy subtypes (19). We applied bootstrap resampling using ancestral allele frequencies from gnomAD selecting for variants with a frequency between 0.25 and 0.50 as we expected these variants to represent modifier alleles. Genome-wide, a total of 184 genes were identified with an unusual cumulative allele frequency. Sixty-seven genes were genome-wide significant for aberrant variant accumulation in the same direction for both hypertrophic cardiomyopathy (HCM) and dilated cardiomyopathy (DCM), and these included MTCH2. We identified the MTCH2 gene as having an underrepresentation of non-synonymous single nucleotide variation (nsSNV) in both DCM and HCM cardiomyopathy subjects (n = 172) compared to the gnomAD database. Fewer MTCH2 nsSNVs were identified in both DCM and HCM subjects (99.95% confidence intervals (CIs), DCM: −0.3155 to −0.0779; HCM: −0.3707 to −0.1098) (Fig. 1A). Results were significant for a 1% false-discovery rate across the entire protein coding genome. MTCH2 variant analysis revealed that there was only one common (frequency range 0.25–0.50) variant in the cardiomyopathy dataset, rs1064608. rs1064608 encodes an alanine at amino acid 290 of MTCH2, where the referent allele is a proline (Fig. 1B). Figure 1C shows the position of MTCH2 nsSNVs (blue), as well as MTCH2 variants identified from genome-wide association studies (GWAS) associated with metabolic and cardiovascular phenotypes (yellow), including BMI, hypertension and high-density lipoprotein levels (2,18,20,21). rs1064608 (p.P290A) was previously identified in a GWAS for BMI and is in near total LD with rs10839738 (R2 = 0.997), which is a lead index SNP identified in a GWAS for BMI (18,22). LD mapping revealed the co-inheritance pattern between rs1064608 and an additional GWAS variant rs3817334 (R2 = 0.501) (Fig. 1D). Genotype-Tissue Expression (GTEx) Project data was used to determine if either of these GWAS SNPs for BMI were also expression quantitative trait loci (eQTL). Both SNVs significantly alter expression of MTCH2 in skeletal muscle (Fig. 1E). We identified that the rs1064608 referent allele was overrepresented in a non-ischemic cardiomyopathy cohort (N = 172) when compared to a general cohort derived from the Northwestern medical biobank (N = 772) with an overall allele frequency of 0.776 in the cardiomyopathy cohort compared to 0.714 in the control cohort, respectively (P < 0.024, Chi Square Test, Fig. 1F). The haplotype characterized by comparatively reduced MTCH2 expression is overrepresented in the cardiomyopathy cohort. Therefore, we hypothesized that lower MTCH2 expression is maladaptive in the heart.
Figure 1.

MTCH2 variation in a human cardiomyopathy cohort. (A). Shown is common nsSNV variant burden in MTCH2 in DCM or HCM cases compared with expected gnomAD frequencies estimated using bootstrap-based approach. The 99.95% confidence intervals are shown for MTCH2 (DCM: −0.3155 to −0.0779; HCM: −0.3707 to −0.1098). (B) MTCH2 has less variation in cardiomyopathy compared to the gnomAD. The purple bar represents the normalized referent allele count of MTCH2 p.Pro290Ala variant in the cardiomyopathy cohort (N = 172), the black line represents number of variants expected at each frequency based on gnomAD genome-wide frequency predictions. (C) The top pins (blue) show the position of MTCH2 variants from a cardiomyopathy cohort, and the bottom pins (yellow) depict MTCH2 variants identified in GWAS for cardiac and metabolic phenotypes. The blue and yellow striped pin represents rs1064608 (MTCH2 p.Pro290Ala) identified in a GWAS for BMI. (D) LD plot of the 5 GWAS SNPs from (C) reveals strong LD between rs1064608 and the two SNPs previously associated with BMI (rs10838738 and rs3817334). (E) GTEx shows two MTCH2 SNPS that are eQTLs in skeletal muscle and have genome-wide significant association with BMI (underlined in C). (F) In a control cohort derived from the Northwestern NUgene Medical Biobank, the referent allele, MTCH2 Pro290, has an overall allele frequency of 0.714 in biobank participants without heart failure (dark blue, left) compared to 0.776 in a cardiomyopathy cohort (dark blue, right). Control N = 772, cardiomyopathy cohort N = 172, *P < 0.024, Chi Square Test.
Cardiac-specific reduction of Mtch reduces lifespan and alters cardiac dynamics in flies
In mice, global deletion of Mtch2 is embryonic lethal (9). To evaluate the role of MTCH2 in the heart, we generated cardiac-specific reduction of the MTCH2 ortholog, Mtch, in Drosophila melanogaster using RNAi-mediated knockdown. Cardiac specificity was achieved using a fly line expressing an anti-Mtch RNAi hairpin under the cardiac-exclusive promoter, tinC (23–25). Control flies were isogenic to Mtch knockdowns and expressed a non-targeting hairpin under the tinC promoter. Mtch-tinC flies had a 50% reduction in cardiac Mtch expression compared to controls, consistent with partial loss of function (Fig. 2A–C). We used optical coherence tomography to evaluate heart tube function and found that Mtch cardiac depletion produced marked dilated heart tubes with reduced cardiac function (Fig. 2D–F; Supplementary Material, Fig. S2A–C). Heart tube dysfunction developed in Mtch knockdowns as early as the first week of life and was maintained throughout adulthood (Supplementary Material, Fig. S1A–C). Cardiac-specific reduction of Mtch significantly shortened lifespan compared to control flies (Fig. 2G). Overall, reducing Mtch expression in the fly heart adversely affected heart tube function and reduced overall longevity.
Figure 2.

Reduced lifespan and impaired heart function in Drosophila with cardiac Mtch knockdown. (A-C) In Mtch-tinC flies, Mtch expression was reduced in heart tubes (N = 7, ****P < 0.0001), but Mtch expression was unchanged in abdominal tissue after heart tube removal (N = 6, P > 0.05) and unchanged in whole heads of Mtch-tinC flies (N = 8, P > 0.05). Average ± SEM, black dots represent group of 20 flies. Gene expression values were normalized to αTub84B. (D-E) FS was reduced in the heart tube of Mtch-tinC flies assessed by optical coherency tomography (****P < 0.0001, black dots represent each individual fly, N = 29). The right panel shows end-diastolic diameter and end-systolic diameter of heart tubes EDD (****P < 0.0001), ESD (****P < 0.0001, N = 29, black dots represent each individual fly). (F) Cardiac imaging of 3-week-old flies for a 3 s duration using optical coherence tomography. Panels reveal degree of contraction of the heart tube. Top panel is imaging from control fly, bottom panel shows a Mtch-tinC fly with reduced function as evidenced by the lack of contraction. (G) Kaplan–Meier curve showing Mtch-tinC flies had reduced longevity (N = 120, ****P < 0.0001, Kaplan–Meir estimate). Unless stated otherwise, all comparisons were made using a two-tailed student’s t-test. All experiments used equal numbers of 3-week-old males and females. Dark gray = Mtch-tinC; light gray = control.
Depletion of cardiac Mtch in flies alters substrate stores
To assess energy storage in cardiac Mtch knockdowns, we measured adiposity in Mtch knockdown larvae using a buoyancy test (26). Cardiac Mtch knockdowns had reduced abdominal triglyceride content and were significantly less buoyant than controls, indicating less overall adiposity and fat content (Supplementary Material, Fig. S2; Fig. 3A). These findings align with GWAS identifying lower MTCH2 expression associated with reduced adiposity in humans. Food consumption was similar in Mtch knockdown and control flies, suggesting intake was not responsible for reduced adiposity (Fig. 3B). There was excess glycogen content in the heart tube-containing abdomen of 3-week-old adult mutant flies compared to controls (Fig. 3C) with no change in circulating glucose relative to controls (Fig. 3D). The reduced body fat content and greater abdominal glycogen storage in cardiac Mtch knockdowns suggested the predominantly carbohydrate-rich diet normally fed to flies was shifted more towards glycolysis and less from oxidative phosphorylation (27).
Figure 5.

Cardiac Mtch knockdown in Drosophila obstructed glucose oxidation and energy production. (A) Whole-body basal OCR was reduced in cardiac Mtch-knockdowns given glucose but not palmitate (average ± SEM, N = 20, each black dot represents 20 flies, **P = 0.0060). (B) Mtch-tinC flies had reduced energy generation, measured by the ratio of normalized ATP:ADP metabolite counts (N = 6 groups, each black dot is 30 flies, *P = 0.0158). (C) Metabolite flux profiling traced the fate of consumed 13C M + 6 labeled glucose. (D) Glucose had a greater fate to lactate production in Mtch-tinC flies, assessed from ratio of normalized labeled lactate:pyruvate metabolite counts (average ± SEM, N = 6, each black dot represents 30 flies, *P = 0.0242) (green arrow in C). (E) Amount of pyruvate shuttled to the citric acid cycle was lower in Mtch-tinC flies (N = 3, each black dot represents 30 flies, P = 0.0671) (blue dashed arrow in C). (F) Measurement of total normalized citric acid cycle metabolites was unchanged in Mtch-tinC flies (N = 6, each black dot represents 30 flies, citrate (P = 0.3382), αKG (P = 0.4033), succinate (P = 0.0747), fumarate (P = 0.6119), malate (P = 0.6292) (G) Expression of genes encoding the citric acid cycle enzymes showed selective reduction of ScsbetaA (*P = 0.0229) and Fum1 (*P = 0.0368) (N = 6, each black dot represents 20 flies). (H) Expression of genes implicated in fatty acid metabolism showed selective reduction of ATPCL (*P = 0.0115), ACC (*P = 0.0320), SREBP (**P = 0.0060) and FASN1 (****P < 0.0001) (N = 6, each group represents 20 flies). Gene expression values are normalized to αTub84B. All comparisons were made using a two-tailed student’s t-test. Unless stated otherwise, all experiments used equal numbers of 3-week-old males and females. Purple = Mtch-tinC; gray = control.
Figure 3.

Cardiac Mtch Drosophila mutants had reduced adiposity and increased glycogen content. (A) Mtch-tinC larvae had reduced adiposity based on buoyancy of third instar larvae (average ± SEM, N = 6, each black dot represents 10 flies, ****P < 0.0001). (B) Food consumption over a 24 h period was unchanged in 3-week-old Mtch-tinC flies (N = 8, each black dot represents 20 flies, P > 0.05). (C) Glycogen content was greater in the heart-containing abdomen of Mtch-tinC flies (N = 120, *P = 0.0491). (D) Circulating glucose levels were unchanged in the hemolymph of Mtch-tinC flies (N = 8, each black dot is 60 flies, P > 0.05). All comparisons were made using a two-tailed Student’s t-test. Unless stated otherwise, all experiments used equal numbers of 3-week-old males and females. Dark gray = Mtch-tinC; light gray = control.
Cardiac Mtch dysfunction increases glycolytic lactate accumulation in flies
At baseline, cardiac Mtch knockdowns had significantly higher circulating lactate levels than control flies, consistent with the shift towards glycolysis with Mtch reduction (Fig. 4A). Cardiac Mtch knockdowns also had an increased ratio of lactate to pyruvate, consistent with greater conversion of pyruvate to lactate (Fig. 4B). These findings were corroborated with whole-body proton production rate (PPR), another indicator of glycolytic output, in the presence of 10 mm glucose in which cardiac Mtch knockdowns had higher whole-body PPR (Fig. 4C). Although lactate was increased in Mtch knockdowns, expression of lactate dehydrogenase mRNA itself was unchanged in these flies (Fig. 4D). The lactate accumulation seen in Mtch reduction suggested glycolysis as a major source of ATP, rather than the normal use of oxidative phosphorylation.
Figure 6.

Chemical inhibition of PDK in Drosophila Mtch knockdowns improved lifespan and elevated lactate levels. (A) Longevity analysis of flies given PDK inhibitor (DCA) post-eclosion. PDK inhibition improved lifespan in Mtch-tinC flies (average ± SEM, N = 120, Mtch-tinC minus DCA vs Mtch-tinC given DCA, *P < 0.0001, Kaplan–Meier estimate). (B) Circulating lactate measured in flies given either glucose diet or glucose diet supplemented with PDK inhibitor (DCA, clear column). PDK inhibition lowered lactate levels in Mtch-tinC flies (N = 8, each black dot represents 60 flies, Control minus DCA vs Mtch-tinC minus DCA, ****P < 0.0001, Mtch-tinC minus DCA vs Control given DCA, **P = 0.0015, Control given DCA vs Mtch-tinC given DCA, ***P = 0.0002). (C) Measurement of whole-body basal OCR under glucose conditions given either glucose without PDK inhibitor or glucose supplemented with PDK inhibitor (DCA). PDK inhibition improved Mtch-tinC OCR (N = 20 wells of 20 flies, control DCA vs Mtch-tinC minus DCA, **P = 0.0060, Mtch-tinC minus DCA vs Mtch-tinC given DCA, *P = 0.0159. (D) Circulating lactate measured from hemolymph of flies given either glucose diet or glucose diet supplemented with PDH inhibitor (BOA) (N = 8 groups of 60 flies). PDH inhibition does not affect Mtch-tinC lactate levels. Control minus inhibitor vs Mtch-tinC minus inhibitor, ****P < 0.0001, Control minus BOA vs Control given BOA, *P = 0.0104, Mtch-tinC minus BOA vs Mtch-tinC given BOA, ***P = 0.0003 two-tailed Student’s t-test P value. Unless stated otherwise, all comparisons were made using a two-tailed Student’s t-test. All experiments used 3-week-old equal numbers of males and females. Purple = Mtch-tinC; gray = control.
Figure 4.
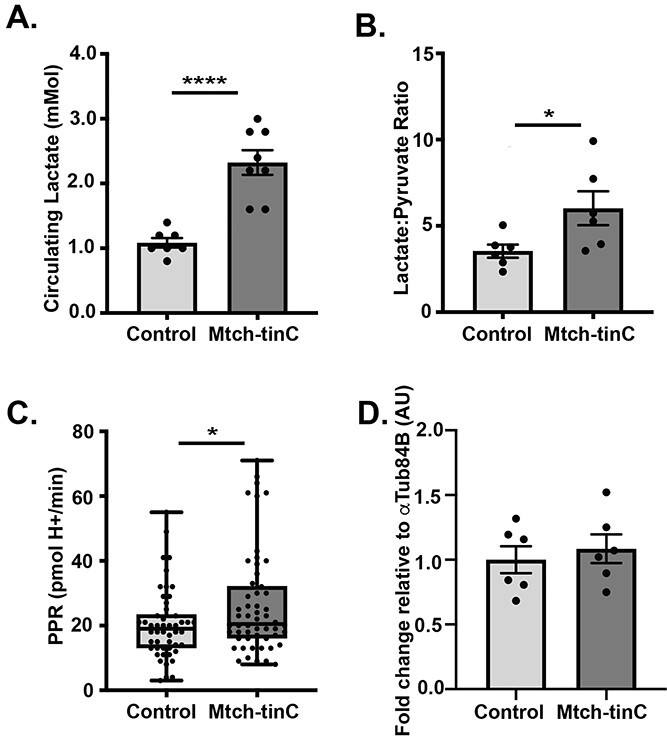
Increased lactate in cardiac Mtch knockdown Drosophila. (A) Circulating lactate was increased in the hemolymph of Mtch-tinC flies (average ± SEM, N = 8 groups, each dot is 60 flies, ****P < 0.0001). (B) Ratio of normalized lactate:pyruvate metabolite counts in the heart-containing abdomen was elevated in Mtch-tinC flies, measured by LCMS-based targeted metabolite profiling (N = 6, each black dot is 30 flies, ****P < 0.0001). (C) Whole-body PPR was increased in Mtch-tinC flies (N = 51, each black dot is 20 flies, *P = 0.0249). (D) Ldh expression was unchanged in heart-containing abdomen in Mtch-tinC flies (N = 6, each black dot is 20 flies, P > 0.05). The increase of lactate to pyruvate and PPR suggest increased glycolysis. Gene expression values are normalized to αTub84B. All comparisons were made using a two-tailed Student’s t-test. Unless stated otherwise, all experiments used equal numbers of 3-week-old males and females. Dark gray = Mtch-tinC; light gray = control.
Cardiac Mtch dysfunction lowers the rate of glucose oxidation and energy production in flies
We measured OCR in the presence of glucose or the fatty acid palmitate. Cardiac Mtch knockdowns had lower OCR in the presence of glucose, but not palmitate, demonstrating a substrate-specific impairment in OCR (Fig. 5A; Supplementary Material, Fig. S3). To determine whether this glucose-specific reduction in OCR associated with lower oxidative phosphorylation, we examined the ratio of ATP:ADP metabolites in the presence of 10 mm glucose. Using targeted metabolomics, we found that cardiac Mtch knockdowns also had a reduction in ATP:ADP in the presence of glucose (Fig. 5B), suggesting compromised energy production when glucose is the substrate. We exposed flies to 13C M + 6 labeled glucose (each of the six carbons in glucose is a 13C isotope instead of 12C) to trace the flux of glucose molecules through glycolysis and pyruvate oxidation to identify the disruption in glucose oxidation (Supplementary Material, Fig. S4A; Fig. 5C). The ratio of M + 3 labeled lactate to M + 2 labeled citrate can be used to infer the relative amount of 13C M + 6 labeled glucose contributing to glycolysis versus oxidation through the tricarboxylic acid (TCA) cycle. This ratio was higher in Mtch knockdowns relative to controls, demonstrating glucose in Mtch knockdowns was shifted towards being metabolized via glycolysis rather than oxidized to fuel the TCA cycle (Fig. 5D). Furthermore, the amount of M + 2 labeled citrate (citrate derived from 13C M + 6 labeled glucose metabolism) generated from M + 3 labeled pyruvate (pyruvate derived from 13C M + 6 labeled glucose metabolism) was lower in Mtch knockdowns compared to controls, indicating that the entry of glucose derivatives into the TCA cycle was partially blocked in Mtch knockdowns (Fig. 5E). The rate of glycolysis was unchanged in Mtch knockdowns, and the amount of glycolytic intermediates diverted to the pentose phosphate pathway (PPP) was negligible, suggesting that the disruption in glucose metabolism was in glycolysis and PPP metabolism (Supplementary Material, Fig. S4A–C). When examining percent composition of labeled TCA species, there were no significant differences in labeled TCA metabolite ratios nor in the ratio of M + 2:M + 4 citrate (citrate derived from 13C M + 6 labeled glucose metabolism where M + 2 citrate is representative of citrate metabolism in the first turn of the TCA cycle, and M + 4 citrate is representative of M + 2 citrate being further metabolized in a subsequent turn of the TCA cycle), suggesting that the efficiency of the TCA cycle itself was unchanged in Mtch knockdowns (Supplementary Material, Fig. S4D). Interestingly, the assessment of pooled labeled and unlabeled metabolites showed that total levels of TCA metabolites were unchanged between Mtch knockdowns and controls (Fig. 5F).
Figure 7.
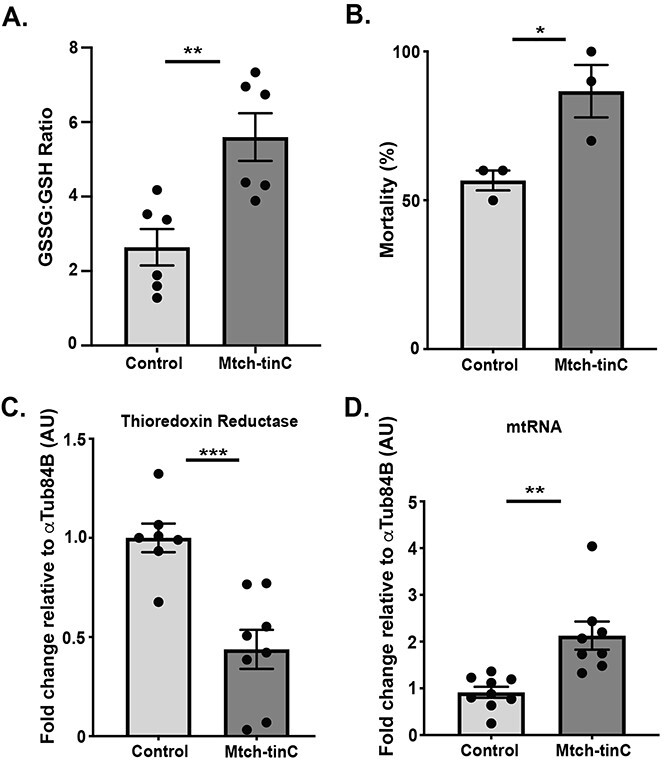
Mitochondrial dysfunction in cardiac Mtch knockdown Drosophila. (A) Ratio of oxidized glutathione: reduced glutathione was elevated in the heart-containing abdomen of Mtch-tinC flies measured by LCMS-based targeted metabolite profiling (average ± SEM, N = 6, each black dot represents 30 flies, **P = 0.0043). (B) Mtch-tinC flies were more susceptible to death after 24 h exposure to paraquat, a ROS-inducing toxin (N = 6, each black dot represents 30 flies, *P = 0.0335). (C) Gene expression of mitochondrial thioredoxin reductase (Trxr-2) was lower in Mtch-tinC flies (N = 6, each black dot represents 20 flies, ***P = 0.0006). Gene expression values are normalized to αTub84B. (D) Mtch-tinC flies had greater expression of mitochondrial-specific mRNA relative to nuclear-specific mRNA in the presence of glucose (N = 8, each black dot represents 20 flies, **P = 0.0014). Unless stated otherwise, all comparisons were made using a two-tailed Student’s t-test. All experiments used equal numbers of 3-week-old males and females. Dark gray = Mtch-tinC; light gray = control.
The mRNA expression of most TCA enzymes was unchanged in cardiac Mtch knockdowns in the presence of glucose with the exception that ScsbetaA (succinate-CoA-ligase) and Fum1 (fumarase) were reduced (Fig. 5G). The reduction in glucose-derived citrate in the TCA cycle in the face of unchanged total TCA metabolite levels suggests that other metabolic pathways may be compensating to fuel the TCA cycle in cardiac Mtch knockdowns. In support of compensation, we found an upregulation of ATPCL, ACC, SREBP and FASN1, key genes involved in fatty acid synthesis, in cardiac Mtch knockdowns compared to controls (Fig. 5H). This upregulation may help maintain the TCA cycle and oxygen consumption in the presence of palmitate. However, this upregulation is in adequate since longevity was compromised in cardiac Mtch knockdown flies (Fig. 2G). These findings point to pyruvate oxidation, and therefore acetyl-CoA entry into the TCA cycle, as a potential dysregulated step in glucose metabolism in cardiac Mtch knockdowns.
Enhanced PDH activity through inhibition of PDK offsets Mtch reduction
PDK inhibits PDH, preventing pyruvate to acetyl-CoA conversion, and resulting in more lactic acid production. mRNA expression of Pdha (pyruvate dehydrogenase A), PdhB (pyruvate dehydrogenase B), Pdk (pyruvate dehydrogenase kinase) and Pdp (pyruvate dehydrogenase phosphatase) was unchanged in Mtch knockdown heart-containing abdomens (Supplementary Material, Fig. S5). We investigated whether PDK inhibition could alleviate the block in glucose oxidation observed in cardiac Mtch knockdowns by treating flies the first day of pupal eclosion with 20 μg/ml dichloroacetic acid (DCA), a chemical inhibitor of PDK and known activator of PDH. DCA treatment rescued survival of cardiac Mtch knockdowns (Fig. 6A). Additionally, DCA treatment restored glucose oxidation in Mtch knockdowns, as demonstrated by a reduction in circulating lactate levels and increase in OCR in the presence of glucose (Fig. 6B and C). As a positive control, flies were treated for 3 days with 6,8-bis(benzylthio)octanoic acid (BOA), a small molecule inhibitor of PDH. BOA treatment increased circulating lactate levels in control flies to the level observed in untreated Mtch knockdowns, and at the same time, BOA treatment did not alter lactate levels in cardiac Mtch knockdowns (Fig. 6D). These findings are consistent with Mtch knockdowns having a high basal level of inhibited PDH, resulting in excess lactate production.
Mitochondrial dysfunction in cardiac Mtch knockdowns
To determine if mitochondrial function was compromised in cardiac Mtch knockdowns, we employed targeted metabolomics to measure the ratio of oxidized glutathione (GSSG) to reduced glutathione (GSH), a common indicator of oxidative stress. GSSG:GSH was significantly elevated in cardiac Mtch knockdowns, indicating that Mtch knockdowns have higher levels of reactive oxygen species (ROS) (Fig. 7A). To determine if Mtch knockdowns were tolerant to exogenous oxidative stress, we treated flies for 24 h with 150 nM paraquat, a ROS-inducing toxin, finding that cardiac Mtch knockdowns experienced a greater mortality rate and therefore greater susceptibility to exogenous ROS than control flies (Fig. 7B). We examined expression of Trxr-2, which encodes a ROS-neutralizing enzyme. Trxr-2 expression was reduced in Mtch knockdown heart-containing abdomens (Fig. 7C). However, when we assessed gene expression of other ROS-neutralizing enzymes, catalase and SOD2, no change was observed in Mtch knockdowns (Supplementary Material, Fig. S6A and B). We found the mitochondrial genome-encoded expression of the ND2 transcript increased relative to the nuclear genome-encoded αTub84B transcript in cardiac Mtch knockdowns with unchanged PGC1α expression (Fig. 7D; Supplementary Material, Fig. S6C). We interpret this relative increase in mitochondrial transcriptional expression to reflect enhanced but inadequate mitochondrial biogenesis since OCR and ATP production were impaired in the presence of glucose (Fig. 5A and B). Gene expression of known regulators of mitochondrial fission and fusion were not altered in cardiac Mtch knockdowns (Supplementary Material, Fig. S7A), and mitochondrial cristae were intact in Drosophila cardiac Mtch knockdown heart tubes (Supplementary Material, Fig. S7B).
Deletion of MTCH2 in human cells reduces OCR and PDH activity
To investigate the role of MTCH2 in human cells, we mutated exon 1 of MTCH2 in HEK cells using gene editing, resulting in a homozygous frameshift deletion. MTCH2−/− cells expressed no detectable MTCH2 protein and reduction of the MTCH2 transcript (Fig. 8A–C). Similar to cardiac Mtch knockdown flies, MTCH2−/− cells supplemented with 50 mm glucose had a greater basal PPR. Additionally, MTCH2−/− cells had reduced OCR in the presence of glucose, but not palmitate, demonstrating the same substrate-dependent impairment seen in cardiac Mtch knockdown flies (Fig. 8D–E). OCR was impaired under high glucose (50 mm) conditions, and no difference was seen under 10 mm glucose, suggesting that MTCH2−/− cells are susceptible to high glucose conditions (Supplementary Material, Fig. S8). To evaluate mitochondrial membrane potential, we stained control and MTCH2−/− HEK cells with MitoTrackerTM Green, a mitochondrial marker, and tetramethylrhodamine, methyl ester (TMRM), a marker of mitochondrial membrane potential that sequesters in active and functional mitochondria (Supplementary Material, Fig. S9). We found that MTCH2−/− cells had lost TMRM signal, indicating loss of mitochondrial membrane potential and dysfunctional mitochondria.
Figure 8.

Deletion of MTCH2 in HEK293 cells reduced OCR and pyruvate dehydrogenase activity. (A) Immunoblot of MTCH2 protein in control (unedited) and MTCH2−/− cells (MTCH2 KO), relative to mitochondrial cytochrome C. (B) Quantification of immunoblot band density relative to mitochondrial cytochrome C protein (average ± SEM, N = 6 wells of cultured cells, ****P < 0.0001). (C) MTCH2 mRNA was reduced in MTCH2−/− cells compared to control (N = 4, ****P < 0.0001). (D) Basal PPR of cells supplemented with 50 mm glucose (N = 23 wells, **P = 0.0018). (E) Basal OCR of control and MTCH2−/− cells supplemented with 50 mm glucose or 1 mm palmitate, normalized to cell count (N = 18 wells, ****P < 0.0001). (F) Basal OCR in the presence of 50 mm glucose media supplemented with 100 μm DCA PDK inhibitor, normalized to cell count (N = 18 wells Control minus DCA vs MTCH2 KO minus DCA, ****P < 0.0001; Control minus DCA vs Control plus DCA, ****P < 0.0001; Control minus DCA vs MTCH2 KO plus DCA, ****P < 0.0001; MTCH2 KO minus DCA vs MTCH2 KO plus DCA, ****P < 0.0001). (G) mtDNA in control vs MTCH2−/− cells (N = 6 wells, **P = 0.0097). (H) Pyruvate dehydrogenase activity in mitochondria isolated from control and MTCH2−/− cells, normalized to mitochondrial count (N = 14 wells, ****P < 0.0001).
Supplementation of MTCH2−/− cells with 50 mm glucose and DCA was sufficient to increase OCR in MTCH2−/− cells, confirming that PDH activation can override MTCH2−/− deficiency (Fig. 8F). We found increased mitochondrial DNA relative to nuclear DNA (nDNA) in MTCH2−/− cells (Fig. 8G), despite no change in OCR and ATP production in the presence of glucose, as would be expected with increased mitochondria (Fig. 8E). These data suggest MTCH2−/− cells undergo a compensatory but inadequate mitochondrial biogenesis. Interestingly, the expression of PDK1 and PDK4 were increased in MTCH2−/− cells compared to control cells (Supplementary Material, Fig. S10A–C). PDH activity was reduced in mitochondria of MTCH2−/− cells, but not in whole cell lysates, suggesting that the reduction of PDH activity in MTCH2−/− cells is mitochondria-specific (Fig. 8H; Supplementary Material, Fig. S10D). These findings demonstrate that inhibition of PDK alleviates MTCH2 knockdown and knockout phenotypes in both fly hearts and human cells.
Discussion
MTCH2 variation and metabolic outcomes in humans
GWAS identified MTCH2 SNPs asscoiated with expression, obesity and lean body mass (2–4). In humans, mice, worms, fish and flies, there is a consistent relationship that upregulation of MTCH2 associates with obesity while MTCH2 downregulation is associated more with lean body mass (2,10,12,28). Although lean body mass is beneficial for most cardiovascular traits, the substrate dependence in heart failure may represent an exception. In cardiomyopathy patients, we found overrepresentation of a SNP and haplotype linked to lower MTCH2 expression. This type of inheritance, with a risk-allele with high population frequency is plausibly explained by antagonistic pleiotropy, wherein a risk allele for one condition may be protective in another (29). Antagonistic pleiotropy is well described in traits associated with protection from infections like sickle cell, malaria, APOL1 and trypanosoma infection (30,31). In these examples, genetic variation that protects against infection creates risk for other disorders like anemia or chronic kidney disease. In the case of MTCH2 variation, genetic alleles that protect against high fat diet-induced obesity may be disadvantageous for a failing myocardium since the failing heart is more reliant on glucose as a fuel source.
The relationship between MTCH2 level and metabolism is consistent and conserved across diverse species. In experimental models, excess lactate appears as a molecular signature of reduced MTCH2 activity. Elevated lactate was seen in mice lacking Mtch2 in heart and skeletal muscle (10) and is also seen in cardiac Mtch knockdown flies, which only lack Mtch in the fly heart tube. Reduction of Mtch in the fly heart tube was sufficient to cause increased lactate, but it should be noted that the fly heart tube contributes significantly to the overall mass of the organism since this structure extends into the abdomen. We also observed reduced adiposity in Drosophila with cardiac Mtch knockdown, which parallels the resistance to high fat diet in the Mtch2 heart/skeletal mouse mutant and is also similar to C. elegans with mtch-1 reduction (12). The human MTCH2 haplotype linked to lower expression tags its expression in skeletal muscle supporting that skeletal muscle may be an important source for mediating this effect. Additionally, the protein coding SNP Pro290Ala, which is in LD, may itself also contribute to reduced function. Protein modeling revealed subtle differences between the Pro290 and Ala290 alleles in the C-terminal final transmembrane, and this change could also contribute to impaired MTCH2 protein function.
Loss of MTCH2 increases lactate and reduces mitochondrial PDH activity
Cardiac Mtch knockdown flies and MTCH2−/− cells both displayed increased lactate. We found that chemical inhibition of PDK with DCA, a PDH inhibitor, reduced lactate levels in MTCH2 mutants, and in flies with cardiac Mtch knockdown, lactate reduction was sufficient to extend lifespan. In human heart failure, DCA treatment was shown to improve myocardial lactate consumption with concomitant improvement in mechanical work of the left ventricle (32), but DCA treatment may not exert its effect by improving non-invasive measures of heart function (33). In rodents, DCA treatment can be used to prevent heart failure outcomes through its action on PDK and also through epigenetic remodeling (34,35). Regulation of PDH through PDK is critical in tissues with high energy demand, such as the heart (36). PDH converts pyruvate to acetyl coenzyme A (CoA) in the mitochondria, and PDH activity is inhibited by phosphorylation via PDK. PDH activity is known to be reduced in heart failure, and deletion of mitochondrial pyruvate carriers in the heart worsens heart failure phenotypes (20,36–38). A block of pyruvate oxidation could itself account for the increase in lactate seen in MTCH2 mutants. Alternatively, agents that inhibit PDK activity may simply be working indirectly to overcome mitochondrial defects arising from loss of MTCH2. Loss of MTCH2 increased mtDNA content, but increased mtDNA did not reflect enhanced mitochondrial biogenesis and function but is more consistent with an ineffective compensatory mechanism, which is further supported by reduced mitochondrial membrane potential in the absence of MTCH2. Recent work showed that deletion of MTCH2 produced hyperfragmented mitochondria, consistent with MTCH2 having a key role in maintaining normal mitochondria structure and function (39). All of these mechanisms, excess lactate itself, reduced pyruvate oxidation or other mitochondrial impairment would be maladaptive in the setting of heart failure.
Collectively, these data support the human GWAS demonstrating a link between MTCH2 and adiposity. Under high fat conditions, reduced MTCH2 promotes lean body mass and be protective from obesity. Intriguingly, MTCH2 variants linked to increased BMI in adults associate with lower birth weight with each BMI-increasing MTCH2 allele associated with a 13 g decrease in birth weight (40). The conditions that support rapid fetal growth are similar to the failing heart with an increased dependence on glucose as a fuel source. The substrate dependence of MTCH2 levels is an important consideration when considering its related phenotypes.
Materials and Methods
Human subjects
Participants provided informed consent under Northwestern University’s institutional review board (STU0010003). Cohort selection, whole genome sequencing (WGS) and variant frequency analysis were performed as described (19,41). The NUgene cohort (n = 772) included racially and ethnically diverse participants from the Northwestern University biobank. The Cardiomyopathy cohort included non-ischemic dilated or hypertrophic cardiomyopathy subjects with familial disease. Both cohorts underwent WGS. A bootstrap approach was used on a 172-sample subset of the cardiomyopathy cohort data using a random sampling with replacement as described previously (19). Allele counts were aggregated by variant, race, sex and cardiomyopathy subtype. Ancestral allele frequencies were obtained from gnomAD exome data. Expected allele numbers using ancestral gnomAD frequencies were calculated and subtracted from the observed alleles creating excess cumulative allele numbers for each gene tested. The set was resampled 5000 times to determine confidence intervals with sufficient precision. We focused on cumulative allele frequencies between 0.25 and 0.50. Calculations were performed using in-house R functions. Significance was assessed using a false discovery rate <0.1. Comparison of variant frequencies from the NUgene Biobank and the cardiomyopathy cohort was assessed using a Chi Square Test. Cis eQTL data were retrieved on 10/27/21 from the GTEx portal, which is supported by the Common fund of the Office of the Director of the National Institutes of Health and by NCI, NHGRI, NHLBI, NIDA, NIMH and NINDS. LD mapping data were retrieved using the free, publicly available NCI tool, LDlink and plotted using custom in-house formatting (42).
Fly husbandry
Fly stocks were obtained from Indiana University’s Bloomington Drosophila Stock Center (Supplementary Material, Table S3). Fly lines were established using the GAL4/UAS system, and controls were determined using strategies outlined in Refs 43–45. The tinC-GAL4 transgenic fly line was crossed to a line expressing an Mtch RNAi hairpin under a GAL4-binding UAS, or, as an isogenic control, to a line expressing a non-targeting hairpin under the same UAS (Bloomington Drosophila Stock Center). Flies were maintained on 12 h light/dark cycles, at 50% humidity, and fed a Jazz-Mix (Fisherbrand) diet at 25°C. Separation and collection of all flies were conducted by brief anesthetization with CO2. All experiments were performed on 3-week-old flies, unless otherwise noted, using equal numbers of male and female flies. All lines used are shown in Supplementary Material, Table S1.
Materials
The sources for all key materials are listed in Supplementary Material, Table S2.
Gene expression in flies
RNA was isolated from snap-frozen heart tubes, abdomens and whole heads from 3-week-old male (N = 10) and female flies (N = 10) using TRIzol™ Reagent (ThermoFisher Scientific). cDNA was synthesized from isolated RNA using qScript cDNA SuperMix (QuantaBio) and relative fluorescence was captured using iTaq Universal SYBR Green Supermix (BIO-RAD) and measured with CFX96 Touch Deep Well Real-Time PCR System (BIO-RAD). Expression of all genes was analyzed relative to αTub84B using a Student’s t-test of the average ± SEM. All primers used are shown in Supplementary Table S3.
Optical coherence tomography
Adult heart contractility was analyzed using a Thorlabs Telesto II OCT system (Thorlabs, Inc.) and methods previously described (23,46). Male and female files were collected 3–5 days after eclosion, briefly anesthetized with CO2, and embedded in a soft gel support, and allowed to fully awaken based on body movement. Animals were first imaged in B-mode in the longitudinal orientation to identify the A1 segment of the heart chamber. They were then imaged transversely in M-mode for 3 s, and multiple M-modes were recorded for each fly. Animals were then re-imaged in B-mode to ensure proper orientation of the heart chamber. M-modes were processed in ImageJ by referencing to a 150 μm standard. End-diastolic dimension (EDD), end-systolic dimension (ESD) and heart rate were calculated directly from the processed M-mode traces using three consecutive heart beats. Percent fractional shortening (FS) was calculated as (EDD–ESD)/EDD × 100. Performing and analyzing the OCT experiments were conducted by persons blinded to the animal group genotype assignments.
Each fly was imaged in the longitudinal long axis to identify the anterior conical chamber and then the imaging plane was turned 90° to obtain the short axis image. Then, M-modes are obtained. The live camera of the OCT system is used to confirm the A1 segment, and OCT imaging uses multiple planes to assure the positioning of the anterior conical chamber. Large numbers of individual flies per group are imaged to account for any variability.
Longevity analysis
Equal numbers of male (N = 60) and female (N = 60) flies were collected on the day of pupal eclosion and divided into groups of 20 per vial and placed on JazzMix food. Dead flies were counted in each vial daily to mark survival, and food was changed every third day. This was repeated until all flies were dead. Statistical analysis was conducted using Kaplan–Meier test of the average ± SEM.
Measuring circulating lactate and glucose
Circulating lactate and glucose were both measured from whole-fly hemolymph extraction at 3 weeks of age. Hemolymph was isolated by decapitation methods and centrifugation-based filtering (47). Single data points were generated from a cohort consisting of equal numbers of male (N = 30) and female (N = 30) flies. Lactate was measured from isolated hemolymph using Lactate Plus Meter Test Strips (Nova Biomedical). Circulating glucose in the hemolymph was measured using the Glucose (GO) Assay Kit (Millipore Sigma), and absorbance was measured at 540 nm using the Synergy™ HTX Multi-detection Microplate Reader (BioTek; BTS1LF), to detect the proportion of hemolymph glucose.
Glycogen measurement
Total glycogen content was measured in whole abdominal segments of equal numbers of male (N = 60) and female (N = 60) flies at 3 weeks of age. Single data points were generated from a cohort consisting of 40 flies each. Glycogen was assessed using the Colormetric Glycogen Assay Kit (Abcam), and sample glycogen was measured at OD 570 nm using the Synergy™ HTX Multi-detection Microplate Reader (BioTek; BTS1LF) and compared to the standard curve generated from serial dilutions of the Glycogen Standard (Abcam).
Triglyceride quantification in flies
Triglycerides were quantified in dissected abdomens of Drosophila using equal numbers of male (N = 10) and female (N = 10) flies at 3 weeks of age. Single data points were generated from a cohort consisting of 20 flies each. Triglycerides were assessed via colorimetric quantification using Infinity™ Triglycerides Liquid Stable Reagent and compared to a standard curve. Absorbance was measured at 500 nm using the Synergy™ HTX Multi-detection Microplate Reader (BioTek; BTS1LF) to calculate triglyceride content and values were normalized to body weight.
Adiposity assessment
Adiposity was assessed by submerging PBS-rinsed third instar larvae into a PBS-based 20% sucrose solution (Millipore Sigma). Single data points were generated from a cohort of N = 10 larvae. Percent of larvae floating were recorded as a reflection of buoyancy to evaluate adiposity (26,48).
Measurement of food consumption
Food intake was assessed over a 24-h period in 3-week-old cohorts of male (N = 10) and female (N = 10) flies. To measure food intake, 3 mm sucrose (Millipore Sigma) was administered into a 5 μL glass capillary that was fed into vials with fly cohorts placed on 2% agar, and the amount consumed from the capillary was measured after 24 h according to the capillary feeding assay as previously described (49).
Measurement of OCR and PPR in flies
Seahorse (Agilent) experiments were modeled after similar fly-based experiments (50,51). OCR and PPR were measured using a Seahorse XFe96 Analyzer (Agilent). The day prior to all experiments, Agilent Seahorse XFe96 cartridge was hydrated with 200 μL of calibrant solution overnight at 37°C. All experiments were conducted on decapitated flies to permit substrate permeation into fly tissues, bypassing the hydrophobic fly cuticle (Supplementary Material, Fig. S3A and B). Plates containing internally-exposed fly carcasses were briefly centrifuged such that fly carcasses were fully submerged in solution. Tissue culture plates were incubated with nutrient-supplemented media at 37°C for 24 h. Experiments were simultaneously conducted at 25°C to ensure phenotypes were not temperature-specific (Supplementary Material, Fig. S3C and D). Nutrient-supplemented media contained either a final concentration of 10 mm glucose or 1 mm BSA-palmitate. All plates contained wells with nutrient-supplement media but lacking fly carcasses to account for background correction. Examination of PPR was assessed in the presence of 10 mm glucose. Each well contained equal numbers of 3-week-old male (N = 10) and female (N = 10) flies. Each data point consisted of the average of three basal OCR measurements or PPR measurements of the same well to generate the overall OCR or PPR for that well.
Metabolomic analysis and flux analysis
Metabolite abundance was assessed in whole abdominal segments via targeted metabolomics. Abdomens of 20 males and 20 females were snap frozen for hydrophilic metabolome isolation. Samples were homogenized via ultra-sonification (Branson Sonifier 250) in 80% methanol using HPLC grade water (Millipore Sigma). Supernatant of homogenized samples were then dried with a speed vacuum (Thermo Scientific Savant SpeedVac DNA130), and remaining metabolome-containing pellet was submitted to mass spectrometry analysis. Metabolomics services were performed by the Metabolomics Core Facility at Robert H. Lurie Comprehensive Cancer Center of Northwestern University. All results were normalized to sample dry mass and total iron content. Flux analysis was conducted by starving 3-week-old flies for 4 h on 2% agar, and feeding 10% 13C6 (Millipore Sigma) for 4 h to label TCA intermediates, or 15 min to label glycolytic intermediates. Abdomens of 20 males and 20 females were promptly dissected after labeled carbon feeding, and snap frozen for hydrophilic metabolome isolation, conducted identically as described above.
Drosophila drug treatments
Flies were collected from pupal eclosion and placed on Jazz-Mix™ food supplemented with 20 μg/ml DCA (Millipore Sigma). Flies were put on fresh food with DCA every 3 days. Longevity was measured as described above. To assess the effects of PDK and PDH inhibition on circulating lactate levels, DCA and BOA were administered to 3-week-old flies in Jazz-Mix™ food at a final concentration of either 20 μg/ml for DCA or 5 mm for BOA for 3 days prior to experimental analysis. Lactate was assessed in these flies via decapitation methods as described above. To measure the change in OCR in flies in the presence of DCA, DCA was administered at 200 μg/ml in Jazz-Mix™ food to 3-week-old flies for 3 days prior to experimental analysis. Flies were then decapitated and placed into wells with equal numbers of males (N = 10) and females (N = 10). OCR was assessed with a final concentration of 10 mm glucose supplemented to each well. Measurements were taken identically as described in the OCR measurement above. methyl viologen dichloride hydrate (Paraquat) (Millipore Sigma) of 150 nM was provided on a 25 mm Whatman® filter paper (Millipore Sigma) soaked in 10 mm glucose, and flies were exposed overnight in vials containing nothing but the soaked filter paper. Number of dead flies were counted 24 h later to calculate a mortality rate for each cohort.
Cell lines and culturing
HEK293 cells were cultured in Dulbecco’s Modified Eagle’s Medium (ThermoFisher Scientific) with 10% fetal bovine serum and 1% penicillin/streptomycin (ThermoFisher Scientific). All cells were maintained at 37°C with 5% CO2 in a humidified incubator.
Clustered regularly interspaced short palindromic repeats-mediated MTCH2 knockouts
gRNA 3'-CTTTCACGTACATGAGCGGC-5′ targeting exon 1 of MTCH2 was cloned into the Cas9-expressing pSpCas9(BB)-2A-Puro (PX459) V2.0 (Addgene) vector by Blue Heron Biotech, LLC (Bothell, WA, USA). HEK293 were transfected with 1 μg of this custom vector, or an empty Cas9 vector lacking a gRNA sequence for controls, using FuGENE® HD Transfection Reagent (Promega). Transfected cells were allowed 24 h of recovery before undergoing 3-day selection with 1, 2.5 and 4 μg/ml puromycin. Single cell colonies were isolated following puromycin selection and sequenced at 50 000 reads using Amplicon-EZ (GENEWIZ) to confirm MTCH2 deletion.
Gene expression in human cells
RNA was isolated from snap-frozen control and knockout cells using TRIzol™ Reagent (ThermoFisher Scientific). cDNA libraries were synthesized from isolated RNA using qScript cDNA SuperMix (QuantaBio), and relative fluorescence was captured using iTaq Universal SYBR Green Supermix (BIO-RAD) and measured with CFX96 Touch Deep Well Real-Time PCR System (BIO-RAD). Expression of all genes was analyzed relative to RNA18S5 (18s rRNA). Statistical differences between populations were assessed using a Student’s t-test of the average ± SEM, unless otherwise noted and indicated based on data distribution.
Protein preparation and immunoblotting
Total protein was isolated from control and knockout cells using RIPA buffer supplemented with 8 M urea, and quantitated with the Pierce™ BCA Protein Assay kit (Thermo Fisher Scientific). Fifteen micrograms of lysate was incubated at RT with 4× Laemmli Sample Buffer (Bio-Rad) and 2-mercaptoethanol (Millipore-Sigma) for 20 min, and then separated on 4–15% Mini-Protean TGX Stain-Free Protein Gel (Bio-Rad). Separated proteins were transferred to Immobilon-P PVDF membrane and incubated with primary antibodies diluted at 1:1000 in StartingBlock T20 (TBS) Blocking buffer (ThermoFisher Scientific). Antibodies used included: anti-MTCH2 polyclonal antibody (Proteintech; Cat # 16888-1-AP) and cytochrome C monoclonal Antibody (ThermoFisher Scientific; Cat # 33-8500). Secondary antibodies were from Jackson ImmunoResearch and diluted 1:2500. All antibodies were diluted in StartingBlock T20 (TBS) Blocking buffer (ThermoFisher Scientific). Signals were detected with SuperSignal West Pico Plus chemiluminescent substrate (ThermoFisher Scientific) and imaged using Invitrogen IBright.
Analysis of OCR and PPR in human cells
OCR and PPR were measured using a Seahorse XFe96 Analyzer (Agilent). All experiments were conducted with a seeding density of 10 000 cells/well. Cells were allowed to incubate with nutrient-supplemented media at 37°C with 5% CO2 for 1 h. Nutrient-supplemented media in OCR experiments contained either a final concentration of 50 mm glucose or 1 mm BSA-palmitate. PPR media consisted of a final concentration of 50 mm glucose. All DCA experiments were conducted using media supplemented with 100 μm DCA and 50 mm glucose. Each data point represented a single well of cells, which consisted of the average of three basal OCR or PPR measurements of the same well to generate the overall OCR or PPR for that data point. All measurements were normalized to cell count.
Mitochondrial isolation and measurement of PDH activity
PDH activity was assessed in both whole cell lysate and isolated mitochondria from cultured HEK293 cells. To do so, we lifted confluent cells in a 10 cm plate and pelleted them via centrifugation. Cells were homogenized with a dounce-homogenizer and allowed to swell in the hypotonic buffer as described. Swollen cells were centrifuged with homogenization buffer to remove nuclei and cell membrane fragments from the homogenate to achieve a pellet containing isolated mitochondria. PDH activity was measured using the colorimetric Pyruvate dehydrogenase Activity Assay Kit (Millipore Sigma), and A450 of samples was recorded at baseline and in 5 min increments up to 3 h using Synergy™ HTX Multi-detection Microplate Reader (BioTek; BTS1LF) to record the change in A450 over time as a reflection of PDH activity. All measurements were normalized to mitochondrial count.
Quantification of mitochondrial DNA in human cells
To quantify mitochondrial DNA (mtDNA), total DNA (DNA) was isolated from HEK293 cells using the Gentra Puregene® DNA Purification Kit (QIAGEN) and treated with RNAse A solution to remove ambient RNA. DNA was hydrated with Invitrogen™ UltraPure™ DNase/RNase-Free Distilled Water (ThermoFisher Scientific) and quantified with the NanoDrop2000 Spectrophotometer (ThermoFisher Scientific). DNA was measured using quantitative PCR, where relative fluorescence was measured using iTaq Universal SYBR Green Supermix (BIO-RAD) in a CFX96 Touch Deep Well Real-Time PCR System (BIO-RAD). Primers were designed to capture the mitochondrial-encoded gene, mitochondrially encoded tRNA leucine 1 (MT-TL1) and nuclear-encoded gene, RNR5.
Mitochondrial imaging
MTCH2−/− and control (unedited) HEK293 were cultured with fresh Dulbecco’s Modified Eagle’s Medium (ThermoFisher Scientific) with 10% fetal bovine serum and 1% penicillin/streptomycin (ThermoFisher Scientific) containing 100 nM MitoTracker Green FM (ThermoFisher Scientific) to probe for mitochondria, regardless of mitochondrial membrane potential, and with 100 nM Image-iT TMRM Reagent (ThermoFisher Scientific), a probe that selectively sequesters in healthy mitochondrial with active membrane potential. Cells were allowed to incubate in this media with probes for 30 min at 37°C with 5% CO2 in a humidified incubator and imaged for fluorescence using a KEYENCE BZ-X810 fluorescence microscope.
Statistics
Longevity assessments were conducted with the Kaplan–Meier method, where individual data points were representative of the average of three different fly culture replicates. All other statistical differences between populations were assessed using a Student’s t-test of the average ± SEM.
Supplementary Material
Acknowledgements
We would like to thank the laboratories of Joseph Bass, MD PhD and Navdeep Chandel, PhD at Northwestern University, as well as the NUgene Project, the NUSeq Core Facility and Metabolomics Core Facility at Robert H. Lurie Comprehensive Cancer Center of Northwestern University.
This work used the Extreme Science and Engineering Discovery Environment (XSEDE), which is supported by National Science Foundation grant number ACI-1548562. Part of the computations were performed on Stampede2 at the Texas Advanced Computing Center through allocation MCB190117.
Conflict of Interest statement: None declared..
Contributor Information
Julie A Fischer, Center for Genetic Medicine, Northwestern University Feinberg School of Medicine, Chicago, IL, USA.
Tanner O Monroe, Center for Genetic Medicine, Northwestern University Feinberg School of Medicine, Chicago, IL, USA.
Lorenzo L Pesce, Center for Genetic Medicine, Northwestern University Feinberg School of Medicine, Chicago, IL, USA; Department of Pharmacology, Northwestern University Feinberg School of Medicine, Chicago, IL, USA.
Konrad T Sawicki, Center for Genetic Medicine, Northwestern University Feinberg School of Medicine, Chicago, IL, USA.
Mattia Quattrocelli, Center for Genetic Medicine, Northwestern University Feinberg School of Medicine, Chicago, IL, USA; Department of Pharmacology, Northwestern University Feinberg School of Medicine, Chicago, IL, USA; Molecular Cardiovascular Biology, Heart Institute, Cincinnati Children’s Hospital Medical Center, Cincinnati, OH, USA.
Rosemary Bauer, Center for Genetic Medicine, Northwestern University Feinberg School of Medicine, Chicago, IL, USA.
Samuel D Kearns, Center for Genetic Medicine, Northwestern University Feinberg School of Medicine, Chicago, IL, USA.
Matthew J Wolf, Department of Medicine, Cardiovascular Medicine, University of Virginia School of Medicine, Charlottesville, VA, USA.
Megan J Puckelwartz, Center for Genetic Medicine, Northwestern University Feinberg School of Medicine, Chicago, IL, USA; Department of Pharmacology, Northwestern University Feinberg School of Medicine, Chicago, IL, USA.
Elizabeth M McNally, Center for Genetic Medicine, Northwestern University Feinberg School of Medicine, Chicago, IL, USA.
Funding
American Heart Association Predoctoral Fellowship and Career Development Award (20PRE35210837, 189CDA34110460 and NIH RO1 HL128075).
Authorship Contribution Statement
E.M.M., M.J.P. and L.L.P. conceived the bootstrap search for modifiers. L.L.P. and S.D.K. performed computational and statistical analyses. M.J.W. conducted OCT imaging for analysis and J.A.F., R.B. and M.Q. conducted other experimental analyses. T.O.M. and K.T.S. provided expert opinion and experimental guidance. M.J.P. and E.M.M. supervised the project. J.A.F., M.J.P. and E.M.M. wrote the manuscript. All authors provided feedback and contributed to data analysis and editing of the manuscript.
References
- 1. Ruprecht, J.J. and Kunji, E.R.S. (2020) The SLC25 mitochondrial carrier family: structure and mechanism. Trends Biochem. Sci., 45, 244–258. [DOI] [PMC free article] [PubMed] [Google Scholar]
- 2. Willer, C.J., Speliotes, E.K., Loos, R.J., Li, S., Lindgren, C.M., Heid, I.M., Berndt, S.I., Elliott, A.L., Jackson, A.U., Lamina, C. et al. (2009) Six new loci associated with body mass index highlight a neuronal influence on body weight regulation. Nat. Genet., 41, 25–34. [DOI] [PMC free article] [PubMed] [Google Scholar]
- 3. Renström, F., Payne, F., Nordström, A., Brito, E.C., Rolandsson, O., Hallmans, G., Barroso, I., Nordström, P. and Franks, P.W. (2009) Replication and extension of genome-wide association study results for obesity in 4923 adults from northern Sweden. Hum. Mol. Genet., 18, 1489–1496. [DOI] [PMC free article] [PubMed] [Google Scholar]
- 4. Bauer, F., Elbers, C.C., Adan, R.A., Loos, R.J., Onland-Moret, N.C., Grobbee, D.E., van Vliet-Ostaptchouk, J.V., Wijmenga, C. and van der Schouw, Y.T. (2009) Obesity genes identified in genome-wide association studies are associated with adiposity measures and potentially with nutrient-specific food preference. Am. J. Clin. Nutr., 90, 951–959. [DOI] [PubMed] [Google Scholar]
- 5. Mei, H., Chen, W., Jiang, F., He, J., Srinivasan, S., Smith, E.N., Schork, N., Murray, S. and Berenson, G.S. (2012) Longitudinal replication studies of GWAS risk SNPs influencing body mass index over the course of childhood and adulthood. PLoS One, 7, 2–3. [DOI] [PMC free article] [PubMed] [Google Scholar]
- 6. Wang, J., Mei, H., Chen, W., Jiang, Y., Sun, W., Li, F., Fu, Q. and Jiang, F. (2012) Study of eight GWAS-identified common variants for association with obesity-related indices in Chinese children at puberty. Int. J. Obes., 36, 542–547. [DOI] [PubMed] [Google Scholar]
- 7. Sandholt, C.H., Vestmar, M.A., Bille, D.S., Borglykke, A., Almind, K., Hansen, L., Sandbaek, A., Lauritzen, T., Witte, D., Jorgensen, T. et al. (2011) Studies of metabolic phenotypic correlates of 15 obesity associated gene variants. PLoS One, 6, 3–6. [DOI] [PMC free article] [PubMed] [Google Scholar]
- 8. Kulyte, A., Ryden, M., Mejhert, N., Dungner, E., Sjolin, E., Arner, P. and Dahlman, I. (2011) MTCH2 in human white adipose tissue and obesity. J. Clin. Endocrinol. Metab., 96, E1661–E1665. [DOI] [PubMed] [Google Scholar]
- 9. Zaltsman, Y., Shachnai, L., Yivgi-Ohana, N., Schwarz, M., Maryanovich, M., Houtkooper, R.H., Vaz, F.M., De Leonardis, F., Fiermonte, G., Palmieri, F. et al. (2010) MTCH2/MIMP is a major facilitator of tBID recruitment to mitochondria. Nat. Cell Biol., 12, 553–562. [DOI] [PMC free article] [PubMed] [Google Scholar]
- 10. Buzaglo-Azriel, L., Kuperman, Y., Tsoory, M., Zaltsman, Y., Shachnai, L., Zaidman, S.L., Bassat, E., Michailovici, I., Sarver, A., Tzahor, E. et al. (2016) Loss of muscle MTCH2 increases whole-body energy utilization and protects from diet-induced obesity. Cell Rep., 14, 1602–1610. [DOI] [PubMed] [Google Scholar]
- 11. Bar-Lev, Y., Moshitch-Moshkovitz, S., Tsarfaty, G., Kaufman, D., Horev, J., Resau, J.H. and Tsarfaty, I. (2016) Mimp/Mtch2, an obesity susceptibility gene, induces alteration of fatty acid metabolism in transgenic mice. PLoS One, 11, 11–14. [DOI] [PMC free article] [PubMed] [Google Scholar]
- 12. Rottiers, V., Francisco, A., Platov, M., Zaltsman, Y., Ruggiero, A., Lee, S.S., Gross, A. and Libert, S. (2017) MTCH2 is a conserved regulator of lipid homeostasis. Obesity (Silver Spring), 25, 616–625. [DOI] [PubMed] [Google Scholar]
- 13. McKenna, W.J. and Judge, D.P. (2021) Epidemiology of the inherited cardiomyopathies. Nat. Rev. Cardiol., 18, 22–36. [DOI] [PubMed] [Google Scholar]
- 14. Lopaschuk, G.D., Ussher, J.R., Folmes, C.D., Jaswal, J.S. and Stanley, W.C. (2010) Myocardial fatty acid metabolism in health and disease. Physiol. Rev., 90, 207–258. [DOI] [PubMed] [Google Scholar]
- 15. Bertero, E. and Maack, C. (2018) Metabolic remodelling in heart failure. Nat. Rev. Cardiol., 15, 457–470. [DOI] [PubMed] [Google Scholar]
- 16. Ritterhoff, J. and Tian, R. (2017) Metabolism in cardiomyopathy: every substrate matters. Cardiovasc. Res., 113, 411–421. [DOI] [PMC free article] [PubMed] [Google Scholar]
- 17. Selvaraj, S., Kelly, D.P. and Margulies, K.B. (2020) Implications of altered ketone metabolism and therapeutic ketosis in heart failure. Circulation, 141, 1800–1812. [DOI] [PMC free article] [PubMed] [Google Scholar]
- 18. Turcot, V., Lu, Y., Highland, H.M., Schurmann, C., Justice, A.E., Fine, R.S., Bradfield, J.P., Esko, T., Giri, A., Graff, M. et al. (2018) Protein-altering variants associated with body mass index implicate pathways that control energy intake and expenditure in obesity. Nat. Genet., 50, 26–41. [DOI] [PMC free article] [PubMed] [Google Scholar]
- 19. Puckelwartz, M.J., Pesce, L.L., Dellefave-Castillo, L.M., Wheeler, M.T., Pottinger, T.D., Robinson, A.C., Kearns, S.D., Gacita, A.M., Schoppen, Z.J., Pan, W. et al. (2021) Genomic context differs between human dilated cardiomyopathy and hypertrophic cardiomyopathy. J. Am. Heart Assoc., 10, 3–8. [DOI] [PMC free article] [PubMed] [Google Scholar]
- 20. Fernandez-Caggiano, M., Kamynina, A., Francois, A.A., Prysyazhna, O., Eykyn, T.R., Krasemann, S., Crespo-Leiro, M.G., Vieites, M.G., Bianchi, K., Morales, V. et al. (2020) Mitochondrial pyruvate carrier abundance mediates pathological cardiac hypertrophy. Nat. Metab., 2, 1223–1231. [DOI] [PMC free article] [PubMed] [Google Scholar]
- 21. Sinnott-Armstrong, N., Tanigawa, Y., Amar, D., Mars, N., Benner, C., Aguirre, M., Venkataraman, G.R., Wainberg, M., Ollila, H.M., Kiiskinen, T. et al. (2021) Genetics of 35 blood and urine biomarkers in the UK Biobank. Nat. Genet., 53, 185–194. [DOI] [PMC free article] [PubMed] [Google Scholar]
- 22. Hindorff, L.A., Sethupathy, P., Junkins, H.A., Ramos, E.M., Mehta, J.P., Collins, F.S. and Manolio, T.A. (2009) Potential etiologic and functional implications of genome-wide association loci for human diseases and traits. Proc. Natl. Acad. Sci. U. S. A., 106, 9362–9367. [DOI] [PMC free article] [PubMed] [Google Scholar]
- 23. Wolf, M.J., Amrein, H., Izatt, J.A., Choma, M.A., Reedy, M.C. and Rockman, H.A. (2006) Drosophila as a model for the identification of genes causing adult human heart disease. Proc. Natl. Acad. Sci. U. S. A., 103, 1394–1399. [DOI] [PMC free article] [PubMed] [Google Scholar]
- 24. Zarndt, R., Walls, S.M., Ocorr, K. and Bodmer, R. (2017) Reduced cardiac calcineurin expression mimics long-term hypoxia-induced heart defects in drosophila. Circ. Cardiovasc. Genet., 10, 5–7. [DOI] [PMC free article] [PubMed] [Google Scholar]
- 25. Novak, S.M., Joardar, A., Gregorio, C.C. and Zarnescu, D.C. (2015) Regulation of heart rate in Drosophila via fragile x mental retardation protein. PLoS One, 10, 2–3. [DOI] [PMC free article] [PubMed] [Google Scholar]
- 26. Reis, T., Van Gilst, M.R. and Hariharan, I.K. (2010) A buoyancy-based screen of Drosophila larvae for fat-storage mutants reveals a role for Sir2 in coupling fat storage to nutrient availability. PLoS Genet., 6, 2–10. [DOI] [PMC free article] [PubMed] [Google Scholar]
- 27. Ormerod, K.G., LePine, O.K., Abbineni, P.S., Bridgeman, J.M., Coorssen, J.R., Mercier, A.J. and Tattersall, G.J. (2017) Drosophila development, physiology, behavior, and lifespan are influenced by altered dietary composition. Fly (Austin), 11, 153–170. [DOI] [PMC free article] [PubMed] [Google Scholar]
- 28. Landgraf, K., Strobach, A., Kiess, W. and Körner, A. (2016) Loss of mtch2 function impairs early development of liver, intestine and visceral adipocytes in zebrafish larvae. FEBS Lett., 590, 2852–2861. [DOI] [PubMed] [Google Scholar]
- 29. Carter, A.J. and Nguyen, A.Q. (2011) Antagonistic pleiotropy as a widespread mechanism for the maintenance of polymorphic disease alleles. BMC Med. Genet., 12, 160. [DOI] [PMC free article] [PubMed] [Google Scholar]
- 30. Piel, F.B., Patil, A.P., Howes, R.E., Nyangiri, O.A., Gething, P.W., Williams, T.N., Weatherall, D.J. and Hay, S.I. (2010) Global distribution of the sickle cell gene and geographical confirmation of the malaria hypothesis. Nat. Commun., 1, 104. [DOI] [PMC free article] [PubMed] [Google Scholar]
- 31. Vanhollebeke, B., Truc, P., Poelvoorde, P., Pays, A., Joshi, P.P., Katti, R., Jannin, J.G. and Pays, E. (2006) Human Trypanosoma evansi infection linked to a lack of apolipoprotein L-I. N. Engl. J. Med., 355, 2752–2756. [DOI] [PubMed] [Google Scholar]
- 32. Bersin, R.M., Wolfe, C., Kwasman, M., Lau, D., Klinski, C., Tanaka, K., Khorrami, P., Henderson, G.N., de Marco, T. and Chatterjee, K. (1994) Improved hemodynamic function and mechanical efficiency in congestive heart failure with sodium dichloroacetate. J. Am. Coll. Cardiol., 23, 1617–1624. [DOI] [PubMed] [Google Scholar]
- 33. Lewis, J.F., DaCosta, M., Wargowich, T. and Stacpoole, P. (1998) Effects of dichloroacetate in patients with congestive heart failure. Clin. Cardiol., 21, 888–892. [DOI] [PMC free article] [PubMed] [Google Scholar]
- 34. Matsuhashi, T., Hishiki, T., Zhou, H., Ono, T., Kaneda, R., Iso, T., Yamaguchi, A., Endo, J., Katsumata, Y., Atsushi, A. et al. (2015) Activation of pyruvate dehydrogenase by dichloroacetate has the potential to induce epigenetic remodeling in the heart. J. Mol. Cell. Cardiol., 82, 116–124. [DOI] [PubMed] [Google Scholar]
- 35. Kato, T., Niizuma, S., Inuzuka, Y., Kawashima, T., Okuda, J., Tamaki, Y., Iwanaga, Y., Narazaki, M., Matsuda, T., Soga, T. et al. (2010) Analysis of metabolic remodeling in compensated left ventricular hypertrophy and heart failure. Circ. Heart Fail., 3, 420–430. [DOI] [PubMed] [Google Scholar]
- 36. Cluntun, A.A., Badolia, R., Lettlova, S., Parnell, K.M., Shankar, T.S., Diakos, N.A., Olson, K.A., Taleb, I., Tatum, S.M., Berg, J.A. et al. (2021) The pyruvate-lactate axis modulates cardiac hypertrophy and heart failure. Cell Metab., 33, 629–648.e610. [DOI] [PMC free article] [PubMed] [Google Scholar]
- 37. McCommis, K.S., Kovacs, A., Weinheimer, C.J., Shew, T.M., Koves, T.R., Ilkayeva, O.R., Kamm, D.R., Pyles, K.D., King, M.T., Veech, R.L. et al. (2020) Nutritional modulation of heart failure in mitochondrial pyruvate carrier-deficient mice. Nat. Metab., 2, 1232–1247. [DOI] [PMC free article] [PubMed] [Google Scholar]
- 38. Zhang, Y., Taufalele, P.V., Cochran, J.D., Robillard-Frayne, I., Marx, J.M., Soto, J., Rauckhorst, A.J., Tayyari, F., Pewa, A.D., Gray, L.R. et al. (2020) Mitochondrial pyruvate carriers are required for myocardial stress adaptation. Nat. Metab., 2, 1248–1264. [DOI] [PMC free article] [PubMed] [Google Scholar]
- 39. Labbé, K., Mookerjee, S., Le Vasseur, M., Gibbs, E., Lerner, C. and Nunnari, J. (2021) The modified mitochondrial outer membrane carrier MTCH2 links mitochondrial fusion to lipogenesis. J. Cell Biol., 220, 2–5. [DOI] [PMC free article] [PubMed] [Google Scholar]
- 40. Kilpeläinen, T.O., den Hoed, M., Ong, K.K., Grøntved, A., Brage, S., Jameson, K., Cooper, C., Khaw, K.T., Ekelund, U., Wareham, N.J. et al. (2011) Obesity-susceptibility loci have a limited influence on birth weight: a meta-analysis of up to 28,219 individuals. Am. J. Clin. Nutr., 93, 851–860. [DOI] [PubMed] [Google Scholar]
- 41. Pottinger, T.D., Puckelwartz, M.J., Pesce, L.L., Robinson, A., Kearns, S., Pacheco, J.A., Rasmussen-Torvik, L.J., Smith, M.E., Chisholm, R. and McNally, E.M. (2020) Pathogenic and uncertain genetic variants have clinical cardiac correlates in diverse biobank participants. J. Am. Heart Assoc., 9, 2–3. [DOI] [PMC free article] [PubMed] [Google Scholar]
- 42. Machiela, M.J. and Chanock, S.J. (2015) LDlink: a web-based application for exploring population-specific haplotype structure and linking correlated alleles of possible functional variants. Bioinformatics, 31, 3555–3557. [DOI] [PMC free article] [PubMed] [Google Scholar]
- 43. Viswanathan, M.C., Blice-Baum, A.C., Sang, T.K. and Cammarato, A. (2016) Cardiac-restricted expression of VCP/TER94 RNAi or disease alleles perturbs drosophila heart structure and impairs function. J Cardiovasc Dev Dis, 3, 10–11. [DOI] [PMC free article] [PubMed] [Google Scholar]
- 44. Petersen, C.E., Tripoli, B.A., Schoborg, T.A. and Smyth, J.T. (2022) Analysis of Drosophila cardiac hypertrophy by microcomputerized tomography for genetic dissection of heart growth mechanisms. Am. J. Physiol. Heart Circ. Physiol., 322, H296–h309. [DOI] [PMC free article] [PubMed] [Google Scholar]
- 45. Perkins, L.A., Holderbaum, L., Tao, R., Hu, Y., Sopko, R., McCall, K., Yang-Zhou, D., Flockhart, I., Binari, R., Shim, H.S. et al. (2015) The transgenic RNAi project at Harvard Medical School: resources and validation. Genetics, 201, 843–852. [DOI] [PMC free article] [PubMed] [Google Scholar]
- 46. Yu, L., Daniels, J., Glaser, A.E. and Wolf, M.J. (2013) Raf-mediated cardiac hypertrophy in adult Drosophila. Dis. Model. Mech., 6, 964–976. [DOI] [PMC free article] [PubMed] [Google Scholar]
- 47. Tennessen, J.M., Barry, W.E., Cox, J. and Thummel, C.S. (2014) Methods for studying metabolism in Drosophila. Methods, 68, 105–115. [DOI] [PMC free article] [PubMed] [Google Scholar]
- 48. Hazegh, K.E. and Reis, T. (2016) a buoyancy-based method of determining fat levels in Drosophila. J. Vis. Exp., 117, 1–3. [DOI] [PMC free article] [PubMed] [Google Scholar]
- 49. Diegelmann, S., Jansen, A., Jois, S., Kastenholz, K., Velo Escarcena, L., Strudthoff, N. and Scholz, H. (2017) The capillary feeder assay measures food intake in Drosophila melanogaster. J. Vis. Exp., 121, 1–3. [DOI] [PMC free article] [PubMed] [Google Scholar]
- 50. Bawa, S., Brooks, D.S., Neville, K.E., Tipping, M., Sagar, M.A., Kollhoff, J.A., Chawla, G., Geisbrecht, B.V., Tennessen, J.M., Eliceiri, K.W. et al. (2020) Drosophila TRIM32 cooperates with glycolytic enzymes to promote cell growth. elife, 9, 22–23. [DOI] [PMC free article] [PubMed] [Google Scholar]
- 51. Neville, K.E., Bosse, T.L., Klekos, M., Mills, J.F., Weicksel, S.E., Waters, J.S. and Tipping, M. (2018) A novel ex vivo method for measuring whole brain metabolism in model systems. J. Neurosci. Methods, 296, 32–43. [DOI] [PMC free article] [PubMed] [Google Scholar]
Associated Data
This section collects any data citations, data availability statements, or supplementary materials included in this article.