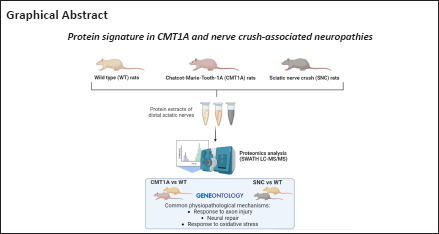
Keywords: Charcot-Marie-Tooth-1A, endoplasmic reticulum, Gene Ontology, neurogenesis, oxidative stress, proteomics, rat, repair, sciatic nerve crush, SWATH-MS
Abstract
The sensorimotor and histological aspects of peripheral neuropathies were already studied by our team in two rat models: the sciatic nerve crush and the Charcot-Marie-Tooth-1A disease. In this study, we sought to highlight and compare the protein signature of these two pathological situations. Indeed, the identification of protein profiles in diseases can play an important role in the development of pharmacological targets. In fact, Charcot-Marie-Tooth-1A rats develop motor impairments that are more severe in the hind limbs. Therefore, for the first time, protein expression in sciatic nerve of Charcot-Marie-Tooth-1A rats was examined. First, distal sciatic nerves were collected from Charcot-Marie-Tooth-1A and uninjured wild-type rats aged 3 months. After protein extraction, sequential window acquisition of all theoretical fragment ion spectra liquid chromatography and mass spectrometry was employed. 445 proteins mapped to Swiss-Prot or trEMBL Uniprot databases were identified and quantified. Of these, 153 proteins showed statistically significant differences between Charcot-Marie-Tooth-1A and wild-type groups. The majority of these proteins were overexpressed in Charcot-Marie-Tooth-1A. Hierarchical clustering and functional enrichment using Gene Ontology were used to group these proteins based on their biological effects concerning Charcot-Marie-Tooth-1A pathophysiology. Second, proteomic characterization of wild-type rats subjected to sciatic nerve crush was performed sequential window acquisition of all theoretical fragment ion spectra liquid chromatography and mass spectrometry. One month after injury, distal sciatic nerves were collected and analyzed as described above. Out of 459 identified proteins, 92 showed significant differences between sciatic nerve crush and the uninjured wild-type rats used in the first study. The results suggest that young adult Charcot-Marie-Tooth-1A rats (3 months old) develop compensatory mechanisms at the level of redox balance, protein folding, myelination, and axonogenesis. These mechanisms seem insufficient to hurdle the progress of the disease. Notably, response to oxidative stress appears to be a significant feature of Charcot-Marie-Tooth-1A, potentially playing a role in the pathological process. In contrast to the first experiment, the majority of the proteins that differed from wild-type were downregulated in the sciatic nerve crush group. Functional enrichment suggested that neurogenesis, response to axon injury, and oxidative stress were important biological processes. Protein analysis revealed an imperfect repair at this time point after injury and identified several distinguishable proteins. In conclusion, we suggest that peripheral neuropathies, whether of a genetic or traumatic cause, share some common pathological pathways. This study may provide directions for better characterization of these models and/or identifying new specific therapeutic targets.
Introduction
Peripheral neuropathy (PN) is one of the most prevalent neurological conditions in humans (Watson and Dyck, 2015). It manifests with varying severity (Martyn and Hughes, 1997) and a panoply of symptoms, ranging from small sensory defects to the more complex motor and autonomic symptoms (Barrell and Smith, 2019). Etiologically, PN can arise due to either traumatic damage to the nerve, or non-traumatic damage as seen in genetic, metabolic, drug-induced, and immune-related forms. Charcot-Marie-Tooth (CMT) is the most common inherited form of hereditary neuropathy with a worldwide prevalence of 1:2500 (Barreto et al., 2016), with demyelinating type 1A being the most abundant subtype (Barreto et al., 2016). Whether PN is of genetic origin or not, it has a significant impact on the quality of life of patients. Importantly, effective therapies for neuropathies are limited, especially due to patient heterogeneity and incomplete understanding of the underlying pathological mechanisms (Morena et al., 2019).
To further study the mechanistic alterations in PN and to screen for potential targets for drug design, animal models were developed for both the genetic and non-genetic forms of PN. For CMT1A disease, a transgenic rat model harboring three additional murine copies of PMP22 gene, fairly reproduces the sensorimotor symptoms observed in human patients (Sereda et al., 1996; Fledrich et al., 2012). Furthermore, sciatic nerve crush (SNC) or axonotmesis is one of the most common models of peripheral nerve injury in rodents (Magill et al., 2007). Crushing interrupts all axons, while Schwann cell basal laminae are preserved so that recovery is possible (Amado et al., 2008; Luís et al., 2008).
The functional characterization of disease-associated proteins is a major challenge in the post-genomic era. Proteins are effectors of biological function, and their levels not only depend on corresponding mRNA levels but also on host translational regulation. In the last 10 years, mass spectrometry-based proteomic analysis has revolutionized the way proteins can be analyzed and detected in fluids, cells, and tissues (Meissner and Mann, 2014). Therefore, analysis of the nerve proteome could provide useful information for the characterization of the pathophysiology of PN and the identification of potential biomarkers or targets for therapy.
The present proteomic study is a follow-up work of previously conducted experiments (Caillaud et al., 2018, 2020), and was performed using distal sciatic nerve samples extracted from three groups of animals: CMT1A rats, SNC rats, and wild-type (WT) uninjured rats. Sequential window acquisition of all theoretical fragment ion spectra mass spectrometry (SWATH-MS) is an emerging technology that combines deep proteome coverage capabilities with quantitative consistency and accuracy (Ludwig et al., 2018). We aimed to explore variations in protein expression of the CMT1A rat model and protein variations 1 month after SNC injury.
Methods
Animals and proteomic study organization
The workflow of the study is summarized in Figure 1.
Figure 1.
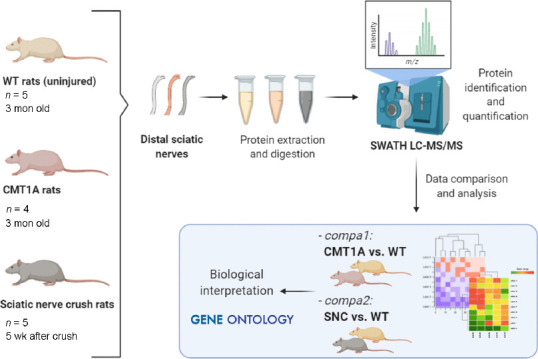
Experimental workflow.
Uninjured WT rats, CMT1A rats, and WT rats exposed to sciatic nerve crush were used for distal sciatic nerve collection (1 nerve/rat). Protein trypsin digests were separated and analyzed by mass spectrometry using SWATH LC-MS/MS. Identified proteins were compared between (i) CMT1A vs. WT group (compa1) and (ii) SNC vs. WT group (compa2). Using Gene Ontology terms, proteins were mapped into biological processes for further analysis. CMT1A: Charcot-Marie-Tooth-1A; SNC: sciatic nerve crush; SWATH LC-MS/MS: sequential window acquisition of all theoretical fragment ion spectra liquid chromatography and mass spectrometry; WT: wild-type.
Sciatic nerves from wild-type (WT) male Sprague-Dawley rats (Janvier Labs, Le Genest-Saint-Isle, France) aged 3 months (n = 5) and of body weight of 250–300 g; and age- and weight-matched male CMT1A heterozygous rats (generated on a Sprague-Dawley background (Sereda et al., 1996) by the Max Planck Institute for Experimental Medicine (MPIEM, University of Göttingen, Göttingen, Germany); n = 4) were collected post mortem. The CMT1A rats harbor 3 copies of murine Pmp22 gene and present motor and sensory symptoms similar to those observed in human patients (Sereda et al., 1996). Genotyping of male CMT1A rats was performed by quantitative polymerase chain reaction (qPCR) analysis of DNA samples. Genomic DNA was purified from tail biopsies using the DNeasy blood and tissue kit (Qiagen, Hilden, Germany) according to the manufacturer’s instructions. The genotype of either CMT1A rats or WT rats was confirmed by the presence or absence of Pmp22 transgenes detected by using mouse-specific Pmp22 primers (forward primer: GTT CCT GTT CTT CTG CCA GC and reverse primer CCT CAT TCG CGT TTC CGC A) (Thermo Fisher Scientific, Waltham, MA, USA).
For the traumatic model, SNC was performed on male WT Sprague-Dawley rats aged 1 month (n = 5) as previously described in detail (Caillaud et al., 2018). Briefly, after inhalation anesthesia by isofluorane (ISO-VET, Voorschoten, Netherlands), unilateral SNC was applied via a non-serrated clamp exerting a constant force using a Stevens’s needle holder (World Precision Instruments, Berlin, Germany) clamped directly onto the sciatic nerve 1.5 cm above the bifurcation, for 30 seconds to create a crush injury 2 mm in length. The jaws of the clamp were coated with carbon powder to precisely delimit the crush site. Muscles and skin were sutured, and a subcutaneous injection of analgesic (buprenorphine 0.05 mg/kg, Axience SAS, Pantin, France) was carried out after surgery, once a day for 3 days. Just after the crush injury, rats showed a deterioration in sensorimotor function, which corresponds to partial nerve damage and subsequent degeneration. Animals were then allowed to recover for 5 weeks. During this period, and at 5 weeks, the rats showed improvements at the functional and histological levels, corresponding to partial repair (see the behavioral study in Caillaud et al., 2018). Sciatic nerves were collected post-mortem (age at sacrifice 9 weeks).
Animals were individually housed in cages with an enriched environment and maintained on a 12-hour light/dark cycle, at a room temperature of 22°C, with ad libitum access to food and water. All animal experimentation was performed according to recommendations of the European Directive on 22 September 2010 (2010/63/EU) for the protection of animals used for scientific purposes. SNC experimental protocol and CMT1A animal model maintenance were specifically approved by the ethical committee CREEAL (Regional Animal Experimentation Ethics Committee) (n°16-2013-16 and APAFIS#29437-2021020115213118v1). Animal studies are reported in compliance with the ARRIVE 2.0 guidelines (Animal Research: Reporting of In Vivo Experiments) (Percie du Sert et al., 2020). Every effort was made to minimize the number of animals used and to ensure their optimal well-being before, during, and after each experiment. All rats were observed daily for general well-being. Note that the data from the uninjured WT rat group (aged 3 months) served as a control for both experiments.
Proteomic profiles were compared between CMT1A and WT rats sacrificed at 3 months old (compa1) and between SNC rats sacrificed 5 weeks after crush injury (compa2). In addition, proteins from a separate group of rats, both male and female, were examined by western blotting (see below).
Extraction and preparation of sciatic nerve protein samples
Nerve tissue samples were placed in liquid nitrogen and ground to a fine powder with mortar and pestle, suspended in 10 volumes of lysis buffer (8 M urea, 2 M thiourea, 4% w/v CHAPS, 40 mM Tris, 50 mM DTT, 1 mM EDTA and protease inhibitor cocktail), vortexed, sonicated at 4°C and allowed to sit on ice for 2 hours. Crude extracts were centrifuged at 17,000 × g for 15 minutes and supernatants were collected. Protein concentration was determined using PlusOne 2D Quant Kit (GE Healthcare Bio-Sciences AB, Schnelldorf, Germany) as per kit instructions.
Protein digests
Aliquots of 50 µg were prepared from supernatants by filter aided sample preparation (FASP) method as follows: protein extracts were diluted in 8 M urea to a final concentration of 0.5 µg/µL, reduced with 0.1 volume of 50 mM DTT and alkylated with 0.1 volume of 100 mM iodoacetamide. The protein extract was then transferred into the Amicon Ultra 10K filter (Millipore, Darmstadt, Germany) and washed twice with 8 M urea and then twice with 25 mM ammonium bicarbonate. Trypsin was added at a 1:50 ratio for a final concentration of 10 ng/µL. Peptides were purified using a 1 mL 30 mg Hydrophilic-Lipophilic-Balanced (HLB) cartridge following the manufacturer’s protocols (Waters, Milford, MA, USA) and finally filtered using 0.22 µm spin columns (Agilent Technologies, Santa Clara, CA, USA).
Mass spectrometry
Peptides were analyzed by micro LC-MS/MS using a nanoLC 425 system in micro-flow mode (Eksigent, Dublin, CA, USA) coupled with time-of-flight (TOF) (TripleTOF 5600+ Sciex, Framingham, MA, USA) operating in high-sensitivity mode. Reverse-phase LC was performed via a trap and elute configuration using a trap column (C18 Pepmap100 cartridge, 5 µm pore size; Thermo Fisher Scientific) and an analytical column (ChromXP C18 column, 12 nm, 3 µm pore size, Sciex) with the following mobile phases: loading solvent (water/ACN/TFA 98/2/0.05% (v/v)), solvent A (0.1% (v/v) TFA in water) and solvent B (water/ACN/TFA 5/95/0.1% (v/v)). All samples were loaded, trapped, and desalted using a flow rate of 10 μL/min with loading solvent for 5 minutes. The chromatographic separation was performed at a flow rate of 2 µL/min as follows: initial, 5% solvent B, increased to 25% for 90 minutes, then increased to 95% B for 10 minutes, maintained at 95% for 5 minutes and, finally, decreased to 5% B for re-equilibration.
The SWATH-MS spectral library was generated from 1 µg of each sample by data-dependent acquisition. MS and MS/MS data were continuously recorded with up to 40 precursors selected for fragmentation from each MS survey scan. Precursor selection was based upon ion intensity and whether or not the precursor had been previously selected for fragmentation (dynamic exclusion). Ions were fragmented using rolling collision energy. One µg of each sample was then subjected to cyclic data-independent acquisition of mass spectra using 60 variable SWATH windows over the 400–1250 m/z range. A 50 ms survey scan was initially performed on a TOF mass spectrometer, and subsequent MS/MS experiments were performed on all precursors using an accumulation time of 75 ms per SWATH window, for a total cycle time of 4.6 seconds. Ions were fragmented using rolling collision energy corresponding to the window m/z range.
Generation of the SWATH-MS reference library
All data-dependent acquisition mass spectrometer files were searched using ProteinPilot software v.5.0 (Sciex) with the Paragon algorithm. Samples were input with the following parameters: cysteine alkylation with iodoacetamide, digestion by trypsin, and no special factors. The search was conducted using a rapid identification effort of a UniProt https://www.uniprot.org/ (SWISS-PROT or TrEMBL) database (February 2018 release) containing non-redundant proteins of Rattus norvegicus. Group file output of this search was used as the reference spectral library. Spectral alignment and targeted data extraction of data-independent acquisition samples were performed using PeakView v.2.1 (Sciex) and SWATH v.2.0 module with the reference spectral library as above. Fold change (FC) of each protein was calculated as FC (protein) = mean of tested groups/mean of WT groups.
Principal component analysis and hierarchical clustering
To evaluate differences among samples, multivariate analysis was performed using principal component analysis (PCA) with FactoMineR (Lê et al., 2008) and visualized using factoextra (Kassambara and Mundt, 2020). A heat map is a useful tool for presenting quantitative proteomic datasets organized as matrices. Hierarchical clustering analysis was performed after log2 transformation and median centering, using ComplexHeatmap, according to Pearson distance to calculate dissimilarity and the average method to agglomerate samples that showed similar protein expression profiles (Gu et al., 2016).
Protein-protein interaction network and Functional enrichment analysis
The search tool for the retrieval of interacting genes (STRING) (https://string-db.org/cgi/input.pl) is an online tool designed to evaluate the protein-protein interaction (PPI) network (Szklarczyk et al., 2015). Full PPI networks of CMT1A vs. WT (compa1) and SNC vs. WT (compa2) were constructed by STRING, and no maximum number of interactors was set. The cut-off criterion P < 0.05 was set for pathways enrichment analysis. Markov Clustering (MCL) of nodes was applied. Gene ontology (GO) (Gene Ontology Resource; http://geneontology.org/) and Pathway ((Kyoto encyclopedia of genes and genomes (KEGG) (KEGG PATHWAY Database; https://www.genome.jp/kegg/pathway.html) and Reactome (Home - Reactome Pathway Database; https://reactome.org/) databases)) enrichment analyses were performed using the database for annotation, visualization and integrated discovery (DAVID®), v.6.8 (https://david.ncifcrf.gov/) (Huang et al., 2009) which provides comprehensive functional annotations to understand biological meaning behind large lists of genes. The GO describes our knowledge of the biological domain with respect to three aspects: molecular function (MF), biological process (BP), and cellular component (CC). Entities like nucleic acids, proteins, and small molecules participate in reactions to form a network of biological interactions and are grouped into pathways. The results were filtered by the following criteria: p-adjusted (Benjamini-Hochberg correction) ≤ 0.05 and protein count ≥ 5. For a given GO term, fold enrichment is defined as the ratio of the two proportions: proportion of input genes associated with the GO term/proportion of background genes (all genes of Rattus norvegicus) associated with the GO term.
Western blotting
Western blotting was used to verify results for expression of certain proteins seen by proteomic analysis for compa1. Sciatic nerves were obtained from 3-month-old CMT1A (n = 8: 4 males and 4 females) and littermate WT rats (n = 7: 4 males and 3 females). These rats have the same general information as the above-mentioned rats. Frozen nerves were crushed on dry ice and solubilized in Pierce™ RIPA lysis buffer (ThermoFisher Scientific) containing protease inhibitor cocktail (cOmplete Mini Tablets, EDTA-free, Roche, Switzerland). The samples were homogenized using a Tissuelyser (Qiagen, Hilden, Germany) sonicated on ice and centrifuged for 10 min at 14,000 × g. Protein concentrations from cell lysates were quantified using Bradford solution (Sigma-Aldrich, St. Louis, MO, USA). Twenty-five μg of total protein was separated on a 4–20% polyacrylamide mini-gel (Biorad, Hercules, CA, USA), and transferred to a PVDF membrane. Gels were stained by Coomassie blue and blots blocked with 5% bovine serum albumin (BSA) in TBST.
All antibody incubations were overnight at 4°C. Antibodies used were anti-calnexin mouse monoclonal antibody (1:10,000, Proteintech, Cat# 66903-1-Ig, RRID: AB_2882231), anti-PMP22 rabbit polyclonal antibody (1:200, Sigma-Aldrich, Cat# SAB4502217, RRID: AB_10746275), anti-peripherin rabbit polyclonal antibody (1:1000, Santa Cruz Biotechnology, Cat# sc-28539, RRID: AB_2171206), anti-vimentin mouse monoclonal antibody (1:75, Agilent, Cat# M0725, RRID: AB_10013485), anti-aldose reductase ALDR (H-6) mouse monoclonal antibody (1:500, Santa Cruz Biotechnology, Cat# sc-166918, RRID: AB_10609906), or anti-heat shock protein GRP94 rabbit polyclonal antibody (1:1000, Enzo Life Sciences, Cat# ADI-SPA-851, RRID: AB_10615790). Following incubation, membranes were washed and probed for 1h at room temperature with anti-rabbit or anti-mouse secondary antibodies conjugated to horseradish peroxidase (HRP) (1:1000, Rabbit: Agilent, Cat# P0448, RRID: AB_2617138, Mouse: Agilent, Cat# P0447, RRID: AB_2617137).
Protein band intensities were quantified using ImageJ software v1.53c (National Institutes of Health, Bethesda, MD, USA). Protein quantification was calculated as follows: intensity of the protein of interest/intensity of total proteins per lane (in arbitrary units).
Statistical analyses
For the proteomic study, statistical analyses were performed using R environment (version 3.6.2) (R: The R Project for Statistical Computing, Vienna, Austria; https://www.r-project.org/). Normality and homoscedasticity of protein levels data according to treatment group were estimated by Shapiro and Bartlett tests, respectively. Where non-normal distribution, heteroscedasticity, and small group size (≤ 5) occurred, subsequent analysis by non-parametric tests was carried out to identify differentially expressed proteins between different groups. Two-group comparisons: CMT1A vs. WT (compa1) and SNC vs. WT (compa2) by Mann-Whitney U test, with P-value < 0.05 considered statistically significant. To control for multiple testing of the average expression of proteins, the raw P-values obtained from this analysis were further adjusted with the Benjamini-Hochberg method. In SNC vs. WT study (compa2), we were obliged to use a non-adjusted P-value, as the P-adjusted was not significant, potentially due to greater heterogeneity of individuals. Significance was set at P < 0.05.
For the western blot study, statistical analyses were performed using GraphPad Prism version 8.3.0 for Windows (GraphPad Software, San Diego, CA, USA, www.graphpad.com). The Student’s t-test was used, and statistical significance was considered when P < 0.05.
Results
Protein detection by the SWATH LC-MS/MS strategy allowed the identification of 445 proteins from CMT1A samples and 459 proteins from SNC samples. Each disease model group (CMT1A or SNC) was compared to the WT group. Dysregulated genes were filtered by the level of significance (P value) and magnitude of the regulation (fold change).
CMT1A versus WT (compa1)
Between CMT1A and WT groups, 153 proteins showed statistically-significant differential expression (P < 0.05). A first visual exploration of the proteomic data was conducted via a 2D PCA plot of the 153 significantly different proteins (Figure 2A). As expected, the two groups were well separated. WT samples were closely clustered, suggesting a similarity in protein expression between samples of this group. In contrast, CMT1A samples were more widespread, forming a larger distribution area and suggesting inter-individual heterogeneity among CMT1A samples.
Figure 2.
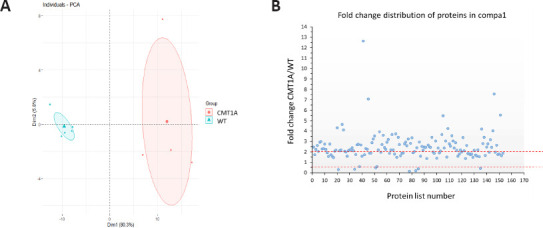
Data visualization of proteins sorting from compa1 (153 proteins).
(A) Categorization of protein expression using principle component analysis (PCA) analysis: WT (blue dots) and CMT1A (red dots) data are well separated. Therefore their data are well distinct, although a more spread cluster is observed in the CMT1A group. A greater heterogeneity was observed in CMT1A data. (B) Distribution of proteins as upregulated or downregulated depending on fold change ratios (mean CMT1A/mean WT). compa1: Comparison between CMT1A and WT rats at 3 months old. CMT1A: Charcot-Marie-Tooth-1A; WT: wild-type.
For each protein, fold change (FC) ratios (mean CMT1A/mean WT) greater than 2 or less than 0.5 were designated to consider a protein over or under-expressed, respectively. The majority of affected proteins were overexpressed in CMT1A in comparison to the WT group, with 99 proteins upregulated in CMT1A (FC > 2), whereas only 7 proteins were downregulated in CMT1A (FC < 0.5) as compared to WT rats (Figure 2B). These results were visualized using the heat map (Figure 3) that orders data with similar profiles into cluster rows and columns so that patterns among the data can be more easily observed.
Figure 3.
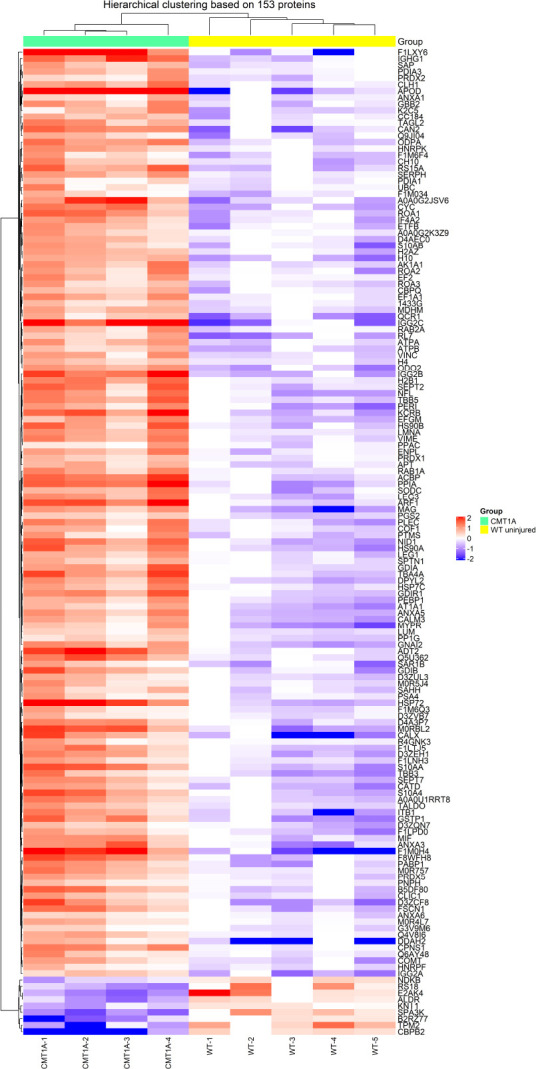
Heat map of CMT1A versus WT (compa1).
Hierarchical clustering of differentially expressed proteins in the two groups WT and CMT1A. Each column in the heat map represents a sample (rat), and each row represents a protein expression level. Proteins are grouped by hierarchical clustering based on their expression patterns. A color scale was used to aid the visualization: in CMT1A vs. WT groups, overexpressed proteins in red and under-expressed proteins in purple. compa1: Comparison between CMT1A and WT rats at 3 months old. CMT1A: Charcot-Marie-Tooth-1A; WT: wild-type.
STRING analysis was employed to check for protein-protein interactions (PPI) of the 153 significantly different proteins found in compa1 (Figure 4). As many proteins have more than one function, STRING bioinformatics tool was used to get a more detailed, yet simplified view of PPI. As expected, this network demonstrated significantly more interactions than would be expected among a random set of proteins (PPI enrichment P-value < 0.001). Using clustering techniques, similar proteins were indicated by the same color. Each colored node represents a protein, i.e. all the transcripts produced by a single, protein-coding gene locus. Therefore, splice isoforms or post-translational modifications were collapsed, resulting in a final 143 nodes.
Figure 4.
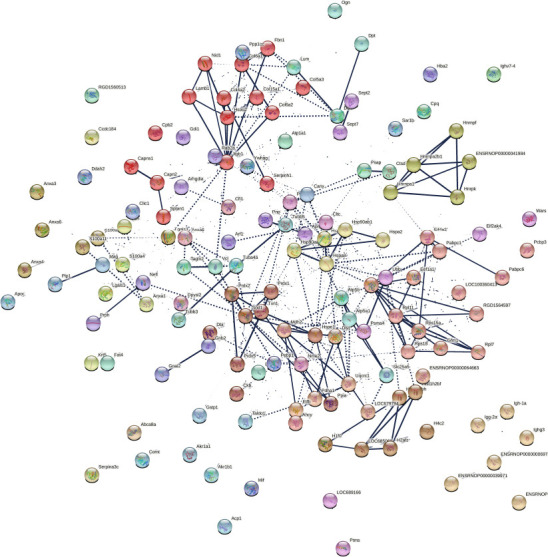
Protein network data of compa1 by STRING database (Rattus norvegicus).
Analysis of protein-protein interactions (PPI) of 153 significantly different proteins in compa1 study (CMT1A vs. WT). Nodes represent individual proteins, edges represent protein-protein associations. Average local Markov clustering coefficient = 0.505. Dotted lines represent edges between clusters. The thickness of the line is proportional to the edge confidence. Each color represents a cluster of proteins. There are 37 clusters based on enrichment pathways. Each cluster, created by Markov Clustering (MCL), corresponds to a group of enrichment pathways such as Gene Ontology, Kyoto encyclopedia of genes and genomes (KEGG), or Reactome. compa1: comparison between CMT1A and WT rats at 3 months old. CMT1A: Charcot-Marie-Tooth-1A; WT: wild-type.
To facilitate the analysis of such a large data set, differentially expressed proteins were categorized using Gene Ontology Biological Process (GO-BP) terms and functional enrichment analysis performed with DAVID® software. Ninety-eight GO-BP terms were identified as enriched (P < 0.05). These terms were manually grouped into 14 “families” based on similarity (Figure 5). Some of the proteins were involved in multiple processes and were therefore assigned to more than one BP group. Regarding CMT1A physiopathology, several BP terms that emerged from this analysis would be relevant to the disease process, including neurogenesis, gliogenesis, protein folding, cell projection and cytoskeleton organization, metabolic processes, wound healing, and regeneration. Although not the largest in terms of the number of proteins, we also noted with particular interest the category of response to oxidative stress.
Figure 5.
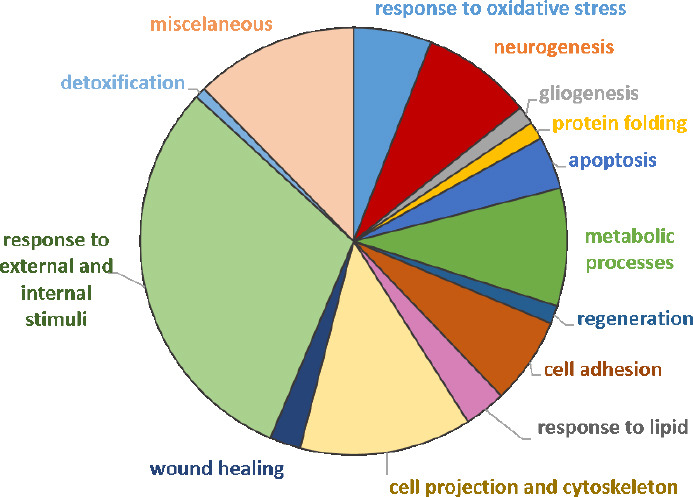
Pie chart of dysregulated proteins in CMT1A versus WT (compa1) annotated to Gene Ontology-Biological Process (GO-BP) terms.
Each “family” term includes both up- and down-regulated irredundant proteins. compa1: comparison between CMT1A and WT rats at 3 months old. CMT1A: Charcot-Marie-Tooth-1A; WT: wild-type.
To determine the most pronounced BP terms, we refined the data based on statistical significance and fold enrichment. Data were filtered by P-value, and a further filter of fold enrichment > 5 was applied (Additional Table 1). The top-five terms were selected (Table 1). Interestingly, the top 2 BP terms, containing 14 and 10 proteins respectively, are related to the response to reactive oxygen species (ROS). Arrangement in a Venn diagram demonstrated that 17 irredundant proteins from the 4 terms related to oxidative stress were determined (Figure 6A). The protein list contains thioredoxin (R4GNK3), peroxiredoxin-1, 2, and 5 (PRDX, Q63716, P35704, and Q9R063, respectively), superoxide dismutase [Cu-Zn] (SOD1, P07632), macrophage migration inhibitory factor (MIF, P30904), glutathione S-transferase P (GST-p, P04906), heat shock cognate 71 KDa protein (HSC70, P63018), and aldo-keto reductase family 1 member B1 (P07943, ALDR).
Additional Table 1.
Gene Ontology-Biological Process terms of CMT1A versus WT (compa1) filtered by statistical significance and fold enrichment > 5
| Term | Count | P-value | Genes | Fold enrichment | P adjusted (Benjamini-Hochberg correction) |
|---|---|---|---|---|---|
| Response to reactive oxygen species | 14 | 1.51E-07 | P10960, P07632, P04906, P63018, P35704, Q63716, R4GNK3, A0A0G2JSV6, Q9R063, P07150, P23593, P30904, P07943, P05197 | 6.749 | 2.54E-04 |
| Cellular response to reactive oxygen species | 10 | 5.68E-06 | Q9R063, P10960, P07150, P07632, P63018, P35704, P30904, Q63716, P07943, R4GNK3 | 7.743 | 0.0010 |
| Protein folding | 10 | 8.33E-06 | P10111, P63018, P34058, P14659, P82995, P26772, P11598, Q66HD0, P35565, R4GNK3 | 7.385 | 0.0014 |
| Cellular response to oxidative stress | 12 | 1.20E-05 | P04785, Q9R063, P10960, P07150, P07632, P63018, P35704, P30904, P19804, Q63716, P07943, R4GNK3 | 5.456 | 0.0017 |
| Hydrogen peroxide metabolic process | 6 | 1.39E-05 | A0A0G2JSV6, Q9R063, P07632, P62898, P35704, Q63716 | 19.164 | 0.0019 |
| Response to hydrogen peroxide | 9 | 6.74E-05 | A0A0G2JSV6, P10960, P07150, P07632, P63018, P30904, P07943, P05197, R4GNK3 | 6.570 | 0.0063 |
| Reactive oxygen species metabolic process | 10 | 1.15E-04 | A0A0G2JSV6, Q6MG60, Q9R063, P07632, P04906, P62898, P35704, Q63716, P82995, P62630 | 5.279 | 0.0095 |
| Cell redox homeostasis | 6 | 1.39E-04 | P04785, Q9R063, P35704, Q63716, P11598, R4GNK3 | 11.977 | 0.0108 |
| Extracellular matrix organization | 9 | 2.30E-04 | P29457, B2RZ77, Q9EQV9, P63018, P51886, P34058, P08699, P85845, P08460 | 5.502 | 0.0151 |
| Extracellular structure organization | 9 | 2.38E-04 | P29457, B2RZ77, Q9EQV9, P63018, P51886, P34058, P08699, P85845, P08460 | 5.475 | 0.0153 |
| Response to heat | 7 | 3.18E-04 | Q9EQV9, P07632, P63018, P30904, P14659, P82995, P31044 | 7.579 | 0.0186 |
| Positive regulation of viral process | 6 | 4.44E-04 | P04785, Q9EPH8, P45592, P10111, P63018, P11762 | 9.348 | 0.0238 |
| Cellular oxidant detoxification | 6 | 4.70E-04 | Q9R063, P07632, P04906, P35704, Q63716, R4GNK3 | 9.235 | 0.0248 |
| Pyridine nucleotide metabolic process | 7 | 5.12E-04 | P85973, Q9R063, P04636, P30904, Q01205, Q9EQS0, P26284 | 6.933 | 0.0254 |
| Nicotinamide nucleotide metabolic process | 7 | 5.12E-04 | P85973, Q9R063, P04636, P30904, Q01205, Q9EQS0, P26284 | 6.933 | 0.0254 |
| Cellular detoxification | 6 | 5.53E-04 | Q9R063, P07632, P04906, P35704, Q63716, R4GNK3 | 8.913 | 0.0259 |
| Pyridine-containing compound metabolic process | 7 | 6.52E-04 | P85973, Q9R063, P04636, P30904, Q01205, Q9EQS0, P26284 | 6.624 | 0.0285 |
| Detoxification | 6 | 6.81E-04 | Q9R063, P07632, P04906, P35704, Q63716, R4GNK3 | 8.517 | 0.0286 |
| Response to temperature stimulus | 8 | 7.59E-04 | Q9EQV9, P07632, P63018, P30904, P14659, P82995, P31044, D4A7V9 | 5.323 | 0.0304 |
| Response to axon injury | 6 | 8.70E-04 | P23593, P07632, P30904, P11762, P19527, R4GNK3 | 8.069 | 0.0335 |
| Oxidoreduction coenzyme metabolic process | 7 | 9.46E-04 | P85973, Q9R063, P04636, P30904, Q01205, Q9EQS0, P26284 | 6.168 | 0.0360 |
| Positive regulation of multi-organism process | 7 | 9.81E-04 | P04785, Q9EPH8, P45592, P10111, P63018, P30904, P11762 | 6.125 | 0.0365 |
CMT1A: Charcot-Marie-Tooth-1A; WT: wild type.
Table 1.
Top five GO-BP terms filtered by fold enrichment > 5 (compa1) in order highest to lowest
| Category | Term | Count | P-value | Genes* | Fold enrichment | P-adjusted# |
|---|---|---|---|---|---|---|
| GO:0000302 | Response to ROS | 14 | 1.51E-07 | P10960 (Psap), P07632 (Sod1), P04906 (Gstp1), P63018 (Hspa8), P35704 (Prdx2), Q63716 (Prdx1), R4GNK3 (Txn1), A0A0G2JSV6 (Hba-a3), Q9R063 (Prdx5), P07150 (Anxa1), P23593 Apod), P30904 (Mif), P07943 (Akr1b1), P05197 (Eef2) | 6.75 | 2.54E-04 |
| GO:0034614 | Cellular response to ROS | 10 | 5.68E-06 | Q9R063 (Prdx5), P10960 (Psap), P07150 (Anxa1), P07632 (Sod1), P63018 (Hspa8), P35704 (Prdx2), P30904 (Mif), Q63716 (Prdx1), P07943 (Akr1b1), R4GNK3 (Txn1) | 7.74 | 0.00101 |
| GO:0006457 | Protein folding | 10 | 8.34E-06 | P10111 (Ppia), P63018 (Hspa8), P34058 (Hsp90ab1), P14659 (Hspa2), P82995 (Hsp90aa1), P26772 (Hspe1), P11598 (Pdia3), Q66HD0 (Hsp90b1), P35565 (Canx), R4GNK3 (Txn1) | 7.38 | 0.00014 |
| GO:0034599 | Cellular response to oxidative stress | 12 | 1.24E-05 | P04785 (P4hb), Q9R063 (Prdx5), P10960 (Psap), P07150 (Anxa1), P07632 (Sod1), P63018 (Hspa8), P35704 (Prdx2), P30904 (Mif), P19804 (Nme2), Q63716 ( Prdx1), P07943 P07943), R4GNK3 (Txn1) | 5.46 | 0.00173 |
| GO:0042743 | Hydrogen peroxide metabolic process | 6 | 1.39E-05 | A0A0G2JSV6 (Hba-a3), Q9R063 (Prdx5), P07632 (Sod1), P62898 (Cycs), P35704 (Prdx2), Q63716 (Prdx1) | 19.16 | 0.00187 |
*UniProt accession references and gene names (SWISSPROT and TrEMBL). #Benjamini-Hochberg correction. Four terms are related to oxidative stress, and one is related to protein folding. The top 2 terms related to response to ROS contain 14 nonredundant proteins. compa1: comparison between CMT1A and WT rats at 3 months old. CMT1A: Charcot-Marie-Tooth-1A; GO-BP: Gene Ontology Biological Process; ROS: reactive oxygen species; WT: wild-type.
Figure 6.
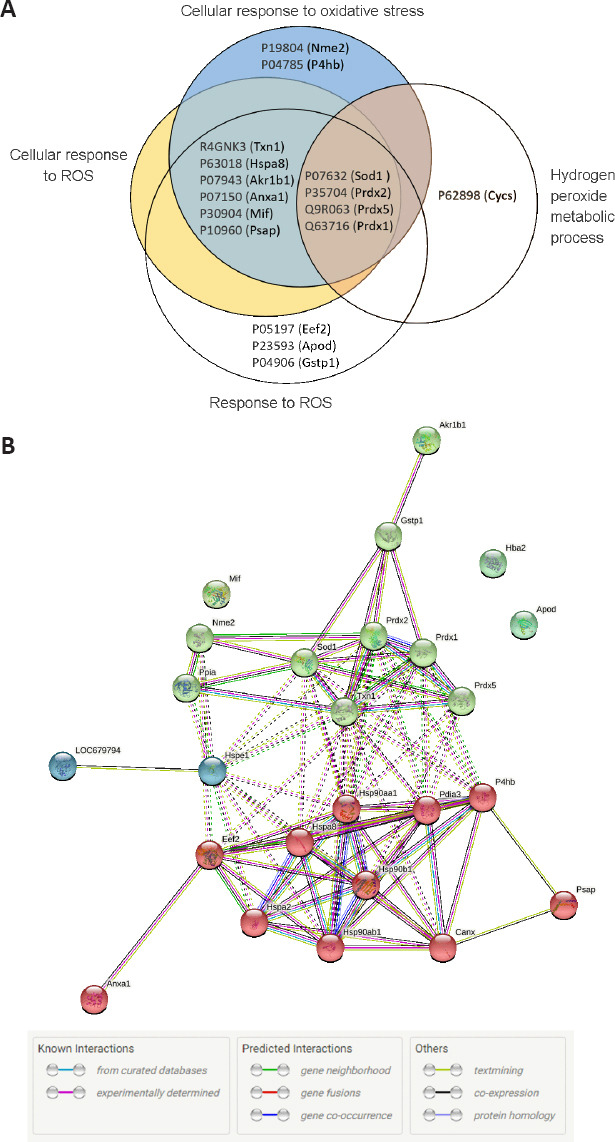
Analysis of the top five BP terms in compa1.
(A) Venn diagram of the four sets of Gene ontology (GO) terms concerning oxidative stress (UniProt accession numbers and names). (B) Analysis of protein-protein interactions (PPI) by the search tool for the retrieval of interacting genes (STRING) database. Protein network data of 17 irredundant proteins related to oxidative stress and 10 irredundant proteins related to protein folding. The color code of edges reflects the type of interaction evidence. Edge lines as per Figure 3. compa1: comparison between CMT1A and WT rats at 3 months old. CMT1A: Charcot-Marie-Tooth-1A; WT: wild-type.
Moreover, third in the top-five list comes the term “protein folding” with 7.38 fold enrichment (Table 1). This group contains several heat shock proteins that are designated by their molecular weight: heat shock cognate 71 kDa protein (HSC70, P63018), heat shock protein 90-alpha (HSP90-a, P82995), and beta (HSP90-b, P34058), heat shock-related 70 kDa protein 2 (HSP70.2, P14659), and the 10 kDa mitochondrial heat shock protein (HSP10, P26772). In addition, we found other molecular chaperones, most of which are responsible for glycoprotein folding such as endoplasmin (GRP94, Q66HD0), calnexin (CNX, P35565), peptidyl-prolyl cis-trans isomerase A (PPIase A, P10111), protein disulfide-isomerase A3 (PDIA3 or ERp57, P11598), and thioredoxin (TRX, R4GNK3). In CMT1A samples, these proteins were significantly upregulated. Our data show that CNX, GRP94, proteasome subunit alpha type-4 (PSA4, P21670), and polyubiquitin-C (UBC, Q63429) were upregulated in CMT1A samples with FC = 4.246, 2.208, 1.604 and 1.637, respectively. These results suggest the activation of the endoplasmic reticulum-associated degradation (ERAD) pathway which eliminates terminally misfolded glycoproteins (PMP22 in this case). Indeed, this pathway involves CNX, GRP94, the proteasome, and the ubiquitin system (Volpi et al., 2017). However, the ER chaperone BiP (also known as GRP78, P06761), a direct ER stress sensor (Wang et al., 2017), remained unchanged in CMT1A in comparison to WT.
We sought to investigate a potential interaction between the 17 proteins related to oxidative stress and the 10 proteins related to protein folding that came out as significantly changed in CMT1A investigated via STRING. The interactions (PPI) of these proteins were shown in Figure 6B. Significantly, this network showed a high level of interactions (PPI enrichment P < 0.001), indicating a particularly high degree of interaction between chaperone proteins (red cluster) and antioxidant proteins (green cluster).
Reactome and KEGG enrichment were applied to the data to gain further insight into reaction networks and relationships organized into biological pathways. The 153 significantly different proteins found in compa1 were analyzed. Seven pathways were enriched: five from KEGG (Table 2) and two from Reactome databases (Table 3). Importantly, the results appear to confirm an aberrant oxidative and ER response in the CMT1A rats compared to WT controls with emphasis on “Protein processing in the ER” and “Detoxification of ROS”.
Table 2.
KEGG pathways of compa1 (CMT1A versus WT)
| KEGG pathway | Count | P-value | Proteins | Fold enrichment | P-adjusted |
|---|---|---|---|---|---|
| rno04141:Protein processing in endoplasmic reticulum | 11 | 3.01E-05 | P04785 (P4hb), P63018 (Hspa8), P34058 (Hsp90ab1), P14659 (Hspa2), Q07009 (Capn2), P82995 (Hsp90aa1), Q5HZY2 (Sar1b), P11598 (Pdia3), Q66HD0 (Hsp90b1), P35565 (Canx), D4A7V9 (Eif2ak4) | 5.4 | 0.005 |
| rno05134:Legionellosis | 7 | 5.63E-05 | P63018 (Hspa8), P62898 (Cycs), P14659 (Hspa2), Q5HZY2 (Sar1b), P62630 (Eef1a1), Q6NYB7 (Rab1A), P84079 (Arf1) | 10.12 | 0.004 |
| rno04974:Protein digestion and absorption | 7 | 6.63E-04 | Q9JI04 (Col5a3), Q9EQV9 (Cpb2), D3ZUL3 (Col6a1), F1LPD0 (LOC108348074), F1LNH3 (Col6a2), F1M6Q3 (Col4a2), P06685 (Atp1a1) | 6.48 | 0.034 |
| rno04915:Estrogen signaling pathway | 7 | 9.89E-04 | P0DP31 (Calm3), P63018 (Hspa8), P34058 (Hsp90ab1), P04897 (Gnai2), P14659 (Hspa2), P82995 (Hsp90aa1), Q66HD0 (Hsp90b1) | 6.01 | 0.038 |
| rno05034:Alcoholism | 9 | 0.00118912 | P0DP31 (Calm3), Q00715 (H2b1), M0R4L7, D4AEC0 (H2afv), P04897 (Gnai2), P54313 (Gnb2), P63088 (Ppp1cc), P0C0S7 (H2az1), P62804 (H4c2) | 4.22 | 0.036 |
CMT1A: Charcot-Marie-Tooth-1A; KEGG: Kyoto encyclopedia of genes and genomes; WT: wild-type.
Table 3.
Reactome pathways of compa1 (CMT1A versus WT)
| REACTOME pathway | Count | P-value | Proteins | Fold enrichment | P-adjusted |
|---|---|---|---|---|---|
| R-RNO-3299685: Detoxification of Reactive Oxygen Species | 8 | 2.01E-07 | P04785 (P4hb), Q9R063 (Prdx5), P07632 (Sod1), P04906 (Gstp1), P62898 (Cycs), P35704 (Prdx2), Q63716 (Prdx1), R4GNK3 (Txn1) | 17.92 | 6.20E-05 |
| R-RNO-1650814: Collagen biosynthesis and modifying enzymes | 7 | 1.67E-04 | P04785 (P4hb), P29457 (Serpinh1), Q9JI04 (Col5a3), D3ZUL3 (Col6a1), F1LPD0 (LOC108348074), F1LNH3 (Col6a2), F1M6Q3 (Col4a2) | 8.34 | 0.025 |
compa1: Comparison between CMT1A and WT rats at 3 months old. CMT1A: Charcot-Marie-Tooth-1A; WT: wild-type.
Target verification by western blotting: CMT1A versus WT
To confirm the validity of the proteomic results of compa1, the expression levels of 6 proteins were estimated by western blotting. These included 3 intracellular proteins (calnexin, peripherin, and Vimentin) that appeared to be over-expressed according to the proteomic results, and one potentially under-expressed (ALDR). In addition, PMP22 was evaluated.
Calnexin (CNX) is a type I transmembrane endoplasmic reticulum (ER) lectin that binds and folds proteins containing monoglucosylated oligosaccharides, such as PMP22 (Hammond et al., 1994). According to the proteomics data, CNX was overexpressed in each of the five CMT1A samples with an average FC = 4.246. Due to its high level in CMT1A sciatic nerves, and its importance as an ER stress sensor, CNX was quantified by Western blotting (Figure 7A). CNX (90 kDa) was significantly overexpressed in CMT1A sciatic nerves (P < 0.01; n = 5) compared to WT (n = 4). The blot in Figure 7A is underexposed to highlight the upregulation of calnexin in the CMT1A nerves but on longer exposure, calnexin is easily detectable in WT nerves in line with other’s findings in the field (Fazal et al., 2017; Additional Figure 1 (391.7KB, tif) ). The average ratio of CNX quantification (CMT1A/WT) = 5.472 (Figure 7B).
Figure 7.
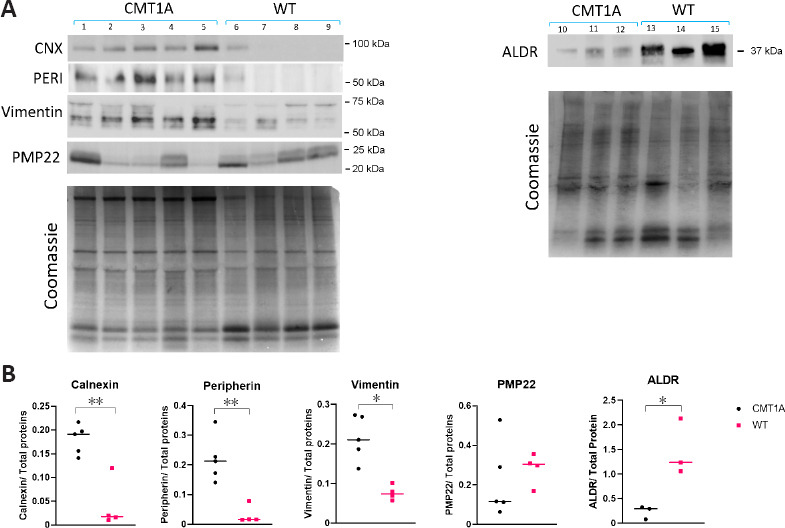
Protein expression analysis.
(A) Western blot performed on sciatic nerve homogenates of CMT1A (n = 5) and WT (n = 4) rats aged 3 months. Calnexin (CNX), peripherin (PERI), vimentin, and peripheral myelin protein 22 (PMP22) staining were probed. For aldose reductase (ALDR), additional samples of the same age were used: CMT1A (n = 3) and WT (n = 3). As a loading control, the gel was stained by Coomassie staining. Shown is the Coomassie gel for PMP22 and vimentin blots, as well as the gel for ALDR blot. CNX and PERI were normalized on another blot. (B) Densitometric quantification of a shows a statistically significant high expression of CNX in CMT1A samples compared to WT samples (P < 0.01). Peripherin and vimentin showed overexpression in CMT1A samples in comparison to WT (P < 0.01 and P < 0.05, respectively). PMP22 quantification showed no statistical significance between CMT1A and WT. ALDR showed an underexpression in CMT1A samples (P < 0.05). The intensity of each sample was normalized by the intensity of total proteins per lane indicated by Coomassie staining. The median of values is shown. *P < 0.05, **P < 0.01 (Student’s t-test). CMT1A: Charcot-Marie-Tooth-1A; WT: wild-type.
PMP22 protein, considered the major player in the pathology of CMT1A, was highly variable in CMT1A samples and less variable in WT samples, and no significant difference in PMP22 expression in the rat sciatic nerve was observed (Figure 7B). Very faint bands appeared at ~100 kDa and ~250 kDa (Additional Figure 2 (718.7KB, tif) ), which could represent PMP22 binding to chaperone proteins, but this point requires further confirmation. Peripherin (PERI, P21807) and vimentin (VIME, P31000), both type III intermediate filaments that assemble with other neurofilaments in neurons of the PNS, displayed a higher expression in the sciatic nerves of CMT1A rats with a ratio of CMT1A/WT of 8.717 for peripherin and 3.492 for vimentin (Figure 7A and B) in line with data from proteomic analysis. The oxidoreductase enzyme aldose reductase (ALDR, P07943) also known as aldo-keto reductase family 1 member B1, was involved in reducing carbonyl substrates such as sugar aldehydes and lipid peroxidation by-products (Reed, 2011), was under-expressed in CMT1A in comparison to WT sciatic nerves in proteomic analysis (FC = 0.486). Western blot analysis also showed that ALDR (37 kDa) had a lower expression (P < 0.05) in CMT1A samples (Figure 7A and B).
SNC versus WT (compa2)
In a parallel study, SNC was performed on WT rats. Injured rats showed signs of deterioration in sensorimotor function just after the crush injury, which improved with time (Caillaud et al., 2018). Sciatic nerves were collected and tested to explore their proteome 5 weeks after nerve injury. Out of the 459 proteins identified, 92 proteins were significantly different (P < 0.05) compared to uninjured sciatic nerves from WT rats. As for compa1, PCA analysis was performed as a first visual exploration of the data and a 2D PCA plot of the 92 significantly different proteins was established (Figure 8A). As expected, the spread of data points is clearly separated for each group, indicating a difference in the protein expression profiles between groups, as seen in compa1 WT samples are more closely positioned, suggesting a similarity in the protein expression for the samples in this group. In contrast, SNC data points are more widespread, indicating greater heterogeneity in SNC samples. FC ratio of each protein (mean SNC/mean WT), indicated the majority of the altered proteins were downregulated in SNC samples compared to WT samples (Figure 8B) with 35 proteins downregulated and 2 upregulated in SNC groups (FC < 0.5 and > 2, respectively). These observations were also reflected in the heat map, showing that the majority of proteins were under-expressed in SNC groups compared to WT (Figure 9). Furthermore, protein interactions visualized by STRING (Figure 10) showed the PPI of the 92 affected proteins in compa2 was greater than expected for a random set of proteins (PPI enrichment P < 0.001).
Figure 8.
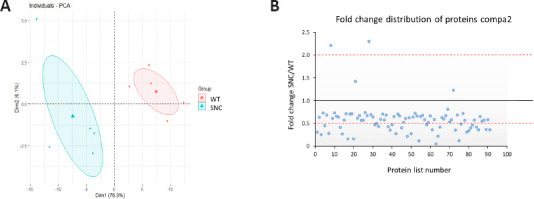
Data visualization of proteins sorted from compa2 (92 proteins).
(A) Principal component analysis (PCA) shows that WT (red points) and SNC (blue points) data are well separated, therefore their data are well distinct. A heterogeneity is shown in SNC data. (B) Distribution of proteins as up or downregulated depending on fold change ratios (mean SNC/mean WT). compa2: Comparison between SNC and the WT rats 5 weeks after injury. SNC: Sciatic nerve crush; WT: wild-type.
Figure 9.
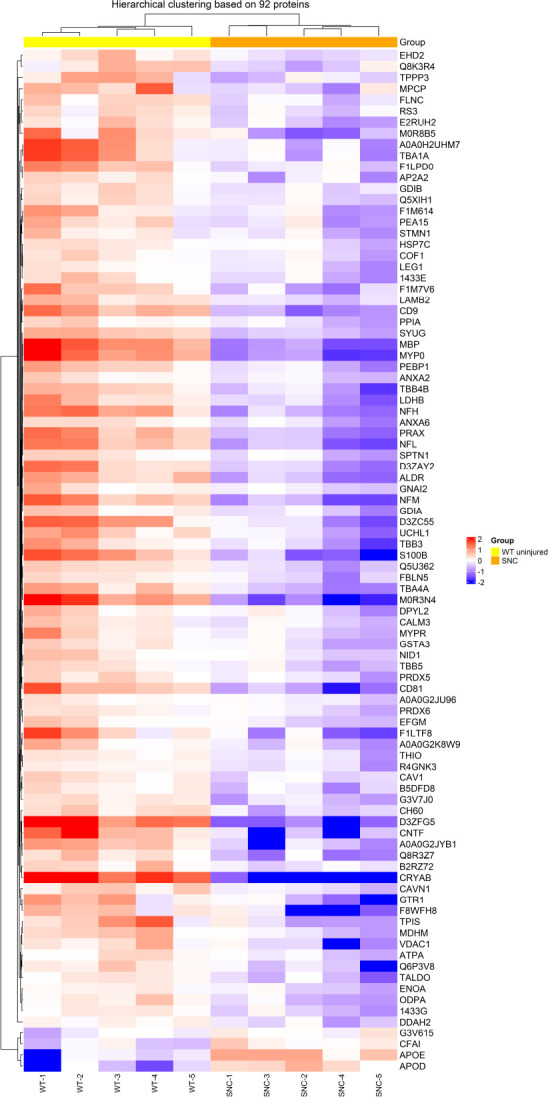
Heat map of SNC versus WT (compa2).
Hierarchical clustering of differentially expressed proteins in the two groups WT and SNC, overexpressed proteins in red and under-expressed proteins in purple. compa2: comparison between SNC and the WT rats 5 weeks after injury. SNC: Sciatic nerve crush; WT: wild-type.
Figure 10.
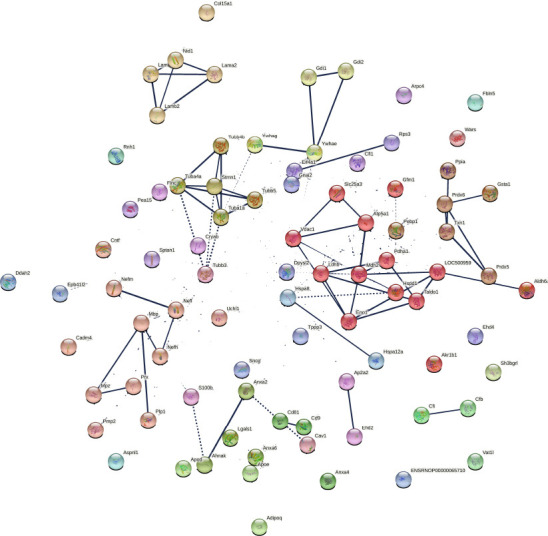
Protein network data of compa2 by STRING database (Rattus norvegicus).
Analysis of protein-protein interactions of 92 significantly different proteins in compa2 (SNC vs. WT). Nodes represent a single protein-coding gene locus. Splice isoforms or post-translational modifications are collapsed, thus 85 nodes appear. Edges represent protein-protein associations meaning that proteins jointly contribute to a shared function. Average local Markov clustering coefficient = 0.453. Dotted lines represent edges between clusters. The thickness of the edge line is proportional to the edge confidence. Each color represents a cluster of proteins. There are 22 clusters based on enrichment pathways. compa2: Comparison between SNC and the WT rats 5 weeks after injury. SNC: Sciatic nerve crush; WT: wild-type.
From annotation of dysregulated proteins using GO-BP and functional enrichment analysis performed with DAVID® software, 72 GO-BP terms were identified (P-adjusted < 0.05). Manual grouping identified 9 families (Figure 11) and broad information on the processes that were modified in response to nerve crush to be extrapolated. Namely: neurogenesis, cytoskeleton organization, and response to oxidative stress and metabolic processes.
Figure 11.
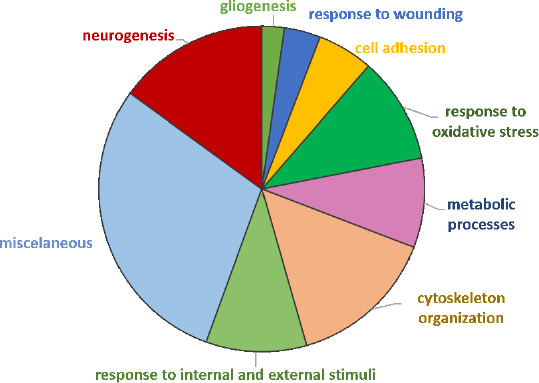
Pie chart of dysregulated proteins in SNC versus WT (compa2) annotated to Gene Ontology Biological Process (GO-BP) terms.
Each “family” term includes both up- and down-regulated irredundant proteins. compa2: comparison between SNC and the WT rats 5 weeks after injury. SNC: Sciatic nerve crush; WT: wild-type.
Similar to the approach followed for the previous analysis, upon further filtering of the GO data based on p-adjusted < 0.05 and fold enrichment > 5, 25 terms were highlighted (Additional Table 2). Then, the top-five terms were selected (Table 4). As expected, the most prominent terms in the SNC group were related to the response to axon injury (fold enrichment = 18.49), including axon development and regeneration. Response to oxidative stress was second (fold enrichment = 6.11). Using the Venn-diagram method, 18 irredundant proteins from the 3 terms related to axon injury/development were determined (Figure 12A). The common proteins between the 3 terms were: neurofilament heavy polypeptide (NFH, P16884), neurofilament medium polypeptide (NFM, P12839), neurofilament light polypeptide (NFL, P19527), apolipoprotein D (APOD, P23593), laminin subunit beta-2 (LAM-B, P15800), apolipoprotein E (APOE; P02650), and ciliary neurotrophic factor (CNTF, P20294). Oxidative stress-related proteins included thioredoxin, peroxiredoxins, ALDR, and alpha-crystallin B chain (P23928). The PPI of 17 proteins related to axonogenesis and 16 proteins related to oxidative stress were shown in Figure 12B. This network showed a significantly high level of interactions (PPI enrichment P < 0.001).
Additional Table 2.
Gene Ontology-Biological Process terms of SNC versus WT (compa2) filtered by statistical significance and fold enrichment > 5
| Term name | Count | P-value | Genes | Fold enrichment | P adjusted (Benjamini-Hochberg correction) |
|---|---|---|---|---|---|
| Response to axon injury | 9 | 2.66E-08 | P11232, P20294, P23593, P02650, P15800, P11762, P16884, P19527, P12839, R4GNK3 | 18.49 | 7.02E-05 |
| Response to oxidative stress | 15 | 1.20E-07 | P63039, P63018, P02650, P16884, P31044, Q8K3R4, R4GNK3, P11232, Q9R063, Q9WVH8, P23593, P07943, | 6.11 | 7.97E-05 |
| P12839, P23928, O35244, P62909 | |||||
| Axon development | 15 | 1.03E-07 | P20294, P02688, P02650, Q4QRB4, P60203, P15800, P19527, P16884, F1M614, P50398, Q00981, P13668, P23593, P12839, P47942 | 6.19 | 9.11E-05 |
| Axon regeneration | 7 | 2.69E-07 | P20294, P23593, P02650, P15800, P16884, P19527, P12839 | 25.78 | 1.02E-04 |
| Microtubule-based process | 17 | 9.24E-08 | Q5PPN5, P63018, Q4QRB4, P41350, P19527, P16884, A0A0G2JYB1, Q6P9T8, P68370, Q5XIF6, Q00981, A0A0H2UHM7, P13668, P69897, P12839, P23928, P62909 | 5.27 | 1.22E-04 |
| Neuron projection regeneration | 7 | 1.31E-06 | P20294, P23593, P02650, P15800, P16884, P19527, P12839 | 19.8 | 3.87E-04 |
| Response to reactive oxygen species | 10 | 7.78E-06 | P11232, Q9R063, Q9WVH8, P63039, P23593, P63018, P07943, P23928, R4GNK3, P62909, O35244 | 7.36 | 0.001582 |
| Axonogenesis | 12 | 1.18E-05 | P50398, P02688, Q00981, P13668, Q4QRB4, P02650, P15800, P16884, P19527, P12839, P47942, F1M614 | 5.39 | 0.00195 |
| Nicotinamide nucleotide metabolic process | 7 | 4.90E-05 | Q9R063, P04636, P42123, Q9EQS0, P48500, P04764, P26284 | 10.59 | 0.00562 |
| Pyridine nucleotide metabolic process | 7 | 4.91E-05 | Q9R063, P04636, P42123, Q9EQS0, P48500, P04764, P26284 | 10.59 | 0.00562 |
| Oxidoreduction coenzyme metabolic process | 7 | 9.40E-05 | Q9R063, P04636, P42123, Q9EQS0, P48500, P04764, P26284 | 9.42 | 0.00825 |
| Microtubule polymerization or depolymerization | 6 | 9.81E-05 | Q5PPN5, P13668, P41350, P23928, A0A0G2JYB1, P62909 | 12.87 | 0.00833 |
| Glial cell development | 6 | 1.14E-04 | P20294, Q63425, P60203, P15800, P40241, F1M614 | 12.46 | 0.009124 |
| Glial cell differentiation | 8 | 1.50E-04 | P20294, P02650, P04631, Q63425, P60203, P15800, P40241, F1M614 | 6.91 | 0.011199 |
| Microtubule polymerization | 5 | 1.73E-04 | Q5PPN5, P13668, P41350, A0A0G2JYB1, P62909 | 17.74 | 0.012214 |
| Protein polymerization | 8 | 1.99E-04 | Q5PPN5, P13668, P41350, P19527, B2RZ72, A0A0G2JYB1, P62909, P16086 | 6.58 | 0.013799 |
| Reactive oxygen species metabolic process | 8 | 2.26E-04 | Q6MG60, Q9R063, Q9WVH8, P63039, Q9Z2L0, P41350, P23928, O35244 | 6.45 | 0.015265 |
| Regeneration | 8 | 5.12E-04 | P20294, P23593, P02650, P41350, P41350, P16884, P19527, P12839 | 5.63 | 0.029021 |
| Response to glucocorticoid | 8 | 5.46E-04 | P11232, P0DP31, P63039, P04631, P41350, P19527, P31044, Q8K3R4, R4GNK3 | 5.57 | 0.029642 |
| Peripheral nervous system development | 5 | 5.12E-04 | Q63544, Q63425, P15800, P16884, F1M614 | 13.37 | 0.029645 |
| Cellular response to oxidative stress | 8 | 5.58E-04 | P11232, Q9R063, Q9WVH8, P63018, P07943, P16884, P12839, R4GNK3, P62909 | 5.55 | 0.029659 |
| Positive regulation of viral process | 5 | 7.95E-04 | P45592, P10111, P02650, P63018, P11762 | 11.9 | 0.038893 |
| Gliogenesis | 8 | 8.36E-04 | P20294, P02650, P04631, Q63425, P60203, P15800, P40241, F1M614 | 5.18 | 0.040142 |
| Response to corticosteroid | 8 | 8.86E-04 | P11232, P0DP31, P63039, P04631, P41350, P19527, P31044, Q8K3R4, R4GNK3 | 5.13 | 0.041 |
| Receptor metabolic process | 6 | 0.00117 | P02650, P41350, Q07936, Q8K3R4, Q62745, P40241 | 7.5 | 0.045407 |
SNC: Sciatic nerve crush; WT: wild type.
Table 4.
Top five GO-BP terms filtered by fold enrichment > 5 (compa2) in order highest to lowest
| Term | Term name | Count | P-value | Genes* | Fold enrichment | P-adjusted# |
|---|---|---|---|---|---|---|
| GO:0048678 | Response to axon injury | 9 | 2.66E-08 | P11232 (Txn), P20294 (Cntf), P23593 (Apod), P02650 (Apoe), P15800 (Lamb2), P11762 (Lgals1), P16884 (Nefh), P19527 (Nefl), P12839 (Nefm), R4GNK3 (Txn1) | 18.49 | 7.03E-05 |
| GO:0006979 | Response to oxidative stress | 15 | 1.21E-07 | P63039 (Hspd1), P63018 (Hspa8), P02650 (Apoe), P16884 (Nefh), P31044 (Pebp1), Q8K3R4 (Adipoq), R4GNK3 (Txn1), P11232 (Txn), Q9R063 Prdx5, Q9WVH8 (Fbln5), P23593 (Apod), P07943 (Akr1b1), P12839 (Nefm), P23928 (Cryab), O35244 (Prdx6), P62909 (Rps3) | 6.11 | 7.97E-05 |
| GO:0061564 | Axon development | 15 | 1.03E-07 | P20294 (Cntf), P02688 (Mbp), P02650 (Apoe), Q4QRB4 (Tubb3), P60203 (Plp1), P15800 (Lamb2), P19527 (Nefl), P16884 (Nefh), F1M614 (Lama2), P50398 (Gdi1), Q00981 (Uchl1), P13668 (Stmn1), P23593 (Apod), P12839 (Nefm), P47942 (Dpysl2) | 6.19 | 9.11E-05 |
| GO:0031103 | Axon regeneration | 7 | 2.69E-07 | P20294 (Cntf), P23593 (Apod), P02650 (Apoe), P15800 (Lamb2), P16884 (Nefh), P19527 (Nefl), P12839 (Nefm) | 25.78 | 1.02E-04 |
| GO:0007017 | Microtubule-based process | 17 | 9.24E-08 | Q5PPN5 (Tppp3), P63018 (Hspa8), Q4QRB4 (Tubb3), P41350 (Cav1), P19527 (Nefl), P16884 (Nefh), A0A0G2JYB1 (Capzb), Q6P9T8 (Tubb4b), P68370 (Tuba1a), Q5XIF6 (Tuba4a), Q00981 (Uchl1), A0A0H2UHM7 (LOC100909441), P13668 (Stmn1), P69897 (Tubb5), P12839 (Nefm), P23928 (Cryab), P62909 (Rps3) | 5.28 | 1.22E-04 |
*UniProt accession references and names (SWISSPROT and TrEMBL). #Benjamini-Hochberg correction. Three terms out of five are related to axon development/injury, one comprises proteins involved in response to oxidative stress, and one contains proteins involved in microtubule processes. Compa2: Comparison between SNC and the WT rats 1 month after injury. CMT1A: Charcot-Marie-Tooth-1A; GO-BP: Gene Ontology Biological Process; WT: wild-type.
Figure 12.
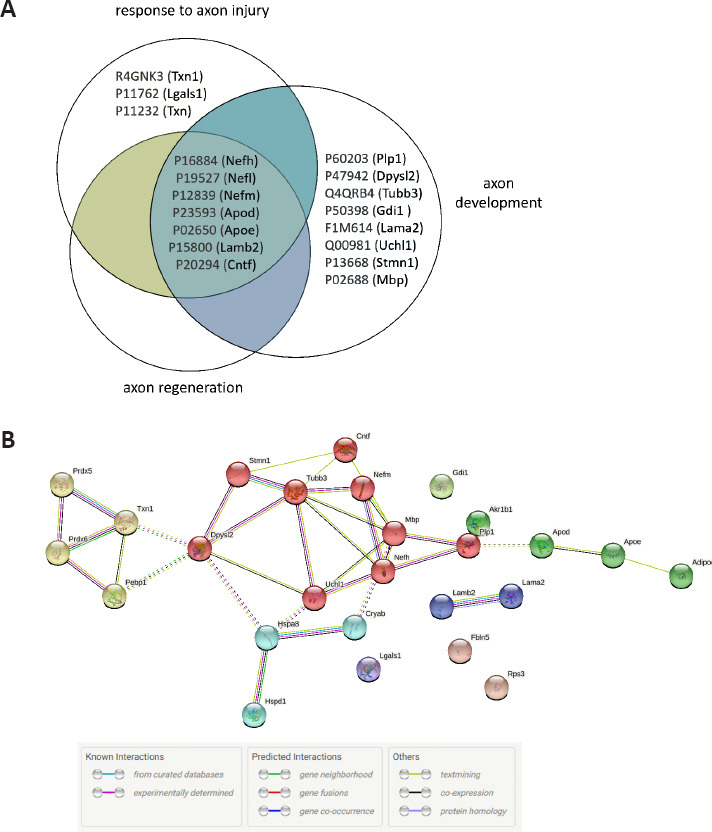
Analysis of the top five Biological Process terms in compa2.
(A) Venn diagram of the three sets of Gene Ontology-Biological Process (GO-BP) terms concerning the neural axon. The protein UniProt accession number and gene names are used. Seven proteins are common between the three sets of terms: NFH, NFM, NFL, APOD precursor, APOE precursor, LAMB2, and CNTF. (B) Analysis of protein-protein interaction by STRING. Protein network data of 17 irredundant proteins related to the axon and 16 irredundant proteins related to oxidative stress. Five clusters are indicated in yellow, red, green, light blue, and dark blue. The color code of edges reflects the type of interaction evidence shown in the table. Three main clusters can be seen: antioxidants (yellow), axon-related proteins (red), and lipid proteins (green). compa2: Comparison between sciatic nerve crush and wild-type rats 1 month after injury; SNC: sciatic nerve crush; WT: wild-type.
Comparison of the two models (CMT1A versus SNC)
Finally, we investigated whether a protein signature might be shared between the two pathologies, CMT1A and SNC, which differ in origin, but result in similar symptoms. The differentially-expressed proteins in each of the two models were directly compared. A Venn diagram revealed that 32 proteins (13%) were dysregulated in common (Figure 13). Interestingly, these proteins varied in the opposite direction between the two comparisons (Table 5), i.e. proteins that were down-regulated in SNC samples (except APOD), were upregulated in CMT1A groups (except ALDR). Further filtering in compa1 (CMT1A vs. WT) yielded 24 proteins with FC > 2 (Table 5), while in compa2, 6 proteins had FC < 0.5 (Table 5, green). For example, NFL, which is involved in the maintenance of neuronal caliber, was increased three times in CMT1A vs. WT (compa1), while it decreased by two-thirds in SNC in comparison to WT (compa2). Moreover, PRDX5, which detoxifies peroxides and protects against oxidative stress, was increased almost two times in compa1, while it decreased to almost half in compa2 (Table 5). The two proteins APOD and ALDR that showed the opposite directions of change, had FC < 0.5 and >2, respectively (Table 5). APOD, a component of the high-density lipoprotein (HDL), has a very high fold increase in compa1 (FC = 12.63) and a lower FC in compa2 (FC = 2.304). ALDR, which plays a role in the transformation and detoxification of aldehydes and ketones, was substantially downregulated in both models when compared to WT (FC < 0.5).
Figure 13.
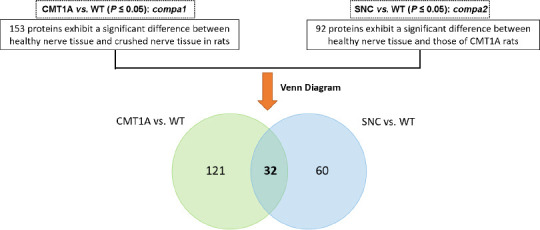
Venn diagram of dysregulated proteins common to both compa1 and compa2.
The diagram shows 32 common proteins between the two collections of significantly different proteins. compa1: comparison between CMT1A and WT rats at 3 months old; compa2: comparison between SNC and the WT rats 5 months after injury. CMT1A: Charcot-Marie-Tooth-1A; SNC: sciatic nerve crush; WT: wild-type.
Table 5.
Thirty-two deregulated proteins common to both compa1 and compa2
| Uniprot name | Uniprot Accession No.* | CMT1A vs. WT# | SNC vs. WT# | ||
|---|---|---|---|---|---|
|
|
|
||||
| Fold change | P-adjusted^ | Fold change | P-value | ||
| SPTN1 | P16086 | 1.734 | 0.046 | 0.635 | 0.008 |
| HSP7C | P63018 | 2.052 | 0.046 | 0.728 | 0.032 |
| NFL | P19527 | 2.994 | 0.046 | 0.284 | 0.008 |
| ANXA6 | P48037 | 1.378 | 0.046 | 0.607 | 0.008 |
| DPYL2 | P47942 | 2.767 | 0.046 | 0.659 | 0.032 |
| PPIA | P10111 | 4.312 | 0.046 | 0.641 | 0.008 |
| ATPA | P15999 | 2.201 | 0.046 | 0.713 | 0.008 |
| COF1 | P45592 | 2.075 | 0.046 | 0.705 | 0.032 |
| LEG1 | P11762 | 2.005 | 0.046 | 0.710 | 0.032 |
| CALM3 | P0DP31 | 2.390 | 0.046 | 0.674 | 0.032 |
| MDHM | P04636 | 2.102 | 0.046 | 0.564 | 0.016 |
| MYPR | P60203 | 2.670 | 0.046 | 0.569 | 0.016 |
| 1433G | P61983 | 1.609 | 0.046 | 0.667 | 0.032 |
| APOD | P23593 | 12.630 | 0.046 | 2.304 | 0.016 |
| GDIB | P50399 | 2.672 | 0.046 | 0.697 | 0.016 |
| PEBP1 | P31044 | 2.269 | 0.046 | 0.498 | 0.008 |
| NID1 | P08460 | 3.528 | 0.046 | 0.686 | 0.032 |
| ALDR | P07943 | 0.486 | 0.046 | 0.351 | 0.008 |
| TBB3 | Q4QRB4 | 2.499 | 0.046 | 0.467 | 0.008 |
| PRDX5 | Q9R063 | 1.869 | 0.046 | 0.661 | 0.016 |
| TBA4A | Q5XIF6 | 3.199 | 0.046 | 0.399 | 0.008 |
| TALDO | Q9EQS0 | 1.920 | 0.046 | 0.607 | 0.008 |
| DDAH2 | Q6MG60 | 3.728 | 0.046 | 0.725 | 0.032 |
| TBB5 | P69897 | 2.776 | 0.046 | 0.651 | 0.032 |
| GNAI2 | P04897 | 2.824 | 0.046 | 0.663 | 0.008 |
| ODPA | P26284 | 2.963 | 0.046 | 0.589 | 0.008 |
| GDIA | P50398 | 2.470 | 0.046 | 0.598 | 0.008 |
| EFGM | Q07803 | 2.442 | 0.046 | 0.668 | 0.032 |
| F1LPD0 | F1LPD0 | 2.195 | 0.046 | 0.491 | 0.016 |
| R4GNK3 | R4GNK3 | 1.552 | 0.046 | 0.717 | 0.008 |
| Q5U362 | Q5U362 | 2.789 | 0.046 | 0.566 | 0.008 |
| F8WFH8 | F8WFH8 | 3.175 | 0.046 | 0.400 | 0.032 |
*Uniprot code for Rattus Norvegicus. #Comparison by Mann-Whitney test vs. WT proteins in each set. ^P-adjusted = P adjusted by Benjamini-Hochberg method. Color code: Red FC ≥ 2; green FC ≤ 0.5. CMT1A: Charcot-Marie-Tooth-1A; SNC: sciatic nerve crush; WT: wild-type.
The two GO-BP terms lists generated from compa1 and compa2 were compared. Forty-four BP terms were found to be in common, 54 terms were specific to compa1 and 28 terms were specific to compa2 (Figure 14A). Among the 44 common terms, 17 terms were filtered according to P-adjusted < 0.01 in the two enrichment analyses (Figure 14B). As expected, the prevalent terms were related to neurogenesis and oxidative stress. To further parse the data, only proteins that had a > 4-fold enrichment in the two enrichment analyses were selected. Out of the 44 terms, only 12 terms met the criteria, all of which were relevant to metabolic processes as well as response to oxidative species and axon injury (Figure 14C).
Figure 14.
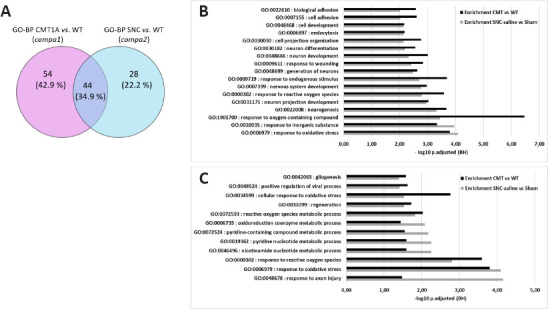
Overlap of GO-BP lists between compa1 and compa2.
(A) Venn diagram of the two collections of GO-BP terms shows 44 terms (34.9 %) common to the two comparisons. (B) Histogram showing 17 out of 44 GO-BP terms that have P-adjusted < 0.01 in both enrichment analyses. (C) Histogram showing 12 out of 44 GO-BP terms filtered by fold enrichment > 4 in both enrichment analyses. compa1: comparison between CMT1A and WT rats at 3 months old; compa2: comparison between SNC and the WT rats 5 weeks after injury. CMT1A: Charcot-Marie-Tooth-1A; GO-BP: Gene Ontology Biological Process; SNC: sciatic nerve crush; WT: wild-type.
Discussion
SWATH-MS technique was used to determine the protein signature in CMT1A and SNC rat models, extending our previous studies (Caillaud et al., 2018, 2020). We aimed to examine how cells of the sciatic nerve respond to the disease processes of genetic and traumatic peripheral neuropathy. Indeed, the change in protein expression strictly correlates with the age and stage of the disease, implying a possible difference in protein signature if a different time point was to be chosen. At three months old, sensorimotor symptoms of CMT1A rats are well-established. Moreover, 5 weeks after crush injury, rats showed partial functional and histological repair. A comparison of the two conditions would reveal potential common variations linked to PN and provide insight into potential targets for future therapeutic approaches.
When coming to each study, high-dimensional data, where the number of features exceeds the number of observations, is common in biology and arises when multiple features such as the expression of many genes, are measured for each sample (Lever et al., 2017). Principal component analysis (PCA) is an efficient method to reduce a large number of variables to a smaller number of groups that can be more readily visualized and understood (Ivosev et al., 2008). It allows patterns to be found without reference to prior knowledge about whether the samples come from different treatment groups or have phenotypic differences (Lever et al., 2017). To interpret the functional significance and biological output of the altered proteins, enrichment for different biological terms (according to Gene Ontology terms, KEGG, and Reactome pathways) was used. These bioinformatics tools help to visualize, interpret and analyze data with respect to biological pathways and relevance to basic and clinical research.
In the first comparison (CMT1A versus WT), the majority of identified proteins were significantly upregulated in CMT1A samples. Several GO terms emerged consistent with CMT1A physiopathology, such as detoxification, response to oxidative stress, neurogenesis, and protein folding. Response to oxidative stress was a pivotal emerging term. It appears to be a chief feature of CMT1A disease, potentially playing a role in the pathology. We have recently demonstrated the presence of oxidative stress in CMT1A rats, manifested by high ROS production in sciatic nerves and lipoperoxidation markers in urine (Caillaud et al., 2020). Sorted proteins also included SOD and GST, both of which have been documented to be elevated in the plasma of CMT1A patients (Chahbouni et al., 2017).
Consistent with the toxic gain of function of the PMP22 gene in CMT1A disease, “protein folding” emerged as an important term. Sorted proteins were generally molecular chaperones. In particular, five HSPs were identified: HSC70, HSP90α, HSP90β, GRP94, HSP70-2, and HSP10. These chaperones are responsible for correct protein folding during physiological conditions and for restoration, refolding, and preventing aggregation of damaged or denatured polypeptides in cells exposed to stress (Gupta et al., 2020). In the context of CMT1A, overexpression of these chaperones was expected. However, whether the protein overload aggravates the injury over time needs further study. CNX is an ER chaperone that binds and folds glycoproteins such as PMP22. It is also a direct protein folding sensor (Hammond et al., 1994). Western blotting demonstrated that CNX was highly expressed in CMT1A samples, compared with WT samples, concordant with proteomic data. One mechanism of ER quality control checkpoints is the CNX/calreticulin cycle that promotes protein folding. In our study, calreticulin (CALR, P18418), the luminal counterpart of CNX, was identified by MS but did not vary significantly from WT. In accordance with our study, Jung and colleagues showed that CNX, but not CALR, plays a crucial role in the folding and function of PMP22 (Jung et al., 2011). Thus, CALR would not appear to be a major player in the pathophysiology of CMT1A. High expression of CNX in CMT1A rats may be a compensatory mechanism to facilitate the folding/refolding of PMP22 and alleviate the burden of misfolded proteins within the ER (Caillaud et al., 2020). However, this mechanism would seem to be insufficient to prevent demyelination and the consequent symptoms of CMT1A.
Terminally-misfolded glycoproteins are targeted for degradation by the ERAD pathway. In contrast, an unfolded protein response (UPR) is activated when misfolded proteins accumulate (Hwang and Qi, 2018). If the condition is not resolved, UPR may lead to cell death. The ER chaperone BiP is a primary activator of UPR (Kopp et al., 2019). While most ERAD factors identified in our study (CNX, GRP94, proteasome subunit-alpha, and UBC) were overexpressed in CMT1A, BiP was not changed. We hypothesize that it is rather ERAD and not UPR that is activated at this time-point of the disease. On the other hand, PMP22 was tested by western blot because it was not identified by MS. Its expression was variable, most notably in CMT1A samples. In fact, PMP22 has a rapid turnover rate, with a half-life of approximately 70 minutes (Ryan et al., 2000). Therefore, a large portion of newly synthesized PMP22 is degraded, and only a small portion is transported to the cell surface (Li et al., 2013). Our observations may be explained by inter-individual variability, being further perturbed by CMT1A disease.
At the axonal end, high expression of neurofilaments, such as NFL and peripherin, as well as the intermediate filament vimentin, indicates modulation of axon growth. Since it is known that the interaction between Schwann cells and the axon is essential in both physiological and pathological cases, hypomyelination observed in CMT1A models and patients (Jouaud et al., 2019) is expected to affect the axon at a certain point of the disease (Maier et al., 2002). In CMT1A rats aged one year, decreased axon caliber was already observed (Gautier et al., 2021). However, in CMT1A rats aged 3 months, we hypothesize that Schwann cell perturbations are accompanied by mechanisms to preserve the axon, manifested by increased expression of neurofilaments. Interestingly, several neurofilament proteins are used as blood biomarkers to monitor neurological diseases and the efficacy of therapies (Yuan and Nixon, 2021). ALDR is involved in the detoxification of reactive aldehydes such as the cytotoxic by-product of lipid peroxidation 4-hydroxynonenal. It has been shown that these reactive aldehydes are increased in several neurodegenerative diseases (Reed, 2011). Although aldehydes are generated in neurons and Schwann cells via normal metabolic processes, the production of reactive aldehydes is increased in cells exposed to high levels of oxidants. As oxidative stress is already proven to occur in CMT1A sciatic nerve (Caillaud et al., 2020), high levels of reactive aldehydes could be a contributing source. Therefore, ALDR may represent an important detoxification route within SCs. In our case, the low level of ALDR in CMT1A sciatic nerves may lead to the accumulation of reactive aldehydes and thus contribute to oxidative stress.
On the other hand, SNC is a traumatic nerve damage model with a relatively high clinical incidence. In compa2 where SNC was compared to WT, most proteins at 5 weeks post-injury were significantly under-expressed in SNC in comparison to WT sciatic nerves. Identified GO terms included neurogenesis, gliogenesis, cytoskeletal organization, as well as response to wounding and oxidative stress. Peripheral nerve injury induces cellular and molecular changes at the level of neurons, Schwann cells, as well as in the local microenvironment. These changes are first accompanied by anterograde Wallerian degeneration and the formation and proliferation of “repair” Schwann cells. This is followed by a regenerative phase, where the microenvironment becomes permissive for axon regrowth and remyelination (Jessen and Mirsky, 2019; Arthur-Farraj and Coleman, 2021). Despite the known proliferation of Schwann cells after injury, myelin proteins MBP and PLP were under-expressed. Moreover, alpha-crystallin B chain and periaxin, highly expressed in myelinating Schwann cells, were strongly downregulated. In fact, alpha-crystallin B chain and periaxin have been shown to be downregulated soon after SNC and downregulation persists for as long as 35 days (Jiménez et al., 2005). This decrease in myelin proteins should be seen in the scope of the phenotypic changes in Schwann cells after injury. Neural cytoskeletal proteins NFH, NFM, and NFL, as well as other cytoskeleton-related proteins such as laminin, tubulin, cofilin-1, stathmin, and spectrin were downregulated. The change in axon proteins could be linked to the decrease in axon caliber at this time point after injury. This concurs with our previous nerve conduction velocity and myelination tests on the same animals which show a persistent injury profile, even though sensorimotor functions were improved (Caillaud et al., 2018). Prolonged low levels of myelin and axon proteins may indicate a defect in the repair machinery.
In addition, we identified several proteins that regulate regeneration including ciliary neurotrophic factor (CNTF) and caveolin-1 (CAV1), both of which were decreased in SNC. CNTF is implicated in preventing the degeneration of motor axons after axotomy (Park et al., 2004). In contrast, CAV1 knockout mice revealed remarkably high levels of vascular endothelial growth factor and the formation of new neurons (Li et al., 2011). Thus, the interplay between pro- and anti-regenerative factors determines the post-injury outcomes. During nerve regeneration phase, lipids are essential for remyelination. Consistent with this, APOD and APOE were increased after SNC. Expression of antioxidant enzymes such as PRDX 5, 6 and THIO was decreased expression. HSPs such as HSP70 and mitochondrial HSP60, appeared to be shut down at this time point (5 weeks) post-injury. Inflammatory proteins annexin A2, annexin A6, and S100B were downregulated. These proteins have been previously reported to form complexes that have a wide array of functions including inflammation (Weisz and Uversky, 2020). Furthermore, annexin A2 is involved in promoting the proangiogenic phenotype in macrophages (Wang et al., 2018).
Taken together, the results of the present study are complementary to other studies on CMT1A and SNC models and give insight into protein perturbation in peripheral nerve injury. CMT1A is a slowly progressive disease that tends to worsen over time. In contrast, depending on the severity of the physical injury, SNC models tend to improve with time. Our data highlight the presence of shared disturbances in cellular processes, regardless of the direction of change, i.e. either up- or down-regulation. Common processes in both models include oxidative stress and response to axon injury. A bigger sample size of animals could give a more precise idea of the protein variation and of in case of heterogeneity in the population. Furthermore, to gain specific insights into the myelin proteome, myelin purification could be useful as has been recently performed in mice (Siems et al., 2020). Time-dependent details of protein expression changes, as recently published by Aiki and colleagues for SNC (Aiki et al., 2018), would be desirable. Nevertheless, the present findings, at these time points, provide a group of divergent proteins that could be further investigated either to ameliorate the characterization of peripheral nerve repair/regeneration or to search for novel therapeutic targets.
Additional files:
Additional Table 1: Gene Ontology-Biological Process terms of CMT1A versus WT (compa1) filtered by statistical significance and fold enrichment > 5.
Additional Table 2: Gene Ontology-Biological Process terms of SNC versus WT (compa2) filtered by statistical significance and fold enrichment > 5.
Additional Figure 1 (391.7KB, tif) : Overexposed calnexin western blotting.
Overexposed calnexin western blotting.
The membrane of CMT1A (n = 5) and WT (n = 4) sciatic nerve samples were overexposed. The dash indicating 100 kDa is just above the observed calnexin bands. This means that calnexin is revealed at 90 kDa, as reported in other publications (Fazal et al., 2017). CMT1A: Charcot-Marie-Tooth-1A; WT: wild type.
Additional Figure 2 (718.7KB, tif) : PMP22 western blotting.
PMP22 western blotting.
The intense peripheral myelin protein-22 (PMP22) bands corresponds to 22 kDa. Other bands are observed at higher molecular weight (indicated by blue arrows) probably corresponding to strong binding of PMP22 to chaperone proteins.
Acknowledgments:
The authors are indebted to Prof. Klaus-Armin Nave and Prof. Michael Sereda for the CMT1A rats supplied by the Max Planck Institute for Experimental Medicine (University of Göttingen, Göttingen, Germany). We thank the staff of the animal house facility at the Faculty of Medicine and Pharmacy, Limoges. We thank Dr. Hassan Aouad (INSERM, UMR 1248, University of Limoges, Limoges, France) for his advice during the data analysis process. We thank Dr. Ian Darby (Editingbiomed, Melbourn, Australia) for the professional editing of the manuscript.
Footnotes
Funding: ZM is supported by a doctoral fellowship from the European Union (European Regional Development Fund).
Conflicts of interest: The authors declare no conflicts of interest.
Availability of data and materials: All data generated or analyzed during this study are included in this published article and its supplementary information files.
C-Editors: Zhao M, Liu WJ; S-Editor: Li CH; L-Editors: Li CH, Song LP; T-Editor: Jia Y
References
- 1.Aiki H, Wada T, Iba K, Oki G, Sohma H, Yamashita T, Kokai Y. Proteomics analysis of site- and stage-specific protein expression after peripheral nerve injury. J Orthop Sci Off J Jpn Orthop Assoc. 2018;23:1070–1078. doi: 10.1016/j.jos.2018.07.012. [DOI] [PubMed] [Google Scholar]
- 2.Amado S, Simões MJ, Armada da Silva P a S, Luís AL, Shirosaki Y, Lopes MA, Santos JD, Fregnan F, Gambarotta G, Raimondo S, Fornaro M, Veloso AP, Varejão ASP, Maurício AC, Geuna S. Use of hybrid chitosan membranes and N1E-115 cells for promoting nerve regeneration in an axonotmesis rat model. Biomaterials. 2008;29:4409–4419. doi: 10.1016/j.biomaterials.2008.07.043. [DOI] [PubMed] [Google Scholar]
- 3.Arthur-Farraj P, Coleman MP. Lessons from injury:how nerve injury studies reveal basic biological mechanisms and therapeutic opportunities for peripheral nerve diseases. Neurother J Am Soc Exp Neurother. 2021;18:2200–2221. doi: 10.1007/s13311-021-01125-3. [DOI] [PMC free article] [PubMed] [Google Scholar]
- 4.Barrell K, Smith AG. Peripheral neuropathy. Med Clin North Am. 2019;103:383–397. doi: 10.1016/j.mcna.2018.10.006. [DOI] [PubMed] [Google Scholar]
- 5.Barreto LCLS, Oliveira FS, Nunes PS, de França Costa IMP, Garcez CA, Goes GM, Neves ELA, de Souza Siqueira Quintans J, de Souza Araújo AA. Epidemiologic study of Charcot-Marie-Tooth disease:a systematic review. Neuroepidemiology. 2016;46:157–165. doi: 10.1159/000443706. [DOI] [PubMed] [Google Scholar]
- 6.Caillaud M, Chantemargue B, Richard L, Vignaud L, Favreau F, Faye PA, Vignoles P, Sturtz F, Trouillas P, Vallat J-M, Desmoulière A, Billet F. Local low dose curcumin treatment improves functional recovery and remyelination in a rat model of sciatic nerve crush through inhibition of oxidative stress. Neuropharmacology. 2018;139:98–116. doi: 10.1016/j.neuropharm.2018.07.001. [DOI] [PubMed] [Google Scholar]
- 7.Caillaud M, Msheik Z, Ndong-Ntoutoume GM, Vignaud L, Richard L, Favreau F, Faye PA, Sturtz F, Granet R, Vallat JM, Sol V, Desmoulière A, Billet F. Curcumin-cyclodextrin/cellulose nanocrystals improve the phenotype of Charcot-Marie-Tooth-1A transgenic rats through the reduction of oxidative stress. Free Radic Biol Med. 2020;161:246–262. doi: 10.1016/j.freeradbiomed.2020.09.019. [DOI] [PubMed] [Google Scholar]
- 8.Chahbouni M, López MDS, Molina-Carballo A, de Haro T, Muñoz-Hoyos A, Fernández-Ortiz M, Guerra-Librero A, Acuña-Castroviejo D. Melatonin treatment reduces oxidative damage and normalizes plasma pro-inflammatory cytokines in patients suffering from Charcot-Marie-Tooth neuropathy:a pilot study in three children. Mol Basel Switz. 2017;22:E1728. doi: 10.3390/molecules22101728. [DOI] [PMC free article] [PubMed] [Google Scholar]
- 9.Fazal SV, Gomez-Sanchez JA, Wagstaff LJ, Musner N, Otto G, Janz M, Mirsky R, Jessen KR. Graded elevation of c-Jun in schwann cells in vivo:gene dosage determines effects on development, remyelination, tumorigenesis, and hypomyelination. J Neurosci Off J Soc Neurosci. 2017;37:12297–12313. doi: 10.1523/JNEUROSCI.0986-17.2017. [DOI] [PMC free article] [PubMed] [Google Scholar]
- 10.Fledrich R, Schlotter-Weigel B, Schnizer TJ, Wichert SP, Stassart RM, Meyer zu Hörste G, Klink A, Weiss BG, Haag U, Walter MC, Rautenstrauss B, Paulus W, Rossner MJ, Sereda MW. A rat model of Charcot-Marie-Tooth disease 1A recapitulates disease variability and supplies biomarkers of axonal loss in patients. Brain. 2012;135:72–87. doi: 10.1093/brain/awr322. [DOI] [PubMed] [Google Scholar]
- 11.Gautier B, Hajjar H, Soares S, Berthelot J, Deck M, Abbou S, Campbell G, Ceprian M, Gonzalez S, Fovet C-M, Schütza V, Jouvenel A, Rivat C, Zerah M, François V, Le Guiner C, Aubourg P, Fledrich R, Tricaud N. AAV2/9-mediated silencing of PMP22 prevents the development of pathological features in a rat model of Charcot-Marie-Tooth disease 1 A. Nat Commun. 2021;12:2356. doi: 10.1038/s41467-021-22593-3. [DOI] [PMC free article] [PubMed] [Google Scholar]
- 12.Gu Z, Eils R, Schlesner M. Complex heatmaps reveal patterns and correlations in multidimensional genomic data. Bioinforma Oxf Engl. 2016;32:2847–2849. doi: 10.1093/bioinformatics/btw313. [DOI] [PubMed] [Google Scholar]
- 13.Gupta A, Bansal A, Hashimoto-Torii K. HSP70 and HSP90 in neurodegenerative diseases. Neurosci Lett. 2020;716:134678. doi: 10.1016/j.neulet.2019.134678. [DOI] [PMC free article] [PubMed] [Google Scholar]
- 14.Hammond C, Braakman I, Helenius A. Role of N-linked oligosaccharide recognition, glucose trimming, and calnexin in glycoprotein folding and quality control. Proc Natl Acad Sci U S A. 1994;91:913–917. doi: 10.1073/pnas.91.3.913. [DOI] [PMC free article] [PubMed] [Google Scholar]
- 15.Huang DW, Sherman BT, Lempicki RA. Systematic and integrative analysis of large gene lists using DAVID bioinformatics resources. Nat Protoc. 2009;4:44–57. doi: 10.1038/nprot.2008.211. [DOI] [PubMed] [Google Scholar]
- 16.Hwang J, Qi L. Quality control in the endoplasmic reticulum:crosstalk between ERAD and UPR pathways. Trends Biochem Sci. 2018;43:593–605. doi: 10.1016/j.tibs.2018.06.005. [DOI] [PMC free article] [PubMed] [Google Scholar]
- 17.Ivosev G, Burton L, Bonner R. Dimensionality reduction and visualization in principal component analysis. Anal Chem. 2008;80:4933–4944. doi: 10.1021/ac800110w. [DOI] [PubMed] [Google Scholar]
- 18.Jessen KR, Mirsky R. The success and failure of the schwann cell response to nerve injury. Front Cell Neurosci. 2019;13:33. doi: 10.3389/fncel.2019.00033. [DOI] [PMC free article] [PubMed] [Google Scholar]
- 19.Jiménez CR, Stam FJ, Li KW, Gouwenberg Y, Hornshaw MP, De Winter F, Verhaagen J, Smit AB. Proteomics of the injured rat sciatic nerve reveals protein expression dynamics during regeneration. Mol Cell Proteomics MCP. 2005;4:120–132. doi: 10.1074/mcp.M400076-MCP200. [DOI] [PubMed] [Google Scholar]
- 20.Jouaud M, Mathis S, Richard L, Lia AS, Magy L, Vallat JM. Rodent models with expression of PMP22:Relevance to dysmyelinating CMT and HNPP. J Neurol Sci. 2019;398:79–90. doi: 10.1016/j.jns.2019.01.030. [DOI] [PubMed] [Google Scholar]
- 21.Jung J, Coe H, Michalak M. Specialization of endoplasmic reticulum chaperones for the folding and function of myelin glycoproteins P0 and PMP22. FASEB J Off Publ Fed Am Soc Exp Biol. 2011;25:3929–3937. doi: 10.1096/fj.11-184911. [DOI] [PubMed] [Google Scholar]
- 22.Kassambara A, Mundt F. Factoextra:extract and visualize the results of multivariate data analyses. 2020. [Accessed October 29, 2020]. Available at:https://CRAN. R-project.org/package=factoextra .
- 23.Kilkenny C, Browne WJ, Cuthill IC, Emerson M, Altman DG. Improving bioscience research reporting:the ARRIVE guidelines for reporting animal research. PLoS Biol. 2010;8:e1000412. doi: 10.1371/journal.pbio.1000412. [DOI] [PMC free article] [PubMed] [Google Scholar]
- 24.Kopp MC, Larburu N, Durairaj V, Adams CJ, Ali MMU. UPR proteins IRE1 and PERK switch BiP from chaperone to ER stress sensor. Nat Struct Mol Biol. 2019;26:1053–1062. doi: 10.1038/s41594-019-0324-9. [DOI] [PMC free article] [PubMed] [Google Scholar]
- 25.Lê S, Josse J, Husson F. FactoMineR:An R package for multivariate analysis. J Stat Softw. 2008;25:1–18. [Google Scholar]
- 26.Lever J, Krzywinski M, Altman N. Principal component analysis. Nat Methods. 2017;14:641–642. [Google Scholar]
- 27.Li J, Parker B, Martyn C, Natarajan C, Guo J. The PMP22 gene and its related diseases. Mol Neurobiol. 2013;47:673–698. doi: 10.1007/s12035-012-8370-x. [DOI] [PMC free article] [PubMed] [Google Scholar]
- 28.Li Y, Luo J, Lau WM, Zheng G, Fu S, Wang TT, Zeng HP, So KF, Chung SK, Tong Y, Liu K, Shen J. Caveolin-1 plays a crucial role in inhibiting neuronal differentiation of neural stem/progenitor cells via VEGF signaling-dependent pathway. PLoS One. 2011;6:e22901. doi: 10.1371/journal.pone.0022901. [DOI] [PMC free article] [PubMed] [Google Scholar]
- 29.Ludwig C, Gillet L, Rosenberger G, Amon S, Collins BC, Aebersold R. Data-independent acquisition-based SWATH-MS for quantitative proteomics:a tutorial. Mol Syst Biol. 2018;14:e8126. doi: 10.15252/msb.20178126. [DOI] [PMC free article] [PubMed] [Google Scholar]
- 30.Luís AL, Rodrigues JM, Geuna S, Amado S, Simões MJ, Fregnan F, Ferreira AJ, Veloso AP, Armada-da-Silva P a S, Varejão ASP, Maurício AC. Neural cell transplantation effects on sciatic nerve regeneration after a standardized crush injury in the rat. Microsurgery. 2008;28:458–470. doi: 10.1002/micr.20524. [DOI] [PubMed] [Google Scholar]
- 31.Magill CK, Tong A, Kawamura D, Hayashi A, Hunter DA, Parsadanian A, Mackinnon SE, Myckatyn TM. Reinnervation of the tibialis anterior following sciatic nerve crush injury:a confocal microscopic study in transgenic mice. Exp Neurol. 2007;207:64–74. doi: 10.1016/j.expneurol.2007.05.028. [DOI] [PMC free article] [PubMed] [Google Scholar]
- 32.Maier M, Berger P, Suter U. Understanding Schwann cell-neurone interactions:the key to Charcot-Marie-Tooth disease? J Anat. 2002;200:357–366. doi: 10.1046/j.1469-7580.2002.00044.x. [DOI] [PMC free article] [PubMed] [Google Scholar]
- 33.Martyn CN, Hughes RA. Epidemiology of peripheral neuropathy. J Neurol Neurosurg Psychiatry. 1997;62:310–318. doi: 10.1136/jnnp.62.4.310. [DOI] [PMC free article] [PubMed] [Google Scholar]
- 34.Meissner F, Mann M. Quantitative shotgun proteomics:considerations for a high-quality workflow in immunology. Nat Immunol. 2014;15:112–117. doi: 10.1038/ni.2781. [DOI] [PubMed] [Google Scholar]
- 35.Morena J, Gupta A, Hoyle JC. Charcot-Marie-Tooth:From molecules to therapy. Int J Mol Sci. 2019;20:3419. doi: 10.3390/ijms20143419. [DOI] [PMC free article] [PubMed] [Google Scholar]
- 36.Park K, Luo JM, Hisheh S, Harvey AR, Cui Q. Cellular mechanisms associated with spontaneous and ciliary neurotrophic factor-cAMP-induced survival and axonal regeneration of adult retinal ganglion cells. J Neurosci Off J Soc Neurosci. 2004;24:10806–10815. doi: 10.1523/JNEUROSCI.3532-04.2004. [DOI] [PMC free article] [PubMed] [Google Scholar]
- 37.Percie du Sert N, Hurst V, Ahluwalia A, Alam S, Avey MT, Baker M, Browne WJ, Clark A, Cuthill IC, Dirnagl U, Emerson M, Garner P, Holgate ST, Howells DW, Karp NA, Lazic SE, Lidster K, MacCallum CJ, Macleod M, Pearl EJ, et al. The ARRIVE guidelines 2.0:Updated guidelines for reporting animal research. PLoS Biol. 2020;18:e3000410. doi: 10.1371/journal.pbio.3000410. [DOI] [PMC free article] [PubMed] [Google Scholar]
- 38.Reed TT. Lipid peroxidation and neurodegenerative disease. Free Radic Biol Med. 2011;51:1302–1319. doi: 10.1016/j.freeradbiomed.2011.06.027. [DOI] [PubMed] [Google Scholar]
- 39.Ryan MC, Notterpek L, Tobler AR, Liu N, Shooter EM. Role of the peripheral myelin protein 22 N-linked glycan in oligomer stability. J Neurochem. 2000;75:1465–1474. doi: 10.1046/j.1471-4159.2000.0751465.x. [DOI] [PubMed] [Google Scholar]
- 40.Sereda M, Griffiths I, Pühlhofer A, Stewart H, Rossner MJ, Zimmermann F, Magyar JP, Schneider A, Hund E, Meinck HM, Suter U, Nave KA. A transgenic rat model of Charcot-Marie-Tooth disease. Neuron. 1996;16:1049–1060. doi: 10.1016/s0896-6273(00)80128-2. [DOI] [PubMed] [Google Scholar]
- 41.Siems SB, Jahn O, Eichel MA, Kannaiyan N, Wu LMN, Sherman DL, Kusch K, Hesse D, Jung RB, Fledrich R, Sereda MW, Rossner MJ, Brophy PJ, Werner HB. Proteome profile of peripheral myelin in healthy mice and in a neuropathy model. eLife. 2020;9:e51406. doi: 10.7554/eLife.51406. [DOI] [PMC free article] [PubMed] [Google Scholar]
- 42.Szklarczyk D, Franceschini A, Wyder S, Forslund K, Heller D, Huerta-Cepas J, Simonovic M, Roth A, Santos A, Tsafou KP, Kuhn M, Bork P, Jensen LJ, von Mering C. STRING v10:protein-protein interaction networks, integrated over the tree of life. Nucleic Acids Res. 2015;43:D447–452. doi: 10.1093/nar/gku1003. [DOI] [PMC free article] [PubMed] [Google Scholar]
- 43.Volpi VG, Touvier T, D'Antonio M. Endoplasmic reticulum protein quality control failure in myelin disorders. Front Mol Neurosci. 2017;9:162. doi: 10.3389/fnmol.2016.00162. [DOI] [PMC free article] [PubMed] [Google Scholar]
- 44.Wang J, Lee J, Liem D, Ping P. HSPA5 Gene encoding Hsp70 chaperone BiP in the endoplasmic reticulum. Gene. 2017;618:14–23. doi: 10.1016/j.gene.2017.03.005. [DOI] [PMC free article] [PubMed] [Google Scholar]
- 45.Wang Z, Wei Q, Han L, Cao K, Lan T, Xu Z, Wang Y, Gao Y, Xue J, Shan F, Feng J, Xie X. Tenascin-c renders a proangiogenic phenotype in macrophage via annexin II. J Cell Mol Med. 2018;22:429–438. doi: 10.1111/jcmm.13332. [DOI] [PMC free article] [PubMed] [Google Scholar]
- 46.Watson JC, Dyck PJ. Peripheral neuropathy:a practical approach to diagnosis and symptom management. Mayo Clin Proc. 2015;90:940–951. doi: 10.1016/j.mayocp.2015.05.004. [DOI] [PubMed] [Google Scholar]
- 47.Weisz J, Uversky VN. Zooming into the dark side of human annexin-S100 complexes:dynamic alliance of flexible partners. Int J Mol Sci. 2020;21:5879. doi: 10.3390/ijms21165879. [DOI] [PMC free article] [PubMed] [Google Scholar]
- 48.Yuan A, Nixon RA. Neurofilament proteins as biomarkers to monitor neurological diseases and the efficacy of therapies. Front Neurosci. 2021;15:689938. doi: 10.3389/fnins.2021.689938. [DOI] [PMC free article] [PubMed] [Google Scholar]
Associated Data
This section collects any data citations, data availability statements, or supplementary materials included in this article.
Supplementary Materials
Overexposed calnexin western blotting.
The membrane of CMT1A (n = 5) and WT (n = 4) sciatic nerve samples were overexposed. The dash indicating 100 kDa is just above the observed calnexin bands. This means that calnexin is revealed at 90 kDa, as reported in other publications (Fazal et al., 2017). CMT1A: Charcot-Marie-Tooth-1A; WT: wild type.
PMP22 western blotting.
The intense peripheral myelin protein-22 (PMP22) bands corresponds to 22 kDa. Other bands are observed at higher molecular weight (indicated by blue arrows) probably corresponding to strong binding of PMP22 to chaperone proteins.


