

Abstract
This paper investigates ex-ante factors influencing international bank acquisition of FinTech companies from 2010–2018. Using hand-collected data, we show that bank boards with a larger female presence as well as those that have CEOs with longer tenure are more likely to pursue FinTech acquisitions. The financial performance also matters as banks with greater capital strength and liquidity are more likely to be acquirers. In line with prior expectations, banks with higher IT spending, suggesting greater in-house development of digital solutions, are less likely to target FinTech acquisitions. In addition, younger CEOs and banks with lower IT spending are also found to be more likely to make multiple FinTech acquisitions. The nationality diversity in the boardroom matters for cross-border bank-FinTech deals.
Supplementary Information
The online version contains supplementary material available at 10.1007/s10693-022-00396-x.
Keywords: FinTech, Bank acquisitions, Corporate governance, International Banking
Introduction
The recent emergence of technology-driven innovation in financial services, or “FinTech”, is significantly reshaping the banking industry.1 The digital shift marked by huge technological advances during the past decade is seen as unavoidable and unstoppable, forcing established banks to rethink their position in a rapidly changing landscape.2 Embracing new digital technology to successfully transform the old way of performing key functions represents an opportunity for traditional banks to leverage existing strengths and compete with new market participants. Such a transformation enables banks to promptly embrace the digital era and enhance their technological flexibility. The potential of FinTech adoption to improve banks’ productivity and efficiency, by reducing costs, is also likely to make the overall financial system more resilient and inclusive, opening the doors to under-banked and unbanked segments of the population (Carney 2017; Philippon 2019; Demir et al. 2020; Frost 2020).
With the aim of effectively responding to rising competition and pressure to innovate, incumbent banks can follow various approaches to engage with FinTech, such as ad-hoc partnerships, increasing investments in new technologies, and the acquisition of existing FinTech firms.3 Among this range of strategies, we particularly focus on acquisition activity and investigate a comprehensive set of ex-ante factors driving international banks to acquire FinTech players as compared to a group of non-acquiring banks. What are the main driving forces behind banks’ likelihood to acquire FinTech? Are domestic/cross-border acquisitions and single/multiple deals driven by different factors? This paper seeks to answer these two main research questions.
An acquisition strategy can shorten (costly) in-house development of new solutions, while effectively increasing a bank’s digital footprint. Moreover, despite the usual evaluation challenges associated with acquisitions, which can potentially be exacerbated in the case of FinTech, this strategy presents some key advantages in terms of exclusivity, rapid access to new clients/markets, and data security.4 According to KPMG (2018), FinTech mergers and acquisitions (M&As) in the banking industry are gaining momentum and are likely to be preferred over partnerships in order to meet strategic objectives.5 Examples of relevant deals, that occurred in 2017–2018 and are included in our dataset, are the acquisition by Deutsche Bank of Quantiguous Solutions, a FinTech start-up specializing in digital banking solutions, and those by ING and JPMorgan Chase with two providers active in the digital payments services (Payvision and WePay, respectively).6
In this study, we investigate a broad set of potential ex-ante factors driving banks to acquire FinTech companies. This paper contributes to the literature by extending the growing, yet still limited, empirical evidence on the relationship between FinTech and banking (Buchak et al. 2018; Claessens et al. 2018). Indeed, most of the existing studies are descriptive in nature (Vives 2017; Stulz 2019; Thakor 2020; amongst others). Moreover, prior research on bank M&As mainly focuses on (i) the ex-post valuation of M&As, in terms of performance and efficiency; and (ii) bank-specific characteristics associated with becoming a target in M&As (Hernando et al. 2009; Goddard et al. 2012; amongst others), while limited attention has been devoted to ex-ante factors.7 Our paper relates to the literature on firm boundaries (Rhodes-Kroph and Robinson 2008; Robinson 2008; Bena and Li 2014). For instance, Robinson (2008) develops a model that explains firms’ preference for strategic alliances over internal projects. Although we focus on M&As, rather than strategic alliances, these also lead to organizational changes where a set of resources is moved across firm boundaries. In a similar fashion, Rhodes-Kropf and Robinson (2008) investigate the element of “who buys whom” in the M&A activity. Bena and Li (2014) further underline the importance of understanding the ex-ante drivers of M&As in the corporate innovation context given their potential impact on the synergy (outcome) of the acquisitions. We thus contribute to the extant literature by informing on the specific features that lead banks to make acquisitions aimed at replacing (or complementing) outdated legacy technology and the shift toward digital banking business which can better address customers’ evolving demands. In addition, we gain insights into the underlying strategic approach followed by international banks in terms of their governance features, balance-sheet characteristics, and macroeconomic/institutional factors that determine the decision to buy a FinTech company. Furthermore, by examining a cross-country sample, we are also able to capture a greater degree of heterogeneity than in prior studies on bank M&As, which mostly focus on a single country/region (for instance, Focarelli et al. 2002; Pasiouras et al. 2011). To the best of our knowledge, our analysis substantially advances the understanding of banks' acquisition of FinTech companies and highlights the variation in the determining factors related to such activity.
In addition, we also extend the literature on CEOs’ individual characteristics and corporate behavior.8 Existing studies mainly focus on non-financial firms, so we add to this by focusing on the banking industry. Furthermore, the paper contributes to the scarce literature on CEOs’ personal traits and innovation.9 Finally, our analysis contributes to the literature on the relationship between board diversity and corporate acquisitions. Prior literature mainly looks at the impact of female directors on (i) corporate governance and firm performance (for instance, Adams and Ferreira 2009; Bennouri et al. 2018; Green and Homroy 2018); and (ii) firm risk-taking (Huang and Kisgen 2013; Sila et al. 2016; amongst others).10 More limited is the empirical evidence on the relationship between female board representation and corporate acquisitions. Board nationality diversity may also play a relevant role, given the greater possibility to exploit directors’ diverse functional backgrounds and skill sets, which can be beneficial when engaging in complex assessments, such as those involving innovation-driven acquisitions (Bantel and Jackson 1989). The question of how bank governance features in general, including board diversity, affects FinTech acquisitions is not explored (as far as we are aware) in the literature.
The first set of considered factors in our study embraces bank corporate governance characteristics. To the extent that technology acquisitions present unique features and challenges (Ranft and Lord 2002; Graebner et al. 2010), we believe that deals within the FinTech sector might present further distinctive characteristics, thereby requiring specific individual features. Nowadays, firm leaders must be sufficiently agile and prepared to quickly respond to the evolving environment, the changing customers’ needs and the advances in technology. In the finance industry, the pace at which new technologies are tested and incorporated is faster than ever before (Goldstein et al. 2019). Motivated by this, we anticipate that CEO-specific characteristics have a significant impact on corporate and strategic decisions (Bertrand and Schoar 2003; Yim 2013; Acemoglu et al. 2014; Serfling 2014; Wang and Yin 2018; Meyer-Doyle et al. 2019; Chen et al. 2020), including the likelihood to acquire a FinTech firm.11 In addition to the CEO characteristics, board size and composition variables are employed as supported by prior literature. In particular, empirical research highlights the significant impact of board characteristics on decision-making including acquisition decisions (Ferreira 2011, 2015; Masulis et al. 2012; Levi et al. 2014; Chen et al. 2016; Estélyi and Nisar 2016).
Second, we account for bank-specific factors. Focarelli et al. (2002) find that acquiring banks are on average more profitable than targets and driven by credit management objectives. Pasiouras et al. (2011) document a positive influence of profitability and growth prospects on banks’ decision to acquire. Empirical research by Beccalli and Frantz (2013) finds that size, growth, cost efficiency and capital strength influence the banks’ propensity to become acquirers. Lastly, with reference to the countries where the acquiring banks are located, we account for a set of macroeconomic and institutional factors, such as GDP growth, government effectiveness, and the number of physical bank branches.
By using an international sample, focusing on banks acquiring and non-acquiring FinTech companies over 2010–2018, we aim to identify which features at the governance-, bank-, and country-level drive (or impair) the acquisition decision. We use probit and multinomial probit models to conduct the empirical analysis to address our research questions. In addition, we also shed some light on the acquisition behavior of banks that acquire Fintech companies more than once, as well as the specific drivers behind cross-border deals.
We document a positive (inverse) association between the CEO tenure (CEO age) and the likelihood of banks’ FinTech acquisitions. Specifically, an increase of one standard deviation in CEO tenure (CEO age) increases (decreases) the probability to acquire a FinTech firm by approximately 5.7% (23%). A CEO in his/her role for a long time may have better knowledge and/or be able to exercise more power in the decision-making process (Harford and Li 2007). Younger CEOs may be more likely to acquire FinTech companies driven by stronger career-related incentives or the aim to be positively distinguished from their older peers (Prendergast and Stole 1996; Acemoglu et al. 2014; Yim 2013; Serfling 2014). For board-specific characteristics, we find that banks with a greater female presence are more likely to pursue FinTech acquisitions. In line with the growing interest in the impact of gender diversity on firm innovation (for instance, Griffin et al. 2021), we document that a decrease by one standard deviation in the percentage of men on the banks’ boards increases the probability to acquire a FinTech firm by approximately 19%. Interestingly, we find a significantly positive impact of board nationality diversity only for cross-border acquisitions, and this is most likely due to the nationally diverse board’s enhanced knowledge of international markets, regulatory regimes, and broader network contacts (Masulis et al. 2012; Estélyi and Nisar 2016).
For bank-specific factors, we show that banks with a stronger capital base and a higher degree of liquidity are more likely to acquire FinTech firms. This evidence suggests that a greater share of capital buffers may result in greater bank risk-taking, namely FinTech acquisition (Hannan and Pilloff 2004; Dell’Ariccia et al. 2014) and that banks can utilize their excess liquidity to pursue expansion via FinTech deals. Specifically, a one-standard-deviation increase of banks’ leverage (liquidity) leads to an increase in the likelihood to acquire FinTech by approximately 7.3% (9%). In addition, banks with a higher IT expenditure, which suggest greater in-house development of FinTech solutions, are less likely to target FinTech companies. Additional analysis, also finds that banks with lower IT expenditure have a greater propensity to acquire FinTech companies through multiple acquisitions. Furthermore, less efficient banks appear more likely to undertake multiple purchases suggesting a stronger motivation to acquire advanced technology to enhance cost efficiency.
Among macroeconomic and institutional factors, banks located in countries with weaker government effectiveness are more likely to acquire FinTech firms in cross-border deals. We contend that a less stringent regulatory framework presents a compelling feature in banks’ decision to acquire innovation outside national borders.
Lastly, we test whether our results are driven by banks that are, in general, more engaged in acquisition activity. In other words, FinTech-acquiring banks may merely be the same banks that actively undertake acquisitions even outside the FinTech industry. To address this concern, as a robustness check, we compare the number of non-FinTech acquisitions for each group (FinTech-acquiring and non-acquiring banks), and we confirm the lack of significant difference in the number of non-FinTech deals. Furthermore, we complement our main analysis by employing an alternative group of non-acquiring banks that are matched on the basis of a larger array of bank-specific characteristics. Our findings remain consistent.
The remainder of the paper is structured as follows. Section 2 discusses the relationship between FinTech and traditional banking. Section 3 presents the data and methodology. Section 4 reports the empirical results and robustness tests. Section 5 concludes the paper and discusses the key policy implications.
FinTech and Banking
In recent years, the growing importance of FinTech has substantially impacted the banking industry and modern technological innovations, ranging from robotics to Artificial Intelligence (AI) and Machine Learning (ML), are redefining the traditional way of doing banking business. Increasing is the pressure to become more digital in order to address growing sophisticated financial needs and to face competition from both external (non-banks) and internal (neo-banks) market operators that are better equipped to leverage technology.12 The potential for FinTech firms to offer cheaper and more tailored bank-like products to both individuals and corporates is posing a serious threat to traditional banks’ activity, with implications in terms of overall financial stability.13 The current position of incumbent banks is challenged especially in terms of market share, margins, and customer base, thereby creating the need for traditional banks to develop adequate strategic responses. While part of the ongoing debate underlines the disruptive character of FinTech, beneficial effects in terms of growing competition are also relevant. In this respect, timely adoption of technological innovations allows incumbents to gain an advantage relative to competitors while reducing the costs of intermediation and widening access to finance. The tension between stability and competition also fuels the heated discussion on FinTech and how to regulate it (Barba Navaretti et al. 2017).
The relationship between FinTech and banking is still evolving and under scrutiny by regulators, academics, and practitioners. However, clear is the urgency for the banking industry, which for a long time has remained largely untouched by external disruptive forces, to invest in digital technologies and comprehensively adapt to the modern digital age. The necessity to meet fast-changing consumer behaviors, attract new (tech-savvy) clients and maximize the existing customer base represent fundamental objectives, which assume even greater relevance in a context characterized by exceptionally low-interest rates that compress bank margins and profitability. Banks can undertake multiple approaches in order to engage with FinTech, depending on the established outcome, as well as the specific characteristics and cultures of the organizations. Among various options, which range from alliances to in-house development of new digital technologies, incumbents can acquire FinTech companies.14 The acquisition strategy ensures an exclusive relationship with the target, which is not achieved in the case of partial investments or other collaborative frameworks. Second, the acquisition of a FinTech firm allows traditional banks to reach, at a relatively low cost, new customers, and also can facilitate cross-selling opportunities. Rapidly accessing new markets is another positive outcome. Finally, the acquisition of a specialized FinTech firm allows banks to overcome the lack of in-house talent and expertise in new digital areas, and also entails advantages in terms of data and security protection, so that confidential information is not handled by third parties.
FinTech innovations mainly regard three product segments directly related to core banking functions (namely; payments, clearing and settlement services; credit, deposit and capital-raising services; and investment management services), as well as more general market support services (such as Blockchain and AI technologies), not specific to the banking industry. Based on a 2018 survey by the BCBS, the greatest share (41%) of FinTech firms operate in the area of digital payments, followed by those in the category of “credit, deposits, and capital raising services” (18%) and specializing into “investment management services” (9%). The widespread use of smartphones and mobile internet has driven the development and provision of new innovative payment solutions, especially in the retail segment. New market players compete with incumbent banks by offering a growing number of user-friendly and accessible payment methods, including “mobile wallets” and innovative point-of-sale (POS) payment services, which are of particular interest to younger generations (millennials).15 Peer-to-peer (P2P) arrangements, that directly link payers and payees and leverage distributed ledger technology (DLT), are making payments more convenient, instantaneous, and available 24/7 (Carstens 2020). The potential of new technology is also extending the options for cross-border, as well as wholesale payments. Cryptocurrencies, as opposed to fiat (standard) currencies, also represent a disruptive innovation within the fast-changing landscape of payments (Thakor 2020).
FinTech credit (P2P/marketplace lending), facilitated by digital platforms and without bank intermediation, represents an alternative source of funding for both businesses and individuals (Claessens et al. 2018). Buchak et al. (2018), with reference to the U.S. residential mortgage market during 2007–2015, discuss the rapid increase (from 10 to 25%) in online FinTech lenders’ share. In a related study, Fuster et al. (2019) find that FinTech lenders are faster than traditional banks in processing mortgages, without necessarily assuming a higher risk. As per Tang (2019), P2P lending complements bank lending in the case of small loans and credit expansion (associated with FinTech activity) and is likely to be limited to borrowers who already access traditional bank lending. Cornelli et al. (2020) in examining the development of alternative FinTech and BigTech credit worldwide, argue that these other forms of credit complement rather than substitute more traditional channels of credit. Thakor (2020) argues that established banks will not be replaced by P2P lenders, but predicts that the latter will contribute to making the credit market more competitive, potentially enhancing the efficiency of financial intermediation. Thus, in order to avoid significant loss in lending volumes, traditional banks will either have to (i) build their own platforms; (ii) acquire platforms; and/or (iii) partner with existing platforms. If FinTech operators benefit from the lower cost of search and verification, economies of scale in dealing with large amounts of data, and more secure transmissions of information, incumbent banks retain some key competitive advantages (for instance, in liquidity management services).
Connected to the multi-product nature of banking, established banks offer a wide range of bundled services and activities (for example, deposits, payment services, loans) to a consolidated large customer base, which enables the exploitation of powerful economies of scope (Barba Navaretti et al. 2017). Moreover, banks' funding costs are likely to be cheaper thanks to their convenient access to deposits and the presence of explicit and implicit public guarantees (Vives 2017). In this context, difficulties for online lending platforms to raise funds, especially during crisis times, could create an incentive for these innovative operators to sell themselves to banks, who in turn are keen to acquire digital advanced technologies (Financial Times 2020).16 Finally, the relatively light regulatory environment under which FinTech companies operate may become eroded as they become larger and start to resemble established banks. In this respect, FinTech firms' competitive advantage (and consequently lower costs) will diminish, and potential problems in dealing with more complex and burdensome regulation could arise (Barba Navaretti et al. 2017).
Empirical research design
Data and sample construction
A significant part of our study is represented by the collection and preparation of the dataset. To address our research questions, and increase data availability and flexibility, we construct a unique dataset based on multiple sources. Data on bank acquisitions are collected from S&P Global Market Intelligence (hereafter “S&P”). We only retain data for deals that are fully completed at the time of our data collection and whose target industry type is classified as “Financial Technology” by S&P. Based on their specialization, S&P classifies FinTech firms into nine sub-categories: (i) Banking Technology; (ii) Business Process Outsourcing; (iii) Digital Lending; (iv) Financial Media & Data Solution; (v) Human Resources & Payroll Technology; (vi) Insurance & Healthcare Technology; (vii) Investment & Capital Markets Technology; (viii) Payments; and (ix) Security Technology. Deals involving firms active in these categories qualify for our dataset.
Table 1 reports the distributions by country and by FinTech specialization of the acquisitions included in our study. FinTech firms specializing in “Payments” represent the most attractive targets for bank acquisitions, accounting for nearly 40% of the overall sample. Acquisitions of payment-specializing FinTech firms are also fairly equally spread across countries. In addition, while FinTech companies specializing in “Investment & Capital Markets Technology” represent a substantial portion of the total number of acquisitions in our sample (20%), they are predominantly targeted by U.S. banks. As in Pasiouras et al. (2007) and Beccalli and Frantz (2013), we only select acquisitions performed by bank-holding companies and commercial banks, in order to avoid the comparison among entities with significantly different business models. The average size of the deal is $207 million and the majority of the considered banks acquired 100% of the FinTech target’s equity.
Table 1.
Sample distribution. This table presents the distribution of the considered sample of FinTech acquisitions by country (rows) and by FinTech specialization (columns). The numbers in parentheses represent the cross-border deals with the country of the acquired FinTech company: AUS (Australia); BEL (Belgium); BRA (Brasil); CAN (Canada); CHE (Switzerland); CZE (Czech Republic); DEU (Germany); GBR (Great Britain); IND (India); IRL (Ireland); ITA (Italy); LUX (Luxembourg); NLD (Netherlands); NOR (Norway); NZL (New Zealand); SVN (Slovenia); USA (United States)
| Country | Banking Technology | Business Process Outsourcing | Digital Lending | Financial Media & Data Solution | Human Resources & Payroll Technology | Insurance & Healthcare Technology | Investment & Capital Markets Technology | Payments | Security Technology | N. Acquisition | Percentage |
|---|---|---|---|---|---|---|---|---|---|---|---|
| Australia | 1 | 3 (1 NZL) | 4 (1) | 3.80 (4.00) | |||||||
| Austria | 1 (1 CZE) | 1 (1) | 0.95 (4.00) | ||||||||
| Canada | 2 (1 USA) | 2 (1) | 1.90 (4.00) | ||||||||
| France | 1 | 2 (1 ITA) | 6 (1 BEL) | 9 (2) | 8.57 (8.00) | ||||||
| Germany | 1 (1 IND) | 1 | 1 | 2 (1 GBR) | 5 (2) | 4.76 (8.00) | |||||
| Iceland | 3 (2 GBR) | 3 (2) | 2.85 (8.00) | ||||||||
| Japan | 1 | 1 (1 USA) | 1 (1 USA) | 1 (1 LUX) | 4 (2 USA) | 8 (5) | 7.61 (20.00) | ||||
| Netherlands | 1 |
3 (1 GBR) (1 DEU) |
1 | 5 (2) | 4.76 (8.00) | ||||||
| New Zealand | 1 | 1 | 0.95 (0.00) | ||||||||
| Norway | 1 | 1 | 2 | 1.90 (0.00) | |||||||
| Spain | 3 (1 BRA) | 3 (1) | 2.85 (4.00) | ||||||||
| Sweden | 2 (1 NOR) | 2 (1) | 1.90 (4.00) | ||||||||
| Switzerland | 2 | 1 (1 AUS) | 2 (1 SVN) | 1 | 6 (2) | 5.71 (8.00) | |||||
| United Kingdom | 1 | 2 | 3 | 2.85 (0.00) | |||||||
| United States | 6 | 9 (1 NLD) | 3 | 5 | 4 (1 CAN) |
15 (1 GBR) (1 CHE) (1 IRL) |
8 | 1 | 51 (5) | 48.57 (22.00) | |
| Total | 13(1) | 10(2) | 7 (3) | 1 | 5 | 5(1) | 21(6) | 41(12) | 2 | 105 (25) | 100 (100) |
| Percentage |
12.38 (4.00) |
9.52 (8.00) |
6.66 (12.00) |
0.95 (0) |
4.76 (0) |
4.76 (4.00) |
20.00 (24.00) |
39.04 (48.00) |
1.90 (0) |
100 (100) |
Our final sample consists of 105 international FinTech acquisitions made by 80 banks in 15 OECD countries during the period 2010–2018.17 The limited size of the sample is primarily a feature of the focus of our research on a specific sub-category of banks’ acquisitions, that gradually grew in importance over the last decade.18 Moreover, we concentrate on a relatively stringent definition of “FinTech”, therefore leaving out acquisitions of targets active in related sectors (for instance, information technology), but not applied to finance. Table 2 details the multiple steps undertaken in order to filter our data and construct the sample.
Table 2.
Steps of sample construction
| FinTech-acquiring banks | N. Acquisitions (Observations) |
N. Entities |
|---|---|---|
| Step 1: Download worldwide acquisitions from S&P1 | 24,309 | 8,943 |
| Step 2: Keep only acquiring banks2 | 4,878 | 2,184 |
| Step 3: Keep only FinTech-acquiring banks3 | 156 | 109 |
| Step 4: Keep only FinTech-acquiring banks in OECD countries | 105 | 80 |
| FinTech-non-acquiring banks | ||
| Step 5: Construction of sample of FinTech-non-acquiring banks | (77,500) | 7,755 |
| PSM Matching strategy | Acquiring/Non-acquiring | Acquiring/Non-acquiring |
| Step 6: PSM matching estimation | 105/105 | 80/105 |
| Step 7: Inclusion of corporate governance variables based on information availability4 | 105/94 | 80/94 |
1All the acquisitions performed by financial institutions during the period 2010–2018
2Removal of non-bank financial institutions, as well as specialised banks
3Removal of banks acquiring targets other than what classified as “FinTech” according to S&P’s criteria. The difference between the number of acquisitions and the number of entities arises from the presence of multiple acquisitions made by the same entity. Only completed deals at the time of the search were retained
4In the final step of our sample construction, following the matching, 11 banks were removed from the control group given the lack of availability of key corporate governance variables
Our study requires additional data. We need a counterfactual and therefore relevant information on FinTech-non-acquiring banks. For this purpose, over the period 2010–2018, we identify 7,755 FinTech-non-acquiring banks in S&P, i.e. 77,500 bank-level observations. The number of FinTech-acquiring banks is fairly small compared to the number of FinTech-non-acquiring banks. According to Palepu (1986), when in prediction studies the number of acquiring firms is skewed in favour of non-acquiring firms, a matched sample is preferable over a random sample as the information content of the former is greater than the latter. This leads to relatively more accurate parameter estimates (Cosslett 1981; Imbens 1992). Indeed, Manski and Lerman (1977) and Manski and McFadden (1981) demonstrate that matched samples yield more efficient estimates compared to random samples of the same size. Several studies employ matching techniques to investigate the likelihood of acquisitions or bankruptcy (Hasbrouck, 1985; Charitou et al. 2004; Pasiouras and Gaganis 2007; Pasiouras et al. 2007). We, therefore, follow the common approach of matching acquiring banks with non-acquiring banks based on bank size and country of location (Brook et al. 2000; Pasiouras et al. 2007). Specifically, in order to obtain a group of non-acquiring banks with a comparable size to those FinTech-acquiring, per country of location, we match the two samples based on a propensity score matching (PSM) approach. Similar to Boubakri et al. (2021), we employ a matching with no replacement, so that non-acquiring banks can only be used once in the matching procedure.19
For both groups, FinTech acquiring and non-acquiring banks, we also gather a comprehensive set of governance- and firm-level characteristics. For the CEO- and board-specific variables, the data are hand-collected from banks’ annual reports and cross-checked with information from BoardEx. Bank-specific variables are obtained from Moody’s Bank Analytics (Bureau van Dijk), which provides standardized accounting information expressed in a common currency, therefore levelling differences in cross-country reporting and accounting conventions. Lastly, we retrieve key macroeconomic and institutional measures from the World Bank database.
Regression model and selected variables
This paper investigates whether governance, bank-specific financial features, and country-level factors influence the ex-ante probability of acquiring a FinTech firm. In line with prior literature on M&As, we rely on a probit model to assess the determining factors of banks’ acquisitions of Fintech firms (Cummins and Xie 2008; Elnahas and Kim 2017).20 Specifically, we estimate the following regression model:
| 1 |
where Y is a dummy variable describing the acquisition status. Y = 1 if a bank has acquired a FinTech firm in a given year, and Y = 0 otherwise. is a vector of CEO and board characteristics that we employ to gauge a bank’s probability to acquire a FinTech firm. is a vector of bank-specific and macroeconomic/institutional factors. All variables in vector Z refer to the year prior to the acquisition.21i = 1,2, …N indicates banks, t = 1, 2…T labels the year and j = 1, 2…N the countries. All model specifications include year fixed-effects (γ) to control for global conditions and common shocks.22
For in Eq. (1), we consider a variety of CEO and board characteristics as possible key drivers of banks’ acquisition of FinTech. Based on prior literature, we expect CEO characteristics to be relevant for the decision to acquire. Harris and Raviv (2005) argue that the acquisition decision is not delegated to lower-level managers and Graham et al. (2015) report that the CEO is the dominant decision-maker in M&As. Cain and McKeon (2016) find evidence of a significant association between the CEO’s (personal) risk-taking, measured by the CEO’s pilot license, and acquisition activity. They also document a positive link between CEO’s tenure and acquisition decisions. The existing literature consistently provides evidence of the significance of board characteristics on corporate governance and corporate policies. For instance, Berger et al. (2014) document a significant relationship between the demographic characteristics of executive boards and banks’ risk-taking.
CEO age
We employ CEO age (CEO_age) to assess whether this is a predictor of banks’ acquisition behavior. We predict an inverse relationship between the age of a CEO and the probability of acquiring a FinTech firm, for three reasons. First, as suggested by Yim (2013), younger CEOs face stronger incentives to acquire a FinTech firm as they have longer career horizons. Moreover, younger CEOs are more overconfident which, ultimately, leads to a higher number of acquisitions at the early stages of their careers. Second, younger CEOs are more open to radical innovation and, consequently, should be more prone to shift bank innovation strategy to pursue FinTech acquisitions (Acemoglu et al. 2014). Lastly, the literature suggests that younger CEOs tend to make bolder and riskier investments as a way to be distinguished from older CEOs and signal to the market their superiority (Prendergast and Stole 1996; Serfling 2014). In our research setting, this evidence may be reflected in a higher propensity of younger CEOs to acquire FinTech companies.
CEO duality
Following Hagendorff et al. (2010) and Hagendorff and Vallascas (2011), we consider whether the CEO also serves as chairman of the board, as a proxy for CEO power and control over the board (CEO_duality). In particular, we include a dummy variable which is equal to one if a CEO is also the chair of the board and zero otherwise. Based on prior evidence, the effect of CEO duality on the likelihood of acquisition can be mixed. Masulis et al. (2007) suggest that the separation between the CEO and chairman of the board results in higher-quality acquisitions. In contrast, CEO duality may entail a clearer direction from a single leader and therefore a faster and more effective decision-making process (Boyd 1995). In this respect, we can expect the dual position of a CEO to be better able to exercise a strong influence on the board, thereby pushing towards FinTech acquisitions.
CEO tenure
Following Ozkan (2012) and Berger et al. (2014), we include CEO tenure (CEO_tenure), measured as the number of years since becoming the CEO of the bank. The effect of CEO experience on FinTech acquisitions is not clear-cut. On the one hand, the longer the CEO has been in control of the bank, the more he/she should know about the bank’s capabilities and prospects. On the other hand, a relatively new CEO may be more likely to follow a more innovative acquisition strategy (Akhavein et al. 2005). Moreover, based on Harford and Li (2007), CEO tenure can also be a proxy for CEO power. Therefore, if a powerful CEO is more likely to undertake risky acquisitions, there may be a positive relationship between CEO tenure and the propensity to acquire FinTech.
Foreign CEO
We account for the nationality of CEOs by employing a dummy variable (CEO_foreigner), which assumes the value of one if a CEO’s nationality is different from where the bank is headquartered and zero otherwise. A foreign CEO may positively influence bank acquisition activity, given greater international experience and knowledge. Nevertheless, a CEO’s foreign experience does not necessarily imply superior managerial ability (Conyon et al. 2019).
CEO education
Educational background can be another relevant force behind a CEO’s decision-making. More educated CEOs may have greater cognitive complexity and this can suggest a stronger aptitude to take on new ideas and technological innovations (Barker and Mueller 2002). King et al. (2016) find that CEOs with MBAs increase bank performance by undertaking riskier or more innovative business models. In relation to corporate risk-taking, Farag and Mallin (2018) find a positive relationship between CEO education and corporate risk-taking. To investigate this aspect, we construct a dummy variable (CEO_education) which equals one if a CEO has a doctoral degree, and zero otherwise.
Board size
We use board size (Board_size) measured as the number of directors elected to the board (Cornett et al. 2003; Dahya et al. 2019). The relationship between board size and FinTech acquisition is not clear a priori. On the one hand, a larger board size may enrich the pool of available knowledge (Hagendorff et al. 2010), thereby improving the assessment of suitable targets for acquisitions. On the other hand, larger boards have the potential to be environments where a lack of communication and coordination prevails (Jensen 1993; Yermack 1996; Giannetti and Zhao 2019). This, in turn, may affect the capability of the board to undertake effective decisions regarding acquisitions.
Board gender diversity
We measure gender diversity in the banks’ boardroom (Gender_diversity) as the fraction of male directors over the total number of board members (Levi et al. 2014). In line with previous findings in the literature, we anticipate that the influence of board gender diversity on the decision to acquire FinTech can be mixed, both positive and negative. Women can be less risk-taking (Byrnes et al. 1999; Barber and Odean 2001) and less overconfident (Knight 2002) than men, and thus a female-predominant board may be slower to innovate via FinTech acquisition. Levi et al. (2014) and Chen et al. (2016) also document that a higher female board representation significantly reduces the likelihood to acquire. By contrast, Sapienza et al. (2009) find that women who are in the financial industry are less risk-averse than women in other industries. Adams and Funk (2012) show that women are more risk-loving than men and conclude that having a female director on the board need not lead to more risk-averse decisions. Berger et al. (2014) find that boards with a higher proportion of female executives tend to assume higher risk. Therefore, it is reasonable to expect that a larger fraction of female directors could positively contribute to the probability of acquisitions. Moreover, given that female directors are likely to improve board managerial skills (Zelechowski and Bilimoria 2004), boards that are more diversified are likely to be better equipped to identify the benefits of FinTech acquisitions.
Board nationality diversity
In addition to board gender diversity, in line with existing literature (Levi et al. 2014; García-Meca et al. 2015) we employ the fraction of foreign board members over the total number of members as a measure for board nationality diversity (National_diversity). Boards that are nationality-heterogeneous may exploit diverse functional backgrounds and skill-sets, which in turn can be beneficial when engaging in complex assessments, such as those involving innovation-driven acquisitions (Bantel and Jackson 1989). Masulis et al. (2012) empirically examine whether firms with foreign independent directors make better cross-border acquisitions, as suggested by Adams et al. (2010). They argue that the international expertise of foreign directors positively contributes to cross-border acquisitions. In addition, board diversity has the potential to expand board members’ networks. This, in turn, may support banks in accessing capital for acquisitions, enlarging contacts with business elites and bank regulators, which may result in a competitive advantage (Richard 2000). We expect a positive impact of board nationality diversity on the banks’ propensity to acquire FinTech firms, especially in cross-border deals.
For in Eq. (1), we follow previous studies (for instance, Focarelli et al. 2002; Pasiouras et al. 2011) that show the relevance of various bank-level features as driving factors of acquisitions, so we include several bank-specific variables (namely; equity to total assets; return on assets; cost to income ratio; liquidity; credit risk). Given our specific focus on FinTech acquisitions, we also account for the level of IT expenditure to account for potential in-house development of new digital solutions. In particular, we believe that the inclusion of this specific variable can help mitigate a potential bias caused by omitting relevant factors that could affect the decision to acquire FinTech as discussed in Sect. 2. Finally, relative to the country where the acquiring banks are located, we include macro- and institutional-level variables, such as (i) Gross Domestic Product (GDP) growth; (ii) government effectiveness; (iii) and the number of branches to 100,000 adults. All variables in vector Z refer to the year prior to the acquisition of FinTech-acquiring banks.
Equity to total assets
As in Hannan and Rhoades (1987) and Beccalli and Frantz (2013), we employ the equity to total assets ratio (E/TA) as a measure of bank capitalization. The effect of bank capital on the probability to engage in acquisitions, especially in FinTech, is not clear a priori. On the one hand, under the “excessive regulatory capital” hypothesis (Hannan and Pilloff 2004), banks that hold capital in excess of the regulatory requirements face a greater opportunity cost and may employ the extra capital for acquisition activities. Moreover, a larger capital buffer can entail greater bank risk-taking (Dell’Ariccia et al. 2014), and hence an increasing propensity to FinTech acquisitions. In this case, we expect a positive relationship between the level of bank capital and the probability of acquiring a FinTech firm. On the other hand, less capitalized banks with “less skin-in-the-game” (De Nicolò et al. 2010; Jiménez et al. 2014), may be prone to assume extra risk via FinTech acquisitions in the attempt of gambling for resurrection. In addition, to the extent that capital is an indicator of bank managerial efficiency, there could be an inverse relationship between E/TA and our dependent variable, given that banks with skillful managers are able to successfully operate with higher leverage.
Return on assets
As in Wheelock and Wilson (2000) and Focarelli et al. (2002), we employ the return on assets (ROA) to check whether profitable banks are more or less likely to engage in FinTech acquisitions. As for bank capitalization, the effect of bank profits on the ex-ante probability of acquiring a FinTech firm is not straightforward. For instance, we expect profitability to be positively associated with FinTech acquisition, given that more profitable banks may dispose of more resources to be channelled to acquisitions. However, there may be an inverse relationship as less profitable banks can engineer ways to boost bank profits via high-tech-driven acquisitions. In addition, recent studies (Molyneux et al. 2019, 2020) have shown that low interest rates, especially when prolonged, compress bank margins and profitability. This pushes banks to find alternative ways to support profits in low interest rate environments. Since our sample period covers a period of generally low interest rates worldwide, this may result in a negative link between profitability and FinTech acquisition.
Cost to income
In line with the extant literature (Focarelli et al. 2002; Molyneux 2003; Pasiouras and Gaganis 2007; Hernando et al. 2009; amongst others), we employ the cost to income ratio (Cost_to_income), defined as the operating cost that is necessary to generate one unit of income. We expect a negative relationship with our dependent variable, as efficient banks (with a lower cost to income ratio) are more likely to stay competitive by looking for innovative options to cut costs and improve expense management. In this regard, as highlighted in Vives (2017) and BCBS (2018), FinTech provides advanced technologies that can effectively enhance bank efficiency. However, since the banking industry is rather inefficient relative to other economic sectors (Philippon 2019), less efficient banks may exploit FinTech acquisitions to improve their condition. Moreover, as shown by Andreeva et al. (2019), banks with profitability issues have generally high cost to income ratios. Hence, a positive relationship may be revealed if innovation-driven acquisitions could help high cost to income ratio banks reduce their costs.
Liquidity
Following Pasiouras et al. (2011), we use the ratio of liquid assets to customers and short-term funding as a measure of bank liquidity (Liquidity). We expect a positive relationship between bank liquidity and the probability to acquire a FinTech firm, given that more liquid banks can employ the excess liquidity to pursue profitable acquisition opportunities.
Credit risk
We include the ratio of non-performing loans to gross loans (NPLs), as a measure of ex-post credit risk. We predict a positive relationship between NPLs and the probability to acquire a FinTech firm given that advances in digital technology improve monitoring and screening functions thanks to the enhanced ability to collect, process, and store information (Liberti and Petersen 2019; Pierri and Timmer 2020). However, high levels of NPLs act as a drag on bank capital resources, and this may reduce the potential for acquisition.
IT expenditure
To account for banks’ in-house development of new digital solutions, we include the ratio of information technology (IT) expenditure to operating expenses (IT_expenditure). Banks with large and well-established IT departments tend to develop proprietary IT systems and technologies (Alt et al. 2018). Accordingly, we expect an inverse association between IT_expenditure and banks’ propensity to acquire FinTech.
GDP growth
In line with Rossi and Volpin (2004), we employ the growth rate of nominal GDP (GDP_growth) as investment decisions made by banks may be affected by overall economic conditions. For instance, banks may be more likely to acquire FinTech companies if located in countries experiencing economic booms.
Government effectiveness
In line with prior studies (Beltratti and Paladino 2013; Deng and Yang 2015), we include a World Bank government effectiveness indicator (Gov_effectiveness) that reflects perceptions of the quality of (i) public services; (ii) civil service and its independence from political pressure; (iii) policy formulation and implementation; and (iv) credibility of the government’s commitment to these policies. More or less stringent regulations and policies can influence banks’ decisions to seek acquisition opportunities, including deals in the FinTech sphere.
Number of bank branches
Finally, we employ the number of bank branches per hundred thousand individuals (N.branches) as a proxy for the traditional bank business model (Chiorazzo et al. 2018). The influence of this indicator on banks’ propensity to acquire FinTech is not clear a priori. We expect an inverse relationship if physical branches remain central to the prevalent bank business model, as means to build long-lasting relationships based on frequent personal interactions. In this sense, there may be a reduced incentive for digital innovation. A positive association may also be expected as banks with substantial branches may be able to realize greater synergies through linking acquired FinTech firms with existing infrastructures.
Descriptive statistics
With reference to both the group of FinTech-acquiring and matched non-acquiring banks, Table 3 reports the descriptive statistics for each variable included in the empirical analysis for the entire sample period (2010–2018). In addition, we report the t-test for the difference in the means between the two groups.
Table 3.
Descriptive statistics. This table presents the descriptive statistics for each variable for FinTech-acquiring and non-acquiring banks. The column “Diff” reports the p-value from the t-test on the difference between the means of the two groups. The variables are defined in Table 9 in Appendix A
| FinTech-acquiring banks | FinTech-non-acquiring banks | Diff | |||||||||
|---|---|---|---|---|---|---|---|---|---|---|---|
| Variables | Obs | Mean | St. Dev | Min | Max | Obs | Mean | St. Dev | Min | Max | |
| Panel A. CEO and board variables | |||||||||||
| CEO_tenure | 104 | 5.47 | 4.97 | 0.08 | 35.30 | 94 | 5.52 | 4.95 | 0 | 21.50 | 0.93 |
| CEO_age | 105 | 55.95 | 6.36 | 38 | 72 | 91 | 67.25 | 6.88 | 53 | 81 | 0.00 |
| CEO_duality | 105 | 0.42 | 0.42 | 0 | 1 | 91 | 0.40 | 0.49 | 0 | 1 | 0.71 |
| CEO_foreigner | 105 | 0.42 | 0.49 | 0 | 1 | 94 | 0.50 | 0.50 | 0 | 1 | 0.32 |
| CEO_education | 101 | 0.09 | 0.30 | 0 | 1 | 90 | 0.15 | 0.36 | 0 | 1 | 0.24 |
| Board_size | 104 | 11.94 | 4.44 | 5 | 29 | 91 | 14.75 | 3.48 | 7 | 25 | 0.00 |
| Gender_diversity (%) | 104 | 63.48 | 20.89 | 0 | 100 | 91 | 77.58 | 24.63 | 0 | 100 | 0.00 |
| National_diversity (%) | 104 | 16.58 | 22.90 | 0 | 70 | 91 | 13.56 | 21.89 | 0 | 80 | 0.34 |
| Panel B. Bank variables | |||||||||||
| E/TA (%) | 105 | 9.35 | 3.42 | 4.33 | 14.68 | 94 | 8.36 | 3.50 | 4.33 | 14.98 | 0.04 |
| ROA (%) | 105 | 0.80 | 0.80 | -3.90 | 3.01 | 94 | 0.28 | 0.89 | -3.90 | 1.62 | 0.00 |
| Cost_to_income (%) | 105 | 64.83 | 12.24 | 37.91 | 97.10 | 94 | 65.87 | 15.32 | 37.91 | 106.47 | 0.59 |
| Liquidity (%) | 105 | 32.59 | 30.06 | 2.15 | 118.65 | 94 | 18.53 | 20.18 | 1.60 | 103.54 | 0.00 |
| NPLs (%) | 105 | 2.03 | 2.25 | 0 | 13.01 | 94 | 2.94 | 2.51 | 0.20 | 13.01 | 0.01 |
| IT_expenditure (%) | 105 | 9.64 | 5.82 | 1.02 | 31.49 | 94 | 9.28 | 4.23 | 1.17 | 24.10 | 0.62 |
| Panel C. Macroeconomic and institutional variables | |||||||||||
| Gov_effectiveness | 105 | 105 | 1.59 | 0.19 | 1.02 | 94 | 1.53 | 0.24 | 0.44 | 2.05 | 0.09 |
| GDP_growth (%) | 105 | 105 | 2.14 | 0.98 | -2.87 | 94 | 1.03 | 1.97 | -5.41 | 3.83 | 0.00 |
| N.branches | 105 | 105 | 31.79 | 10.79 | 5.50 | 94 | 36.90 | 17.19 | 12.44 | 104.20 | 0.01 |
Panel A of Table 3 refers to the CEO and board characteristics. Our results show that among various CEO characteristics, the CEO_age variable demonstrates a significant difference between the two groups. In particular, CEOs of FinTech-acquiring banks are on average 11 years younger than CEOs of non-acquiring banks and this difference is statistically significant. With respect to the board-specific variables, Board_size and Gender_diversity are significantly different for the two groups. Specifically, it appears that FinTech-acquiring banks tend to have a smaller board size and a greater female presence, compared to non-acquiring banks. The National_diversity variable does not appear to be significantly different between the two groups.
Panel B of Table 3 compares the bank-specific characteristics of the two groups. On average, FinTech-acquiring banks tend to be better capitalized (higher E/TA) and more profitable (higher ROA), with greater liquid assets and lower NPLs in comparison to non-acquiring banks. Surprisingly, no significant differences are revealed in terms of Cost_to_income or IT_expenditure.
Lastly, Panel C refers to the macroeconomic and institutional variables. While the difference in government effectiveness is marginally significant, the other two variables (i.e. GDP_growth and N.branches) display more significant differences.
Empirical results
Bank propensity to acquire FinTech
In this section, by using a probit regression (Eq. (1)), we investigate the ex-ante driving factors of bank FinTech acquisitions. In Sect. 3.3, in a univariate setting, we explored the differences between the two groups of FinTech-acquiring and non-acquiring banks. However, central to our analysis is the aim of capturing the simultaneous impact of the selected factors on our dependent variable. We, therefore, proceed by investigating the marginal effects of our variables in a multivariate framework.
Table 4 reports the estimated results. We begin by separately investigating the effects of CEO- and board-specific factors (columns 1 and 2) to then include bank, macroeconomic and institutional variables (columns 3 and 4). The reported results in columns 1 and 3 are without year-fixed effects, while those in columns 2 and 4 account for them. The relatively small differences between models with and without year-fixed effects suggest that our findings are not sensitive to time effects. Model specifications 1 and 2 show that a CEO with a longer tenure is more likely to acquire FinTech companies (the related coefficient is statistically significant at the 1% level). Specifically, an increase by one standard deviation in CEO_tenure increases the probability to acquire a FinTech firm by approximately 5.7%.23 Our results, therefore, indicate that a CEO who has been in his/her role for a longer time may have a better knowledge of the bank-specific possibilities and prospects and/or be able to exercise more power in the decision-making process (Harford and Li 2007).
Table 4.
Bank propensity to acquire FinTech. This table presents the estimated marginal effects of the probit regression. The dependent variable is an indicator variable equal to one if a bank acquires a FinTech company during 2010–2018, and zero otherwise. Robust standard errors appear in parentheses. *, **, and *** indicate significance at the 10%, 5%, and 1% level, respectively
| (1) | (2) | (3) | (4) | |
|---|---|---|---|---|
| CEO- and board-characteristics | ||||
| CEO_tenure | 0.0190*** | 0.0178*** | 0.0119*** | 0.0115*** |
| (0.0039) | (0.0034) | (0.0030) | (0.0026) | |
| CEO_age | -0.0399*** | -0.0361*** | -0.0303*** | -0.0348*** |
| (0.0021) | (0.0024) | (0.0027) | (0.0053) | |
| CEO_duality | 0.0341 | 0.0373 | 0.0301 | 0.0414 |
| (0.0405) | (0.0377) | (0.0389) | (0.0446) | |
| CEO_foreigner | -0.1621*** | -0.1531*** | -0.0966** | -0.1187*** |
| (0.0520) | (0.0457) | (0.0452) | (0.0419) | |
| CEO_education | -0.0588 | -0.0321 | 0.0554 | 0.1113** |
| (0.0446) | (0.0514) | (0.0413) | (0.0474) | |
| Board_size | 0.0038 | 0.0004 | 0.0059 | 0.0006 |
| (0.0057) | (0.0053) | (0.0049) | (0.0039) | |
| Gender_diversity | -0.0065*** | -0.0063*** | -0.0070*** | -0.0086*** |
| (0.0008) | (0.0008) | (0.0009) | (0.0016) | |
| National_diversity | -0.0009 | -0.0009 | -0.0002 | 0.0009 |
| (0.0008) | (0.0007) | (0.0009) | (0.0009) | |
| Bank-, macroeconomic-, and institutional-characteristics | ||||
| E/TA | 0.0209*** | 0.0211*** | ||
| (0.0069) | (0.0071) | |||
| ROA | 0.0325 | 0.0377 | ||
| (0.0457) | (0.0545) | |||
| Cost_to_income | 0.0001 | 0.0020 | ||
| (0.0015) | (0.0015) | |||
| Liquidity | 0.0041*** | 0.0036*** | ||
| (0.0011) | (0.0010) | |||
| NPLs | -0.0091 | -0.0303** | ||
| (0.0100) | (0.0142) | |||
| IT_expenditure | -0.0060 | -0.0098** | ||
| (0.0043) | (0.0045) | |||
| GDP_growth | 0.0726*** | 0.0759*** | ||
| (0.0195) | (0.0221) | |||
| Gov_effectiveness | -0.0016 | -0.0020** | ||
| (0.0010) | (0.0008) | |||
| N.branches | 0.0003 | 0.0028 | ||
| (0.0017) | (0.0017) | |||
| Obs | 184 | 184 | 184 | 184 |
| Year Fe | No | Yes | No | Yes |
| Wald Chi2 | 41.40 | 81.79 | 88.67 | 107.88 |
| Log pseudolikelihood | -44.25 | -35.85 | -29.39 | -21.12 |
| Pseudo R2 | 0.65 | 0.71 | 0.77 | 0.82 |
We find a negative and statistically significant (at the 1% level) relationship between CEO_age and the likelihood to acquire FinTech firms. An increase by one standard deviation in CEO_age decreases the probability to acquire a FinTech firm by approximately 23%. As discussed in Sect. 3.2, younger CEOs may be more likely to acquire FinTech companies driven by stronger career-related incentives or the aim to be positively distinguished from their older peers. We also document a negative and statically significant (at the 1% level) relation between CEO_foreigner and propensity to acquire FinTech firms. Foreign CEOs are about 12% less likely to engage in these deals compared to CEOs who are born in the same country where the bank is headquartered. We contend that foreign CEOs might be too culturally distant from the country of the bank’s headquarters, lacking the required familiarity with the economic environment. Consequently, it may be harder for foreign CEOs to identify profitable investment opportunities.24
Among the board characteristics, we find that Gender_diversity is inversely associated with the propensity towards FinTech acquisition, which is also consistent with the univariate evidence previously discussed. Banks with a larger proportion of female directors are more likely to acquire FinTech firms. Specifically, a decrease by one standard deviation in Gender_diversity increases the probability to acquire a FinTech firm by approximately 19% This relationship could be driven by several channels, according to prior literature. Female directors in banks may not be necessarily more risk-averse than male directors (Adams and Funk 2012; Berger et al. 2014), or female directors may effectively contribute to improving board managerial skills (Zelechowski and Bilimoria 2004). Therefore, bank boardrooms with more women may be better equipped to identify the benefits of FinTech acquisitions and the related shift towards increased digitalization. The presence of foreign directors does not reveal a significant impact on banks’ likelihood to acquire FinTech, suggesting a lack of relevance of national diversity in the boardroom.
Results for the most comprehensive model specifications (columns 3 and 4) confirm the relevance of CEO- and board-specific characteristics in explaining banks’ propensity to acquire FinTech. The inclusion of additional bank, macroeconomic, and institutional factors does not alter the overall results. The magnitude of coefficients on the CEO- and board-specific variables slightly decrease, but CEO_tenure, CEO_age, CEO_foreigner, and Gender_diversity remain highly statistically significant. Moreover, when controlling for year-fixed effects (column 4), the coefficient on CEO_education turns statistically significant at the 5% level, suggesting that highly educated CEOs (CEOs with doctoral degrees) are more likely to acquire FinTech companies.
Bank-, macroeconomic- and institutional-specific factors appear to play a significant role in driving FinTech acquisition. For bank-level characteristics, E/TA and Liquidity, for which we previously find positive and significant differences between the treated and control groups, reveal highly significant results (at the 1% level) in the probit regressions (columns 3 and 4). An increase of one standard deviation in E/TA and Liquidity increases the bank’s probability to acquire a FinTech firm by approximately 7.3% and 9%, respectively. Banks with a stronger capital base and a higher degree of liquidity are more likely to acquire FinTech firms. In this respect, our results appear to be consistent with the “excessive regulatory capital” hypothesis (Hannan and Pilloff 2004), as well as with the argument that larger capital buffers result in greater bank risk-taking, represented by FinTech acquisitions in our case (De Nicolò et al. 2010). The positive coefficient on the Liquidity variable is consistent with our prior expectation that banks with higher liquid resources can use these for acquisition opportunities.
Moreover, the negative impact of NPLs becomes statistically significant, at the 5% level, after controlling for year-fixed effects (column 4). As we discussed in Sect. 3.2, this evidence might be due to the detrimental impact that high ex-post credit risk has on bank capital and consequently on the likelihood to undertake acquisitions. Moreover, this negative impact on acquisition activity becomes more evident after controlling for year-fixed effects possibly due to some market-wide risks that banks might commonly face. Unsurprisingly, we find an inverse association between IT expenditure and our dependent variable, whose statistical significance varies depending on the model specification. As discussed in Sect. 3.2, we include IT_expenditure as a measure of a bank’s in-house development of FinTech solutions, as an alternative strategy to externally acquire FinTech. Accordingly, the negative coefficient on IT_expenditure would suggest that a bank with larger spending on in-house technology is less likely to acquire FinTech companies.
With regard to the macroeconomic and institutional factors, we find a positive relationship with GDP_growth and an inverse association with Gov_effectiveness. This indicates that banks’ investment decisions are related to overall economic conditions. More specifically, banks located in countries with higher GDP growth and lower government effectiveness are more likely to acquire FinTech firms. Banks experiencing a positive business cycle and upside economic trends might be more prone to engage in acquisitions due to the greater availability of resources. Banks in countries with less stringent regulations and policies appear to seek more acquisition opportunities.
Additional analyses
In this section, we further exploit the information we have in our acquisition dataset. By means of multiprobit regressions, we, therefore, perform additional analyses on domestic versus cross-border acquisitions and single versus multiple acquisitions. Our econometric identification takes the following form:
| 2 |
where Y = 0 indicates FinTech-non-acquiring banks. Y = 1 refers to banks that acquire a domestic (single) FinTech firm in a given year, whilst Y = 2 indicates banks that engage in cross-border (multiple) FinTech acquisitions. The corporate governance, bank- and country-specific characteristics employed in Eq. (2) are the same as in Eq. (1).
Domestic versus cross-border acquisitions
Cross-border acquisitions, as opposed to domestic deals, may entail more challenges due to differences in culture, regulation, or legal systems (Mantecon 2009). Institutional and cultural values might be unfamiliar to the acquirer and differences might exist in terms of accounting practices and/or disclosure requirements, as well as the legal environment. The greater degree of uncertainty and information asymmetry involved in cross-border acquisitions can thus lower the value of the exchanged assets and explain the underperformance of buyers in these deals (Andrade et al. 2001; Denis et al. 2002). On the other hand, the acquisition of foreign assets can represent a significant opportunity for the acquirer in terms of improved risk management, enhanced technology and conducive government policies (Moeller et al. 2005). Therefore, although domestic and cross-border acquisitions conceptually occur for the same reason, namely the increased value and/or utility from the perspective of the acquiring firm, deals across national borders might present specific peculiarities (Erel et al. 2012). As a result, the ex-ante drivers of domestic and cross-border acquisitions may be different. While prior contributions have focused on (i) the differences between domestic and cross-border bank acquisitions (Altunbaş and Marqués, 2008; Hernando et al. 2009); (ii) the drivers of cross-border deals (Focarelli and Pozzolo 2001; Molyneux 2003; Gulamhussen et al. 2016); and (iii) the impediments to international acquisitions (Buch and DeLong 2004), there exists a void in the literature on the potential difference between the determining factors of banks’ FinTech acquisitions within and across countries.
Among our selected driving factors, we expect the two nationality-related variables, CEO_foreigner and National_diversity, to display substantial differences between domestic and cross-border acquisitions. We predict CEO_foreigner to be especially relevant for cross-border acquisitions, given the enhanced foreign knowledge and international networks of foreign CEOs (Estélyi and Nisar 2016). With a similar underlying explanation, we also expect that National_diversity, at the board level, plays a more prominent role in the case of cross-border deals. As argued by Masulis et al. (2012), who empirically examine whether firms with foreign directors make better cross-border acquisitions, we expect that the international expertise of foreign directors is more likely to result in cross-border acquisitions, including FinTech deals.
Focarelli and Pozzolo (2001), as well as Buch and DeLong (2004), highlight the significance of the regulatory landscape for cross-border bank M&As, attaching a pivotal role to national governments and regulation, especially, in cross-border deals. In our setting we, therefore, expect Gov_effectiveness to be a relevant factor in driving banks’ cross-border acquisitions. On the one hand, we expect banks in countries with a higher Gov_effectiveness are more likely to target domestic FinTech companies to be benefited from the effectiveness of the domestic government. On the other hand, the lack of national government effectiveness may push banks to acquire FinTech firms cross-border to gain from greater regulatory effectiveness. We also include N.branches as the prevailing bank business model of the country where banks operate would also affect their acquisition strategy towards FinTech players with the aim of advancing their digital transformation.
Table 5 presents how CEO_foreigner, National_diversity, Gov_effectiveness, and N.branches are associated with domestic (column 1) and cross-border (column 2) acquisitions.25 Overall, the results are consistent with our expectations. A foreign CEO appears to be less likely to acquire a FinTech company within the same country where the bank is located, but more prone to acquire one in a different country (although only the coefficient in column 1 is statistically significant). For National_diversity, we document a positive and statistically significant (at the 5% level) relationship in the case of cross-border acquisitions and an inverse association in the case of domestic deals.
Table 5.
Domestic vs. Cross-border FinTech acquisitions. This table presents the estimated results of the multiprobit regression when distinguishing between domestic and cross-border FinTech acquisitions. The dependent variable is an indicator variable equal to (i) zero if a bank does not acquire any FinTech company during 2010–2018; (ii) one if a bank acquires a domestic FinTech company during 2010–2018; and (iii) two if a bank acquires FinTech across the borders during 2010–2018. Robust standard errors appear in parentheses. *, **, and *** indicate significance at the 10%, 5%, and 1% level, respectively
| (1) | (2) | |
|---|---|---|
| Domestic | Cross-border | |
| CEO_foreigner | -0.2379** | 0.1047 |
| (0.0977) | (0.0794) | |
| National_diversity | -0.0041** | 0.0051** |
| (0.0018) | (0.0020) | |
| Gov_effectiveness | 0.0038 | -0.0065** |
| (0.0029) | (0.0033) | |
| N.branches | 0.0065 | -0.0033 |
| (0.0060) | (0.0053) | |
| Obs | 184 | 184 |
| Year Fe | Yes | Yes |
| Wald Chi2 | 277.06 | 277.06 |
| Log pseudolikelihood | -39.53 | -39.53 |
| Pseudo R2 | 0.77 | 0.77 |
| Bank controls | Yes | Yes |
| Country controls | Yes | Yes |
The results for country-level variables also provide interesting insights. We document a significantly negative impact of Gov_effectiveness only for cross-border acquisitions (column 2). This evidence supports our expectation that banks located in countries with a lower Gov_effectiveness are more likely to target FinTech firms outside national borders. In the case of N.branches, findings are lacking statistical significance both for domestic and cross-border acquisitions.
Single versus multiple acquisitions
Furthermore, we test whether the ex-ante driving factors differ between single and multiple FinTech acquisitions. Ahern (2008) documents that “serial acquirers” are the norm and not the exception. In particular, the author finds that only 38% of M&A deals from 1980 to 2004 are undertaken by first-time acquirers. In our sample, we have 65 single acquisitions and 42 multiple deals.26 The rationale for a firm to engage in multiple acquisitions is still unclear and central to an ongoing debate in the finance literature (Aktas et al. 2009). In this respect, the motives for multiple FinTech deals remain unexplored and it is therefore challenging to develop a priori expectations. However, considering consistent evidence provided in the relevant literature on the positive relation between CEO overconfidence and acquiring behavior (Malmendier and Tate 2008; Aktas et al. 2009), we anticipate that an overconfident and/or powerful CEO would be more likely to undertake multiple acquisitions. Among the selected CEO characteristics, we, therefore, expect a specific relevance of CEO age and duality in the case of multiple FinTech acquisitions. Younger CEOs are potentially also more open to radical innovation and thus aggressively undertake FinTech acquisitions (Acemoglu et al. 2014). In addition, the higher overconfidence associated with younger CEOs may play a relevant role (Billet and Qian 2008). With regard to CEO_duality, we expect that this contributes to the bank’s likelihood to acquire multiple times due to faster and more effective decision-making stemming from a single leader (Boyd 1995).
A priori, we also expect two bank-specific factors to be relevant drivers for multiple FinTech acquisitions. First, we believe that less efficient banks (with a lower Cost_to_income) are more likely to be multiple acquirers in order to enhance efficiency by adopting advanced technology (Vives 2017). Second, we expect banks with a higher IT_expenditure to engage less in multiple acquisitions, given that they internally invest to develop new digital solutions and therefore have less incentive to make multiple FinTech acquisitions.
Table 6 presents the results for our key variables in this additional test, for both single (column 1) and multiple (column 2) acquisitions. Our findings indicate that the age of the CEO maintains its relevance also in the case of multiple deals. A younger CEO is more likely to acquire more than once, as suggested by the negative and statistically significant (at the 1% level) coefficient in column 2. Furthermore, the duality characteristic appears to assume relevance in the case of multiple deals, thereby suggesting that a CEO who also serves as chairman of the board is more likely to engage in more than one FinTech acquisition.
Table 6.
Single vs. Multiple FinTech acquisitions. This table presents the estimated results of the multiprobit regression when distinguishing between single and multiple FinTech acquisitions. The dependent variable is an indicator variable equal to (i) zero if a bank does not acquire any FinTech company during 2010–2018; (ii) one if a bank acquires a single FinTech company during 2010–2018; and (iii) two if a bank engages in multiple FinTech acquisitions during 2010–2018. Robust standard errors appear in parentheses. *, **, and *** indicate significance at the 10%, 5%, and 1% level, respectively
| (1) | (2) | |
|---|---|---|
| Single | Multiple | |
| CEO_age | -0.0210*** | -0.0151*** |
| (0.0072) | (0.0047) | |
| CEO_duality | -0.0885 | 0.1356** |
| (0.0686) | (0.0616) | |
| Cost_to_income | -0.0017 | 0.0044* |
| (0.0030) | (0.0027) | |
| IT_expenditure | 0.0025 | -0.0102** |
| (0.0073) | (0.0051) | |
| Obs | 184 | 184 |
| Year Fe | No | Yes |
| Wald Chi2 | 248.89 | 248.89 |
| Log pseudolikelihood | -69.31 | -69.31 |
| Pseudo R2 | 0.64 | 0.64 |
| Bank controls | Yes | Yes |
| Country controls | Yes | Yes |
For bank-specific factors, we find that banks that are less efficient (with a higher Cost_to_income) and have a lower IT_expenditure are more likely to be multiple acquirers. Less efficient banks appear to be more aggressive in acquiring FinTech companies in order to achieve cost efficiency gains via the adoption of new technology. As discussed in Sect. 3.2, and in line with the results for our main regressions, an inverse and significant (at the 5% level) relationship is documented between IT_expenditure and the propensity to engage in multiple FinTech acquisitions.
Robustness checks
In the previous sections, we highlight the main ex-ante factors driving banks’ FinTech acquisitions. However, although our main focus is on FinTech deals, it is possible that banks that are more likely to undertake acquisitions, in general, also undertake FinTech acquisitions. For instance, we document that banks’ capital and liquidity are positively related to the propensity to acquire FinTech companies. Given that banks with higher capital and liquid assets can use these to exploit acquisition opportunities, it can be argued that our results are driven by high capital and liquid banks that are more likely to engage in acquisitions, regardless of whether the target is a FinTech company or not. To address this concern, we conduct two analyses. First, we compare the number of non-FinTech acquisitions of the two groups (FinTech-acquiring and non-acquiring banks). If the FinTech-acquiring incumbents are banks that, in general, are more active in the acquisition sphere, then we should expect these banks to have a significantly higher number of non-FinTech acquisitions.
Table 7 reports the number of non-FinTech acquisitions undertaken by the FinTech-acquiring and non-acquiring banks. On average, during the same sample period, the two groups acquire a similar number of non-FinTech firms (1.76 and 1.89, respectively), and the corresponding mean difference is lacking statistical significance. This test addresses the potential concern that FinTech-acquiring banks are merely more engaged in acquisition activity, not just limited to FinTech.
Table 7.
Non-FinTech acquisitions. This table reports the average values and standard deviations of the number of non-FinTech acquisitions by FinTech-acquiring and non-acquiring banks. “Obs.” indicates the number of banks in each group. The reference period is 2010–2018. The row “Diff” reports the p-value from the t-test on the difference between the means of the two groups
| Obs | Mean | St. Dev | |
|---|---|---|---|
| All | 384 | 1.83 | 0.26 |
| FinTech-acquiring banks | 190 | 1.76 | 0.31 |
| FinTech-non-acquiring banks | 194 | 1.89 | 0.41 |
| Diff | 0.80 |
Next, we build an alternative group of FinTech-non-acquiring banks using a different matching procedure and examine whether our main findings are confirmed. While our original matching strategy is based on bank size and country of location, here we include additional bank-specific characteristics that would be related to the acquisition activity of banks. In particular, we consider E/TA, ROA, Cost_to_income, Liquidity, and NPLs and obtain a matched group of FinTech-non-acquiring banks, with very similar balance-sheet characteristics.27 In this setting, therefore, our focus is solely on the role of corporate governance factors as potential driving forces behind banks’ propensity to acquire FinTech.
Table 8 presents the estimated results of Eq. (1) using the alternative matching strategy. Given that the main bank-specific factors are employed in the matching criteria, they are excluded from the probit model. In Table 8, columns 1 and 2 report the results for CEO- and board-level characteristics, without and with year-fixed effects, respectively. Overall, our main findings are generally consistent also when employing an alternative and more parsimonious matching strategy. In particular, among the CEO characteristics, albeit a marginal change in terms of statistical significance, we document positive effects of CEO_tenure and CEO_education and inverse relations of CEO_age. Under this alternative matching exercise, and compared to our main findings, the coefficient on CEO_foreigner turns insignificant, while the positive relationship with CEO_duality gains some statistical significance.
Table 8.
Bank propensity to acquire FinTech using an alternative matching strategy. This table presents the estimated marginal effects of the probit regression. The dependent variable is an indicator variable equal to one if a bank acquires a FinTech company during 2010–2018, and zero otherwise. Robust standard errors appear in parentheses. *, **, and *** indicate significance at the 10%, 5%, and 1% level, respectively
| (1) | (2) | |
|---|---|---|
| CEO- and board-characteristics | ||
| CEO_tenure | 0.0095* | 0.0084 |
| (0.0055) | (0.0061) | |
| CEO_age | -0.0291*** | -0.0287*** |
| (0.0051) | (0.0052) | |
| CEO_duality | 0.1247* | 0.1187* |
| (0.0669) | (0.0701) | |
| CEO_foreigner | 0.1061 | 0.1095 |
| (0.0758) | (0.0765) | |
| CEO_education | 0.1590* | 0.1778* |
| (0.0952) | (0.0983) | |
| Board_size | -0.0144* | -0.0141* |
| (0.0087) | (0.0086) | |
| Gender_diversity | -0.0078*** | -0.0073*** |
| (0.0028) | (0.0027) | |
| National_diversity | -0.0036** | -0.0037*** |
| (0.0013) | (0.0013) | |
| Obs | 146 | 146 |
| Year Fe | No | Yes |
| Wald Chi2 | 63.47 | 66.64 |
| Log pseudolikelihood | -64.65 | -64.01 |
| Pseudo R2 | 0.35 | 0.36 |
| Country controls | Yes | Yes |
More robust results are shown for board characteristics. For instance, the impact of Gender_diversity is highly statistically significant (at the 1% level), once again suggesting the relevance of a greater presence of women drives FinTech acquisitions and therefore innovation. Board_size, which was lacking statistical significance in our main regressions, here assumes an inverse relation with the banks’ propensity to acquire, which is marginally significant at the 10% level, in both model specifications. National_diversity in the boardroom, which appeared to be a relevant driver for cross-border acquisitions, here reveals an inverse relationship with the banks’ likelihood to acquire FinTech. The corresponding statistically significant coefficients suggest that a wider nationality diversity may not necessarily improve boards’ efficacy (Anderson et al. 2011), thereby holding back banks’ decision to engage in FinTech deals.
In a further robustness test, we examine whether our results remain consistent even after excluding the acquisitions of less than 100% of the FinTech target’s equity. We confirm that there are 28 banks that acquired less than 100% of the target’s equity in our sample. In untabulated results, we find that the results are overall aligned to those discussed for the main analysis, lending support to our main findings.
Conclusions and policy implications
This paper investigates the ex-ante drivers of banks’ propensity to acquire FinTech firms. Using hand-collected bank governance and financial information, as well as various economic and institutional variables, our empirical analysis investigates the nuances underlying banks’ decisions to acquire FinTech firms. We find that CEO tenure positively influences the decision to make a FinTech acquisition whereas CEO age has an inverse relationship. Bank boards with a greater female presence are also more likely to pursue FinTech acquisitions. The financial performance of acquirers is also key, as banks with greater capital strength and liquidity are more likely to acquire FinTech firms. Banks with a higher IT expenditure, which may indicate in-house development of advanced digital solutions, are less likely to target FinTech companies. Banks with younger CEOs and lower IT spending are more likely to undertake multiple FinTech acquisitions. A greater nationality diversity in the boardroom appears to be conducive to FinTech cross-border deals.
Our investigation assumes particular relevance in the context where traditional banks are seeking to maintain their customer base, improve their efficiency, and adapt to the new digital era. The adoption of advanced technology can liberate resources otherwise constrained and support a re-focus on core activities where banks are better able to leverage their consolidated strengths. In this respect, exploiting the opportunities and flexibility associated with FinTech, by strategically engaging in acquisitions, is an increasingly compelling option for incumbents.
Furthermore, in light of the latest developments worldwide (COVID-19 pandemic), banks’ shift towards digitalization has rapidly accelerated in order to meet consumers’ increasing preference for online and innovative services. A trend that, most likely, will persist once the pandemic is over. Based on this, understanding the reasons why banks opt to acquire FinTech firms to leverage their advanced technology is of particular interest to both policymakers and academics. At the least, we show that having solvent and more liquid banks, along with other governance and economic/institutional factors, all contribute to explaining banks' expansion into the FinTech business. Future research calls for investigation into the medium and long-term benefits of digital technology adoption in the banking industry, as well as the evolving regulation and supervision of these new business areas.
Electronic supplementary material
Below is the link to the electronic supplementary material.
Acknowledgements
We are grateful to Professor Dimitris Andriosopoulos, as well as seminar participants at Strathclyde Business School, for their valuable comments and suggestions. We thank Donna Irving for the excellent research assistance.
Appendix A
Table 9
Table 9.
Description of the variables. This table provides the definitions of the variables employed in the empirical analysis. The associated expected signs for the coefficients on the variables are also reported
| Variable | Label | Definition | Exp sign |
|---|---|---|---|
| CEO variables | |||
| CEO tenure | CEO_tenure | The number of years since being appointed as a CEO | ± |
| CEO age | CEO_age | CEO age in years | - |
| CEO duality | CEO_duality | Dummy variable: 1 if the CEO is chairman of the board, 0 otherwise | ± |
| Foreign CEO | CEO_foreigner | Dummy variable: 1 if the CEO’s nationality is different from where the bank is headquartered, 0 otherwise | ± |
| CEO education | CEO_education | Dummy variable: 1 if the CEO holds a doctoral degree, 0 otherwise | + |
| Board variables | |||
| Board size | Board_size | The number of directors elected to the board | ± |
| Board gender diversity | Gender_diversity | The fraction of male directors to the total number of board members | ± |
| Board nationality diversity | National_diversity | The fraction of foreign board members to the total number of board members | + |
| Bank variables | |||
| Equity to total assets | E/TA | The ratio of equity to total assets | ± |
| Return on assets | ROA | The ratio of net income to total assets | ± |
| Cost to income | Cost_to_income | The ratio of operating expenses to operating income | ± |
| Liquid assets | Liquidity | The ratio of liquid assets to customers and short-term funding | + |
| Credit risk | NPLs | The ratio of non-performing loans to gross loans | + |
| IT expenditure | IT_expenditure | The ratio of IT expenses to operating expenses | - |
| Macroeconomic and institutional variables | |||
| GDP growth | GDP_growth | The yearly growth rate of nominal GDP. This variable is computed relative to the country where the acquiring bank is located | + |
| Government effectiveness | Gov_effectiveness | It captures the perceptions of the quality of public services, the quality of the civil service and the degree of its independence from political pressure, the quality of policy formulation and implementation, and the credibility of the government’s commitment to such policies. Estimates range from -2.5 (lowest value) to 2.5 (highest value). This variable is computed relative to the country where the acquiring bank is located | ± |
| Number of branches | N.branches | The number of bank branches for a hundred thousand individuals. This variable is computed relative to the country where the acquiring bank is located | ± |
Table 10
Table 10.
PSM: Covariates Balancing. The table reports the Size (measured by the logarithm of bank total assets) for the groups of FinTech-acquiring and FinTech-non-acquiring banks before and after the matching. Results refer to the first matching strategy, as discussed in Sect. 3.1
| Sample | Before Matching | After Matching | ||||
|---|---|---|---|---|---|---|
| Variable | FinTech-acquiring Banks | FinTech-non-acquiring Banks | P-value | FinTech-acquiring Banks | FinTech-non-acquiring Banks | P-value |
| Size | 17.97 | 11.71 | 0.00 | 17.94 | 17.93 | 0.99 |
Figure 1
Fig. 1.
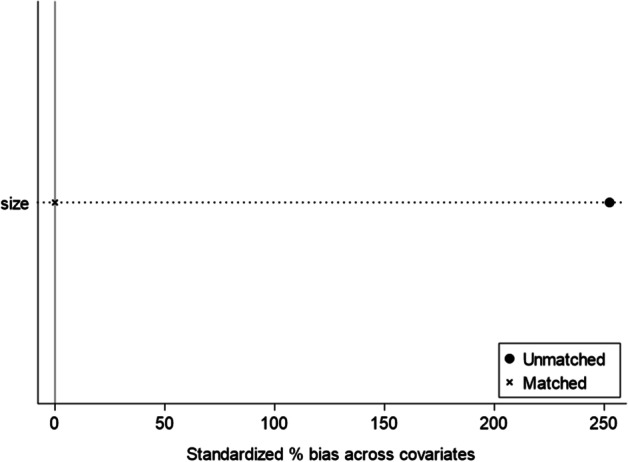
Standardized bias across covariates. The graph displays the standardized bias (%) across covariates (in the case of the first matching strategy, Size) for the groups of FinTech-acquiring and FinTech-non-acquiring banks before and after the matching
Table 11
Table 11.
Correlation matrix. This table reports the pairwise correlation coefficients between the variables included in the empirical analysis. Bold values indicate a statistical significance at the 5% level. The definition of the variables is provided in Table 9
| 1 | 2 | 3 | 4 | 5 | 6 | 7 | 8 | 9 | 10 | 11 | 12 | 13 | 14 | 15 | 16 | 17 | |
|---|---|---|---|---|---|---|---|---|---|---|---|---|---|---|---|---|---|
| CEO_tenure (1) | 0.22 | 0.10 | -0.28 | 0.09 | -0.13 | 0.15 | 0.00 | 0.11 | 0.12 | -0.03 | -0.15 | 0.09 | -0.06 | 0.05 | 0.00 | 0.03 | |
| CEO_age (2) | 0.22 | 0.19 | -0.03 | 0.05 | 0.34 | 0.15 | -0.18 | -0.06 | -0.16 | 0.04 | -0.22 | 0.11 | -0.17 | -0.27 | -0.16 | 0.03 | |
| CEO_duality (3) | 0.10 | 0.19 | -0.26 | -0.16 | 0.17 | 0.18 | -0.11 | 0.15 | -0.04 | 0.06 | -0.08 | 0.00 | -0.07 | -0.02 | -0.01 | -0.17 | |
| CEO_foreigner (4) | -0.28 | -0.03 | -0.26 | 0.15 | 0.31 | -0.26 | 0.22 | -0.26 | -0.00 | -0.08 | 0.29 | 0.25 | 0.09 | -0.08 | -0.06 | 0.06 | |
| CEO_education (5) | 0.09 | 0.05 | -0.16 | 0.15 | 0.12 | 0.14 | 0.17 | -0.04 | 0.04 | 0.02 | -0.04 | -0.05 | -0.01 | 0.03 | 0.10 | -0.14 | |
| Board_size (6) | -0.13 | 0.34 | 0.17 | 0.31 | 0.12 | 0.10 | 0.03 | -0.26 | -0.23 | 0.16 | 0.02 | 0.22 | -0.01 | 0.23 | -0.14 | -0.07 | |
| Gender_diversity (7) | 0.15 | 0.15 | 0.18 | -0.26 | 0.14 | 0.10 | 0.08 | -0.06 | -0.08 | -0.12 | -0.15 | 0.02 | -0.01 | 0.05 | -0.05 | 0.07 | |
| National_diversity (8) | 0.00 | -0.18 | -0.11 | 0.22 | 0.17 | 0.03 | 0.08 | -0.18 | -0.00 | 0.03 | 0.22 | 0.04 | 0.28 | 0.06 | 0.21 | -0.04 | |
| E/TA (9) | 0.11 | -0.06 | 0.15 | -0.26 | -0.04 | -0.26 | -0.06 | -0.18 | 0.08 | -0.02 | -0.06 | -0.11 | -0.09 | 0.11 | -0.03 | -0.02 | |
| ROA (10) | 0.12 | -0.16 | -0.04 | -0.00 | 0.04 | -0.23 | -0.08 | -0.00 | 0.08 | -0.28 | 0.08 | -0.30 | 0.03 | 0.28 | 0.04 | 0.01 | |
| Cost_to_income (11) | -0.03 | 0.04 | 0.06 | -0.08 | 0.02 | 0.16 | -0.12 | 0.03 | -0.02 | -0.28 | 0.11 | -0.01 | 0.10 | -0.06 | 0.05 | -0.07 | |
| Liquidity (12) | -0.15 | -0.22 | -0.08 | 0.29 | -0.04 | 0.02 | -0.15 | 0.22 | -0.06 | 0.08 | 0.11 | 0.03 | 0.24 | 0.06 | 0.06 | -0.05 | |
| NPLs (13) | 0.09 | 0.11 | 0.00 | 0.25 | -0.05 | 0.22 | 0.02 | 0.04 | -0.11 | -0.30 | -0.01 | 0.03 | -0.11 | -0.27 | -0.33 | 0.23 | |
| IT_expenditure (14) | -0.06 | -0.17 | -0.07 | 0.09 | -0.01 | -0.01 | -0.01 | 0.28 | -0.09 | 0.03 | 0.10 | 0.24 | -0.11 | 0.17 | 0.19 | -0.13 | |
| GDP_growth (15) | 0.05 | -0.27 | -0.02 | -0.08 | 0.03 | 0.23 | 0.05 | 0.06 | 0.11 | 0.28 | -0.06 | 0.06 | -0.27 | 0.17 | 0.17 | -0.24 | |
| Gov_effectiveness (16) | 0.00 | -0.16 | -0.01 | -0.06 | 0.10 | -0.14 | -0.05 | 0.21 | -0.03 | 0.04 | 0.05 | 0.06 | -0.33 | 0.19 | 0.17 | -0.52 | |
| N.Branches (17) | 0.03 | 0.03 | -0.17 | 0.06 | 0.14 | -0.07 | 0.07 | -0.04 | -0.02 | 0.01 | -0.07 | -0.05 | 0.23 | -0.13 | -0.24 | -0.52 |
Data Availability
The data that support the findings of this study are available from the corresponding author upon reasonable request.
Declarations
Conflicts of interests
The authors have no relevant financial or non-financial interests to disclose.
Footnotes
The Financial Stability Board (FSB 2017, p.7) defines FinTech as “technology-enabled financial innovation that could result in new business models, applications, processes, or products with an associated material effect on financial markets and institutions and the provision of financial services”. This definition has also been adopted by the Basel Committee on Banking Supervision (BCBS).
The current and third phase of FinTech, where non-bank players use new key technologies to provide financial services directly to clients, started around the 2008-global financial crisis (Thakor 2020). The initial phase, between 1866–1967, refers to the first transatlantic cable and the introduction of the telegraph. The second phase, between 1967–2008, regards the rise and development of electronic payments and clearing systems, as well as the Automated Teller Machines (ATMs) and online banking.
Based on a KPMG survey (KPMG, 2017), “emergining FinTech” represents the greatest source of disruption for financial instutions, followed by “growing global regulatory complexity” and “new business models”.
Acquisition, rather than internal development, can be a preferred strategy when the targeted resources are distant from the acquirer’s area of expertise or when rapidity is key (Capron and Mitchell 2009; Lee and Lieberman 2010).
Besides these considerations, our focus on acquisitions, rather than other forms of integration, has been also motivated by the data. Specifically, we were able to retrieve systematically organized and clearly filtered data on banks’ FinTech acquisitions (refer to Sect. 3.1).
The terms of the acquisition of Quantiguous Solutions, as well as those of WePay, have not been disclosed. ING has paid €260 million to acquire a 75% stake in Payvision.
Refer to Amel et al. (2004) and DeYoung et al. (2009) for detailed reviews of the international evidence on ex-post effects of M&As in the financial sector.
A relatively large body of literature (Bliss and Rosen 2001; Datta et al. 2001; Hagendorff and Vallascas 2011; among others) focuses on the relationship between CEO’s personal wealth benefits and acquisitions.
In a seminal contribution, Bantel and Jackson (1989) explore the relationship between the personal features of banks’ top managers and innovation adoptions. The authors show that more innovative banks are led by more educated and diverse teams. Yadav et al. (2007) demonstrate that the CEO’s attentional focus plays a crucial role in driving innovation. Outside the banking sphere, Galasso and Simcoe (2011) argue that overconfident CEOs, who potentially underestimate risks, are more likely to promote innovation. Custódio et al. (2019) argue that firms led by more generalist CEOs tend to produce more patents.
With reference to the banking industry, a number of contributions explore how boardroom gender diversity affects bank risk (Berger et al. 2014; Palvia et al. 2015; Farag and Mallin 2017; Cardillo et al. 2020; Arnaboldi et al. 2021; amongst others).
The digitalisation process must be driven by the top, fostering innovation within the entire organisation, while changing the existing culture. For instance, the current CEO of JPMorgan Chase, Jamie Dimon, has declared the intention of the bank to become more aggressive and creative in its acquisition strategy, by especially targeting FinTech firms. Refer to www.pymnts.com/news/banking/2020/jpmorgan-ceo-bank-plans-fintech-other-acquisitions/.
Neo-banks are digital financial firms that extensively use technology to provide retail banking services, mainly through smartphones and internet-based platforms. Successful examples of neo-banks are Atom and Monzo in the UK, N-26 in Germany, Webank in China, Simple and Varo Money in the U.S, KakaoBank in South Korea.
As per Stulz (2019, p.86), the “typical FinTech company is a specialised firm that challenges a specific product line of banks”. In contrast, BigTech companies, such as Alibaba, Amazon, Apple or Google, are large and established technological platforms in the market for digital services, not only limited to financial services.
In addition, in order to access technology, banks can lead and/or participate as FinTech accelerators, incubators and training programmes.
In some regions, the increasing competition between non-bank firms and banks in payment services has been also promoted by the phenomenon of “Open Banking”, which has led banks to open up information on their customers to third parties.
In order to fund their lending activity, online platforms rely on credit markets and/or individual investors, who could significantly cut down their investments, especially during highly distressed periods, such as the current pandemic situation.
Table 1 in the Online Appendix reports the distribution over time of the FinTech and non-FinTech acquisitions undertaken by the banks in our sample.
However, our sample size is comparable to that of previous studies that consider standard banks’ acquisitions over more extended sample periods. For instance, Minnick et al. (2011) examine the impact of CEO compensation on banks’ acquisition decisions utilising 159 deals during 1997–2005. Hagendorff and Vallascas (2011), in order to explore the relation between CEO pay incentives and bank risk-taking, employ a sample of 172 acquisitions during 1993–2007.
Specifically, the counterfactual is created via a logit model and we apply one-to-one nearest neighbour, imposing a tolerance level on the maximum propensity score distance (caliper) between acquiring and non-acquiring banks equal to 0.01 (Dehejia and Wahba 2002; Anderson et al. 2017). As evident from Table 10 in Appendix A, following the PSM, the size difference between the FinTech-acquiring banks and the matched FinTech-non-acquiring banks is not statistically significant, with a 0.99 p-value. Figure 1 in Appendix A reinforces the evidence that the matching exercise has produced two groups of banks of comparable size, with no significant differences.
In a robustness test, reported in the Online Appendix, we also perform our main analysis by using a logit regression model. Results are consistent.
Refer to Table 9 in Appendix A for details on the way the selected variables are constructed.
We consider a comprehensive set of factors to minimize potential omitted variable bias. In order to avoid potential multicollinearity issues, we perform a correlation analysis, for which the results are reported in Table 11 in Appendix A, and calculated the variance inflation factor, which is found to be 1.40.
The economic magnitude of the results is computed on the basis of the most comprehensive model specification (namely, column 4).
However, the CEO’s nationality is proven to be relevant in the case of cross-border acquisitions. This aspect will be investigated in Sect. 4.2.1.
As for the main regressions presented in Sect. 4.1, we include all our selected variables. However, in the interests of brevity, in the current section, we report and discuss only the results for the variables that are central to our additional analyses.
In particular, 65 banks engage in a single acquisition whilst 15 banks engage in multiple acquisitions. On average, banks acquire 1.33 FinTech companies over the sample period. Five is the highest number of acquisitions undertaken by a single bank.
As for our main matching strategy, we apply one-to-one nearest neighbor with no replacement and impose a tolerance level on the maximum propensity score distance (caliper) between the treatment and the control group equal to 0.01. Based on this alternative procedure, we match fewer (89) observations.
Publisher's Note
Springer Nature remains neutral with regard to jurisdictional claims in published maps and institutional affiliations.
References
- Adams RB, Ferreira D. Women in the boardroom and their impact on governance and performance. J Financ Econ. 2009;94:291–309. doi: 10.1016/j.jfineco.2008.10.007. [DOI] [Google Scholar]
- Adams RB, Funk P. Beyond the glass ceiling: does gender matter? Manag Sci. 2012;58:219–235. doi: 10.1287/mnsc.1110.1452. [DOI] [Google Scholar]
- Adams RB, Hermalin BE, Weisbach MS. The role of boards of directors in corporate governance: a conceptual framework and survey. J Econ Lit. 2010;48:58–107. doi: 10.1257/jel.48.1.58. [DOI] [Google Scholar]
- Akhavein J, Frame WS, White LJ. The diffusion of financial innovations: an examination of the adoption of small business credit scoring by large banking organizations. J Bus. 2005;78:577–596. doi: 10.1086/427639. [DOI] [Google Scholar]
- Aktas N, de Bodt E, Roll R. Learning, hubris and corporate serial acquisitions. J Corp Finan. 2009;15:543–561. doi: 10.1016/j.jcorpfin.2009.01.006. [DOI] [Google Scholar]
- Alt R, Beck R, Smits MT. FinTech and the transformation of the financial industry. Electron Markets. 2018;28:235–243. doi: 10.1007/s12525-018-0310-9. [DOI] [Google Scholar]
- Altunbaş Y, Marqués D. Mergers and acquisitions and bank performance in Europe: the role of strategic similarities. J Econ Bus. 2008;60:204–222. doi: 10.1016/j.jeconbus.2007.02.003. [DOI] [Google Scholar]
- Amel D, Barnes C, Panetta F, Salleo C. Consolidation and efficiency in the financial sector: a review of the international evidence. J Bank Financ. 2004;28:2493–2519. doi: 10.1016/j.jbankfin.2003.10.013. [DOI] [Google Scholar]
- Anderson RC, Reeb DM, Upadhyay A, Zhao W. The economics of director heterogeneity. Financ Manag. 2011;40:5–38. doi: 10.1111/j.1755-053X.2010.01133.x. [DOI] [Google Scholar]
- Anderson CW, Huang J, Torna G. Can investors anticipate post-IPO mergers and acquisitions? J Corp Finan. 2017;45:496–521. doi: 10.1016/j.jcorpfin.2017.05.006. [DOI] [Google Scholar]
- Andrade G, Mitchell M, Stafford E. New evidence and perspectives on mergers. J Econ Perspect. 2001;15(2):103–120. doi: 10.1257/jep.15.2.103. [DOI] [Google Scholar]
- Arnaboldi F, Casu B, Gallo A, Kalotychou E, Sarkisyan A. Gender diversity and bank misconduct. J Corp Financ. 2021;71:101834. doi: 10.1016/j.jcorpfin.2020.101834. [DOI] [Google Scholar]
- Bantel KA, Jackson SE. Top management and innovations in banking: does the composition of the top team make a difference? Strateg Manag J. 1989;10:107–124. doi: 10.1002/smj.4250100709. [DOI] [Google Scholar]
- Barba Navaretti G, Calzolari G, Pozzolo A. Fintech and banking. Friends or foes? Eur Econ Banks Regul Real Sect. 2017;2:9–30. [Google Scholar]
- Barber BM, Odean T. Boys will be boys: gender, overconfidence, and common stock investment. Quart J Econ. 2001;116:261–292. doi: 10.1162/003355301556400. [DOI] [Google Scholar]
- Barker VL, Mueller GC. CEO characteristics and firm R&D spending. Manag Sci. 2002;48:782–801. doi: 10.1287/mnsc.48.6.782.187. [DOI] [Google Scholar]
- Beccalli E, Frantz P. The determinants of mergers and acquisitions in banking. J Financ Serv Res. 2013;45:265–291. doi: 10.1007/s10693-012-0138-y. [DOI] [Google Scholar]
- Beltratti A, Paladino G. Is M&A different during a crisis? Evidence from the European banking sector. J Bank Financ. 2013;37:5394–5405. doi: 10.1016/j.jbankfin.2013.02.004. [DOI] [Google Scholar]
- Bena J, Li K. Corporate innovations and mergers and acquisitions. J Financ. 2014;69(5):1923–1960. doi: 10.1111/jofi.12059. [DOI] [Google Scholar]
- Bennouri M, Chtioui T, Nagati H, Nekhili M. Female board directorship and firm performance: what really matters? J Bank Financ. 2018;88:267–291. doi: 10.1016/j.jbankfin.2017.12.010. [DOI] [Google Scholar]
- Berger AN, Kick T, Schaeck K. Executive board composition and bank risk taking. J Corp Financ. 2014;28:48–65. doi: 10.1016/j.jcorpfin.2013.11.006. [DOI] [Google Scholar]
- Bertrand M, Schoar A. Managing with style: the effect of managers on firm policies. Quart J Econ. 2003;118:1169–1208. doi: 10.1162/003355303322552775. [DOI] [Google Scholar]
- Billet MT, Qian Y. Are overconfident managers born or made? Evidence of self-attribution bias from frequent acquirers. Manag Sci. 2008;54:1037–1051. doi: 10.1287/mnsc.1070.0830. [DOI] [Google Scholar]
- Bliss RT, Rosen RJ. CEO compensation and bank mergers. J Financ Econ. 2001;61:107–138. doi: 10.1016/S0304-405X(01)00057-5. [DOI] [Google Scholar]
- Boyd BK. CEO duality and firm performance: a contingency model. Strateg Manag J. 1995;16:301–312. doi: 10.1002/smj.4250160404. [DOI] [Google Scholar]
- Brook Y, Hendershott RJ, Lee D. Corporate governance and recent consolidation in the banking industry. J Corp Financ. 2000;6:141–164. doi: 10.1016/S0929-1199(00)00011-0. [DOI] [Google Scholar]
- Buch CM, DeLong G. Cross-border bank mergers: what lures the rare animal? J Bank Financ. 2004;28:2077–2102. doi: 10.1016/j.jbankfin.2003.08.002. [DOI] [Google Scholar]
- Buchak G, Matvos G, Piskorski T, Seru A. Fintech, regulatory arbitrage, and the rise of shadow banks. J Financ Econ. 2018;130:453–483. doi: 10.1016/j.jfineco.2018.03.011. [DOI] [Google Scholar]
- Byrnes JP, Miller DC, Schafer WD. Gender differences in risk taking: a meta-analysis. Psychol Bull. 1999;125:367. doi: 10.1037/0033-2909.125.3.367. [DOI] [Google Scholar]
- Cain MD, McKeon SB. CEO personal risk-taking and corporate policies. J Financ Quant Anal. 2016;51:139–164. doi: 10.1017/S0022109016000041. [DOI] [Google Scholar]
- Capron L, Mitchell W. Selection capability: how capability gaps and internal social frictions affect internal and external strategic renewal. Organ Sci. 2009;20:294–312. doi: 10.1287/orsc.1070.0328. [DOI] [Google Scholar]
- Cardillo G, Onali E, Torluccio G. Does gender diversity on banks' boards matter? Evidence from public bailouts. J Corp Financ. 2020;71:101570. [Google Scholar]
- Charitou A, Neophytou E, Charalambous C. Predicting corporate failure: empirical evidence for the UK. Eur Account Rev. 2004;13(3):465–497. doi: 10.1080/0963818042000216811. [DOI] [Google Scholar]
- Chen G, Crossland C, Huang S. Female board representation and corporate acquisition intensity. Strateg Manag J. 2016;37:303–313. doi: 10.1002/smj.2323. [DOI] [Google Scholar]
- Chen G, Huang S, Meyer-Doyle P, Mindruta D. Generalist versus specialist CEOs and acquisitions: two-sided matching and the impact of CEO characteristics on firm outcomes. Strateg Manag J. 2020;6:1184–1214. [Google Scholar]
- Chiorazzo V, D'Apice V, DeYoung R, Morelli P. Is the traditional banking model a survivor? J Bank Financ. 2018;97:238–256. doi: 10.1016/j.jbankfin.2018.10.008. [DOI] [Google Scholar]
- Conyon MJ, Hass LH, Vergauwe S, Zhang Z. Foreign experience and CEO compensation. J Corp Finan. 2019;57:102–121. doi: 10.1016/j.jcorpfin.2017.12.016. [DOI] [Google Scholar]
- Cornett MM, Hovakimian G, Palia D, Tehranian H. The impact of the manager–shareholder conflict on acquiring bank returns. J Bank Financ. 2003;27:103–131. doi: 10.1016/S0378-4266(01)00210-2. [DOI] [Google Scholar]
- Cosslett SR. Efficient estimation of discrete choice models. In: Manski CF, McFadden D, editors. Structural analysis of discrete data with econometric applications. Cambridge: MIT Press; 1981. [Google Scholar]
- Cummins JD, Xie X. Mergers and acquisitions in the US property-liability insurance industry: productivity and efficiency effects. J Bank Financ. 2008;32:30–55. doi: 10.1016/j.jbankfin.2007.09.003. [DOI] [Google Scholar]
- Custódio C, Ferreira MA, Matos P. Do general managerial skills spur innovation? Manag Sci. 2019;65:459–476. doi: 10.1287/mnsc.2017.2828. [DOI] [Google Scholar]
- Dahya J, Golubov A, Petmezas D, Travlos NG. Governance mandates, outside directors, and acquirer performance. J Corp Financ. 2019;59:218–238. doi: 10.1016/j.jcorpfin.2016.11.005. [DOI] [Google Scholar]
- Datta S, Iskandar-Datta M, Raman K. Executive compensation and corporate acquisition decisions. J Financ. 2001;56:2299–2336. doi: 10.1111/0022-1082.00406. [DOI] [Google Scholar]
- Dehejia RH, Wahba S. Propensity score-matching methods for nonexperimental causal studies. Rev Econ Stat. 2002;84:151–161. doi: 10.1162/003465302317331982. [DOI] [Google Scholar]
- Dell’Ariccia G, Laeven L, Marquez R. Real interest rates, leverage, and bank risk-taking. J Econ Theory. 2014;149:65–99. doi: 10.1016/j.jet.2013.06.002. [DOI] [Google Scholar]
- Demir A, Pesqué-Cela V, Altunbas Y, Murinde V. Fintech, financial inclusion and income inequality: a quantile regression approach. Eur J Financ. 2020;28:86–107. doi: 10.1080/1351847X.2020.1772335. [DOI] [Google Scholar]
- Deng P, Yang M. Cross-border mergers and acquisitions by emerging market firms: a comparative investigation. Int Bus Rev. 2015;24:157–172. doi: 10.1016/j.ibusrev.2014.07.005. [DOI] [Google Scholar]
- Denis DJ, Denis DK, Yost K. Global diversification, industrial diversification, and firm value. J Financ. 2002;57:1951–1979. doi: 10.1111/0022-1082.00485. [DOI] [Google Scholar]
- DeYoung R, Evanoff DD, Molyneux P. Mergers and acquisitions of financial institutions: a review of the post-2000 literature. J Financ Serv Res. 2009;36:87–110. doi: 10.1007/s10693-009-0066-7. [DOI] [Google Scholar]
- Elnahas AM, Kim D. CEO political ideology and mergers and acquisitions decisions. J Corp Financ. 2017;45:162–175. doi: 10.1016/j.jcorpfin.2017.04.013. [DOI] [Google Scholar]
- Erel I, Liao RC, Weisbach MS. Determinants of cross-border mergers and acquisitions. J Financ. 2012;67:1045–1082. doi: 10.1111/j.1540-6261.2012.01741.x. [DOI] [Google Scholar]
- Estélyi KS, Nisar TM. Diverse boards: Why do firms get foreign nationals on their boards? J Corp Financ. 2016;39:174–192. doi: 10.1016/j.jcorpfin.2016.02.006. [DOI] [Google Scholar]
- Farag H, Mallin C. Board diversity and financial fragility: evidence from European banks. Int Rev Financ Anal. 2017;49:98–112. doi: 10.1016/j.irfa.2016.12.002. [DOI] [Google Scholar]
- Farag H, Mallin C. The influence of CEO demographic characteristics on corporate risk-taking: evidence from Chinese IPOs. Eur J Financ. 2018;24:1528–1551. doi: 10.1080/1351847X.2016.1151454. [DOI] [Google Scholar]
- Ferreira D. Board diversity. In: Baker HK, Anderson R, editors. Corporate governance: a synthesis of theory, research and practice. London: Wiley; 2011. [Google Scholar]
- Ferreira D. Board diversity: should we trust research to inform policy? Corp Govern. 2015;23:108–111. doi: 10.1111/corg.12092. [DOI] [Google Scholar]
- Financial Times (2020) Lending platforms face battle for independence. The crisis will squeeze earnings for online lenders, and big banks could be waiting to snap up some bargains. June 2020
- Focarelli D, Pozzolo AF. The patterns of cross-border bank mergers and shareholdings in OECD countries. J Bank Financ. 2001;25:2305–2337. doi: 10.1016/S0378-4266(01)00192-3. [DOI] [Google Scholar]
- Focarelli D, Panetta F, Salleo C. Why do banks merge? J Money Credit Bank. 2002;34:1047–1066. doi: 10.1353/mcb.2002.0054. [DOI] [Google Scholar]
- FSB (2027) Financial stability implications from FinTech. Supervisory and regulatory issues that merit authorities’ attention. Financial Stability Board, June 2017
- Fuster A, Plosser M, Schnabl P, Vickery J. The role of technology in mortgage lending. Rev Financ Stud. 2019;32:1854–1899. doi: 10.1093/rfs/hhz018. [DOI] [Google Scholar]
- Galasso A, Simcoe TS. CEO overconfidence and innovation. Manag Sci. 2011;57:1469–1484. doi: 10.1287/mnsc.1110.1374. [DOI] [Google Scholar]
- García-Meca E, García-Sánchez IM, Martínez-Ferrero J. Board diversity and its effects on bank performance: an international analysis. J Bank Financ. 2015;53:202–214. doi: 10.1016/j.jbankfin.2014.12.002. [DOI] [Google Scholar]
- Giannetti M, Zhao M. Board ancestral diversity and firm-performance volatility. J Financ Quant Anal. 2019;54:1117–1155. doi: 10.1017/S0022109018001035. [DOI] [Google Scholar]
- Goddard J, Molyneux P, Zhou T. Bank mergers and acquisitions in emerging markets: evidence from Asia and Latin America. Eur J Financ. 2012;18:419–438. doi: 10.1080/1351847X.2011.601668. [DOI] [Google Scholar]
- Goldstein I, Jiang W, Karolyi GA. To FinTech and beyond. Rev Financ Stud. 2019;32:1647–1661. doi: 10.1093/rfs/hhz025. [DOI] [Google Scholar]
- Graebner ME, Eisenhardt KM, Roundy PT. Success and failure in technology acquisitions: lessons for buyers and sellers. Acad Manag Perspect. 2010;24:73–92. [Google Scholar]
- Graham JR, Harvey CR, Puri M. Capital allocation and delegation of decision-making authority within firms. J Financ Econ. 2015;115:449–470. doi: 10.1016/j.jfineco.2014.10.011. [DOI] [Google Scholar]
- Green CP, Homroy S. Female directors, board committees and firm performance. Eur Econ Rev. 2018;102:19–38. doi: 10.1016/j.euroecorev.2017.12.003. [DOI] [Google Scholar]
- Griffin D, Li K, Xu T. Board gender diversity and corporate innovation: international evidence. J Financ Quant Anal. 2021;56:123–154. doi: 10.1017/S002210901900098X. [DOI] [Google Scholar]
- Gulamhussen MA, Hennart J, Pinheiro CM. What drives cross-border M&As in commercial banking? J Bank Financ. 2016;72:s6–s18. doi: 10.1016/j.jbankfin.2016.07.007. [DOI] [Google Scholar]
- Hagendorff J, Vallascas F. CEO pay incentives and risk-taking: evidence from bank acquisitions. J Corp Financ. 2011;17:1078–1095. doi: 10.1016/j.jcorpfin.2011.04.009. [DOI] [Google Scholar]
- Hagendorff J, Collins M, Keasey K. Board monitoring, regulation, and performance in the banking industry: evidence from the market for corporate control. Corp Govern. 2010;18:381–395. doi: 10.1111/j.1467-8683.2010.00815.x. [DOI] [Google Scholar]
- Harford J, Li K. Decoupling CEO wealth and firm performance: The case of acquiring CEOs. J Financ. 2007;62:917–949. doi: 10.1111/j.1540-6261.2007.01227.x. [DOI] [Google Scholar]
- Harris M, Raviv A. Allocation of decision-making authority. Rev Financ. 2005;9:353–383. doi: 10.1007/s10679-005-2263-z. [DOI] [Google Scholar]
- Hasbrouck, J (1985) The characteristics of takeover targets q and other measures. J Bank Financ 9:351–362
- Hernando I, Nieto MJ, Wall LD. Determinants of domestic and cross-border bank acquisitions in the European Union. J Bank Financ. 2009;33:1022–1032. doi: 10.1016/j.jbankfin.2008.10.017. [DOI] [Google Scholar]
- Huang J, Kisgen DJ. Gender and corporate finance: Are male executives overconfident relative to female executives? J Financ Econ. 2013;108:822–839. doi: 10.1016/j.jfineco.2012.12.005. [DOI] [Google Scholar]
- Imbens W. An efficient method of moments estimator for discrete choice models with choice-base sampling. Econometrica. 1992;60:1187–1214. doi: 10.2307/2951544. [DOI] [Google Scholar]
- Jensen MC. The modern industrial revolution, exit, and the failure of internal control systems. J Financ. 1993;48:831–880. doi: 10.1111/j.1540-6261.1993.tb04022.x. [DOI] [Google Scholar]
- Jiménez G, Ongena S, Peydró L, Saurina J. Hazardous times for monetary policy: What do twenty-three million loans say about the effects of monetary policy on credit risk-taking? Econometrica. 2014;82:463–505. doi: 10.3982/ECTA10104. [DOI] [Google Scholar]
- King T, Srivastav A, Williams J. What's in an education? Implications of CEO education for bank performance. J Corp Financ. 2016;37:287–308. doi: 10.1016/j.jcorpfin.2016.01.003. [DOI] [Google Scholar]
- Knight J. Sexual stereotypes. Nature. 2002;415:254–256. doi: 10.1038/415254a. [DOI] [PubMed] [Google Scholar]
- Lee GK, Lieberman M. Acquisition vs. internal development as modes of market entry. Strateg Manag J. 2010;31:140–158. [Google Scholar]
- Levi M, Li K, Zhang F. Director gender and mergers and acquisitions. J Corp Financ. 2014;28:185–200. doi: 10.1016/j.jcorpfin.2013.11.005. [DOI] [Google Scholar]
- Liberti JM, Petersen M. Information hard and soft. Rev Corp Financ Stud. 2019;8:1–41. doi: 10.1093/rcfs/cfy009. [DOI] [Google Scholar]
- Malmendier U, Tate G. Who makes acquisitions? CEO overconfidence and the market's reaction. J Financ Econ. 2008;89:20–43. doi: 10.1016/j.jfineco.2007.07.002. [DOI] [Google Scholar]
- Manski CF, Lerman ST. The estimation of choice probabilities from choice based samples. Econometrica. 1977;45:1977–1988. doi: 10.2307/1914121. [DOI] [Google Scholar]
- Manski CF, McFadden D. Alternative estimators and sample designs for discrete choice analysis. In: Manski CF, McFadden D, editors. Structural analysis of discrete data and econometric applications. Cambridge: The MIT Press; 1981. [Google Scholar]
- Mantecon T. Mitigating risks in cross-border acquisitions. J Bank Financ. 2009;33:640–651. doi: 10.1016/j.jbankfin.2008.12.001. [DOI] [Google Scholar]
- Masulis RW, Wang C, Xie F. Corporate governance and acquirer returns. J Financ. 2007;62:1851–1889. doi: 10.1111/j.1540-6261.2007.01259.x. [DOI] [Google Scholar]
- Masulis RW, Wang C, Xie F. Globalizing the boardroom—The effects of foreign directors on corporate governance and firm performance. J Account Econ. 2012;53:527–554. doi: 10.1016/j.jacceco.2011.12.003. [DOI] [Google Scholar]
- Meyer-Doyle P, Lee S, Helfat CE. Disentangling the microfoundations of acquisition behavior and performance. Strateg Manag J. 2019;40:1733–1756. doi: 10.1002/smj.3069. [DOI] [Google Scholar]
- Minnick K, Unal H, Yang L. Pay for performance? CEO compensation and acquirer returns in BHCs. Rev Financ Stud. 2011;24:439–472. doi: 10.1093/rfs/hhq107. [DOI] [Google Scholar]
- Moeller SB, Schlingemann FP, Stulz RM. Wealth destruction on a massive scale? A study of acquiring-firm returns in the recent merger wave. J Financ. 2005;60:757–782. doi: 10.1111/j.1540-6261.2005.00745.x. [DOI] [Google Scholar]
- Molyneux P. Determinants of cross-border mergers in European banking. In: Herrmann H, Lipsey R, editors. Foreign direct investment in the real and financial sector of industrial countries. Berlin, Heidelberg: Springer; 2003. [Google Scholar]
- Molyneux P, Reghezza A, Xie R. Bank margins and profits in a world of negative rates. J Bank Financ. 2019;107:105613. doi: 10.1016/j.jbankfin.2019.105613. [DOI] [Google Scholar]
- Molyneux P, Reghezza A, Thornton J, Xie R. Did negative interest rates improve bank lending? J Financ Serv Res. 2020;57:51–68. doi: 10.1007/s10693-019-00322-8. [DOI] [Google Scholar]
- Ozkan N. Do CEOs gain more in foreign acquisitions than domestic acquisitions? J Bank Financ. 2012;36:1122–1138. doi: 10.1016/j.jbankfin.2011.12.005. [DOI] [Google Scholar]
- Palepu KG. Predicting takeover targets: A methodological and empirical analysis. J Account Econ. 1986;8:3–35. doi: 10.1016/0165-4101(86)90008-X. [DOI] [Google Scholar]
- Palvia A, Vähämaa E, Vähämaa S. Are female CEOs and chairwomen more conservative and risk averse? Evidence from the banking industry during the financial crisis. J Bus Ethics. 2015;131:577–594. doi: 10.1007/s10551-014-2288-3. [DOI] [Google Scholar]
- Pasiouras F, Gaganis C. Financial characteristics of banks involved in acquisitions: Evidence from Asia. Appl Financ Econ. 2007;17:329–341. doi: 10.1080/09603100600675524. [DOI] [Google Scholar]
- Pasiouras F, Tanna S, Zopounidis C. The identification of acquisition targets in the EU banking industry: An application of multicriteria approaches. Int Rev Financ Anal. 2007;16:262–281. doi: 10.1016/j.irfa.2006.09.001. [DOI] [Google Scholar]
- Pasiouras F, Tanna S, Gaganis C. What drives acquisitions in the EU banking industry? The role of bank regulation and supervision framework, bank specific and market specific factors. Financ Mark Inst Instrum. 2011;20:29–77. doi: 10.1111/j.1468-0416.2011.00165.x. [DOI] [Google Scholar]
- Prendergast C, Stole L. Impetuous youngsters and jaded old-timers: Acquiring a reputation for learning. J Polit Econ. 1996;104:1105–1134. doi: 10.1086/262055. [DOI] [Google Scholar]
- Ranft AL, Lord MD. Acquiring new technologies and capabilities: A grounded model of acquisition implementation. Organ Sci. 2002;13:420–441. doi: 10.1287/orsc.13.4.420.2952. [DOI] [Google Scholar]
- Rhodes-Kropf M, Robinson DT. The market for mergers and the boundaries of the firm. J Financ. 2008;63(3):1169–1211. doi: 10.1111/j.1540-6261.2008.01355.x. [DOI] [Google Scholar]
- Richard OC. Racial diversity, business strategy, and firm performance. Acad Manag J. 2000;43:164–177. doi: 10.2307/1556374. [DOI] [Google Scholar]
- Robinson DT. Strategic alliances and the boundaries of the firm. Rev Financ Stud. 2008;21(2):649–681. doi: 10.1093/rfs/hhm084. [DOI] [Google Scholar]
- Rossi S, Volpin PF. Cross-country determinants of mergers and acquisitions. J Financ Econ. 2004;74:277–304. doi: 10.1016/j.jfineco.2003.10.001. [DOI] [Google Scholar]
- Sapienza P, Zingales L, Maestripieri D. Gender differences in financial risk aversion and career choices are affected by testosterone. Proc Natl Acad Sci. 2009;106:15268–15273. doi: 10.1073/pnas.0907352106. [DOI] [PMC free article] [PubMed] [Google Scholar]
- Serfling MA. CEO age and the riskiness of corporate policies. J Corp Finan. 2014;25:251–273. doi: 10.1016/j.jcorpfin.2013.12.013. [DOI] [Google Scholar]
- Sila V, Gonzalez A, Hagendorff J. Women on board: Does boardroom gender diversity affect firm risk? J Corp Finan. 2016;36:26–53. doi: 10.1016/j.jcorpfin.2015.10.003. [DOI] [Google Scholar]
- Stulz RM. FinTech, BigTech, and the future of banks. J Appl Corp Financ. 2019;31:86–97. doi: 10.1111/jacf.12378. [DOI] [Google Scholar]
- Tang H. Peer-to-peer lenders versus banks: Substitutes or complements? Rev Financ Stud. 2019;32:1900–1938. doi: 10.1093/rfs/hhy137. [DOI] [Google Scholar]
- Thakor AV. Fintech and banking: What do we know? J Financ Intermed. 2020;41:100833. doi: 10.1016/j.jfi.2019.100833. [DOI] [Google Scholar]
- Vives X. The impact of FinTech on banking. Eur Econ. 2017;2:97–105. [Google Scholar]
- Wang Y, Yin S. CEO educational background and acquisition targets selection. J Corp Finan. 2018;52:238–259. doi: 10.1016/j.jcorpfin.2018.08.013. [DOI] [Google Scholar]
- Wheelock DC, Wilson PW. Why do banks disappear? The determinants of US bank failures and acquisitions. Rev Econ Stat. 2000;82:127–138. doi: 10.1162/003465300558560. [DOI] [Google Scholar]
- Yadav MS, Prabhu JC, Chandy RK. Managing the future: CEO attention and innovation outcomes. J Mark. 2007;71:84–101. doi: 10.1509/jmkg.71.4.084. [DOI] [Google Scholar]
- Yermack D. Higher market valuation of companies with a small board of directors. J Financ Econ. 1996;40:185–211. doi: 10.1016/0304-405X(95)00844-5. [DOI] [Google Scholar]
- Yim S. The acquisitiveness of youth: CEO age and acquisition behavior. J Financ Econ. 2013;108:250–273. doi: 10.1016/j.jfineco.2012.11.003. [DOI] [Google Scholar]
- Zelechowski DD, Bilimoria D. Characteristics of women and men corporate inside directors in the US. Corporate Governance. 2004;12:337–342. doi: 10.1111/j.1467-8683.2004.00374.x. [DOI] [Google Scholar]
- Acemoglu D, Akcigit U, Celik MA (2014) Young, restless and creative: Openness to disruption and creative innovations. National Bureau of Economic Research (NBER) No. w19894
- Ahern KR (2008) The returns to repeat acquirers. Available at SSRN 1311907
- Andreeva D, Grodzicki M, Móré C, Reghezza A (2019) Euro area bank profitability: Where can consolidation help? Financial Stability Review, 2, European Central Bank
- Basel Committee on Banking Supervision (BCBS) (2018) Implications of fintech developments for banks and bank supervisors. February 2018
- Boubakri N, Chkir I, Saadi S, Zhu H (2021) Does national culture affect corporate innovation? International evidence. J Corp Financ 66. 10.1016/j.jcorpfin.2020.101847
- Carney M (2017) The promise of Fintech–something new under the sun. In: Speech at Deutsche Bundesbank G20 Conference, by Bank of England Governor Mark Carney, January 25th
- Carstens A (2020) Shaping the future of payments. BIS Quarterly Review, March 2020
- Claessens S, Frost J, Turner G, Zhu F (2018) Fintech credit markets around the world: Size, drivers and policy issues. BIS Quart Rev
- Cornelli G, Frost J, Gambacorta L, Rau PR, Wardrop R, Ziegler T (2020) Fintech and big tech credit: A new database. BIS Working Paper No. 887
- De Nicolò G, Dell’Ariccia G, Laeven L, Valencia F (2010) Monetary policy and bank risk taking. IMF Staff Position Note, July
- Frost J (2020) The economic forces driving fintech adoption across countries. BIS Working Paper No. 838
- Hannan TH, Pilloff SJ (2004) Will the proposed application of Basel II in the United States encourage increased bank merger activity? Evidence from past merger activity. Division of Research & Statistics and Monetary Affairs, Federal Reserve Board
- Hannan TH, Rhoades SA (1987) Acquisition targets and motives: The case of the banking industry. Rev Econ Stat 67–74
- KPMG (2017) Forging the future. How financial institutions are embracing fintech to evolve and grow. October 2017
- KPMG (2018) Continuing to climb. Global banking M&A trends 2018. March 2018
- Philippon T (2019) The FinTech opportunity. In: The Disruptive impact of FinTech on retirement systems. Oxford University Press
- Pierri N, Timmer Y (2020) Tech in fin before fintech: Blessing or curse for financial stability? IMF Working Paper No. 20/14
Associated Data
This section collects any data citations, data availability statements, or supplementary materials included in this article.
Supplementary Materials
Data Availability Statement
The data that support the findings of this study are available from the corresponding author upon reasonable request.