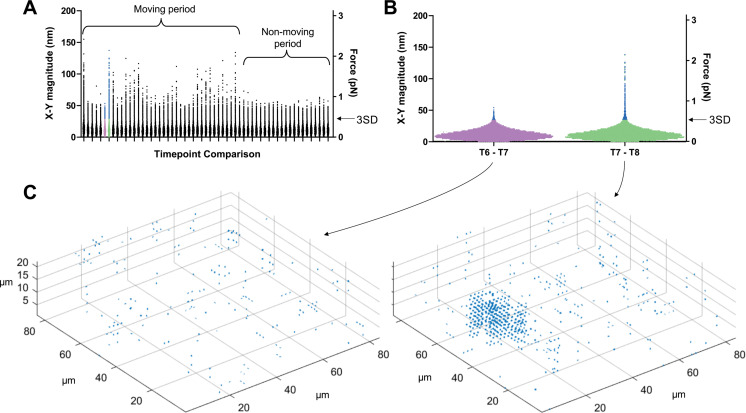
Figure 3. Determining threshold of detection in 3D traction force mapping.
(A) A fluorescent fibrin matrix containing wild-type parasites was imaged over 96 seconds (60 successive image volumes). FIDVC was then used to calculate the 16,807 3D fibrin displacement vectors between pairs of successive time points. The magnitudes of the 16,807 x-y displacement vectors are plotted for each of the 59 pairwise time point comparisons. This dataset contained a single moving parasite, which moved during the first part of the time course but not at the end, as indicated. For each time course, the two consecutive time points that gave the lowest mean x-y displacement vector magnitude were used to set the background threshold for that dataset: any displacements less than three standard deviations (3SD) above this mean were considered background noise. (B) Expanded view of the 16,807 datapoints from the two time point comparisons shown in purple and green in panel A. Arrow indicates the 3SD background threshold; all points above this threshold are colored blue in panels A and B. The moving parasite caused little deformation of the matrix above background between time points 6 and 7 and a greater amount of deformation between time points 7 and 8. (C) Displacement vectors with magnitudes greater than the 3SD background threshold for the two highlighted time point comparisons were mapped back onto the imaging volume; the cluster of displacement vectors evident in the time points 7–8 comparison corresponds to the position of the single moving parasite in the volume.


