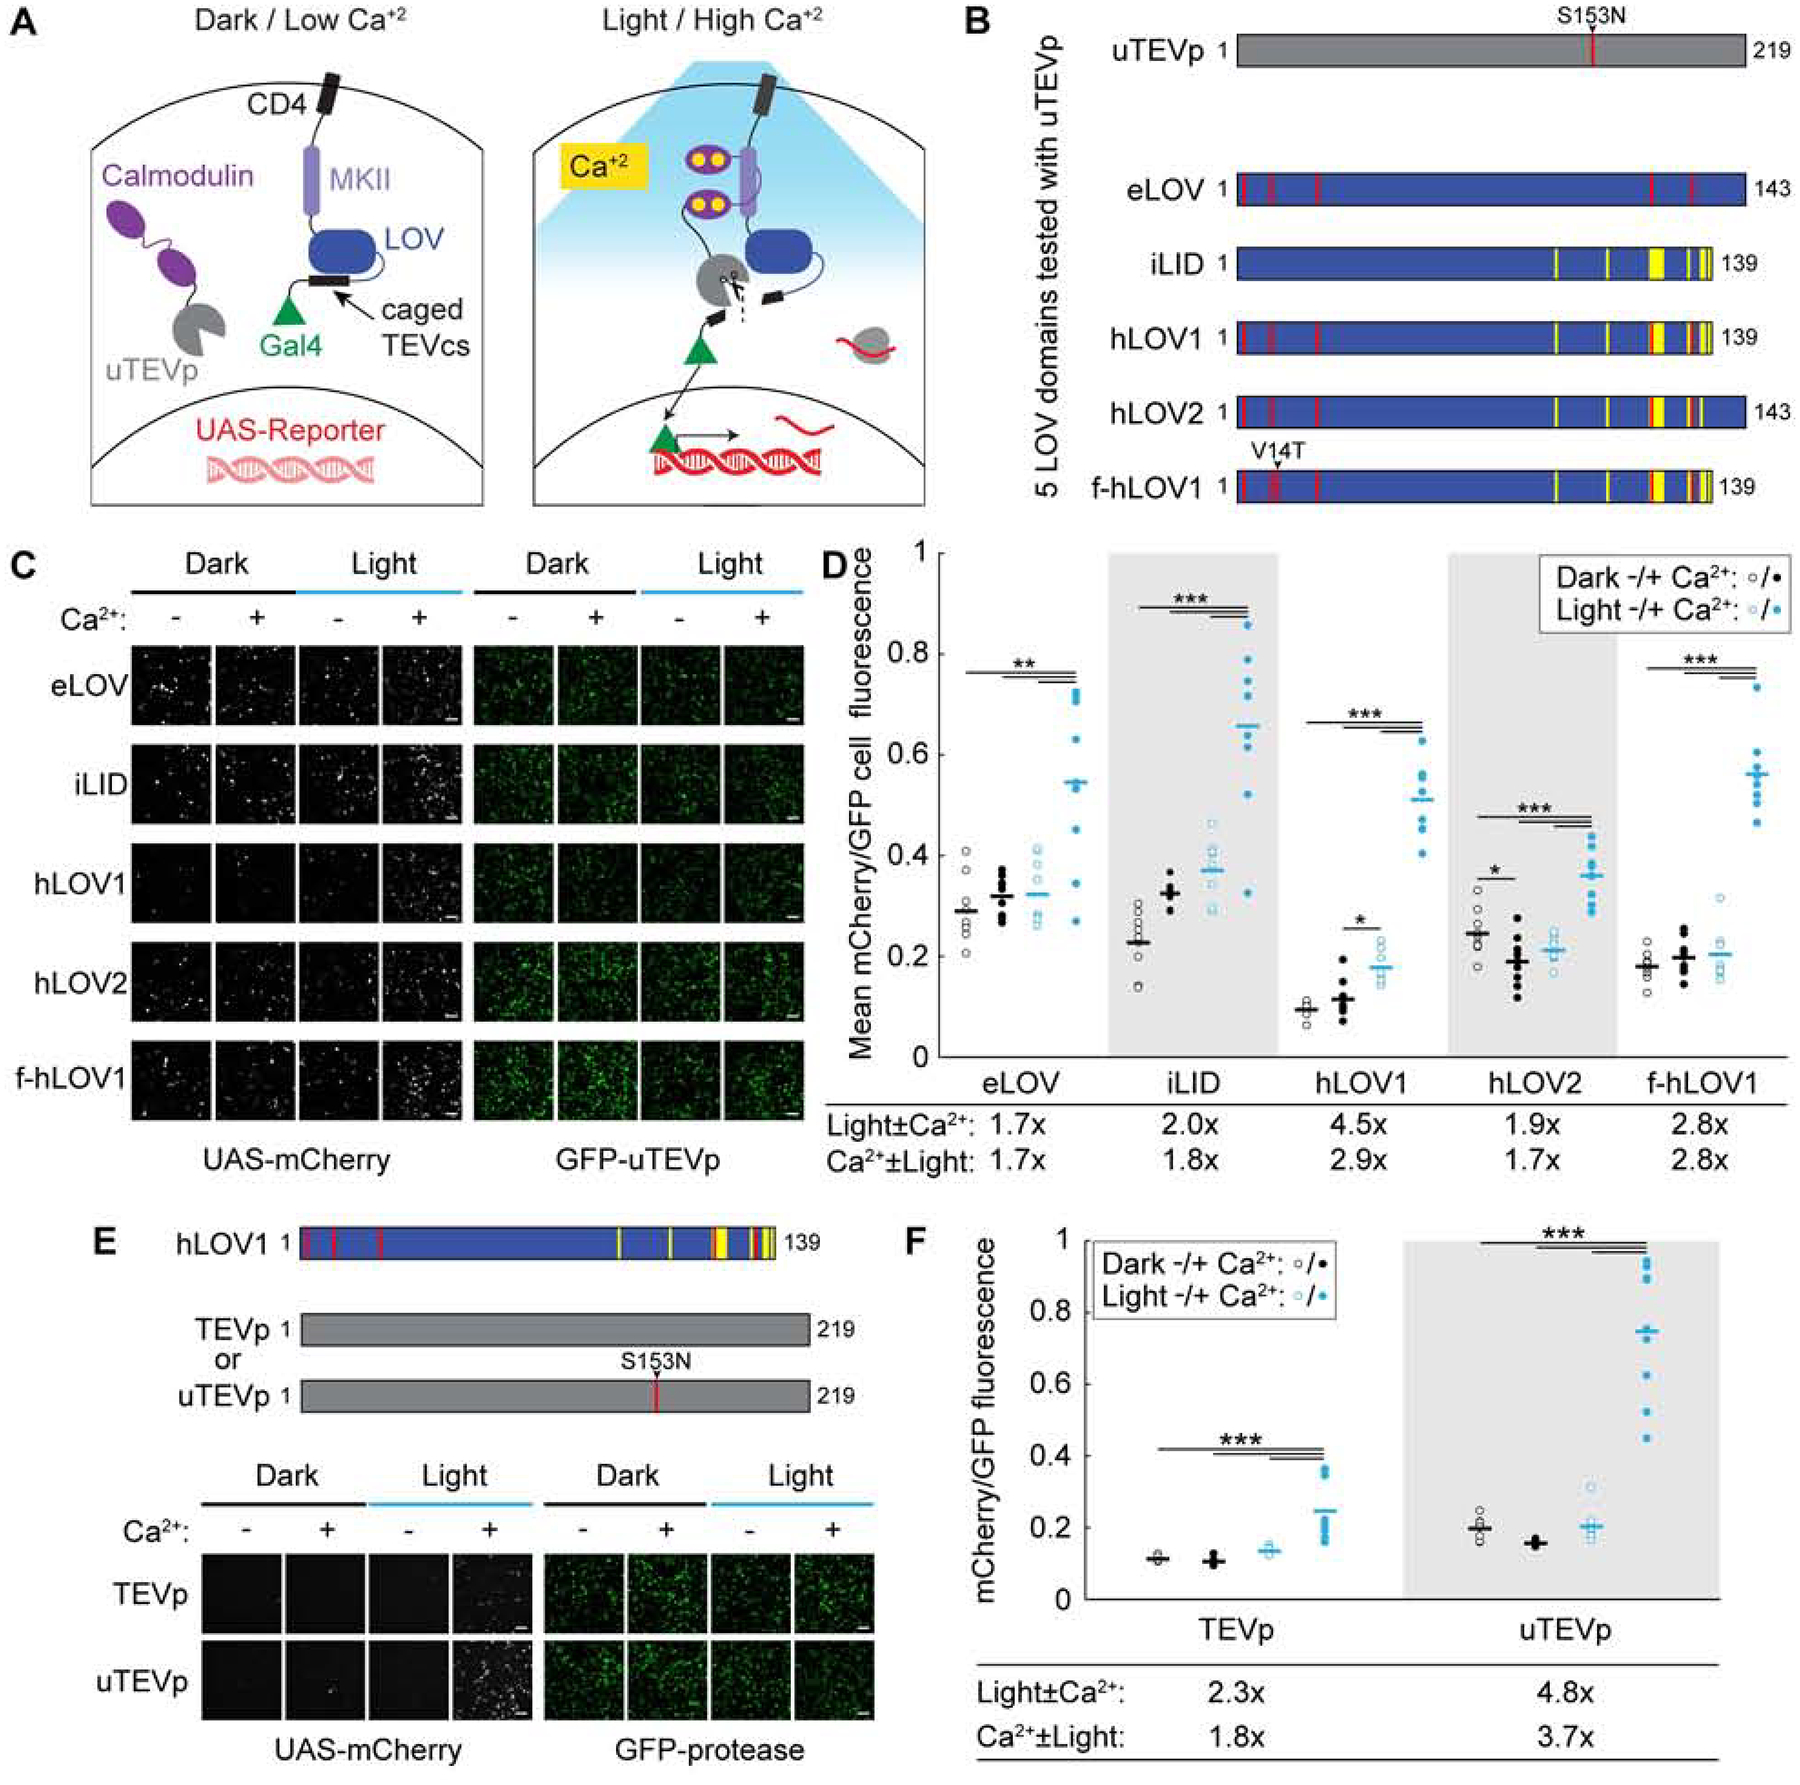
Figure 1. Design and characterization of FLiCRE in cultured HEK293T cells.

(A) Schematic of FLiCRE. In the basal state (dark/low Ca2+), a non-native transcription factor (Gal4) is tethered to the cell membrane via CD4, MKII, LOV, and TEVcs (TEV cleavage site). LOV cages the TEVcs in its inactivated dark state. An evolved TEV protease (uTEVp) is fused to calmodulin (CaM) and expressed cytosolically. In the presence of high Ca2+, CaM and MKII interact, bringing uTEVp into proximity of TEVcs, which is only accessible for cleavage when LOV is activated by blue light. Thus both high intracellular Ca2+ and blue light are required for Gal4 release and translocation to the nucleus to drive expression of a UAS-reporter.
(B) Optimization of FLiCRE’s LOV domain. Construct designs of five different LOV domains tested with uTEVp (S153N mutation) in FLiCRE.
(C) FLiCRE’s performance in HEK293T cells transfected with GFP-CaM-uTEVp, UAS-mCherry, and a transmembrane CD4-MKII-LOV-TEVcs-Gal4 component where LOV is one of the 5 LOV variants in panel B. Example fluorescence images of UAS-mCherry activation expression (left) and GFP-CaM-uTEVp expression (right), taken ~8 hrs after 10 min of treatment with Ca2+ and blue light, alongside control conditions. Scale bars, 100 μm.
(D) Quantification of experiment in panel C. Data represent the mCherry/GFP fluorescence intensity ratio averaged across all cells in a FOV. For all LOV variants, there was a higher mCherry/GFP ratio in the light + Ca2+ condition compared to control conditions (N = 9 FOVs per condition, 2-way ANOVA interaction F(1,32)eLOV=8.97, F(1,32)iLID=9.87, F(1,32)hLOV1=115.35, F(1,32)hLOV2=48.84, F(1,32)f-hLOV1=99.74, P < 0.01; Tukey’s multiple comparison’s test, ***P < 0.001, *P < 0.05).
(E) Comparison of FLiCRE performance in HEK293T cells transfected with CD4-MKII-hLOV1-TEVcs-Gal4, UAS-mCherry, and either GFP-CaM-TEVp or -uTEVp. Fluorescence images of UAS-mCherry activation and GFP-CaM-TEVp/uTEVp expression following 5 min of Ca2+ and blue light. Scale bars, 100 μm.
(F) Quantification of experiment in panel E. For both TEVp and uTEVp, there was a higher mCherry/GFP fluorescence ratio in the light + Ca2+ condition compared to control conditions (N = 9 FOVs per condition, 2-way ANOVA interaction F(1,32)TEVp=17.41, F(1,32)uTEVp=84.73, P < 0.001; Tukey’s multiple comparison’s test, ***P < 0.0001).
See also Figure S1.
