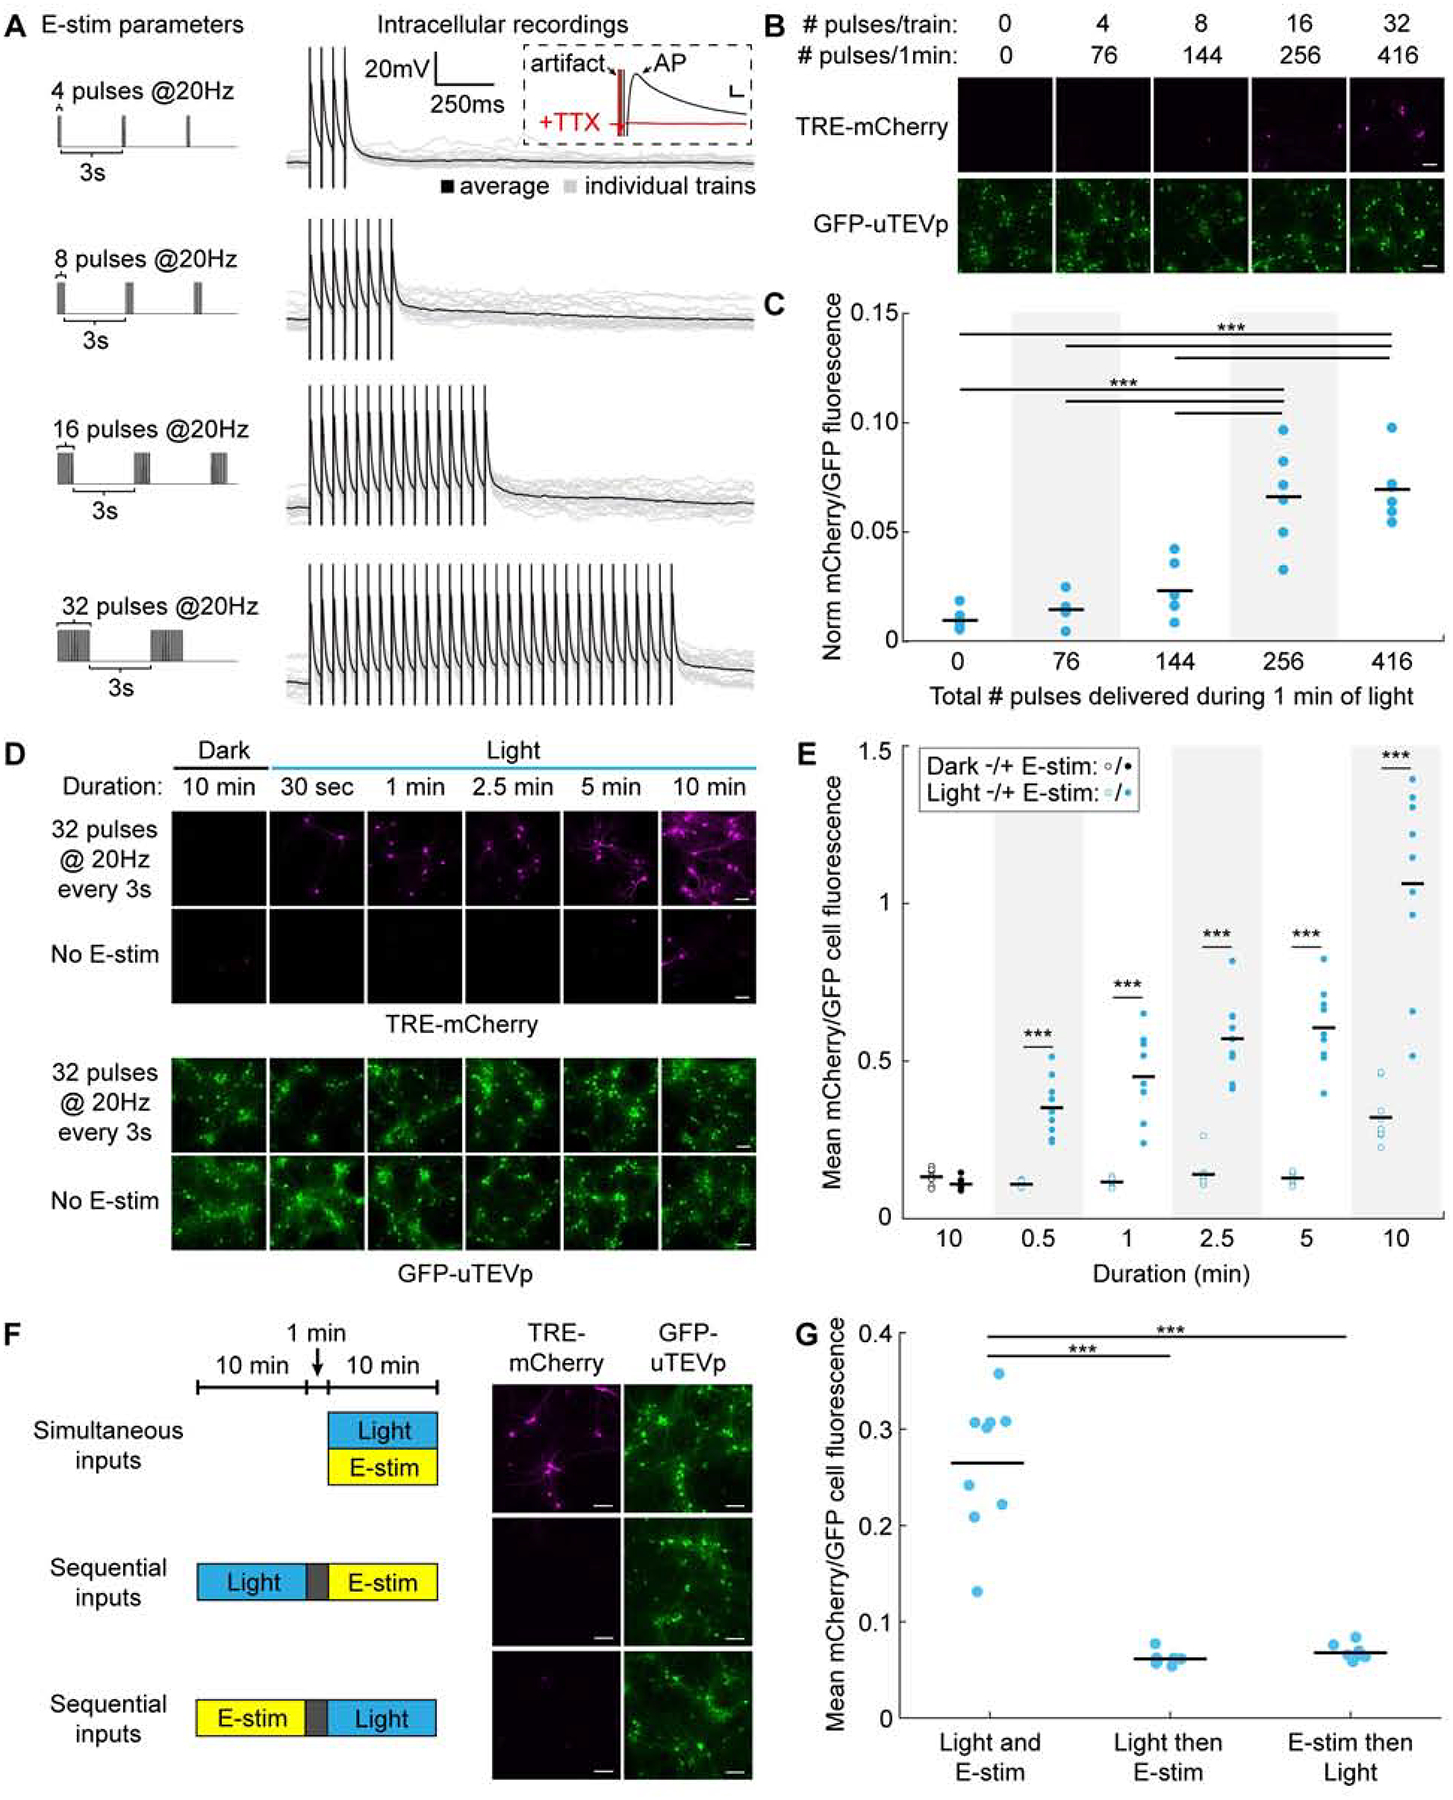
Figure 2. Characterization of FLiCRE’s sensitivity and reversibility in cultured neurons.

(A) Left: Electric field stimulation (E-stim) parameters used to elicit action potentials during FLiCRE recordings. Right: Intracellular patchclamp recordings in uninfected neurons showing that E-stim pulses elicit single action potentials (100% fidelity in spiking across N = 4 cells and 20 trials each). Inset: action potentials were blocked with TTX. Scale bars, 10mV and 5ms.
(B) Relationship between action potential firing and FLiCRE activation. For FLiCRE expression in neurons, CD4 was replaced with a truncated Neurexin3B fragment, Gal4 replaced with tTA, and a TRE-mCherry reporter gene was used. Fluorescence images of TRE-mCherry activation and GFP-CaM-uTEVp expression were taken ~18 hrs following 1min of light and E-stim (same parameters as in panel A). Scale bars, 100 μm.
(C) Quantification of experiment in panel B. Data represent the mCherry/GFP fluorescence intensity ratio averaged across all cells in a FOV, normalized by subtracting the background mCherry channel value. There was a higher mCherry/GFP fluorescence ratio in the light + Ca2+ compared to light − Ca2+ condition when 256 and 416 pulses were delivered (N = 6 FOVs per condition, 1-way ANOVA F(4,25)=25.43, P = 1.70e-8; Sidak’s multiple comparison’s test, ***P < 0.001).
(D) Relationship between duration of recording and FLiCRE activation. Fluorescence images of TRE-mCherry activation and GFP-CaM-uTEVp expression following light and E-stim (32 pulses at 20Hz every 3s) delivered for varying times. Scale bars, 100 μm.
(E) Quantification of experiment in panel D. There was a higher mCherry/GFP fluorescence ratio in the light + E-stim condition compared to light − E-stim condition across all durations tested (N = 9 FOVs per condition, 2-way ANOVA interaction F(4,64)=10.63, P < 0.0001; Sidak’s multiple comparison’s test, ***P < 0.001).
(F) Testing the temporal resolution of FLiCRE. Light and E-stim were delivered either simultaneously for 10 min or staggered by 1 min in either direction. Fluorescence images of TRE-mCherry activation and GFP-CaM-uTEVp expression marker. Scale bars, 100 μm.
(G) Quantification of experiment in panel F. The mCherry/GFP fluorescence ratio was higher in the simultaneous light and E-stim condition compared to the temporally staggered conditions (N = 9 FOVs per condition, 1-way ANOVA F(2,24)=72.6, P = 6.30e-11; Tukey’s multiple comparison’s test, ***P < 0.0001).
See also Figures S1,S2.
