Abstract
Despite the popularity of computer-aided study and design of RNA molecules, little is known about the accuracy of commonly used structure modeling packages in tasks sensitive to ensemble properties of RNA. Here, we demonstrate that the EternaBench dataset, a set of over 20,000 synthetic RNA constructs designed on the RNA design platform Eterna, provides incisive discriminative power in evaluating current packages in ensemble-oriented structure prediction tasks. We find that CONTRAfold and RNAsoft, packages with parameters derived through statistical learning, achieve consistently higher accuracy than more widely used packages in their standard settings, which derive parameters primarily from thermodynamic experiments. We hypothesized that training a multi-task model with the varied data types in EternaBench might improve inference on ensemble-based prediction tasks. Indeed, the resulting model, named EternaFold, demonstrated improved performance that generalizes to diverse external datasets including complete mRNAs, viral genomes probed in human cells and synthetic designs modeling mRNA vaccines.
Editor’s summary
The EternaBench dataset of synthetic RNA constructs was used to directly compare RNA secondary structure prediction software packages on ensemble-oriented prediction tasks and used to train the EternaFold model for improved performance.
Introduction
RNA molecules perform essential roles in cells, including regulating transcription, translation, and molecular interactions, and performing catalysis.1 Synthetic RNA molecules are gaining increasing interest for a variety of applications, including genome editing,2 biosensing,3 and vaccination.4 Characterizing RNA secondary structure, the collection of base pairs present in the molecule, is typically necessary for understanding the function of natural RNA molecules and is of crucial importance for designing better synthetic molecules. Some of the most widely-used packages use a physics-based approach5 that assigns thermodynamic values to a set of structural features (ViennaRNA,6 NUPACK,7 and RNAstructure8), with parameters traditionally characterized via optical melting experiments and then generalized by expert intuition.9 However, a number of other approaches have also been developed that utilize statistical learning methods to derive parameters for structural features (RNAsoft,10 CONTRAfold,11 CycleFold,12 LearnToFold,13 MXfold14, SPOT-RNA15).
Secondary structure modeling packages are typically evaluated by comparing single predicted structures to secondary structures of natural RNAs16. While important, this practice has limitations for accurately assessing packages, including bias toward structures more abundant in the most well-studied RNAs (tRNAs, ribosomal RNA, etc.) and neglect of energetic effects from these natural RNAs’ tertiary contacts or binding partners. Furthermore, scoring on single structures fails to assess the accuracy of ensemble-averaged RNA structural observables, such as base-pairing probabilities, affinities for proteins, and ligand-dependent structural rearrangements, which are particularly relevant for the study and design of riboswitches17, 18, ribozymes, pre-mRNA transcripts, and therapeutics19 that occupy more than one structure as part of their functional cycles. Existing packages are, in theory, capable of predicting ensemble properties through so-called partition function calculations, and, in practice, are used to guide RNA ensemble-based design, despite not being validated for these applications.
High-throughput RNA structure experiments data, such as high-throughput chemical mapping20–22 and RNA-MaP experiments23, 24, offer the opportunity to make incisive tests of secondary structure models with orders-of-magnitude more constructs than previously. Unlike datasets of single secondary structures, both of these experiments provide ensemble-averaged structural properties, which allow for directly evaluating the full ensemble calculation of secondary structure algorithms, obviating the need to also evaluate the further nontrivial inference of a most-likely structure from the calculated ensemble. Furthermore, experimental data on human-designed synthetic RNA libraries has potential to mitigate effects of bias incurred in natural RNA datasets.
In this work, we evaluate the performance of commonly-used packages capable of making thermodynamic predictions in two tasks for which large datasets of synthetic RNAs have been collected via the RNA design crowdsourcing platform Eterna25: 1) predicting chemical reactivity data through calculating probabilities that nucleotides are unpaired, and 2) predicting relative stabilities of multiple structural states that underlie the functions of riboswitch molecules, a task that involves predicting affinities of both small molecules and proteins of interest. We find striking, consistent differences in package performance across these quantitative tasks, with the packages CONTRAfold and RNASoft performing better than packages that are in wider use.
We hypothesized that these data, though shorter than many natural RNAs of interest and not designed to bear similarity to natural RNAs, might still sufficiently represent RNA thermodynamics to allow for developing an improved algorithm. We tested this by developing a multitask-learning-based framework to train a thermodynamic model on these tasks concurrently with the task of single-structure prediction. The resulting multitask-trained model, called EternaFold, did indeed demonstrate increased accuracy both on held-out data from Eterna as well as a collection of 31 independent datasets gathered from other literature sources, which encompass viral genomes, mRNAs, and other small synthetic RNAs, probed with distinct methods and under distinct solution and cellular conditions. This represents, to our knowledge, the largest collection of datasets used to evaluate RNA secondary structure algorithms.
Results
Evaluated packages
We initially evaluated commonly used secondary structure modeling packages in their ability to make thermodynamic predictions on two datasets of diverse synthetic molecules from Eterna: EternaBench-ChemMapping (n=12,711) and EternaBench-Switch (n=7,228). The packages ViennaRNA (version 1.8.5, 2.4.10), NUPACK (3.2.2), RNAstructure (6.2), RNAsoft (2.0), and CONTRAfold (1.0, 2.02), were analyzed across different package versions, parameter sets, and modelling options, where available (Table S1). We also evaluated packages trained more recently through a varied set of statistical or deep learning methods (LearnToFold13, SPOT-RNA15, MXfold14, CycleFold12, and CROSS26), but these packages demonstrated poor performance on a subset of chemical mapping data (Extended Data Figure 1a), and due to their intensive runtimes, were omitted from further comparison.
Package ranking based on RNA chemical mapping predictions
Our first ensemble-based structure prediction task investigates the capability of these packages to predict chemical mapping reactivities. Chemical mapping is a widely-used readout of RNA secondary structure20–22 and has served as a high-throughput structural readout for experiments performed in the Eterna massive open online laboratory25. A nucleotide’s reactivity in a chemical mapping experiment depends on the availability of the nucleotide to be chemically modified, and hence provides an ensemble-averaged readout of the nucleotide’s deprotection from base pairing or other binding partners.27 We wished to investigate if current secondary structure packages differed in their ability to recapitulate information about the ensembles of misfolded states that are captured in chemical mapping experiments.
To make this comparison, we used the Eterna “Cloud Labs” for this purpose: 24 datasets of 38,846 player-designed constructs, ranging from 80–130 nucleotides in length (dataset statistics in Table S2, participant information in Table S3). These constructs were designed in iterative cycles on the Eterna platform (Figure 1a). Participants launched “projects”, each of which contained one “target structure”, and posed a design challenge or tested a hypothesis about RNA structure (project information in Table S4). The constructs designed in these labs were periodically collected and mapped in vitro using selective 2’-hydroxyl acylation analyzed by primer extension (SHAPE) and read out using the MAP-seq chemical mapping protocol.28 These data were returned to participants, and the results guided future lab development and construct design29.
Figure 1. Community-science-designed RNA datasets from the Eterna “Cloud Lab” experiments identify consistent discrepancies in ensemble calculations from secondary-structure packages.
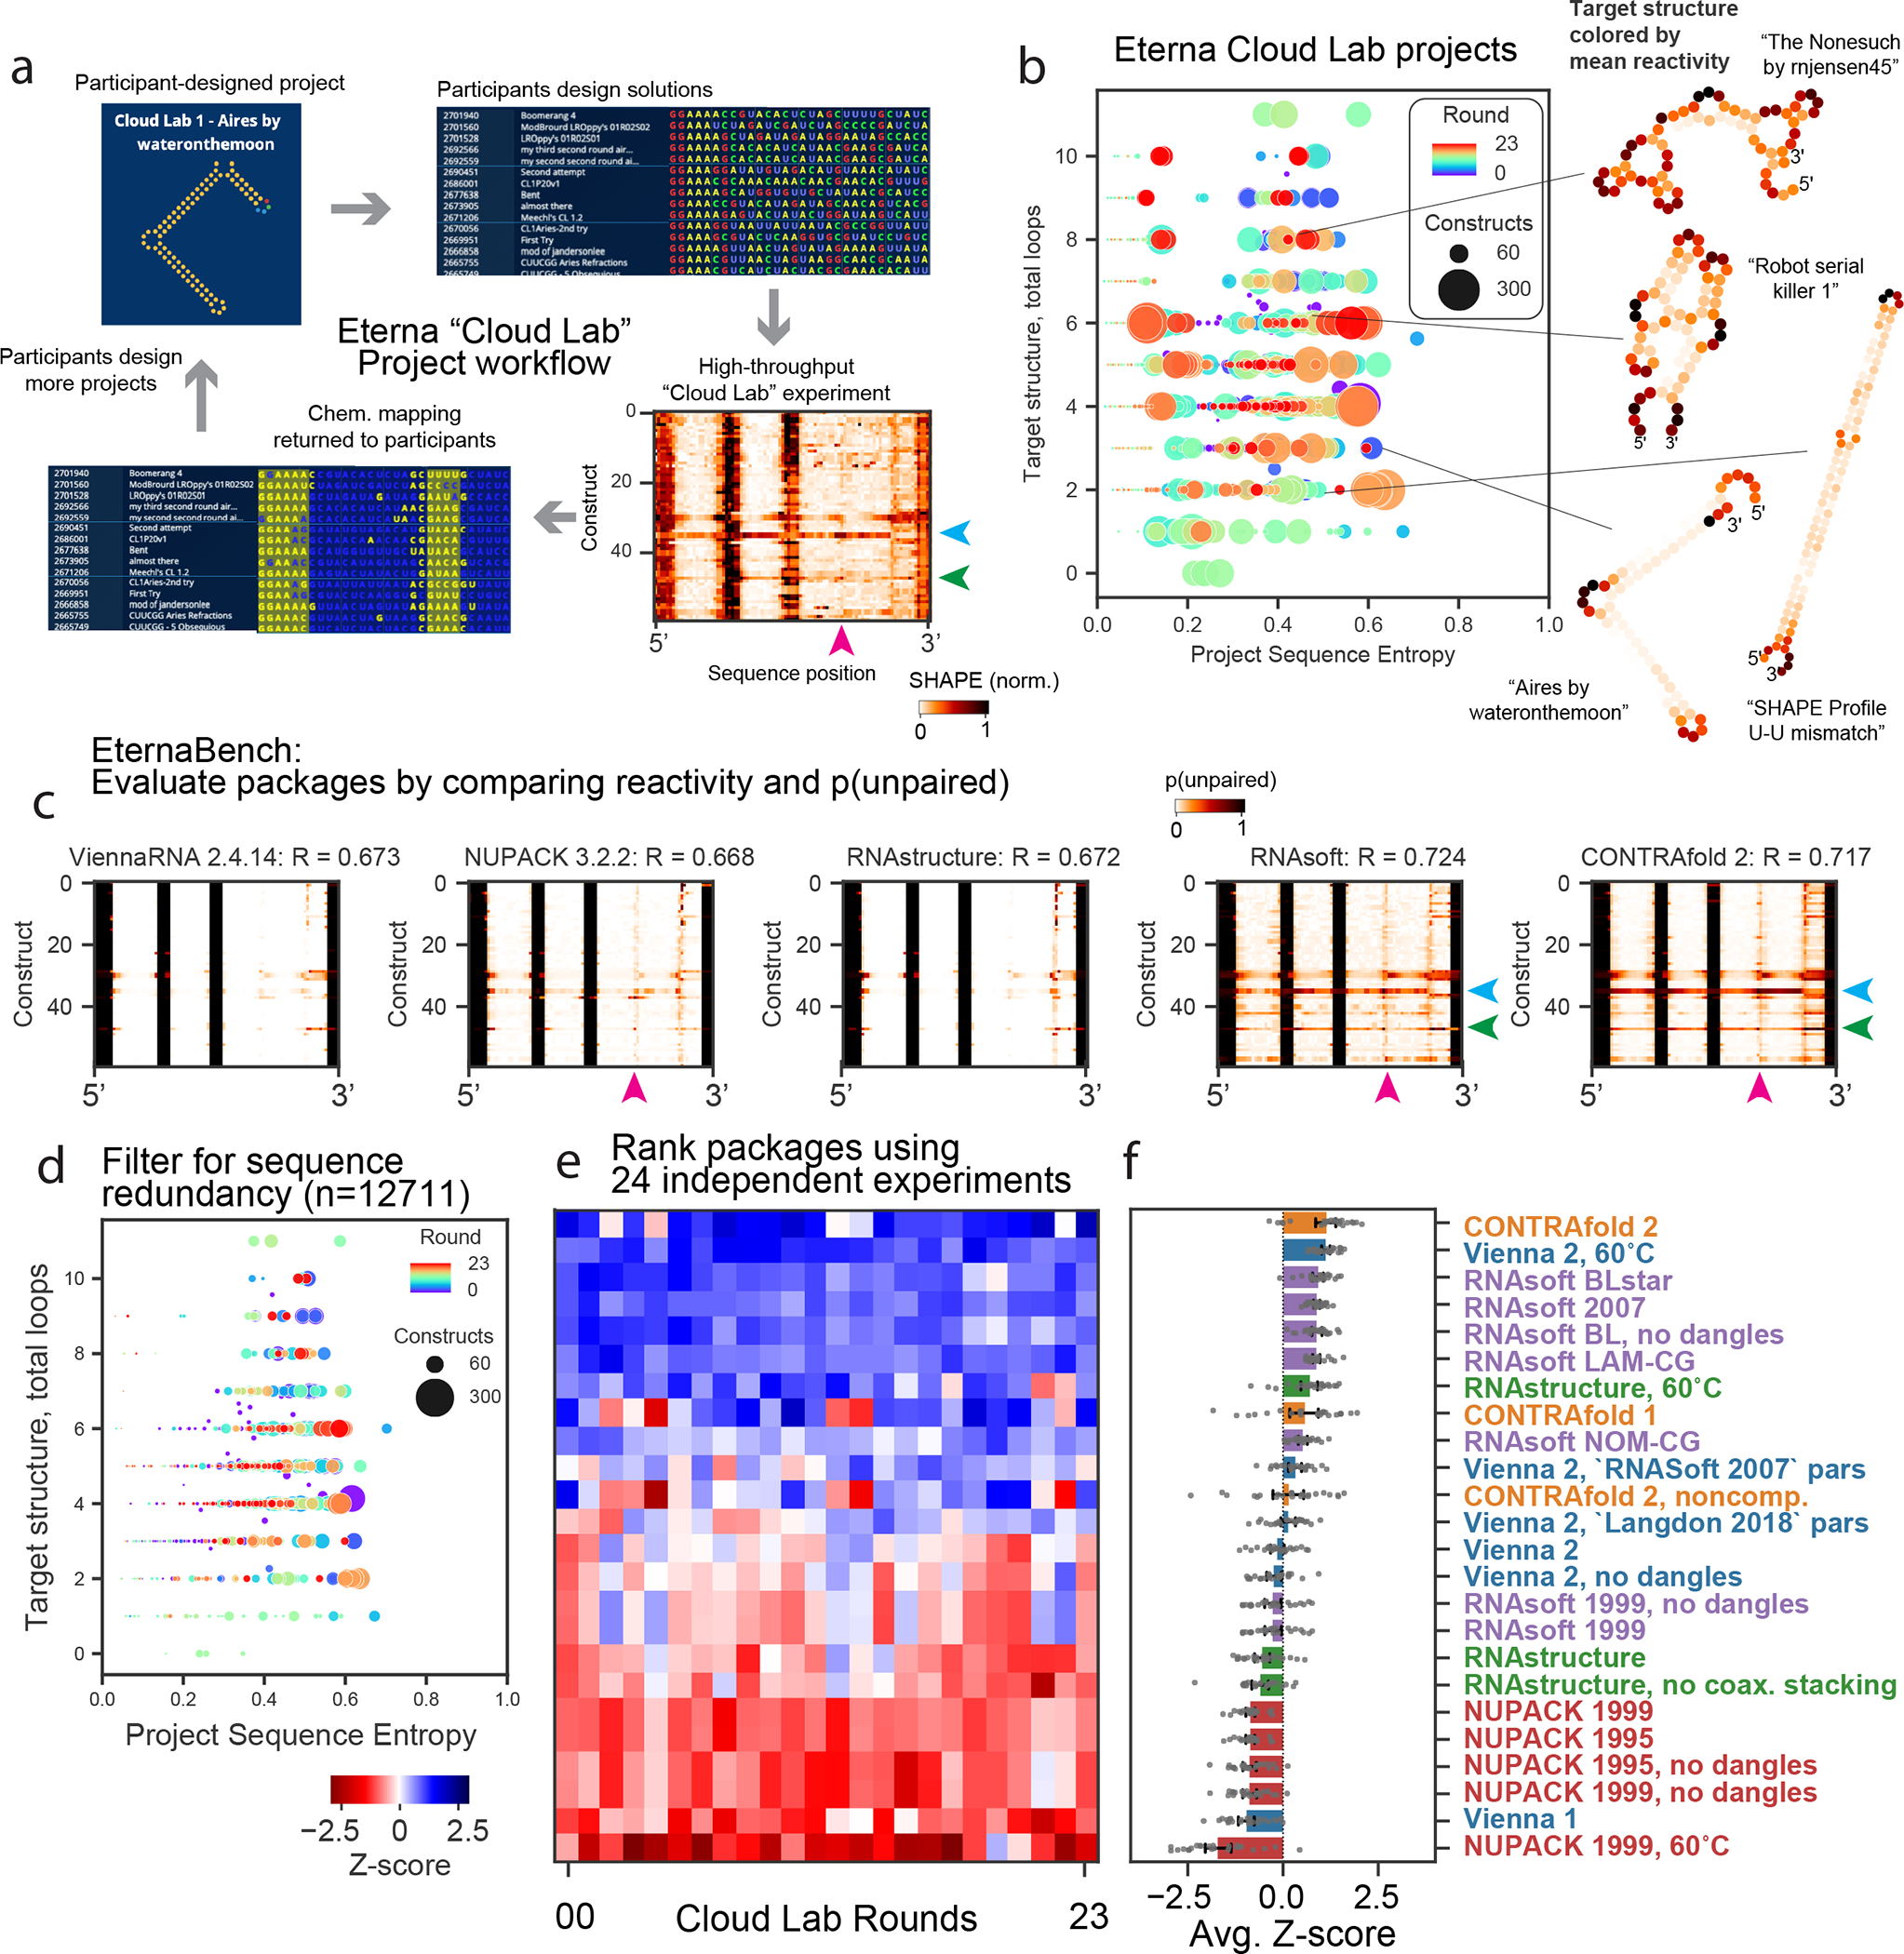
(A) Workflow of cloud lab rounds: Eterna participants design “projects”, typically intended as RNA design challenges. Players submit solutions, all of which are synthesized in high-throughput via MAP-seq experiments. Example reactivity data are depicted from the project “Aires” by participant wateronthemoon. Data are returned to participants in the in-game browser, which served as the basis for more player-designed projects.
(B) Calculating the average positional entropy for all solutions collected for each project reveals that participants were able to design a diverse set of solutions, independent of target structure complexity (monitored as number of loops in the target structure). Example target structures are colored by average reactivity. (C) Example unpaired probabilities for 60 example constructs from the project “Aires”, for which reactivity data are shown in (A), across 5 representative secondary structure packages. Blue, green, magenta arrows indicate package predictions that recapitulate experimental partially reactive features. CONTRAfold and RNAsoft predictions for p(unpaired) have higher correlation to experimental reactivity data. (D) Analogous representation to (B) for the redundancy-filtered EternaBench dataset. (E) We compared many commonly used packages and secondary structure prediction options over 24 Cloud Lab independent experiments. We calculated the Pearson correlation coefficient and calculated the Z-score across all packages evaluated for each dataset. (F) Final ranking is obtained by averaging the Z-scores obtained across all datasets. Error bars represent 95% confidence interval of the mean obtained over 1000 iterations of bootstrapping over n= 24 independent experiments, which comprised 12,711 independent constructs total.
The community of Eterna participants collectively developed highly diverse sequence libraries across target structures ranging from 0 to 12 loops (a proxy for design complexity30), as assessed by analyzing the positional sequence entropy of collected constructs as grouped by project (Figure 1b). Example project target structures, colored by the mean reactivity of the probed solutions, are shown in Figure 1b (inset). Some projects sought to design intricate structures, e.g., “The Nonesuch by rnjensen45” and “Robot serial killer 1”, while other participant projects focused more on better understanding experimental signals from particular structure motifs, e.g., “SHAPE Profile U-U mismatch”, which consisted of a single stem and a U-U mismatch.
Figure 1a depicts an example heatmap of SHAPE data for Eterna-player-designed synthetic RNA molecules from the project “Aires” by participant wateronthemoon. Figure 1c depicts calculated ensemble-averaged unpaired probabilities per nucleotide, p(unpaired), for five example package options, plotted in the same heatmap arrangement as the experimental data in Figure 1a (see Extended Data Figure 2 for heatmaps from all package options tested). In this subset of constructs, all packages are largely able to identify which regions are completely paired (p(unpaired) = 0, white) or unpaired (p(unpaired) = 1, black), but some packages predict p(unpaired) values between 0 and 1 that more accurately reflect intermediate reactivity levels. Arrows (blue, green, magenta) indicate intermediate reactivity values that are captured by predictions from CONTRAfold and RNAsoft but not ViennaRNA, NUPACK, and RNAstructure. We quantified similarity between reactivity and p(unpaired) by calculating the Pearson correlation coefficient between the experimental reactivity values and p(unpaired) values (see Methods). As an example, predictions from CONTRAfold 2 and RNAsoft BLstar for Cloud Lab Round 1 (1088 constructs) demonstrate improved correlation of R = 0.718(2), 0.724(3) (respectively) over Vienna 2, RNAstructure, and NUPACK (0.673(2), 0.671(2), 0.667(2), respectively) (Table S5). Noting that some projects had low sequence diversity, and to make the dataset a more manageable size for benchmarking while maintaining the same degree of sequence diversity, we filtered constructs to remove highly similar sequences (see Methods, Extended Data Figure 3). Clustering the resulting sequences per project (Figure 1d) demonstrates that low-entropy projects were reduced in size. The final 24 EternaBench-CM datasets comprised 12,711 individual constructs.
We observed that CONTRAfold and RNAsoft generally predict that the constructs studied are more melted than the other packages predict at their default temperatures of 37 °C, even though the actual chemical mapping experiments were carried out at lower temperature (24 °C; see Methods). Motivated by this observation, we wished to ascertain if a simple change in temperature might account for differences in performance between packages. Because ViennaRNA, NUPACK, and RNAstructure packages include parameters for both enthalpy and entropy, we calculated correlations across predictions from a range of temperatures (Extended Data Figure 1b). We found that increasing the temperature from the default value of 37 °C used in these packages to 60 °C improved the correlation to experimental data for ViennaRNA (R=0.708(2)) and RNAstructure (R=0.707(2)), but not NUPACK (R=0.639(2)). We hence included each of these packages also at 60°C as options to test.
We established a ranking of all package options for each dataset (Figure 1e, Table S5, representative heatmaps for all datasets in Extended Data Figure 4) by computing the Z-score for each package correlation in comparison to all packages tested, and averaging over all datasets (Figure 1f). The top 3 package options were CONTRAfold 2, ViennaRNA at 60°C, and RNAsoft with “BLstar” parameters. Using a Pearson correlation assumes a linear relationship between p(unpaired) and reactivity and relies on a two-state model with inherent limitations (see Methods). We therefore also ranked all packages with a Spearman rank correlation coefficient and found a similar global overall ranking (Extended Data Figure 1c). Overall package performance and the resulting ranking was not strongly dependent on GC content, sequence length, or total number of loops in the project target structure, which was investigated by calculating correlations and rankings when grouping constructs by project (see Methods, Extended Data Figure 1d).
Package ranking based on riboswitch affinity predictions
Our second ensemble-based structure prediction task involved predicting the relative populations of states occupied by riboswitch molecules. Riboswitches are RNA molecules that alter their structure upon binding of an input ligand, which effects an output action such as regulating transcription, translation, splicing, or the binding of a reporter molecule.18, 31, 32 We compared these packages in their ability to predict the relative binding affinity of synthetic riboswitches to their output reporter, fluorescently-tagged MS2 viral coat protein in the absence of input ligand, (see Methods, Extended Data Figure 5a). As with the chemical mapping datasets, each riboswitch dataset was filtered to exclude highly similar sequences (Extended Data Figure 3, Table S6). These riboswitches came from two sources: the first consisted of 4,849 riboswitches (after filtering) designed by citizen scientists on Eterna33. The second consisted of 2,509 riboswitches (after filtering) designed fully computationally using the RiboLogic package,34 probed concomitantly with Eterna riboswitches. These riboswitches were designed using aptamers for three small molecules: FMN, theophylline, and tryptophan.
Figure 2a depicts experimental values for for FMN riboswitches from the RiboLogic dataset vs. predicted values. Again, CONTRAfold and RNAsoft BLstar packages exhibit higher correlations to the experimental data (Pearson R = 0.50(2) and 0.51(2), respectively) than ViennaRNA, NUPACK, and RNAstructure (R=0.37(2), 0.34(2), 0.36(2), respectively). Example predictions for all package options tested are in Extended Data Figure 6. We evaluated performance across 12 independent experimental datasets (Figure 2b, Table S7, representative predictions in Extended Data Figure 7), and obtained a ranking (Figure 2c) similar to the ranking obtained from chemical mapping data. CONTRAfold 2, RNAsoft (model “BL, no dangles”, equivalent to BLstar but without dangles), and RNAstructure 60°C were ranked as the top 3 out of the package options tested. The top ranking of CONTRAfold 2 matches the entirely independent ranking based on chemical mapping measurements of distinct RNA sequences described in the previous section. These riboswitches were designed using aptamers for three small molecules: FMN, theophylline, and tryptophan. Calculating Z-scores over each individual subset resulted in slightly differing rankings but consistently favored Contrafold methods (Extended Data Figure 5b). Predicting MS2 binding affinity in the presence of the riboswitch input ligand, as well as the activation ratio, AR, requires computing constrained partition functions, a capability limited to Vienna RNAfold, RNAstructure, and CONTRAfold. Rankings for predicting and AR followed the same trends (Extended Data Figures 5d–e, see Methods).
Figure 2. Riboswitch affinity predictions reveal similar package ranking.
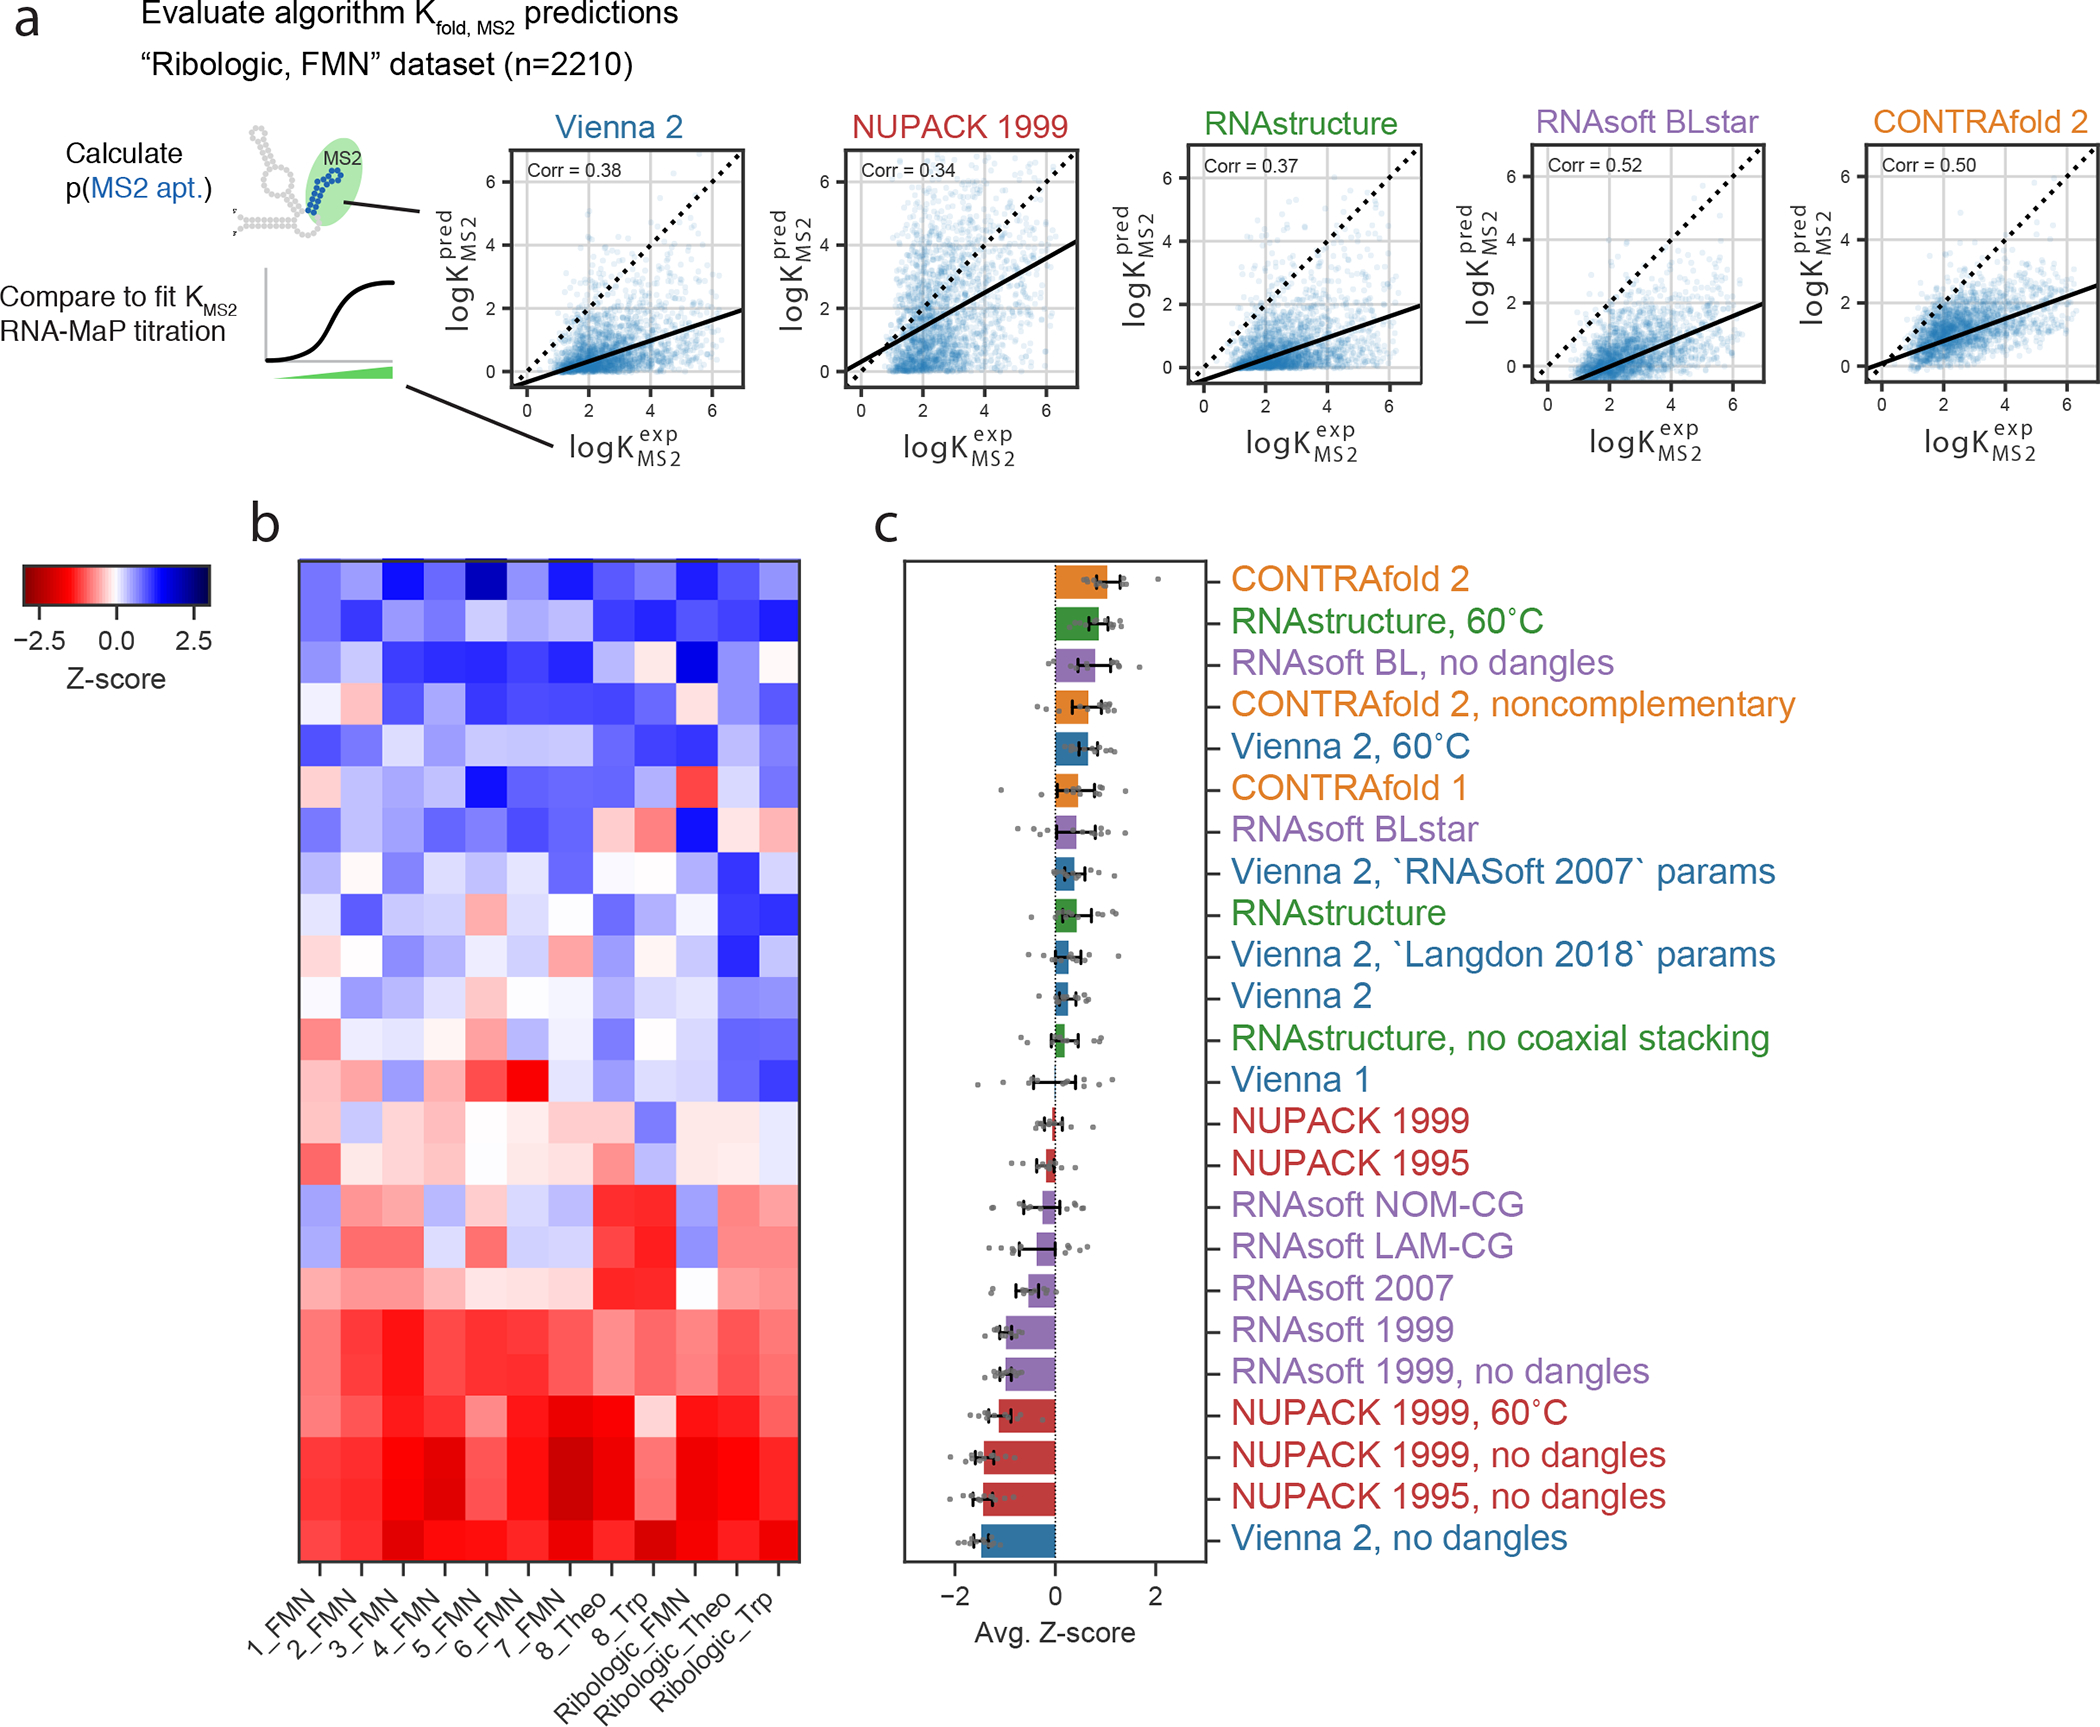
(A) Representative scatterplots for the Ribologic-FMN dataset of experimental vs. predicted values of . (B) Calculating the Z-scores of Pearson correlation coefficients across 12 independent datasets of riboswitches result in an overall ranking (C) consistent with the Chemical Mapping dataset. Error bars represent 95% confidence interval of the mean obtained over 1000 iterations of bootstrapping over n=12 independent experiments of 7,228 independent constructs total.
EternaFold gives best-of-class performance in multiple tasks
We hypothesized that performance in both secondary structure prediction tasks above might be improved by incorporating these tasks in the process of training a secondary structure package. The RNAsoft10, 35 and CONTRAfold11 packages both take advantage of the property that the gradient of any parameter is expected counts of that feature in the ensemble, which can be readily computed in dynamic programming scheme. We generalized this framework beyond maximizing the likelihood of one single structure to matching the experimentally determined probability of a particular structural motif in the ensemble through minimizing the root-mean-squared error (RMSE) to the logarithm of riboswitch affinities for MS2 protein (see Methods). We used the CONTRAfold code as a framework to explore multi-task learning on RNA structural data, since it has previously been extended to train on chemical mapping data to maximize the expected likelihood of chemical mapping data.36
We tested training from three data types: secondary structures, chemical mapping reactivity, and riboswitch affinities. We used the STRAND S-Processed dataset for secondary structures (n=3439), which was the same data used to train RNAsoft and CONTRAfold10. The Chemical mapping training data (n=2603) came from Cloud Lab datasets used in previous model development36. We used riboswitches designed by the automated Ribologic34 algorithm for riboswitch training data (n=1295). We trained models with a variety of combinations of data types to explore interactions in multitask training (Figure 3a), used holdout sets to determine hyperparameter weights (see Methods), and evaluated performance on separate test sets for single-structure prediction accuracy37, chemical mapping prediction accuracy, and riboswitch affinity prediction. To ensure a rigorous separation of training and test data, each test dataset was filtered for sequence similarity to all training data at 80% using a windowed Levenshtein metric (see Methods). Significant sequence similarity overlap between the S-Processed Train and Test sets motivated us to develop an orthogonal dataset for secondary structure prediction testing based on the dataset ArchiveII38. Test sets for chemical mapping and riboswitch data came from completely different experimental rounds than those used in training to avoid learning experiment-specific biases.
Figure 3. Multitask training using EternaBench datasets results in improved thermodynamic prediction.
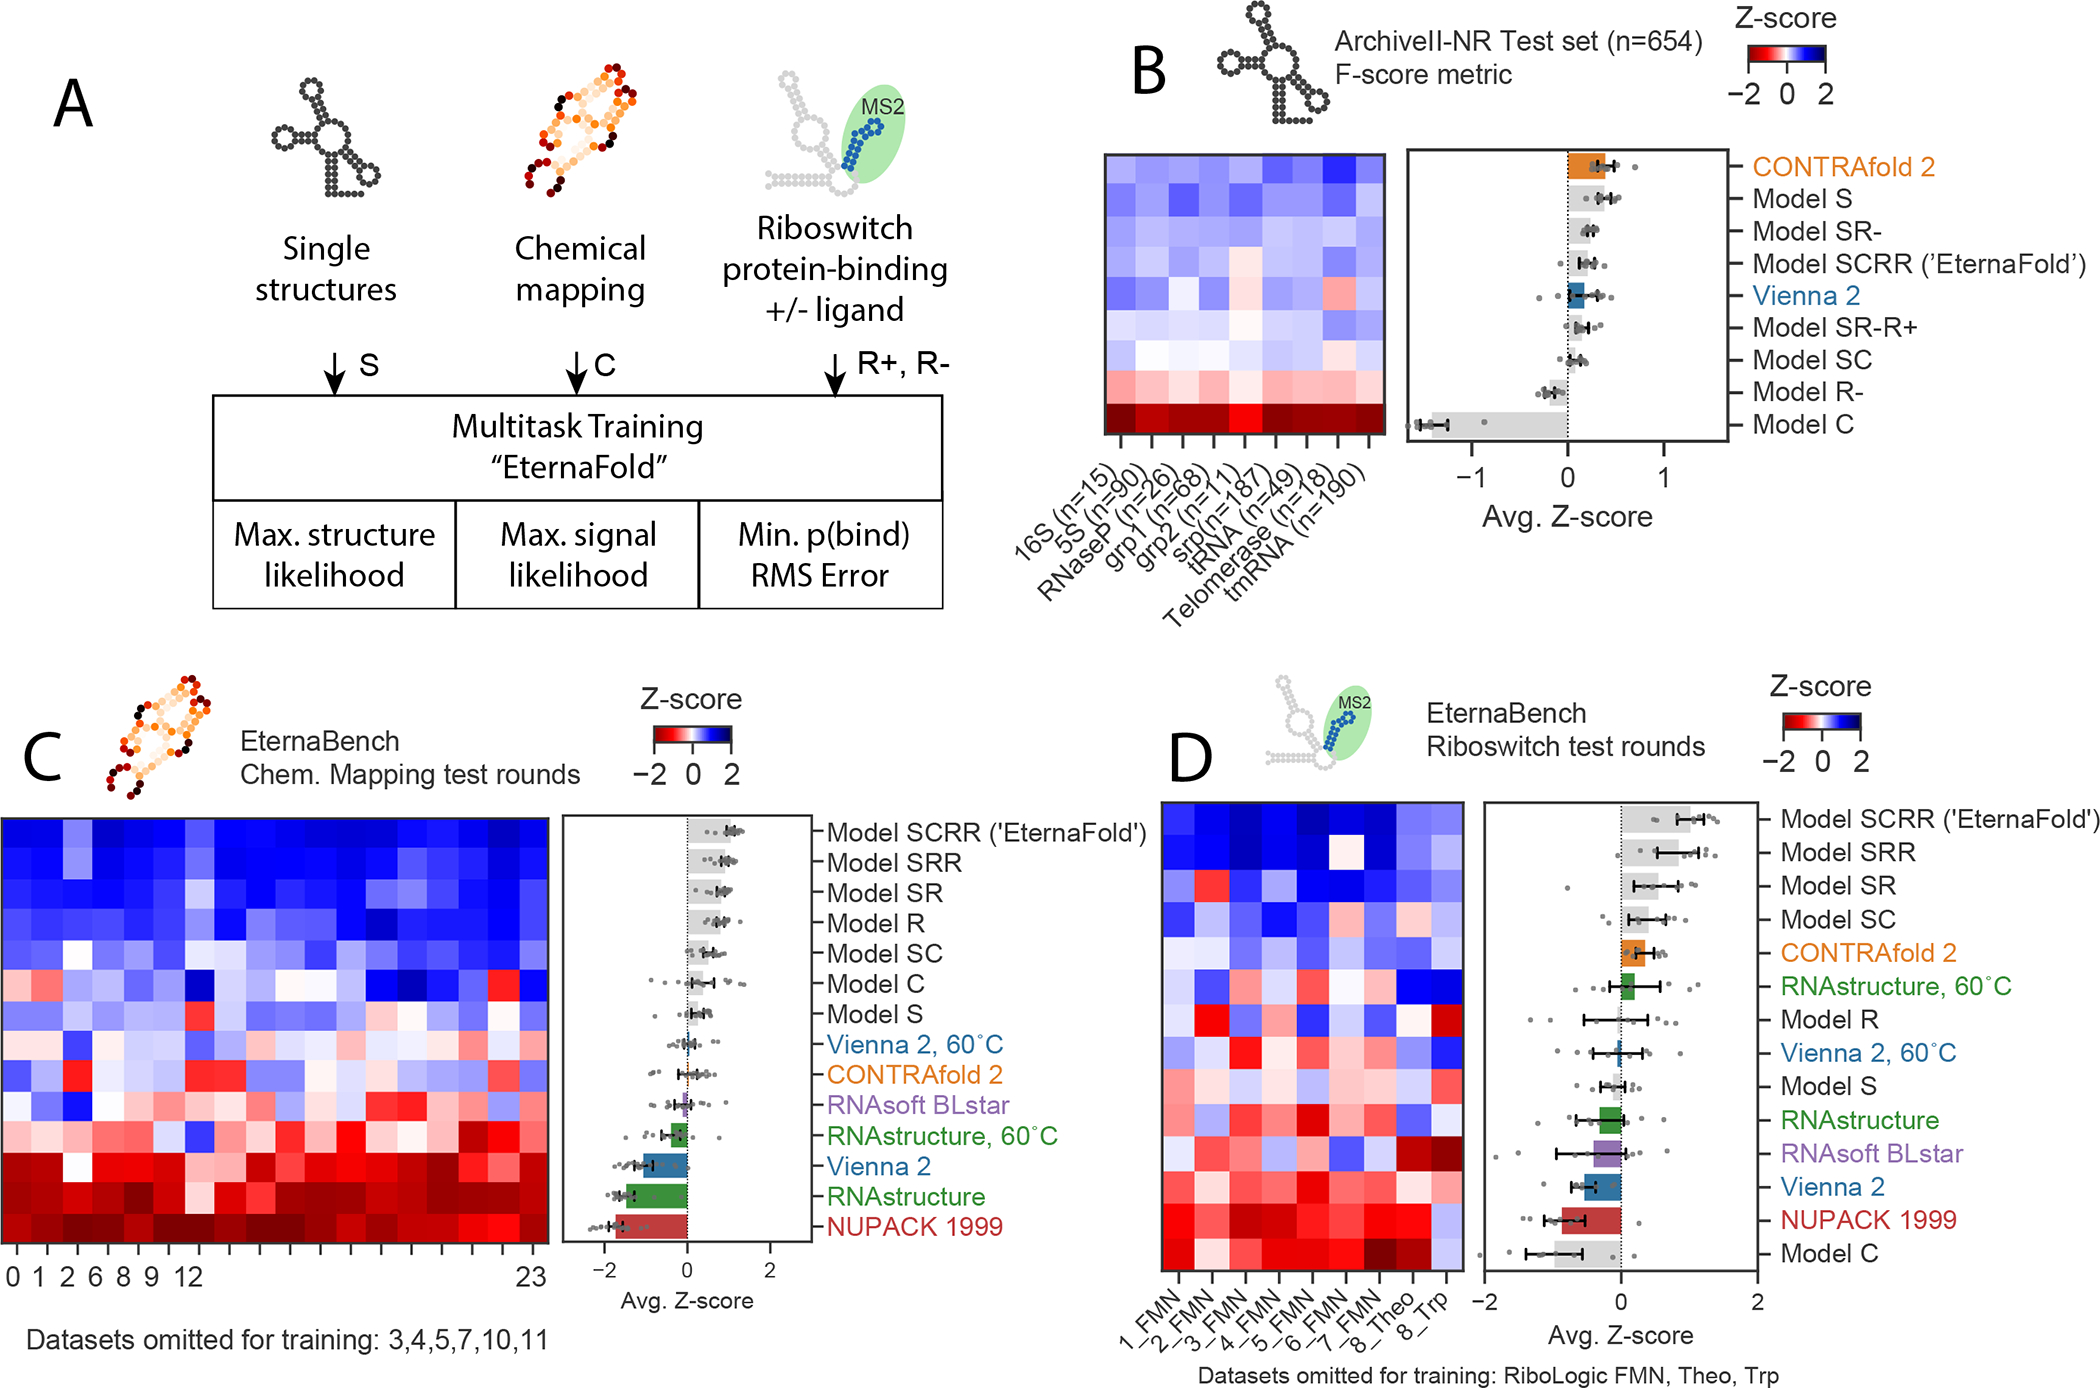
A) Scheme of data types used in multitask training and loss function used for each. B) Secondary structure prediction on ArchiveII-NR test set, prepared to contain <80% sequence similarity to secondary structure training data (see Methods), n=9 independent datasets with 654 constructs total. C) Z-score ranking over 18 test datasets for EternaBench Chemical Mapping filtered to contain constructs with <60% sequence similarity to all training data, n=18 datasets with 1,492 independent constructs total. D) Z-score ranking over 9 Riboswitch test sets for riboswitch KMS2 prediction filtered to contain constructs with <80% sequence similarity to all training data, n=9 datasets with 4,018 independent constructs total. In B, C, D, Error bars represent 95% confidence interval of the mean obtained over 1000 iterations of bootstrapping.
Comparing performance across models trained with different types of input data indicates some tradeoffs in performance. CONTRAfold 2 exhibited the highest accuracy, followed by “Model S”, trained only on single-structure prediction training data, exhibited the highest accuracy on the separate single-structure prediction test set, outperforming CONTRAfold 2 (Figure 3b, F-scores of 0.56(0.22), and 0.55(0.22) respectively). Incorporating other data types in model training resulted in F-scores worse than Model S on the ArchiveII-NR single-structure prediction test set but within error of CONTRAfold 2 (Figure 3B). Model “SCRR”, trained on four data types (single-structure data, chemical mapping, riboswitch and ) exhibited the highest performance on separate test sets for chemical mapping (Figure 3c) and riboswitch prediction (Figure 3d, data for all test sets in Table S8). We termed this SCRR model “EternaFold”.
Independent tests confirm EternaFold performance
We wished to test if EternaFold’s improvements in correlating p(unpaired) values to chemical mapping and protein-binding data generalized to improvement in predictions for datasets from other groups, experimental protocols, and RNA molecules. We compiled 36 datasets of chemical mapping data for molecules including viral genomes39–49 in cells and in virions, ribosomal RNAs44, 50, 51 both in cells and extracted from cells, synthetic mRNAs and RNA fragments designed to improve protein expression and in vitro stability19, 52, and mRNAs probed in various subcellular compartments and extracted from HEK 293 cells53 (Figure 4a, Table S9). These datasets spanned structure probing methods different from those used in the Eterna Cloud Labs (SHAPE-CE, SHAPE-MaP, DMS-MaP-seq vs. MAP-seq) as well as a variety of chemical modifications (DMS, icSHAPE, NAI). Most of these test molecules were much longer (thousands of nucleotides) than the 85-nucleotide RNAs used as the primary training data for EternaFold. Notably, 6 of these involved the SARS-CoV-2 genome46–48, which came into prevalence after the development of the EternaFold model, and represented a test of novel data. The following results are for P(unpaired) values calculated for overlapping windows of size 900, but other window sizes and Levenshtein distance metrics gave qualitatively similar results (Extended Data Figure 8). We wished to ascertain that the sequences in these datasets did not overlap with sequences that EternaFold had been trained on, so we also filtered these data using a windowed Levenshtein distance metric at a cutoff of 60% sequence similarity. This removed 37% of the originally collected sequences for a dataset size of 8734 sequences (Table S10).
Figure 4. EternaFold improved prediction extends across diverse natural RNA contexts and experiments.
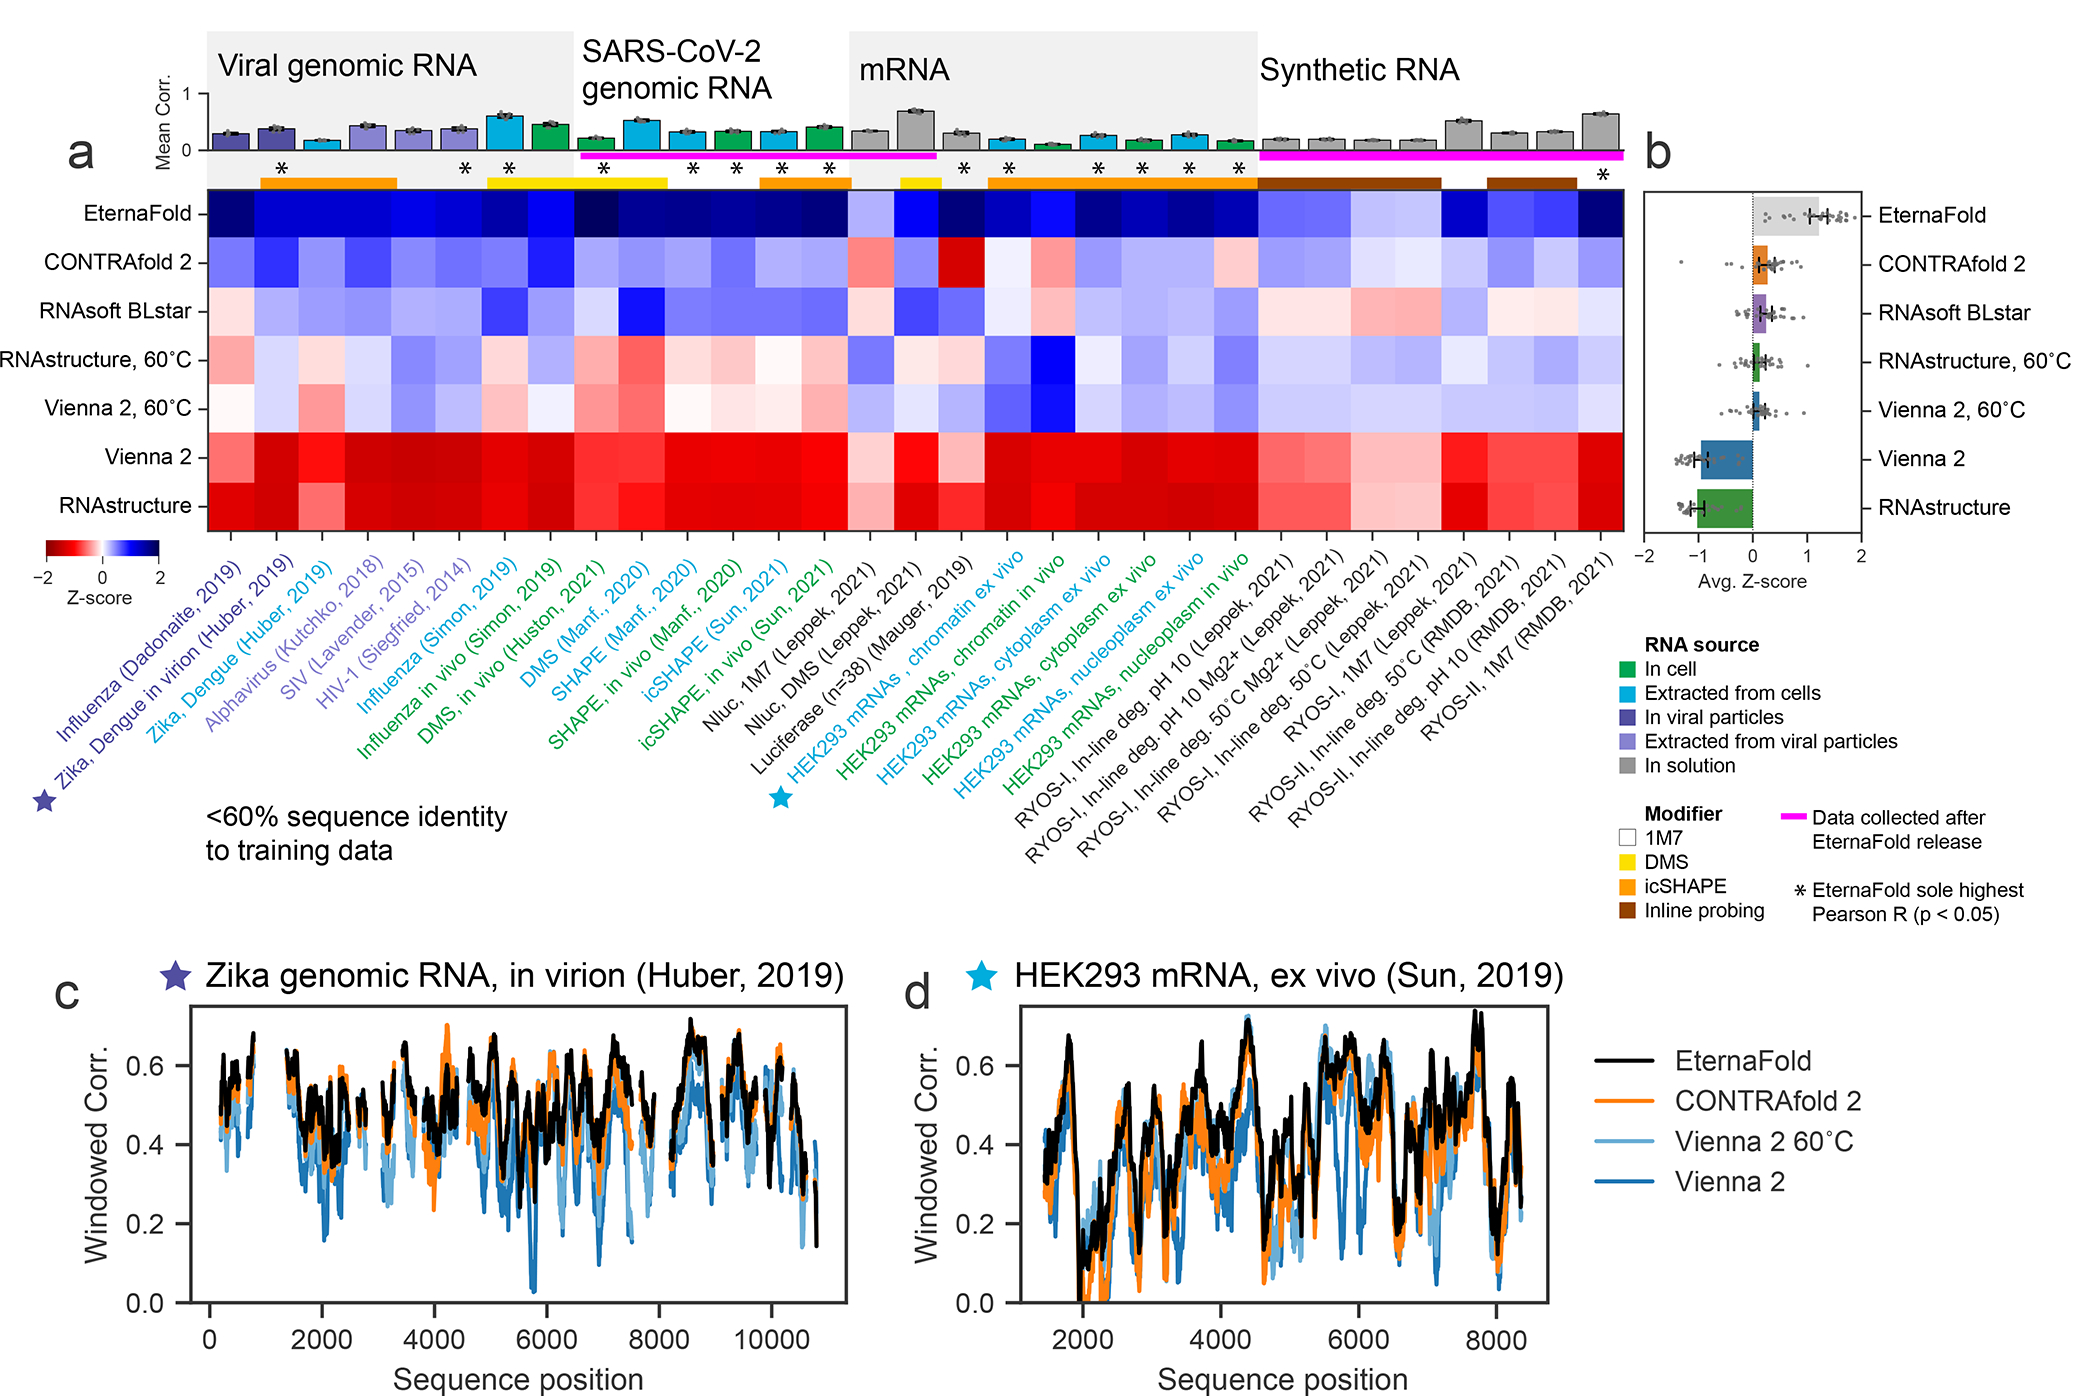
A) Mean package correlation for top-performing representative packages selected to benchmark for 31 independent chemical mapping datasets from a variety of biological contexts and with other chemical modifiers. Each dataset was filtered to contain sequences with <60% sequence similarity to the EternaFold training set. (B) EternaFold is ranked highest in average Z-score. Error bars represent 95% confidence interval of the mean obtained over 1000 iterations of bootstrapping over n=31 datasets from literature. Calculating correlations over sequence windows indicates that EternaFold demonstrates uniformly higher correlation across sequence position for two representative datasets: (C) Zika genome probed in virion (ref. 45), (D) Human mRNA ENST00000495843 probed ex vivo (ref. 53).
For 15/31 datasets across all categories, EternaFold exhibited the highest correlation coefficient (with p<0.05, determined by 95% overlapping CI, see Methods), and had the highest average Z-score (Figure 4b, Table 2). For the other 16 datasets, EternaFold was tied with other packages for having the highest correlation. EternaFold showed significant improvement (p<0.05) in datasets from varying sources including RNAs probed in cell (5/7 in cell datasets), extracted from cells (6/8), in virion (1/3), extracted from viral particles (1/2), and with other modifiers, including DMS (2/5) and icSHAPE (8/11). EternaFold was the top-scoring package (p<0.05) in 5 of the 6 datasets of novel SARS-CoV-2 data.
Table 2.
Average Z-score for each external RNA class.
| Viral genomic RNA | SARS-CoV-2 genomic RNA | mRNA | Synthetic RNA | Average across all datasets | |
|---|---|---|---|---|---|
| # Datasets | 8 | 6 | 9 | 8 | 31 |
| EternaFold | 1.29(0.21) | 1.65(0.12) | 1.26(0.43) | 0.75(0.50) | 1.21(0.47) |
| CONTRAfold | 0.61(0.17) | 0.38(0.09) | −0.10(0.56) | 0.27(0.13) | 0.27(0.41) |
| RNAsoft BLstar | 0.34(0.23) | 0.54(0.24) | 0.23(0.31) | −0.07(0.19) | 0.24(0.32) |
| RNAstructure, 60°C | 0.10(0.27) | −0.25(0.20) | 0.32(0.36) | 0.21(0.07) | 0.12(0.32) |
| ViennaRNA 2, 60°C | 0.04(0.26) | −0.25(0.22) | 0.37(0.25) | 0.18(0.03) | 0.11(0.30) |
| ViennaRNA 2 | −1.19(0.30) | −1.00(0.16) | −0.97(0.43) | −0.65(0.32) | −0.95(0.37) |
| RNAstructure | −1.20(0.26) | −1.06(0.16) | −1.11(0.34) | −0.70(0.38) | −1.02(0.35) |
Standard deviation of Z-scores in parentheses. Top-performing package for each is bolded.
We were curious as to whether the differences in packages arose from consistent accuracy differences across all regions of these RNAs or from a net balance of increased and decreased accuracies at specific subregions of the RNAs, which might reflect particular motifs that are handled better or worse by the different packages. We calculated correlations along the length of example constructs -- the Zika ILM genome probed in virion45 (Figure 4c), HEK293 mRNA ENST00000495843, extracted from chromatin and probed ex vivo53 (Figure 4d) -- and observed that EternaFold correlations generally demonstrated a fixed improvement across compared packages across all regions, supporting a consistent accuracy improvement by this package.
We also tested the ability of EternaFold to predict the thermodynamics of binding of human Pumilio proteins 1 and 2 in a dataset of 1405 constructs54. EternaFold showed no significant increase or decrease in predictive ability (p>0.05) when compared to CONTRAfold or ViennaRNA 2 at 37°C (Extended Data Figure 9a, Table S11).
Discussion
In this work, we have established EternaBench, benchmark datasets and analysis methods for evaluating package accuracy for two modeling tasks important in RNA structural characterization and design. These include 1) predicting unpaired probabilities, as measured through chemical mapping experiments, and 2) predicting relative stabilities of different conformational states, as exhibited in riboswitch systems. Unlike in single secondary structure prediction tasks, we demonstrate that both widely used and state-of-the-art machine-learning algorithms demonstrate a wide range in performance on these tasks. We averaged both rankings to acquire a final ranking of the tested external packages in Table 1.
Table 1.
Ranking by Z-score over 24 Chemical Mapping datasets (n=12,711 constructs), 12 Riboswitch datasets (n=7,228 constructs), and averaged over both dataset types.
| Package | ChemMapping Z-score mean(std) | Riboswitch Z-score mean(std) | Both dataset types mean(std) |
|---|---|---|---|
| CONTRAfold 2 | 1.14(0.69) | 1.03(0.43) | 1.09(0.61) |
| Vienna 2, 60°C | 1.12(0.29) | 0.65(0.34) | 0.89(0.38) |
| RNAsoft BL, no dangles | 0.88(0.34) | 0.79(0.57) | 0.84(0.43) |
| RNAstructure, 60°C | 0.71(0.57) | 0.86(0.36) | 0.78(0.51) |
| RNAsoft BLstar | 0.93(0.36) | 0.42(0.67) | 0.67(0.53) |
| CONTRAfold 1 | 0.57(0.99) | 0.45(0.65) | 0.51(0.88) |
| CONTRAfold 2, noncomplementary | 0.15(1.01) | 0.66(0.53) | 0.40(0.91) |
| Vienna 2, `RNASoft 2007` params | 0.33(0.45) | 0.38(0.37) | 0.35(0.42) |
| RNAsoft LAM-CG | 0.87(0.25) | −0.37(0.69) | 0.25(0.74) |
| Vienna 2, `Langdon 2018` params | 0.13(0.48) | 0.26(0.46) | 0.20(0.47) |
| RNAsoft 2007 | 0.89(0.21) | −0.54(0.40) | 0.17(0.74) |
| RNAsoft NOM-CG | 0.52(0.30) | −0.26(0.66) | 0.13(0.58) |
| Vienna 2 | −0.15(0.47) | 0.25(0.30) | 0.05(0.46) |
| RNAstructure | −0.55(0.50) | 0.43(0.51) | −0.06(0.68) |
| RNAstructure, no coaxial stacking | −0.60(0.55) | 0.19(0.51) | −0.21(0.65) |
| NUPACK 1999 | −0.86(0.30) | −0.06(0.33) | −0.46(0.49) |
| Vienna 1 | −0.96(0.56) | −0.02(0.79) | −0.49(0.78) |
| NUPACK 1995 | −0.86(0.31) | −0.19(0.33) | −0.52(0.45) |
| RNAsoft 1999 | −0.27(0.55) | −0.98(0.22) | −0.63(0.58) |
| RNAsoft 1999, no dangles | −0.27(0.55) | −0.99(0.22) | −0.63(0.58) |
| Vienna 2, no dangles | −0.24(0.47) | −1.48(0.26) | −0.86(0.72) |
| NUPACK 1999, no dangles | −0.88(0.47) | −1.42(0.36) | −1.15(0.50) |
| NUPACK 1995, no dangles | −0.88(0.47) | −1.44(0.35) | −1.16(0.51) |
| NUPACK 1999, 60° C | −1.72(0.89) | −1.13(0.41) | −1.42(0.81) |
Standard deviation of Z-score over datasets in parentheses. Top-performing package for each is bolded.
We discovered that CONTRAfold 2, which inferred thermodynamic parameters by feature representation in datasets of natural RNA secondary structures, performed best in this ranking, and performed significantly better than Vienna RNAfold, NUPACK, and RNAstructure, packages with parameters derived from thermodynamic experiments9. The results were particularly notable since the probed RNA molecules were designed for two distinct tasks (chemical mapping and riboswitch binding affinities), with no relationship between these two sets of sequences and no relationship between the synthetic sequences and natural sequences. We further investigated if combining these tasks in a multitask-learning framework could improve performance. We found that models trained on four types of data – single structures, chemical mapping data, and riboswitch affinities for both protein and small molecules – showed improved performance in predictions for held-out subsets of EternaBench datasets as well as improvements in datasets involving virus RNA genomes and mRNAs collected by independent groups.
The improved performance of CONTRAfold and RNAsoft – two packages developed by maximum likelihood training approaches – was not obvious prospectively. Statistically-learned packages could incorporate bias towards common motifs in the RNA structures that they were trained on and might overstabilize motifs simply due to their increased frequency rather than actual thermodynamic stability. Indeed, methods developed with a variety of more recent methodological advances, including machine learning from chemical mapping datasets (CROSS), deep learning methods for secondary-structure prediction (SPOT-RNA), extended parameter sets (CONTRAfold-noncomplementary, CycleFold, MXfold), or accelerated folding packages (LearnToFold), demonstrated diminished performance in the EternaBench tasks (Extended Data Figure 1a). It was surprising that well-developed and more widely used packages like ViennaRNA and RNAstructure gave worse performance than CONTRAfold and RNAsoft across all tasks, but that predictions from ViennaRNA and RNAstructure at 60°C showed notable improvement over the default of 37°C. This observation might be rationalized by discrepancies in ionic conditions used to measure these packages’ thermodynamic parameters, and the in vitro and in vivo conditions tested here.
We used the EternaBench datasets to train a thermodynamic model via multitask learning on secondary structure prediction, chemical mapping signal likelihood maximization, and minimizing error for riboswitch protein-binding prediction. The resulting model, termed EternaFold, performed best across 31 external datasets in 4 categories of natural and synthetic RNAs (Table 2) in a variety of cellular contexts, including RNAs probed in and extracted from cells and viral particles. It was not obvious that a model trained on datasets collected in vitro would demonstrate improvement on the variety of contexts for which we collected datasets. Although many factors influence RNA structure in cells beyond thermodynamic base-pairing55, this demonstrates that existing natural RNA datasets are indeed capable of discriminating between ensemble-averaged base-pairing predictions, and that accurate prediction of chemical mapping signal presents an ensemble-aware target for RNA secondary structure algorithm improvement.
The improvements from multitask training in EternaFold indicated that the nearest-neighbor model encoded in CONTRAfold had sufficient representational capacity to gain improvement on the chemical mapping and riboswitch prediction tasks. A notable area of algorithm development and potential improvement is the systematic evaluation of structure prediction methods that incorporate structure mapping data8, 55, 56. We implemented data-driven folding in EternaFold and tested on a collection of 13 structured RNAs as well as 3 other independent datasets. We found that EternaFold-SHAPE resulted in the highest mean MCC over all these datasets (0.842), but was not statistically significant over several other algorithms in use for SHAPE-directed folding, such as SHAPEknots57 and the heuristic developed by Zarringhalam et al.58 implemented in ViennaRNA (mean MCCs of 0.820 and 0.830 respectively, Extended Data Figure 9c, Table S12), indicating potential for improvement. Another limitation of the resulting EternaFold algorithm is that it does not contain distinct terms for entropy, enthalpy, and ionic concentrations. The resulting coefficients represent free energies of the included features at room temperature and the given ionic concentrations. Future work creating temperature-and salt-dependent models may benefit from analogous ensemble-aware fitting procedures collected at varying temperatures and ionic concentrations. Further improvements in modelling may arise from applying more sophisticated graph-59 and language-based60 architectures to predicting RNA thermodynamics. Further investigations will also be necessary to improve performance and aspects of the model that need to be expanded, which may include noncanonical pairs12, more sophisticated treatment of junctions61, next-nearest-neighbor effects14, and chemically modified nucleotides62. Orthogonal 3D structure methods such as nuclear magnetic resonance (NMR) spectroscopy63 and cryo-electron microscopy64 will likely be instrumental to these pursuits. Taken together, the datasets presented here serve as an important starting point for evaluating and improving future RNA structure prediction algorithms.
Online Methods
The algorithms evaluated in this work model secondary structure in the following manner. Given a model Θ, which is comprised of a set of structural features {θ}, the partition function of an RNA sequence x is computed as
| (1) |
where ΔG(θk) is the free energy contribution of structural feature k, kB is Boltzmann’s constant, and T is temperature. Z represents a sum over the set of all possible structures {S} 1. From this expression, the probability of any particular structure s is defined as
| (2) |
Chemical mapping prediction theoretical basis
Structure prediction algorithms are able to estimate the ensemble-averaged probability that a nucleotide is paired or unpaired. Let p(i: j|x, Θ) be the probability of bases i and j being paired, given sequence x and model Θ. For simplifying notation, we continue with implicit x and Θ, i.e., p(i: j│x, Θ) = p(i: j). This is computed as
| (3) |
where s(i: j) denotes a structure containing the base pair i:j, and {S} is the full set of possible structures. These posterior probabilities are analytically calculated by all the algorithms tested here. The probability of any single base being unpaired can be computed as
| (4) |
The relationship between the probability of a nucleotide being unpaired and its experimentally-measured reactivity has served as a locus for many efforts for improving structure prediction of RNA constructs incorporating chemical mapping data from those constructs, and several functional forms have been used to describe the relationship between unpaired probability and chemical mapping reactivity2–4. In this work, we use the linear Pearson correlation coefficient between unpaired probability and experimentally measured reactivity as a measure of model quality. In the following, we describe the simple model under which this linear assumption holds. We write the probability nucleotide i is modified at time t as
| (5), |
Where kmod(i) is the rate of modification for nucleotide i. The measured chemical modification signal is an ensemble population average, where the time exposure of the ensemble to the modifier has been limited to aim to achieve “single-hit kinetics” with single-hit frequency, so that the degree of modification in experiment is proportional to the rate of modification5. In other words, because kmod(i) t ≪ 1, we can approximate
| (6) |
This expression assumes that each RNA molecule is not heavily modified, such that kmod(i) for each nucleotide is independent of the modification state of other nucleotides. If we assume that the timescale of chemical modification is much slower than the timescale of fluctuation between structural ensemble states, then we may write the overall modification rate for each nucleotide i as averaged over the equilibrated structure ensemble of the RNA,
| (7) |
If we consider a simplest two-state model for each nucleotide, with modification rate kpr if paired and a rate kunp if unpaired, then this reduces to
| (8) |
which demonstrates that under this simple model, the modification rate is linear with respect to p(unpaired). The model above is limited in its assumption of two states and does not account for reactivity effects caused by sequence and local environment. For instance, Hoogsteen conformations in G-A and G-G mismatches expose the Watson-Crick faces of purine nucleobases, resulting in higher DMS reactivity6. A Spearman rank correlation (Extended Data Figure 1c), which will be more dominated by relative rankings, results in a similar overall ranking.
Chemical mapping data
Chemical mapping data for the Eterna Cloud Lab experiments were downloaded from RMDB7 and processed with RDATKit (https://ribokit.github.io/RDATKit/). The RNA was probed with the MAP-seq protocol with a co-loaded standard molecule (P4-P6-2HP RNA) to enable normalization, as described in ref. 8; measurements were carried out at ambient temperatures (24 °C) with 10 mM MgCl2, 50 mM Na-HEPES, pH 8.0. Data were processed using MAPseeker9 with standard settings.
Within each chemical mapping dataset, CD-HIT-EST10 was used to filter sequences with greater than 80% redundancy (excluding a shared 3’ primer binding site). From each sequence cluster identified, the sequence with the highest signal-to-noise ratio from chemical mapping experiments was selected as the representative sequence. These datasets ranged in size from 605 (Round 15) to 3378 constructs (Round 23), with a median size of 1577; after filtering, they ranged from 101 (Round 12) to 1088 (Round 1), with a median size of 562 (Extended Data Figure 3, Table S2). The filtered 24 datasets comprised 12,711 individual constructs, and distributions of GC content, average sequence length, and number of loops in the target structures were not significantly impacted (Extended Data Figure 3).
Nucleotides with reactivities less than zero or greater than the 95th percentile of the dataset were removed from analysis. Cloud Lab Round 2 was filtered to exclude certain experiments that had FMN present, pertaining to Eterna Cloud Lab challenges to design riboswitches. Adenosine nucleotides preceded by 6 or more As were also removed due to evidence of anomalous transcription effects in such stretches 11. External chemical mapping datasets were obtained from the supplementary information from the papers and processed similarly (outliers, nucleotides in poly-A stretches removed).
Analyzing package performance by Cloud Lab project
We wished to understand if factors such as target structure complexity, GC content, and sequence length influenced package predictions. We performed the same package ranking analysis, grouping constructs by their projects instead of by the 24 datasets. Because grouping constructs into projects sometimes resulted in a small number of nucleotides over which to calculate correlations, we omitted package predictions where the standard error of the calculated Pearson correlation was greater than 0.05. This resulted in a total of 612 project groupings remaining, names, and calculated metrics for which are contained in Table S4.
We found weak correlation between the per-project Z-score of the top-performing package, CONTRAfold 2, and GC content (Spearman R = 0.15), sequence length (0.07), and total loops in the target structure (R=0.16). There were also weak correlations between the average Pearson Correlation for all packages and GC content (Spearman R = 0.10), sequence length (R=−0.24), and total target structure loops (R=−0.01) (Extended Data Figure 1d).
Riboswitch activity prediction theoretical basis
A thermodynamic framework discussed in greater detail in ref. 12 allows us to relate the observed binding affinity of an output molecule to the relative populations of a riboswitch molecule in different states. In the absence of input ligand, we may relate the probability that a riboswitch adopts a structural feature that can bind its output, p(out), to an experimentally measured binding affinity, , via the relative ratios of both values to those of a reference state:
| (9) |
We selected the MS2 hairpin aptamer as a reference state whose probability of forming, pref(out), can be estimated by the secondary structure algorithm. For each separate independent experimental dataset, is estimated as the strongest affinity measured (Extended Data Figure 10a). We refer to the estimated ratio as in the main text, as the equilibrium constant of forming the MS2 hairpin as normalized to the reference state.
Although there may be error introduced in which experimental point is selected to be , relative error should be constant when comparing packages on the same dataset. To compare packages, we report the correlation between and which excludes the effect of selection for .
In general, the probability of an RNA molecule forming any structure motif is computed as
| (10) |
where smotif denotes a structure containing that motif. Computing this probability requires a dynamic programming routine that is able to constrain the sampled structure space to only structures containing that motif to estimate a so-called “constrained partition function”. However, not all secondary structure algorithms have implemented constrained partition function estimation. Because the MS2 aptamer is a hairpin, we can approximate its probability of forming as the probability of forming the final base pair of the MS2 hairpin aptamer, an experimental observable that can be estimated by all the packages tested here. Thus, our prediction of interest is
| (11) |
where i and j are the nucleotides forming the terminal base pair in the MS2 aptamer stem. The value pref(i: j) is accordingly computed as the probability of closing the base pair in the reference sequence. We confirmed that calculations using eqn. 9 and eqn. 11 agree for Vienna, RNAstructure, and CONTRAfold packages.
Predicting protein-binding affinities with input ligand bound.
The estimation of follows similarly to above but accounts for increased thermodynamic weights for states that correctly display the aptamer of the input small molecule ligand. Therefore, it cannot be estimated via the simplified single base pair calculation and must make use of constrained partition functions (eq. 10).
Analogously to eq. 9, we define as
| (12) |
which is calculated as
| (13), |
where Zlig is the constrained partition function of the state including the ligand aptamer (calculated in each algorithm as described in the next section), ZMS2 is the partition function for the state including the MS2 aptamer, and Zlig,MS2 is the partition function of the state including both ligand aptamer and MS2 aptamer. The constant is the Boltzmann weight of binding the ligand when the bulk concentration of the ligand is [ligand]. Values used for calculating b are in Table S14. Representative predictions of vs. experimental values are in Extended Data Figure 10b.
Riboswitch data
Riboswitch data were downloaded from supplementary materials from refs. 13 and 14. In brief, measurements were carried out at 37 °C in 100 mM Tris-HCl, pH 7.5, 80 mM KCl, 4 mM MgCl2, 0.1 mg/mL BSA, 1 mM DTT, 0.01 mg/mL yeast tRNA, 0.01% Tween-20, and varying concentrations of small molecule ligand (FMN, theophylline, tryptophan) and MS2 coat protein. Datasets were filtered to only include constructs with more than 50 copies of the sequence represented in the RNA-MaP experiment, constructs that included the canonical MS2 and small molecule aptamers, and filtered using CD-HIT-EST10 to remove sequence redundancy over 80%. As per the CD-HIT-EST algorithm default, the longest sequence per cluster was maintained. If all sequences were the same length, the first sequence was used. After filtering, the riboswitch datasets comprised of 7,228 constructs in total. Scripts to replicate data processing from refs. 13 and 14 are included in the EternaBench software repository.
For all constructs as well as the reference MS2 hairpin construct, we performed estimations including a flanking hairpin included in the Illumina array experiments, described in ref. 13. As an example, the full reference MS2 hairpin construct, as well as the constraint used for estimating with constrained-partition-function-based estimation, is reproduced below. The MS2 hairpin construct is underlined and the nucleotides in the base used for base-pair-based prediction are bolded.
GGGUAUGUCGCAGAAACAUGAGGAUCACCCAUGUAACUGCGACAUACCC
...............(((((x((xxxx)))))))...............
The riboswitches in EternaBench-Switch are controlled by the small molecules FMN, tryptophan, or theophylline. Motifs, concentrations, and intrinsic Kdvalues used for prediction, taken from refs. 13 and 14, are provided in Table S14.
EternaFold Multi-task learning
The CONTRAfold15 loss function optimizes the conditional log-likelihood of ground-truth structure s(i) given sequence x(i) over dataset D:
| (14) |
In CONTRAfold-SE16, the authors include a term to also use chemical mapping data to optimize structure prediction by maximizing the likelihood of observing the included chemical mapping dataset. The loss function then becomes
| (15) |
where d are the chemical mapping datapoints from construct x. CONTRAfold-SE fits reactivity signals to gamma distributions for each nucleotide type (A,C,G,U) and whether the base is paired or unpaired, parameters for which are represented by ϕ.
We further included a term to minimize the mean squared error of predicted and :
| (16) |
The full loss function for EternaFold is thus written as
| (17) |
The hyperparameters wCM, w−lig, w+lig, corresponding to the relative weights placed on different data types, were selected through a grid search on the holdout sets STRAND-holdout, EternaBench-CM-holdout, and EternaBench-Switch-holdout (data not shown). The final values used for training were wCM = 0.5, w−lig = 30, w+lig = 30.
Dataset selection for training and testing EternaFold.
Single-structure data.
For training EternaFold, we used the S-Processed dataset17 train and holdout sets used previously in training CONTRAfold 2 and RNAsoft18, to keep the same datasets consistent with these algorithms. However, we found that the S-Processed test set had 68% and 52% redundancy to the S-Processed train and holdout sets, respectively, using CD-HIT-EST-2D. We therefore created a new secondary structure test set by filtering the more recent ArchiveII dataset19 for constructs with <80% sequence similarity to any sequence across all 3 data types used in EternaFold training. We also evaluated EternaFold performance on structure prediction for the S-Processed test set, and found qualitatively similar results to the ArchiveII-NR test set (Extended Data Figure 9b, compare to Fig. 3b).
Cloud lab chemical mapping data.
We used Rounds 3,4,5,7,10,11 as training and holdout data. This was to be consistent with the training data used in CONTRAfold-SE16, and to reserve Rounds 0 and 1 as test rounds, given their large size and high signal-noise ratio. GC content, sequence length, total loops in the target structure, and signal/noise ratio were equivalent across train, holdout, and test rounds (Extended Data Figure 3c).
Riboswitch data.
We partitioned the RiboLogic dataset into our training, holdout and test sets due to the high signal-noise ratio and diversity of structures, subdividing the riboswitches so that each split contained identical fractions of FMN-, theophylline-, and tryptophan-responsive riboswitches. This left the rest of the Eterna riboswitch rounds as test sets (Extended Data Figure 3d.
Test dataset filtering
To filter test datasets based on sequence similarity to the EternaFold training data, we implemented a “windowed Levenshtein distance”. We calculated Levenshtein distance across sliding windows of the longer sequence that are the length of the shorter sequence. A sequence was counted as redundant at X% cutoff if any window had a Levenshtein edit distance smaller than (100-X)% the window size. Table S10 contains test dataset sizes before and after filtering at a windowed Levenshtein distance cutoff of 80%, 60%, and 40%. As a point of comparison, uniformly-distributed, randomly-generated 50-mers, 100-mers, and 200-mers were calculated to have average Levenshtein distances of 42%, 44%, and 45%, respectively.
Evaluating base-pair probabilities for external datasets
For comparing p(unpaired) calculations to natural RNAs, many of which are thousands of nucleotides long, we compared several practices for calculating, which includes predicting base-pair probabilities from overlapping windows, constraining the nucleotides under consideration using a beam search algorithm implemented in LinearPartition20, and conventional folding of the entire RNA. Windows of length 300, 600, 900, and 1200 with 25-nt overlap. Results from length 900 are shown in the main text, though results are similar for other window sizes (Extended Data Figure 8a).
SHAPE-directed folding evaluation
We implemented SHAPE-directed folding in EternaFold in the following way: for an RNA sequence x with length L, let dj be the probing signal at nucleotide j in the sequence. The joint probability for structure s and the vector of reactivities d is given as
| (18) |
Where θ represents the learned set of thermodynamic parameters and ϕ represents the parameters learned for 8 Gamma distributions defining the reactivities of A,C,G,U being paired or unpaired (Extended Data Figure 9d), and κ is a parameter specifying the relative weight of the evidence. Predicting a maximum likelihood structure given an observed reactivity vector , is calculated as
| (19) |
The maximum expected accuracy structure is calculated using the same SHAPE-weighted partition function and the expression
| (20) |
Where is the pseudo-accuracy measure described in detail in ref. 15 and s* is the (unknown) true structure.
When the EternaFold parameters were initially trained, κ was set to 1. To fit κ in the context of SHAPE-directed folding, we used the SHAPEknots training dataset and calculated the Mathews Correlation Coefficient (MCC). This dataset consists of 16 RNAs with known 3D structure and was used similarly to tune parameters in SHAPEknots21 and for the default settings of 3 formulas present in the ViennaRNA package. We refer to this model as EternaFold-SHAPE.
We compared EternaFold-SHAPE to SHAPEknots21, RNAstructure with structure probing (but not pseudoknots as in SHAPEknots), three algorithms implemented in ViennaRNA from Washietl2, Deigan22, and Zaringhalam23, as well as RNAstructure, ViennaRNA, and EternaFold predictions without reactivity data. We also evaluated the algorithms on the SHAPEknots-TEST dataset, as well as datasets from Chen and Kappel which included DMS probing data for RNAs with secondary structures validated by other methods (Extended Data Figure 9c, full dataset in Table S12).
We calculated mean Mathews Correlation Coefficient across datasets and averaged these values. We found that EternaFold+SHAPE resulted in the highest mean MCC over test constructs of 0.842, but this was not statistically significant (evaluated as p<0.05) over SHAPEknots (MCC=0.818), EternaFold without SHAPE data (MCC=0.814), ViennaRNA with the heuristic developed by Zarringhalam (MCC=0.828), RNAstructure with SHAPE data (MCC=0.803), or Vienna RNAfold 2 (MCC=0.801). Statistical significance was evaluated using a two-sided t-test for related values. Table S12 contains predicted SHAPE- or DMS-directed MFE structures for the dataset in all evaluated algorithms.
SHAPE and DMS probing by capillary electrophoresis of 13 structured RNAs for SHAPE-directed folding evaluation
DNA template preparation.
DNA templates were designed to include the 20-nt T7 RNA polymerase promoter sequence followed by a sequence encoding the desired RNA flanked by two hairpins used to normalize the resulting signal8. Double-stranded templates were prepared by the extension of 60-nt DNA oligomers (IDT, Integrated DNA Technologies) with Phusion polymerase, using the following thermocycler protocol: denaturation for 30 sec at 98°C, 35 cycles of denaturation for 10 sec at 98°C, annealing for 30 sec at 60 to 64°C, extension for 30 sec at 72°C, final extension for 10 min at 72°C and cooling to 4°C. DNA samples were purified with AMPure XP beads (Beckman Coulter), following manufacturer’s instructions. Sample concentrations were estimated based on UV absorbance at 260 nm measured on Nanodrop spectrophotometer. Verification of template length was accomplished by electrophoresis of all samples and 10-bp and 20-bp ladder length standards (Thermo Scientific O’RangeRuler SM1313 & SM1323) in 4% agarose gels (containing 0.5 mg/mL ethidium bromide) and 1x TBE (100 mM Tris, 83 mM boric acid, 1 mM disodium EDTA).
Preparation of RNA templates.
In vitro transcription reactions were carried out in 40 μL volumes with 10 pmol of DNA template, using the TranscriptAid T7 High Yield Transcription Kit (Thermo Fisher). Reactions were incubated for 3 hours at 37°C, followed by degradation of DNA template with 2 μL of DNase I at 37°C for 30 min. RNA samples were purified using the Zymo RNA Clean and Concentrator-25 kit (Zymo Research). Concentrations were measured by absorbance at 260 nm on Nanodrop spectrophotometers.
SHAPE mapping.
1.2 pmol of purified RNA was added to 2 μL of 500 mM Na- HEPES buffer (pH 8.0) and denatured at 90°C for 3 minutes. The reaction was then cooled down to room temperature over 10 minutes. 2 μL of 100 mM MgCl2 was then added, followed by incubation at 50°C for 30 minutes. The sample was cooled down to room temperature over 20 minutes before addition of 5 μL of nuclease-free water (negative control) or 1-methyl-7-nitroisatoic anhydride (1M7, 8.48 mg/mL of DMSO) followed by incubation at room temperature for 15 min, and brought to a final volume of 20 μL with nuclease-free water. The SHAPE-RNA sample was further purified by incubating the sample with 5.0 μL of Na-MES, pH 6.0, 3.0 μL of 5 M NaCl, 1.5 μL of Oligo dT bead, 0.25 μL of 10 μM FAM-A20-Tail2, and brought to a final volume of 10 μL with nuclease-free water. The reaction mixture was incubated at room temp for 15 min, pulled down by 96-post magnetic stand for 10 min, washed twice with 70% ethanol and allowed to dry, before adding 2.5 μL of nuclease-free water.
DMS mapping.
5 μL of RNA stock in H2O containing 12.5 pmol of RNA was mixed with 5 μL of 1× TE (Ambion) and denatured by incubating at 95 °C for 2 min, and then cooling on ice for 1 min. Then 12.5 μL of 2× buffer (600 mM Na-cacodylate, pH 7.0, and 20 mM MgCl2) was added, and the RNA was incubated at 37 °C for 30 min to fold. RNAs were modified by adding 2.5 μL of DMS (1.7 M in 100% ethanol); for no-modification controls, 2.5 μL of 100% ethanol was added instead. Reactions were incubated at 37 °C for 6 min, and then quenched with 25 μL of 2-mercaptoethanol.
Preparing samples for capillary electrophoresis.
cDNA was prepared from in-line probing and SHAPE RNA samples as follows (note that above procedures leave RNA bound to FAM-A20-Tail2 reverse transcription primers which are in turn bound to Oligo dT beads). 2.5 μL of purified RNA was added to a reaction mixture containing 1x First Strand buffer (Thermo Fisher), 5 mM dithiothreitol (DTT), 0.8 mM dNTPs, 0.2 μL of SS-III RTase (Thermo Fisher) to a final volume of 5.0 μL. The reaction was incubated at 48°C for 40 minutes, and stopped with 5 μL of 0.4 M sodium hydroxide. The reaction was then incubated at 90°C for 3 minutes, cooled on ice for 3 minutes, and neutralized with 2 μL of quench mix (2 mL of 5 M sodium chloride, 3 mL of 3 M sodium acetate, 2 mL of 2 M hydrochloric acid). For four cDNA reference ladders, each of four ddNTPs (GE Healthcare 27-2045-01) with a ddNTP/dNTP ratio of 1.25 (0.1 mM / 0.08 mM) was used in the reverse-transcription reaction.
cDNA was pulled down on a 96-post magnetic stand and washed 2 times with 100 μL 70% ethanol. To elute the bound cDNA, the magnetic beads were resuspended in 10.0625 μL ROX350 (Thermo Fisher Scientific 401735) /Hi-Di (0.0625 μL of ROX 350 ladder in 10 μL of Hi-Di formamide) and incubated at room temperature for 20 minutes. The cDNA was further diluted by 1/3 and 1/10 in ROX350/HiDi and samples loaded onto capillary electrophoresis sequencers (ABI-3730) on capillary electrophoresis (CE) services rendered by ELIM Biopharmaceuticals. CE data was analyzed using the HiTRACE 2.0 package (https://github.com/ribokit/HiTRACE), following the recommended steps for sequence assignment, peak fitting, background subtraction of the no-modification control, correction for signal attenuation, and reactivity profile normalization.
Error and Significance Estimation
We estimated confidence intervals on reported Pearson correlation values by bootstrapping the datapoints under consideration and reporting the 2.5th and 97.5th percentile over 1000 rounds of bootstrapping. Reported standard error values are estimated by calculating the standard deviation across bootstrapping rounds. We inferred significance in differences between package correlations by analyzing overlap between 95% confidence interval estimates24, 25. All code to reproduce significance analyses is included in the EternaBench repository.
Data availability
All datasets used here for evaluation are available at https://www.github.com/eternagame/EternaBench. The original cloud lab datasets are available at the RNA Mapping Database7 under accession IDs ETERNA_R00_0000 (Round 00), ETERNA_R69_0000 (Round 01), ETERNA_R70_0000 (Round 02), ETERNA_R71_0000 (Round 03), ETERNA_R72_0000 (Round 04), ETERNA_R73_0000 (Round 05), ETERNA_R74_0000 (Round 06), ETERNA_R75_0000 (Round 07), ETERNA_R76_0000 (Round 08), ETERNA_R77_0002 (Round 09), ETERNA_R78_0001 (Round 10), ETERNA_R79_0001 (Round 11), ETERNA_R80_0001 (Round 12), ETERNA_R81_0001 (Round 13), ETERNA_R82_0001 (Round 14), ETERNA_R83_0003 (Round 15), ETERNA_R84_0000 (Round 16), ETERNA_R85_0000 (Round 17), ETERNA_R86_0000 (Round 18), ETERNA_R87_0001 (Round 19), ETERNA_R89_0000 (Round 20), ETERNA_R91_0000 (Round 21), ETERNA_R92_0000 (Round 22), ETERNA_R94_0000 (Round 23). A list of RMDB accession IDs or urls corresponding to the data used for benchmarking SHAPE-guided folding is in Table S12.
Code availability
The datasets used here for evaluation, as well as scripts and Python notebooks for reproducing the filtered datasets and the chemical mapping and riboswitch affinity calculations described here, are available at https://www.github.com/eternagame/EternaBench. The code for training EternaFold, as well as the training and test sets used, are available at https://eternagame.org/about/software as the package “EternaFold”. The EternaFold code is derived from the CONTRAfold-SE16 codebase, which is derived from the CONTRAfold15 codebase.
Package predictions
All base-pairing probability calculations and constrained partition function calculations were performed using standardized system calls through Python wrappers developed in Arnie (www.github.com/DasLab/arnie). Example command-line calls for each package option evaluated are provided in Table S1. Datasets were processed with Pandas (https://github.com/pandas-dev/pandas) and visualized with Seaborn (https://seaborn.pydata.org/).
Extended Data
Extended Data Fig. 1. Extended analysis of package rankings based on Eterna Cloud lab chemical mapping data.
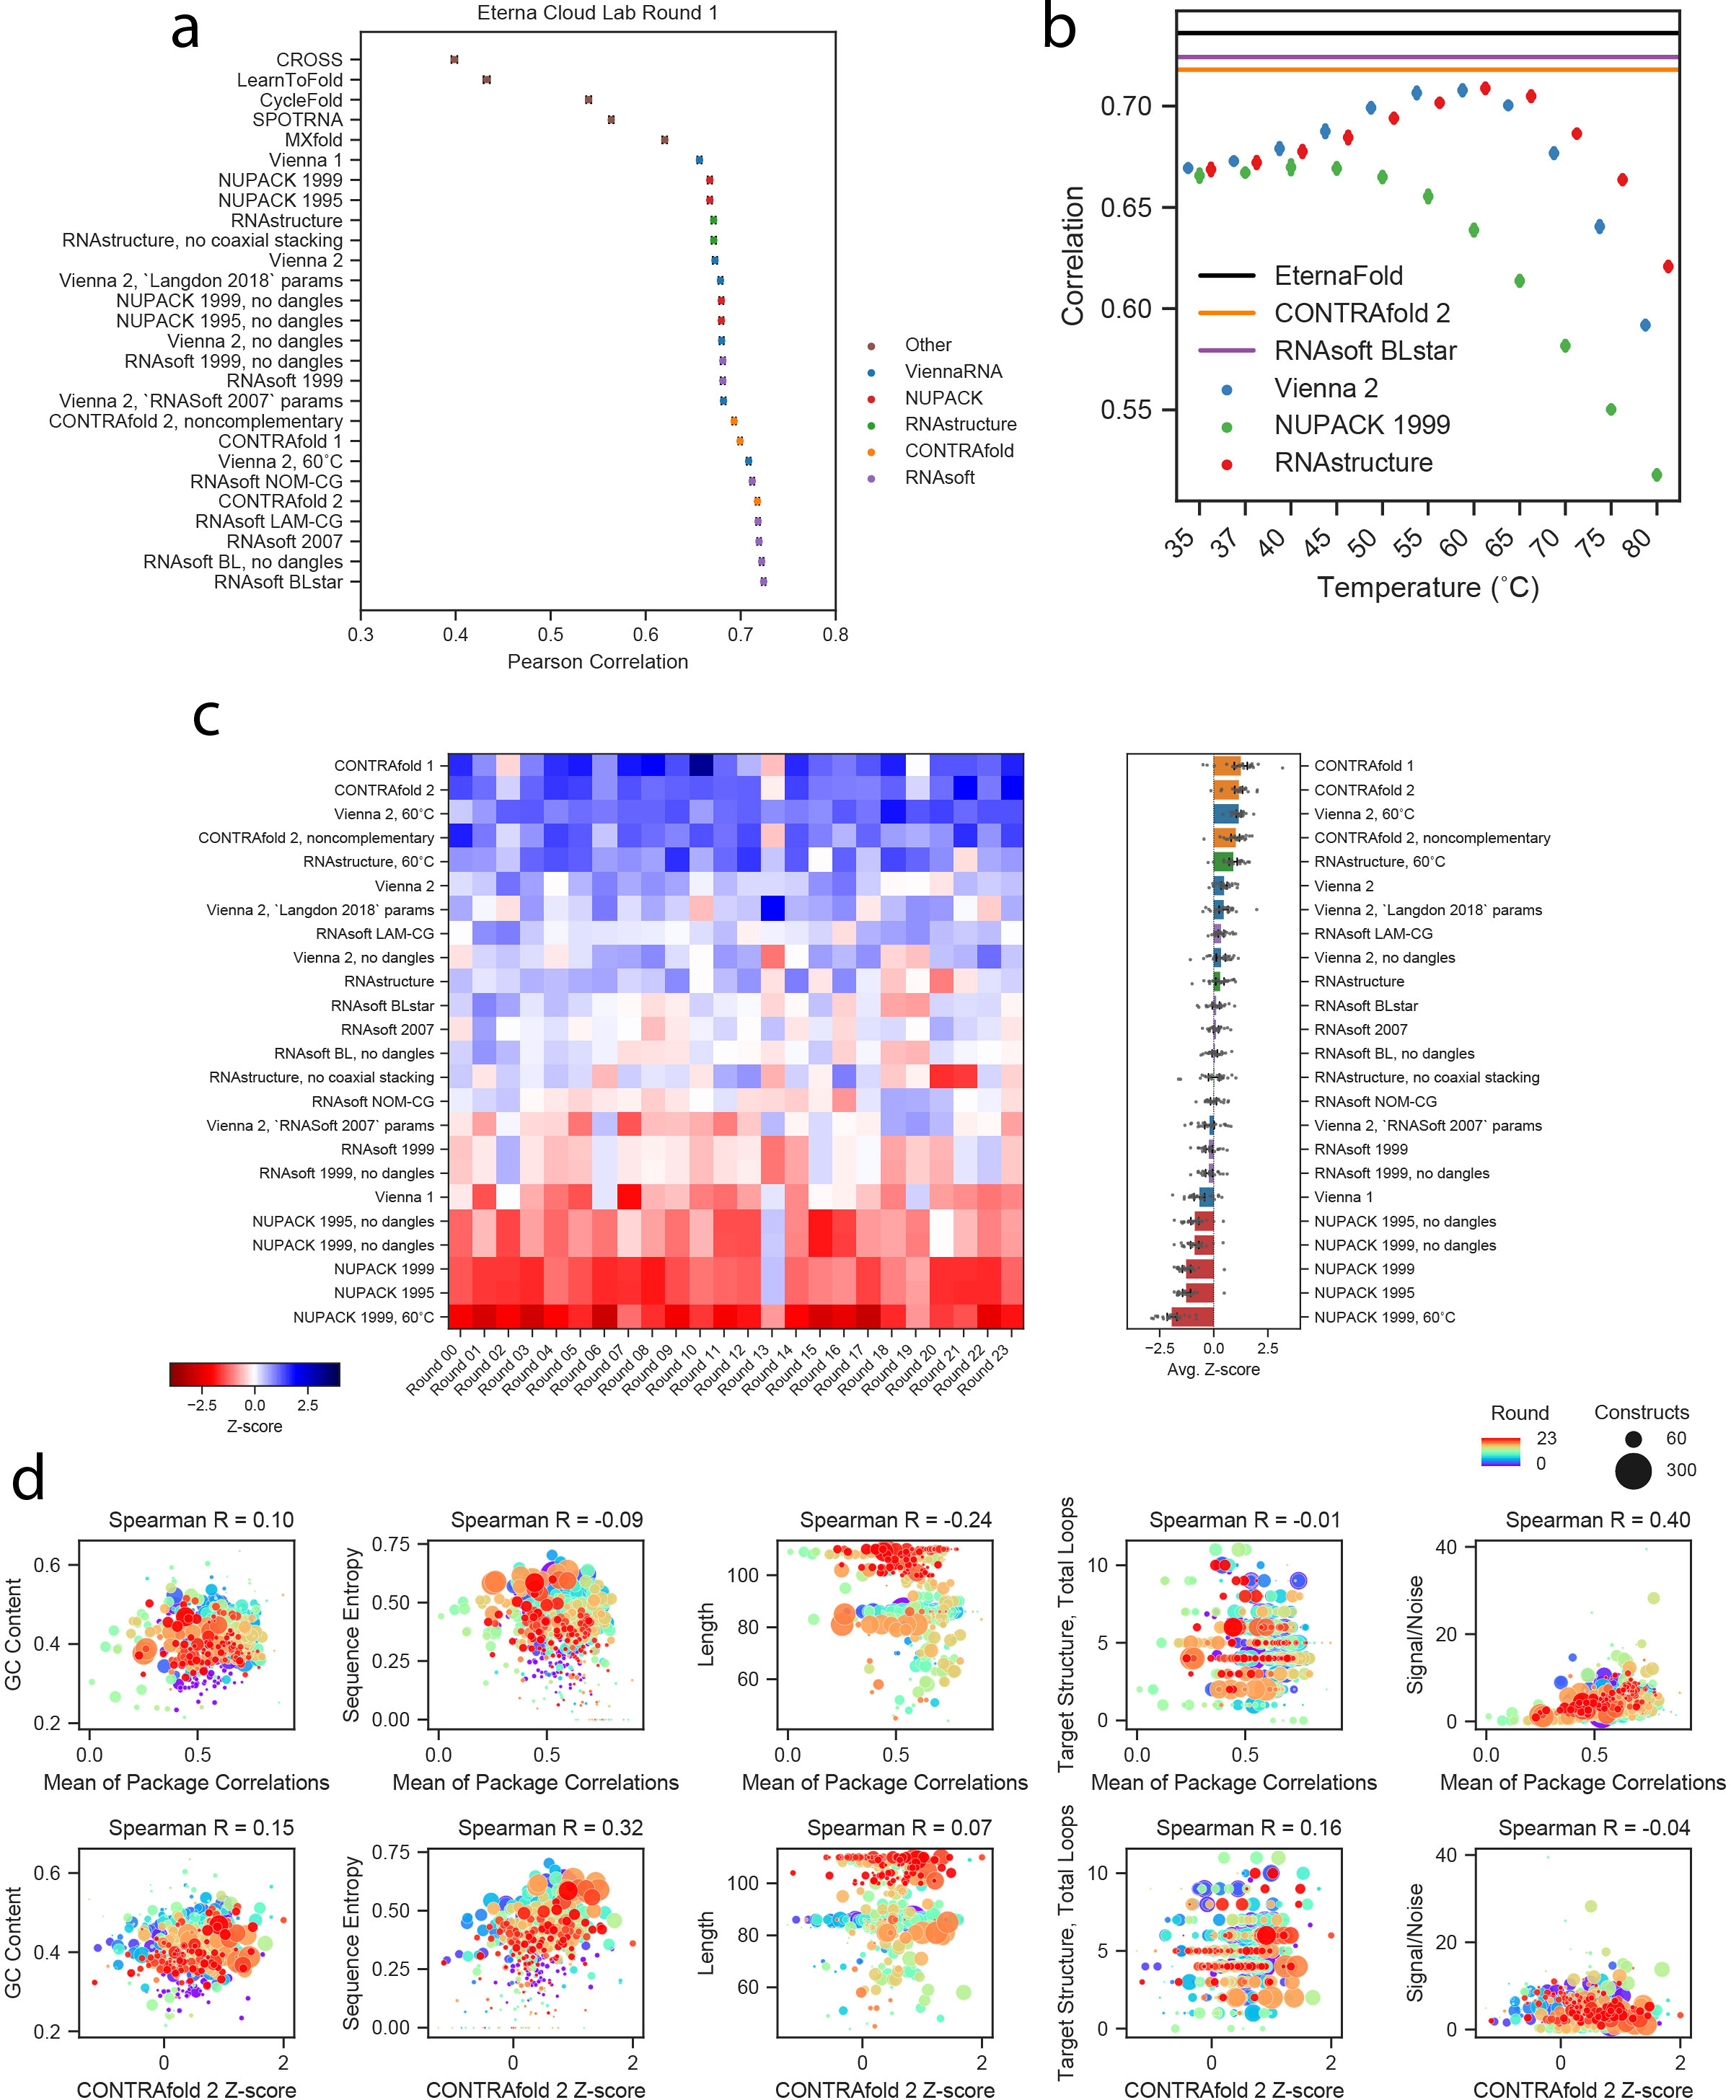
a) Pearson correlation of all package options tested on Cloud Lab Round 1, which was also a holdout test set for EternaFold training studies. Mean ± SEM of Pearson correlation calculated via bootstrapping, n=1088 independent constructs. b) ViennaRNA 2, NUPACK 1999, and RNAstructure show maximum Pearson correlation to chemical mapping data at 60°C, 40°C, and 60°C respectively for Eterna Cloud Lab Round 1. Mean ± SEM of Pearson correlation calculated via bootstrapping, n=1088 independent constructs. c) Ranking across Cloud lab dataset rounds using Spearman rank correlation (compare to Figure 1E,F). Error bars represent 95% confidence interval of the mean obtained over 1000 iterations of bootstrapping over 24 independent experiments, n=12,711 independent constructs total. d) (Top) Mean Pearson correlations, calculated over each project (as opposed to each dataset), compared to sequence metrics of the Cloud Lab projects. The strongest correlation to mean correlation was Signal/Noise ratio. (Bottom) Z-score of CONTRAfold-2, calculated over each project, compared to sequence metrics of the Cloud Lab projects.
Extended Data Fig. 2. Example chemical mapping predictions from all package options tested.
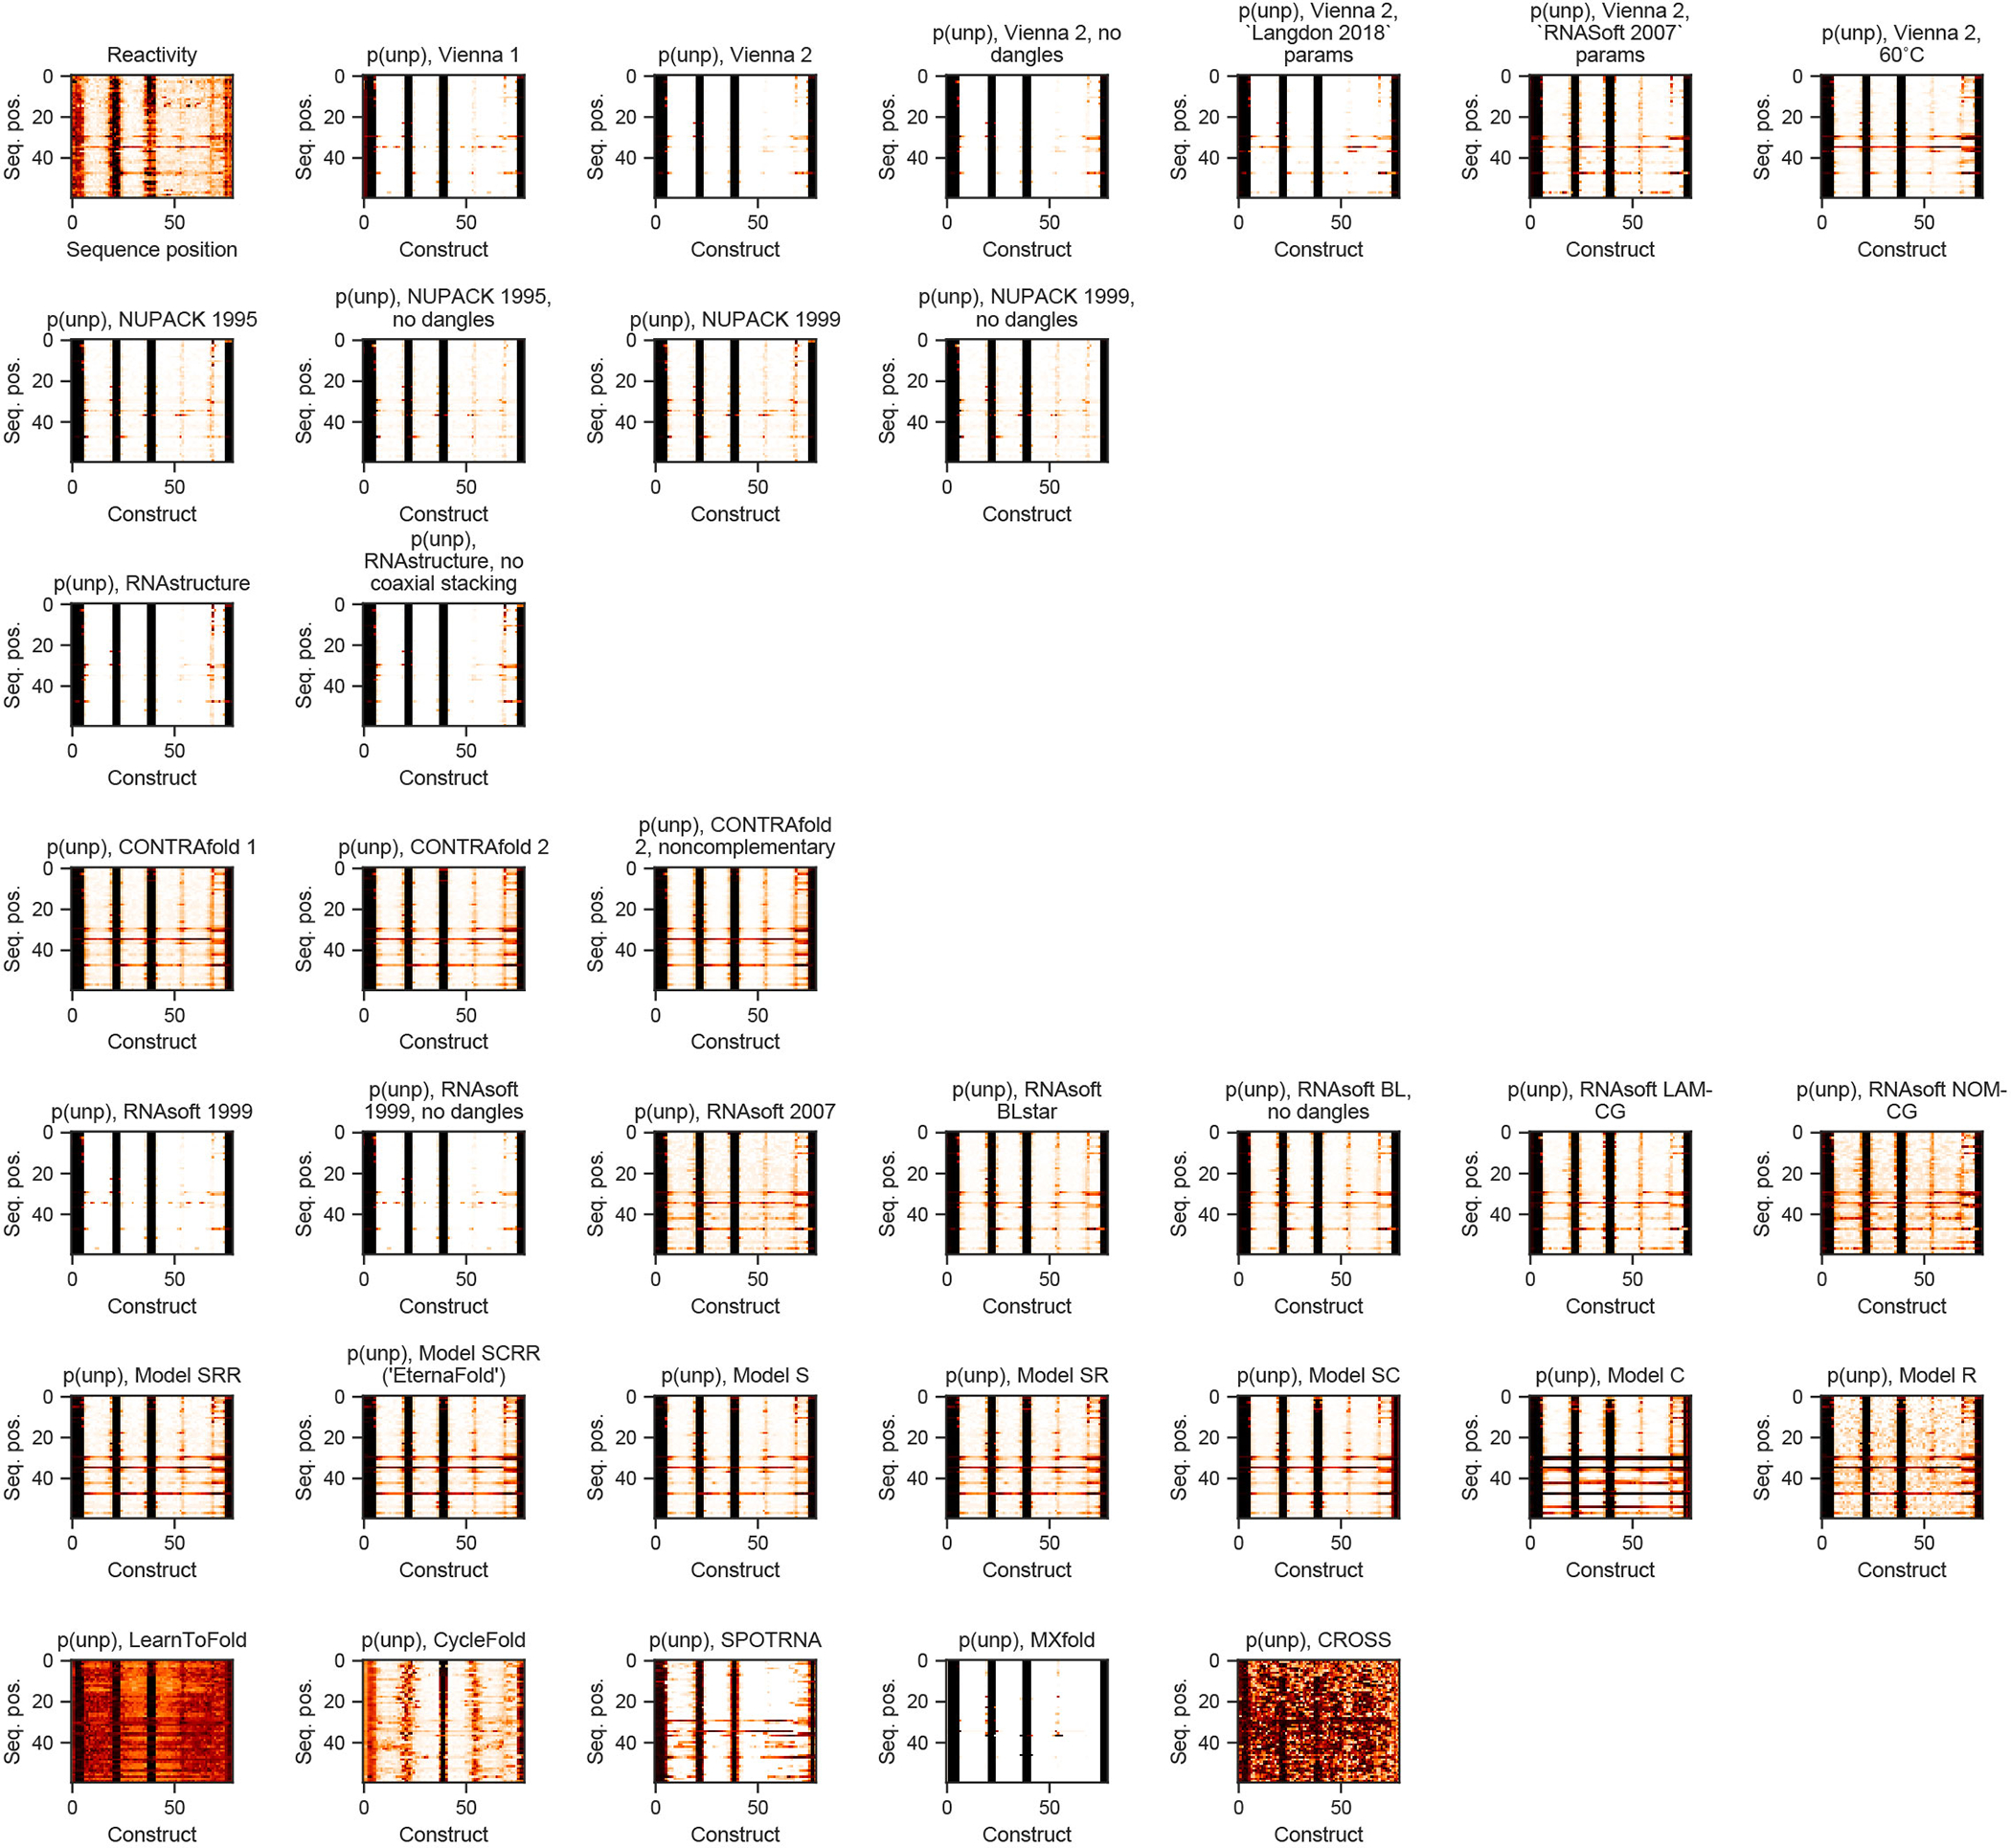
Example heatmaps of all package options tested for the “Aires” project (compare to Figure 1c).
Extended Data Fig. 3. Summary statistics for EternaBench datasets before and after performing CD-HIT filtering.
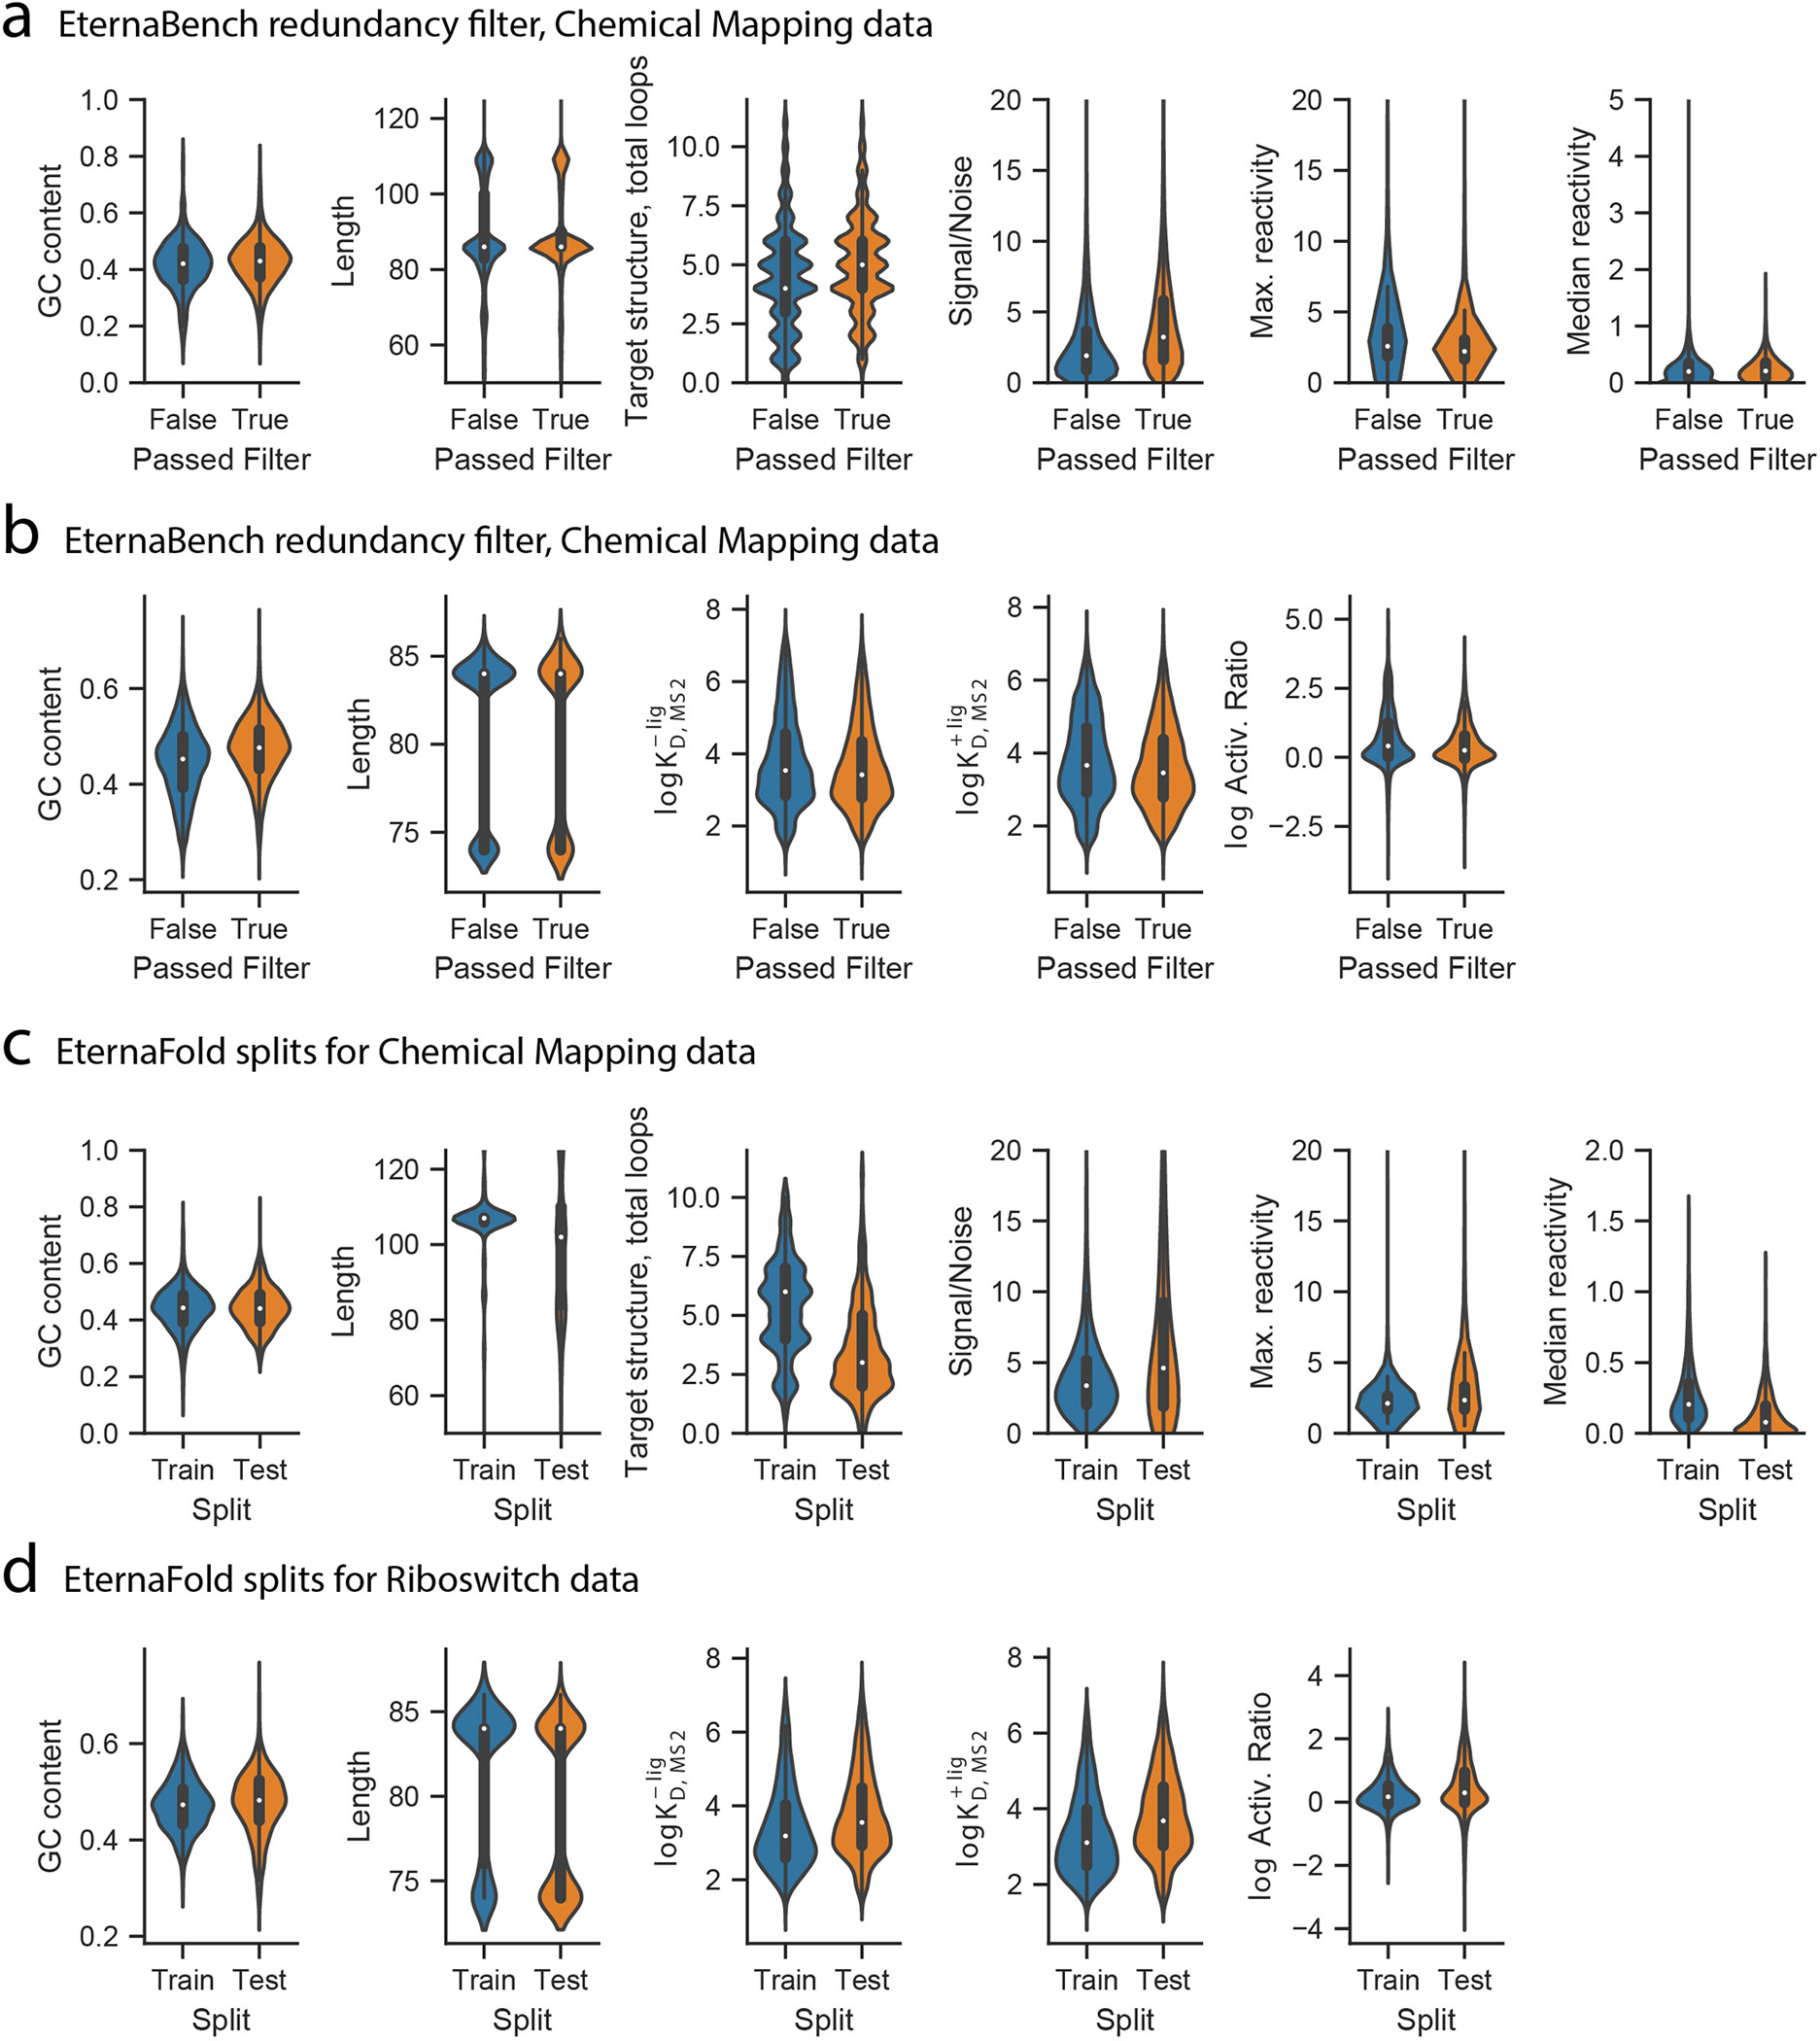
a) Distributions of sequence properties for chemical mapping data (n=38,846 before filtering and n=12,711 independent constructs after filtering, collected across 24 experiments), and B) riboswitch constructs (n=19,016 independent constructs and n=7,228 independent constructs after filtering, collected in 12 experiments). Dataset statistics of EternaBench train and test experimental rounds for (c) Chemical Mapping (Train set: n=3,476 independent constructs collected over 6 experiments. Test set: n=1,492 independent constructs collected over 18 experiments) and (d) Riboswitch data (Train set: n=2,508 independent constructs collected over 3 experiments. Test set: n=4,018 independent constructs collected over 9 experiments). Center dot, median; box limits, upper and lower quartiles; whiskers, 1.5x interquartile range. For all subplots: center dot, median; box limits, upper and lower quartiles; whiskers, 1.5x interquartile range.
Extended Data Fig. 4. Overview of all Cloud Labs data.
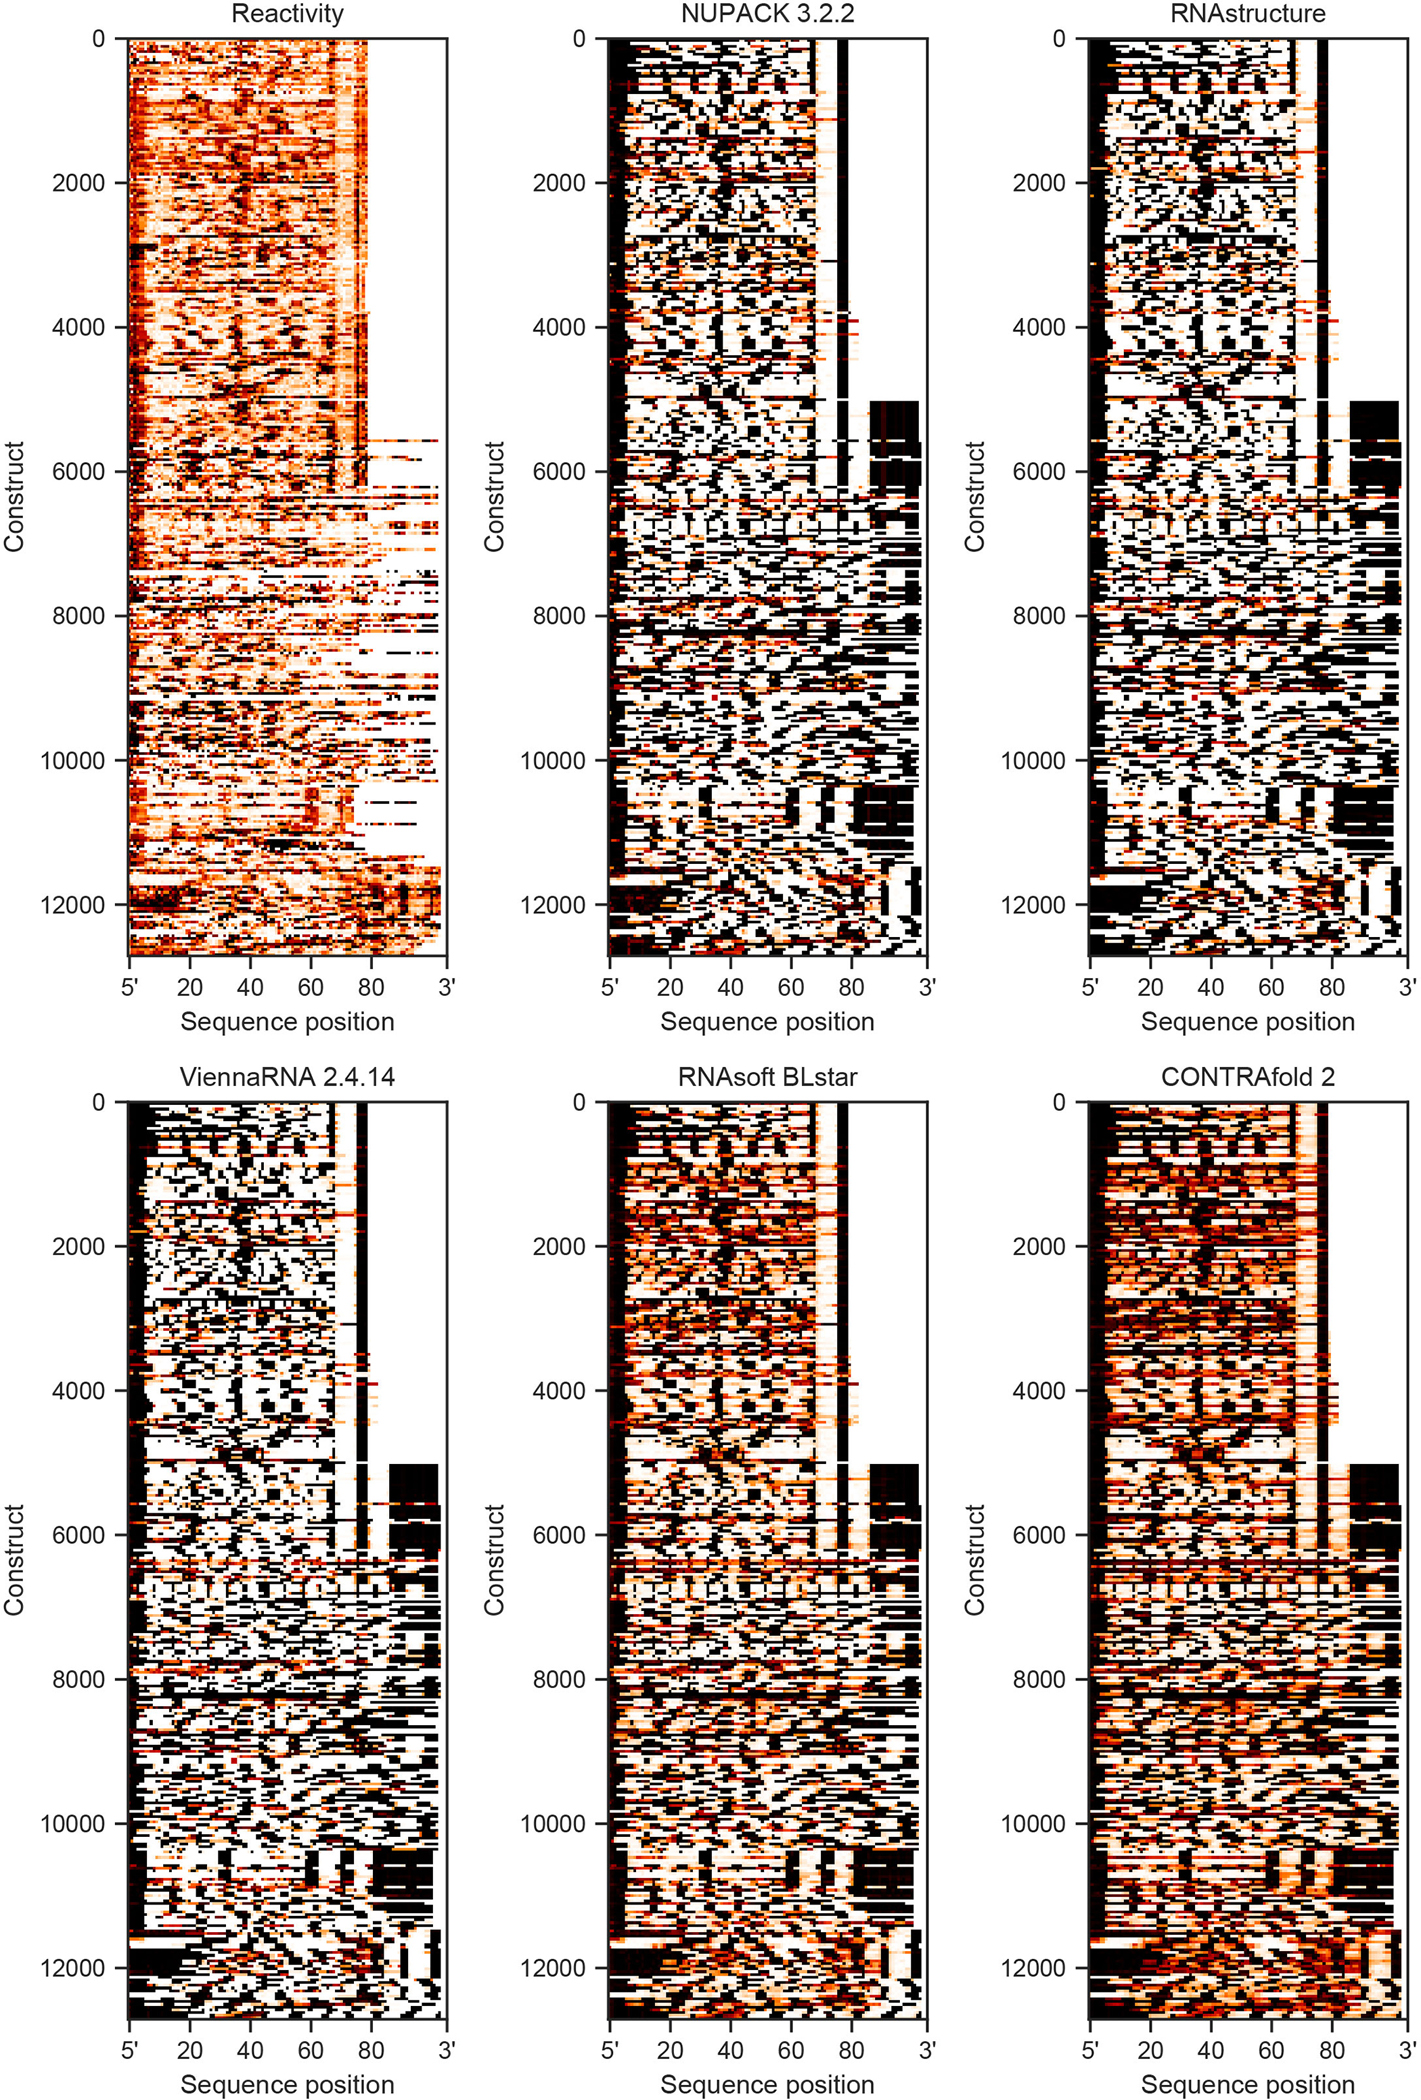
Example reactivity and p(unpaired) heatmaps from example packages for all 24 Cloud Lab rounds.
Extended Data Fig. 5. Extended analysis of package rankings based on riboswitch activity predictions.
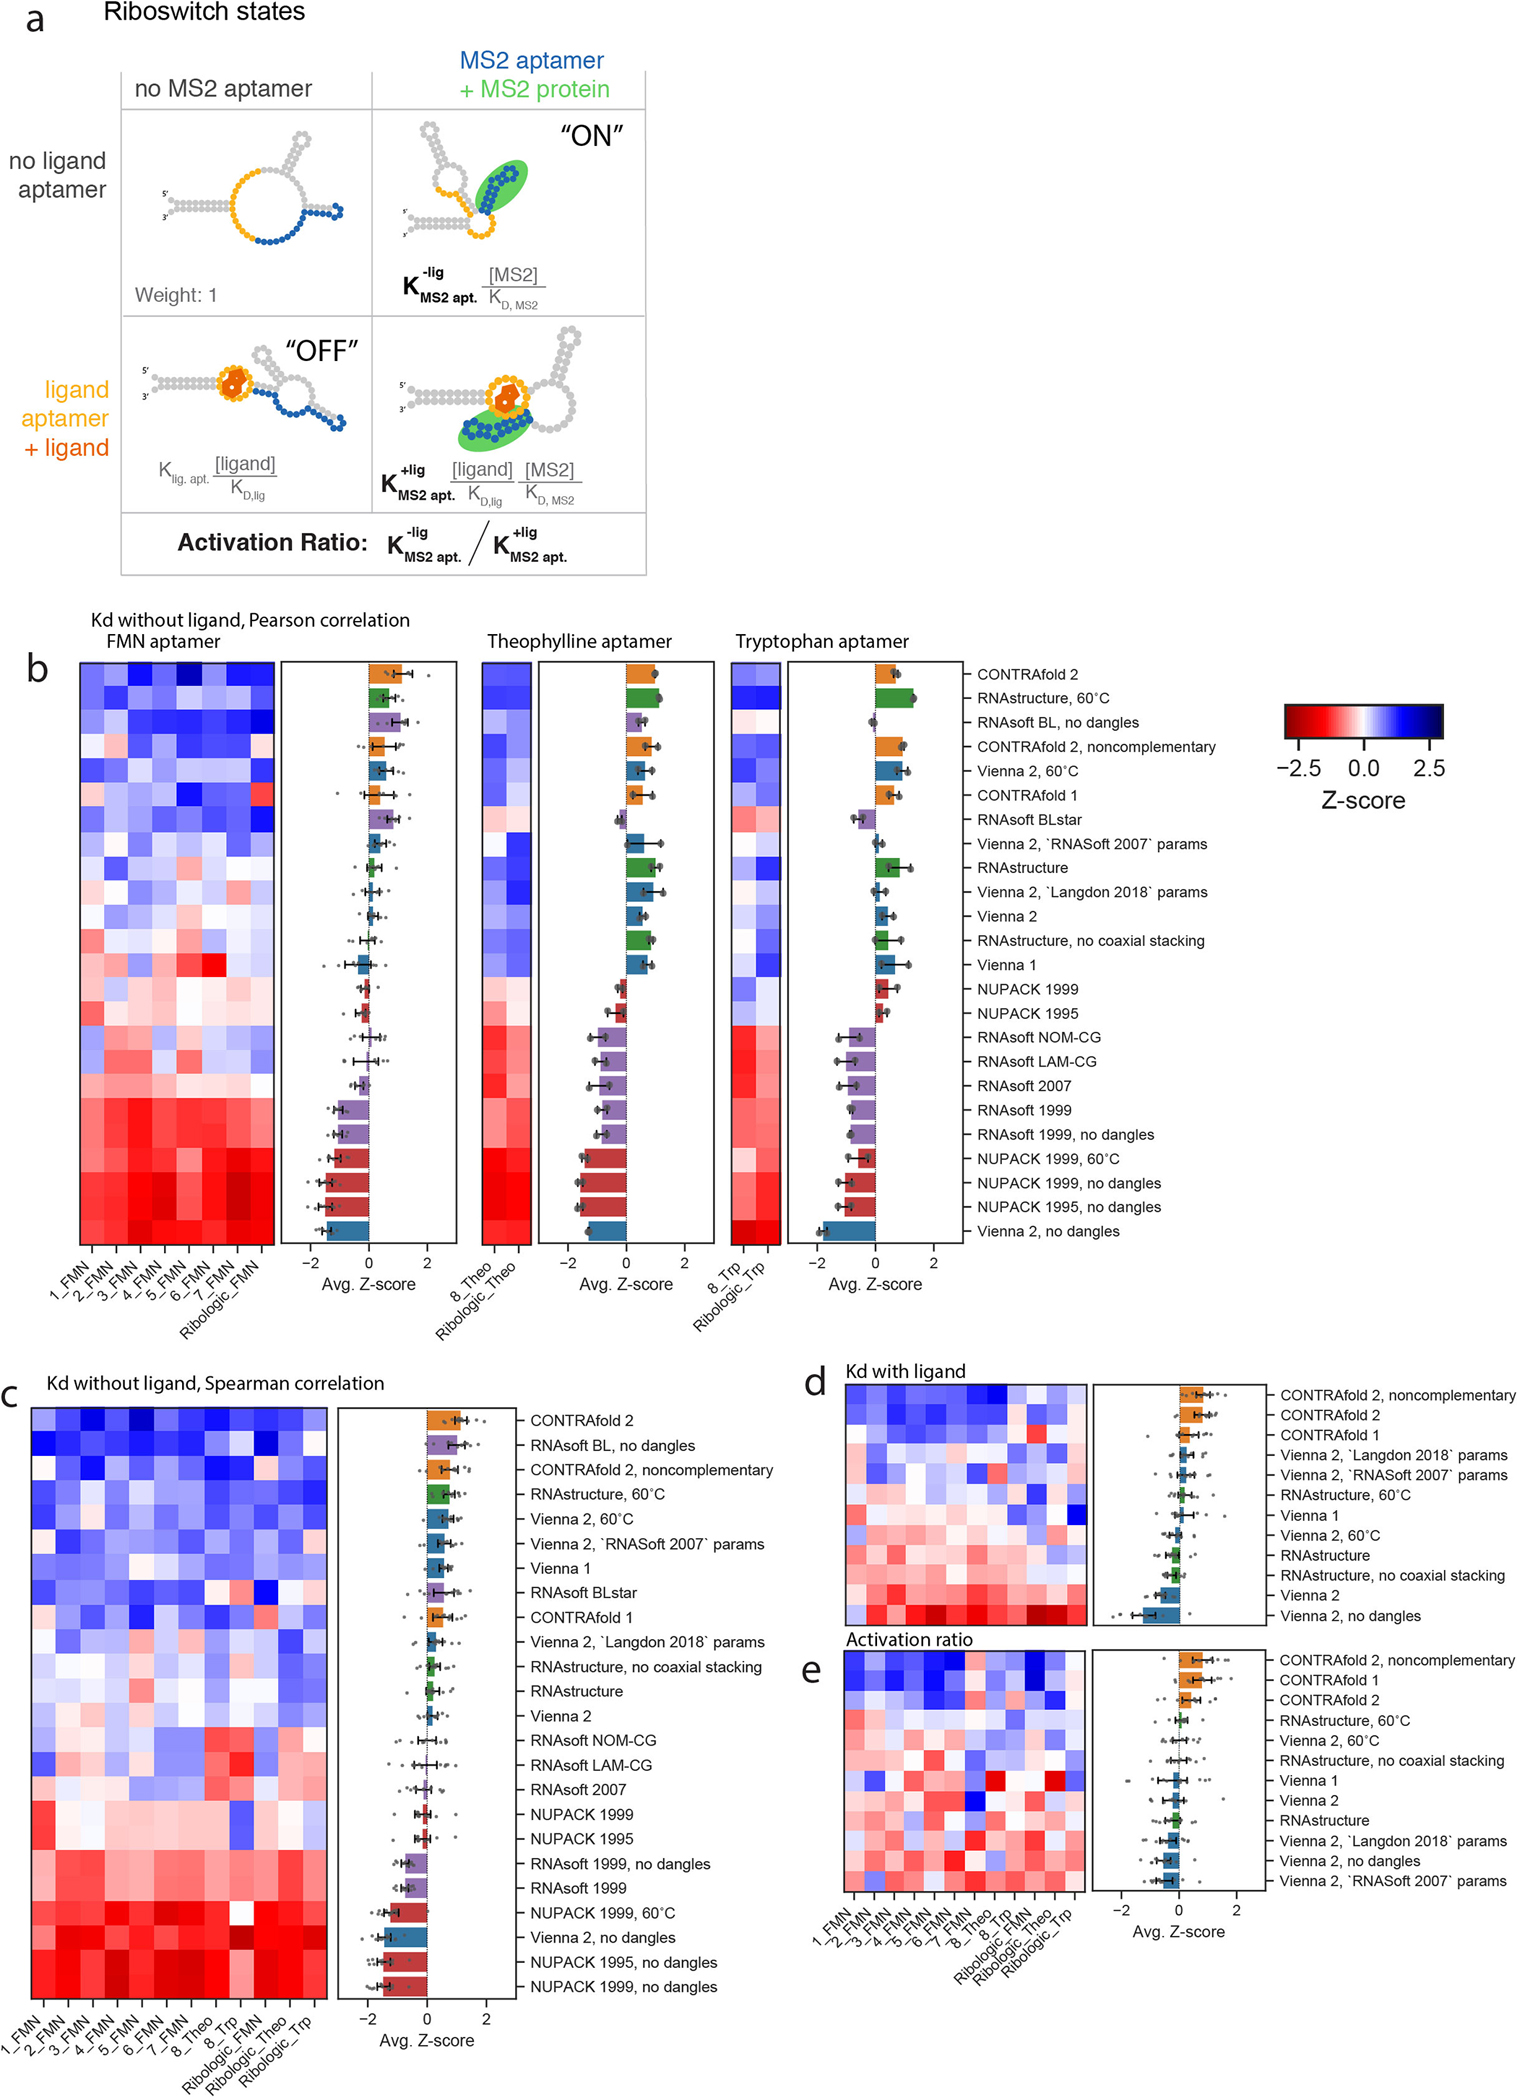
a) Example set of states for a riboswitch that toggles binding of the fluorescent MS2 protein as an output, controlled by binding the small molecule FMN. The equilibrium constant for forming the MS2 aptamer in the absence of ligand, , is estimated using the probability of forming the closing base pair for all packages. b) Riboswitch Z-scores stratified by input ligand type. Error bars represent standard error on Z-score as calculated by bootstrapping from 6402, 440, and 386 constructs collected over 8, 2, and 2 experiments, respectively. c) Overall ranking calculations using the calculated Spearman correlation (no linear assumption, compare to Figure 2B.) Evaulating the Pearson Correlation of package calculations for (d) as well as (e) riboswitch Activation Ratio results in a similar ranking. In C, D, E, error bars represent 95% confidence interval of the mean obtained over 1000 iterations of bootstrapping across datasets, n=7,228 independent constructs collected over 12 experiments.
Extended Data Fig. 6. Example riboswitch predictions from all package options tested.
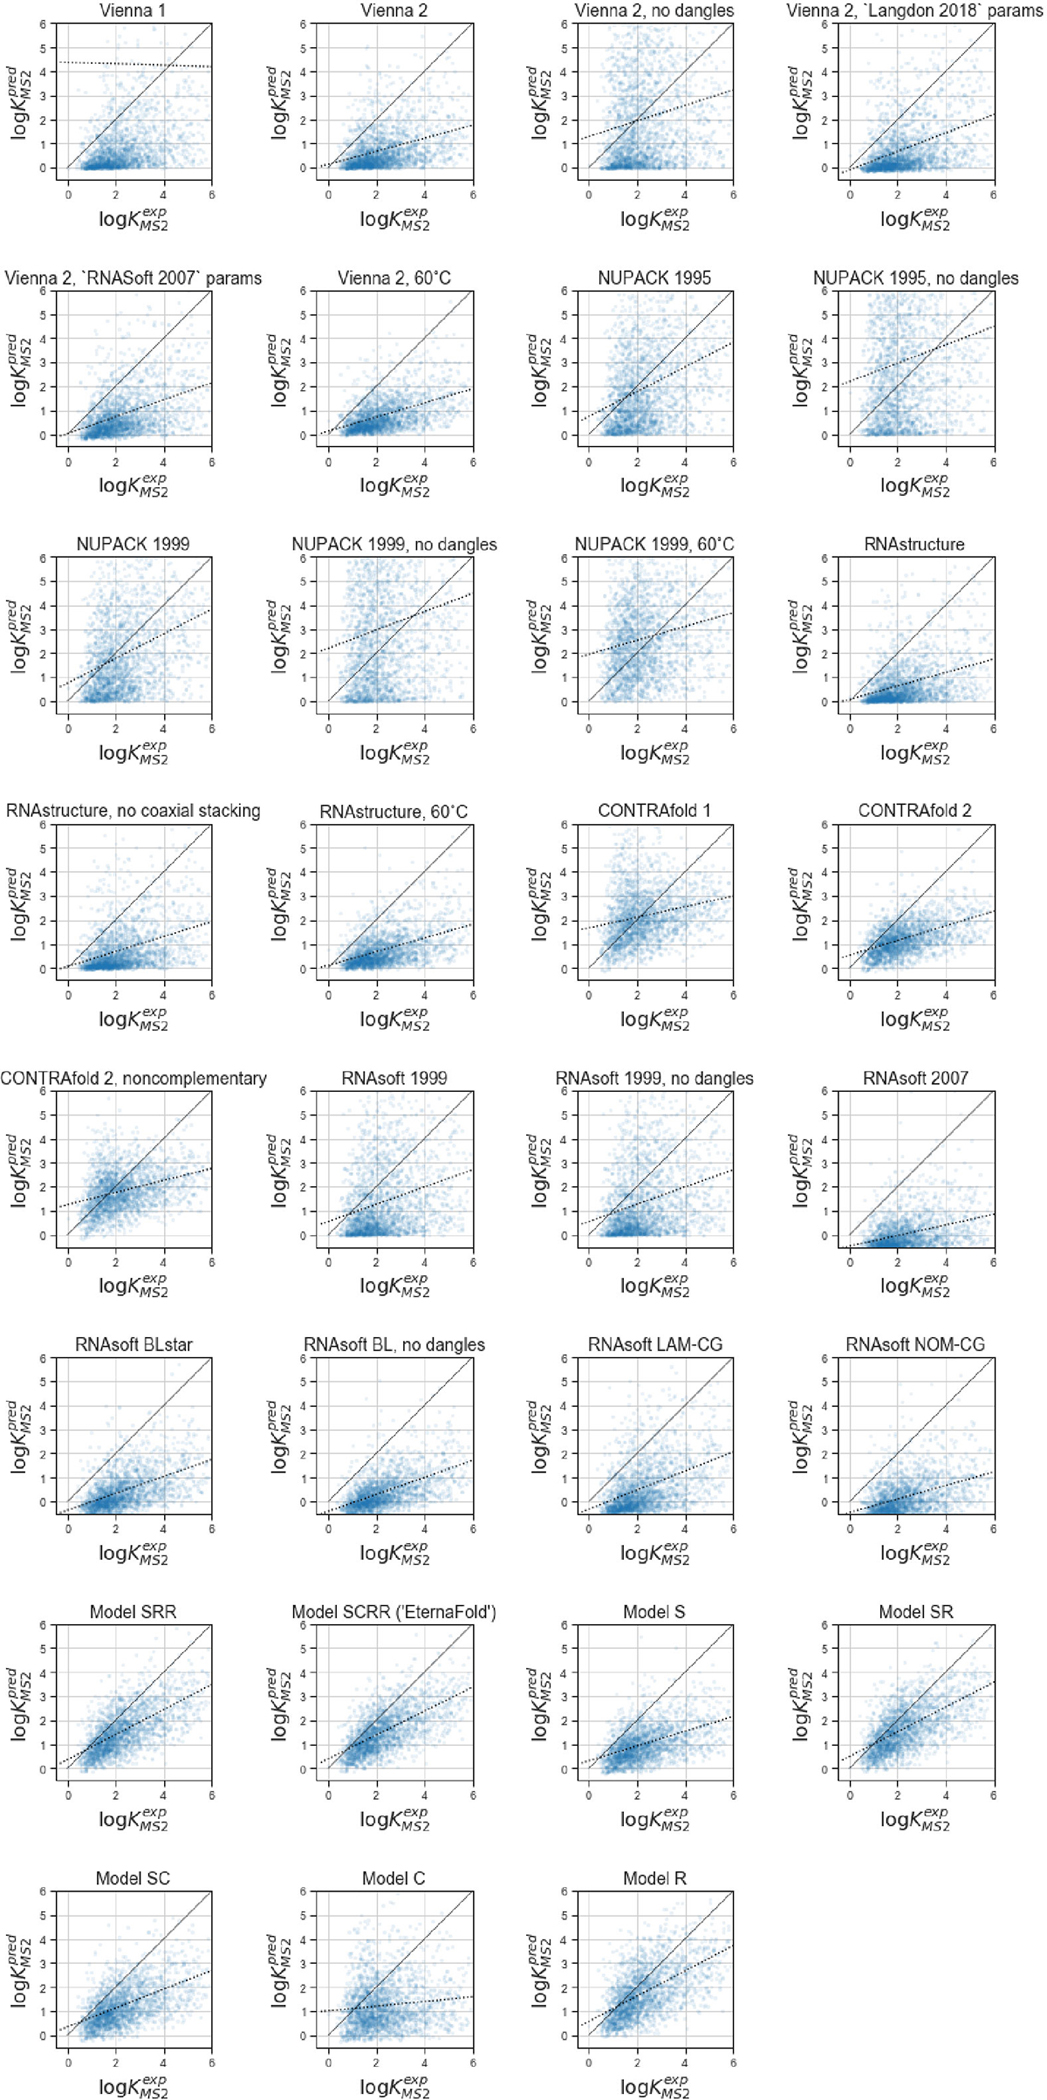
Scatterplots for all options tested for Ribologic dataset. Black solid line indicates line of best fit.
Extended Data Fig. 7. Example riboswitch predictions across all datasets.
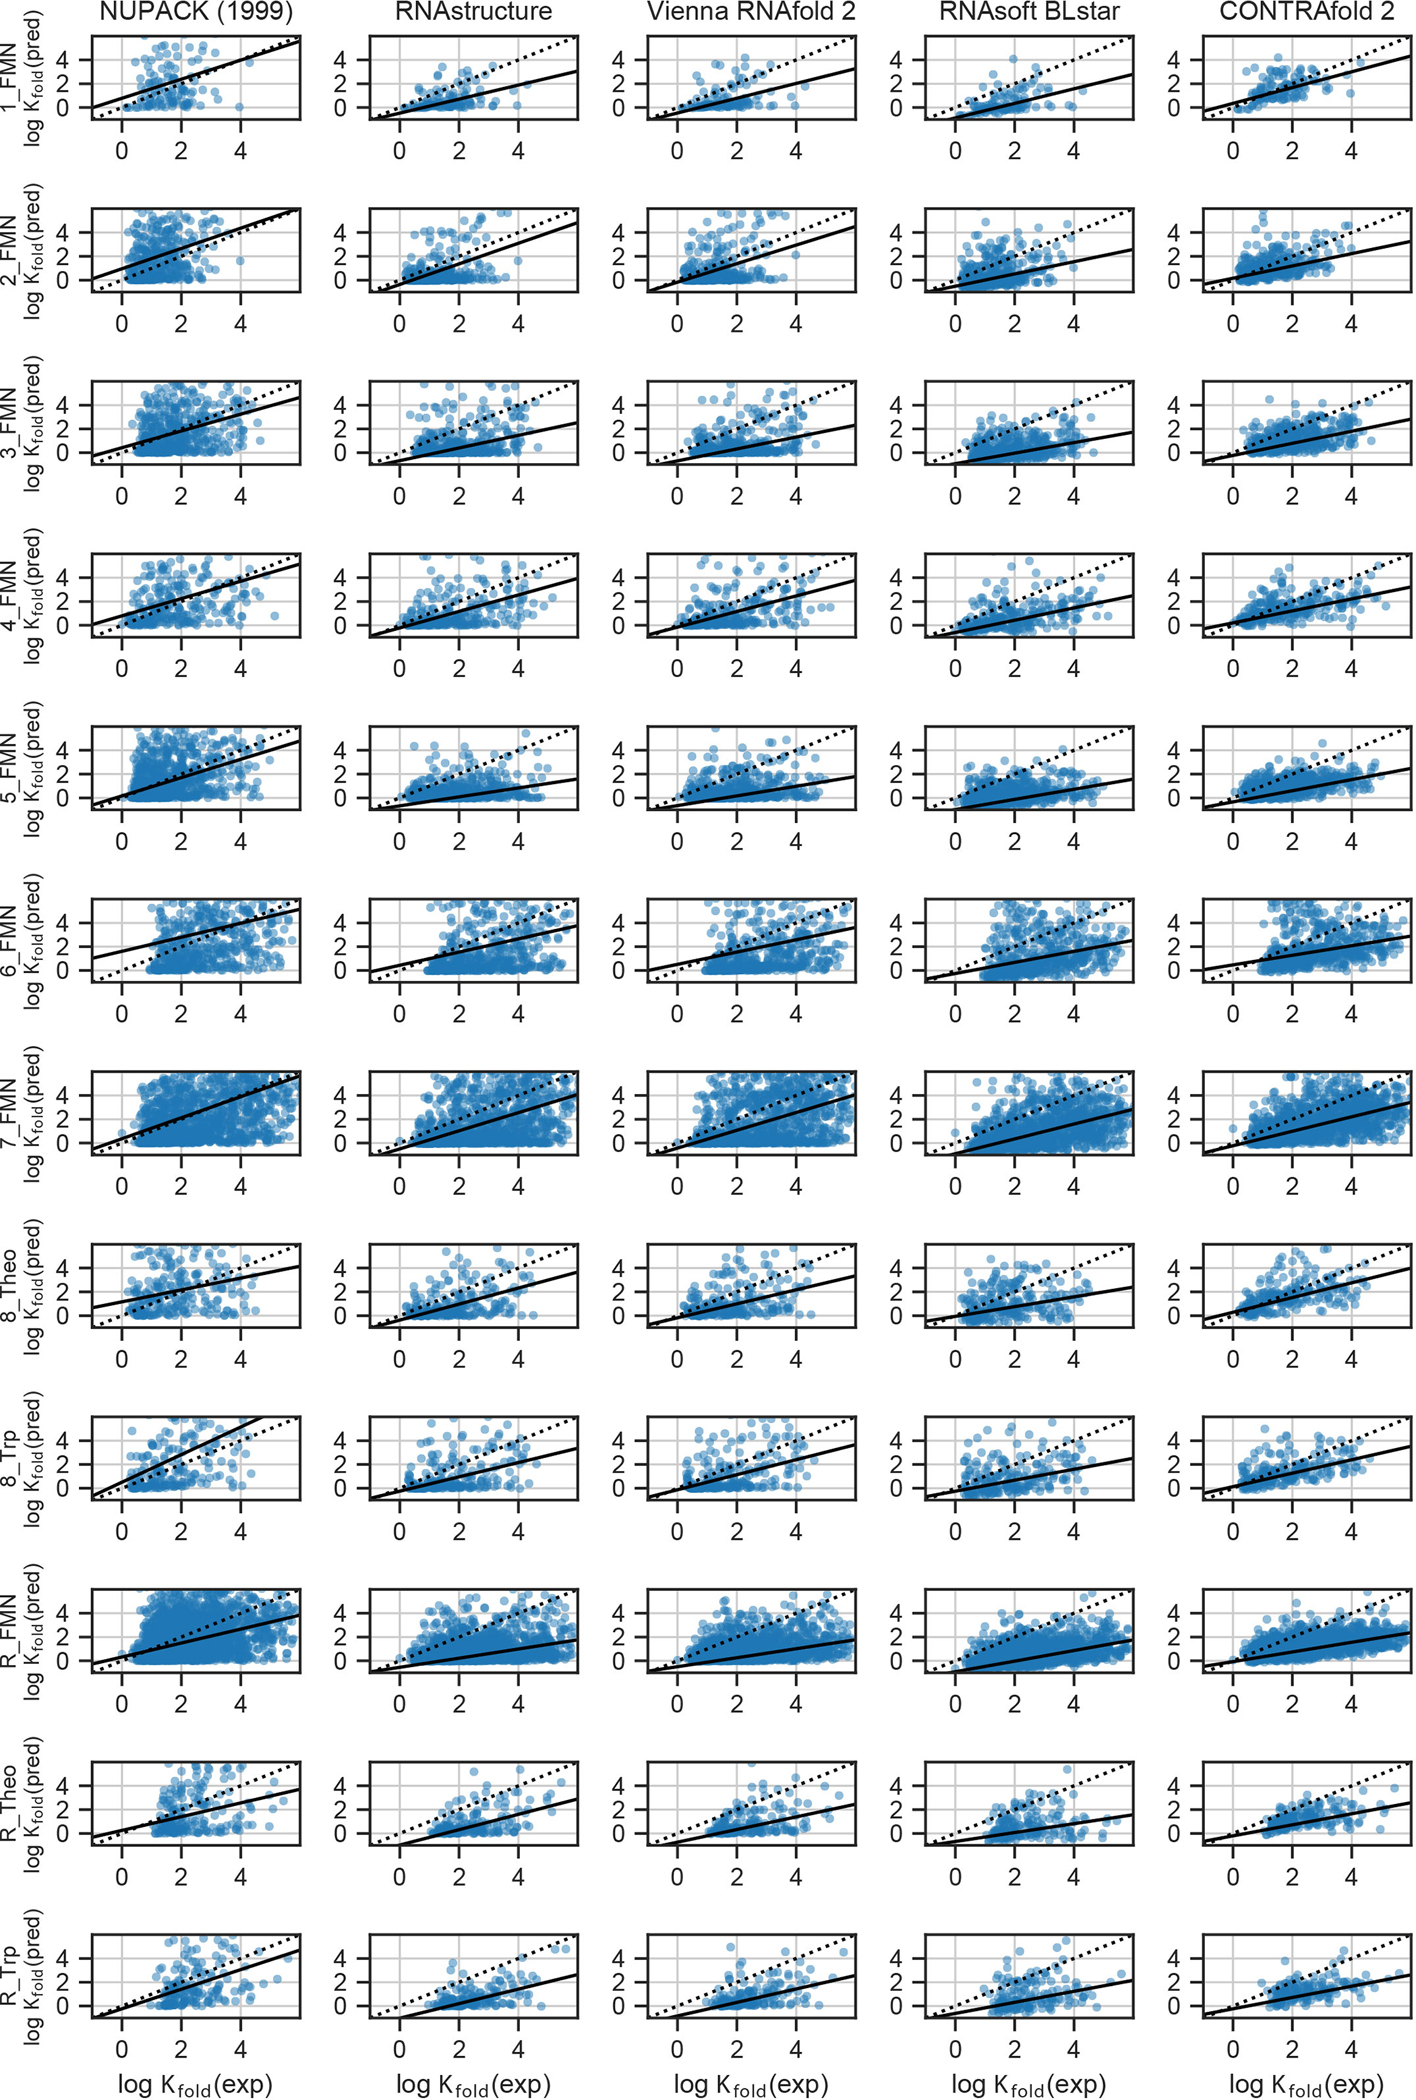
Scatterplots for representative packages on all riboswitch datasets. Black solid line indicates line of best fit.
Extended Data Fig. 8. Effect of window size and Levenshtein distance filtering for independent chemical mapping test set.
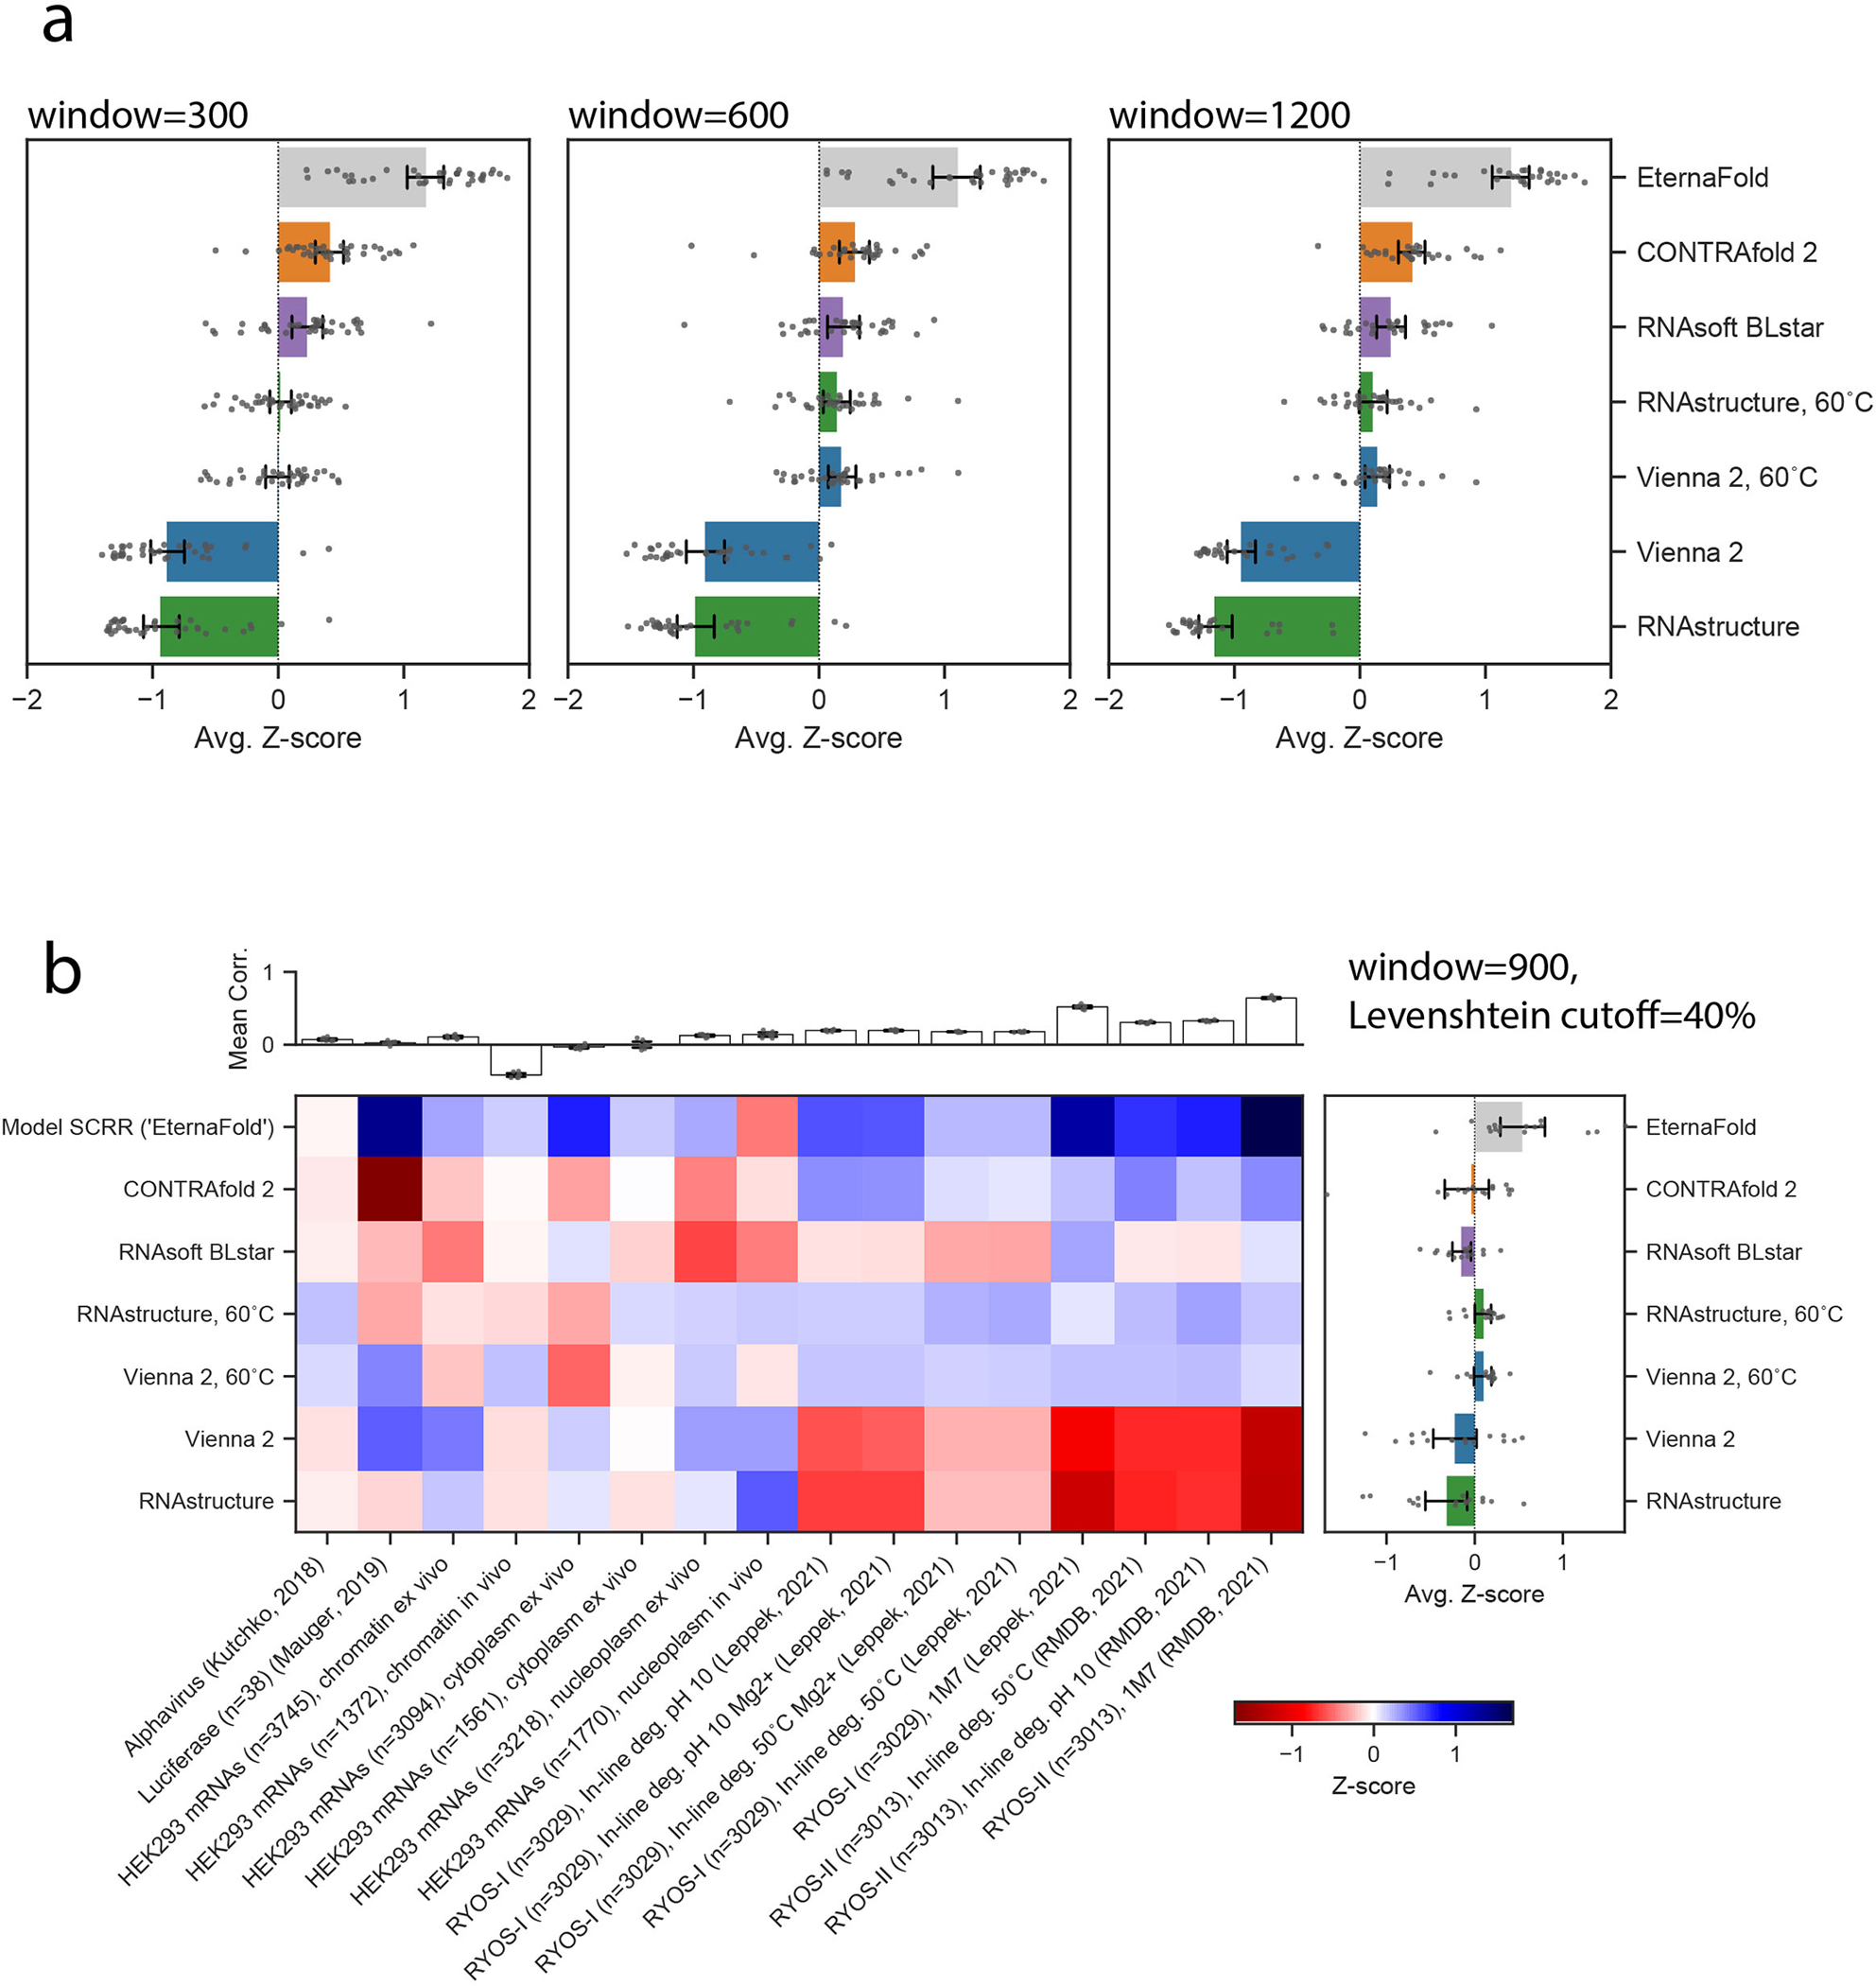
a) Calculating p(unpaired) using varying sliding windows of size 300, 600, and 1200 does not change the overall ranking obtained across datasets, compare to Fig. 4B, which was calculated for window size 900 (n=31 datasets for all). Package ranking is also consistent for a redundancy cutoff of 40% b) (n=16 datasets included after filtering based on 40% cutoff by windowed Levenshtein distance). Error bars in A and B represent 95% confidence interval for the mean Z-score as calculated by bootstrapping across respective number of datasets for each.
Extended Data Fig. 9. Extended data corresponding to EternaFold development and test set evaluation.
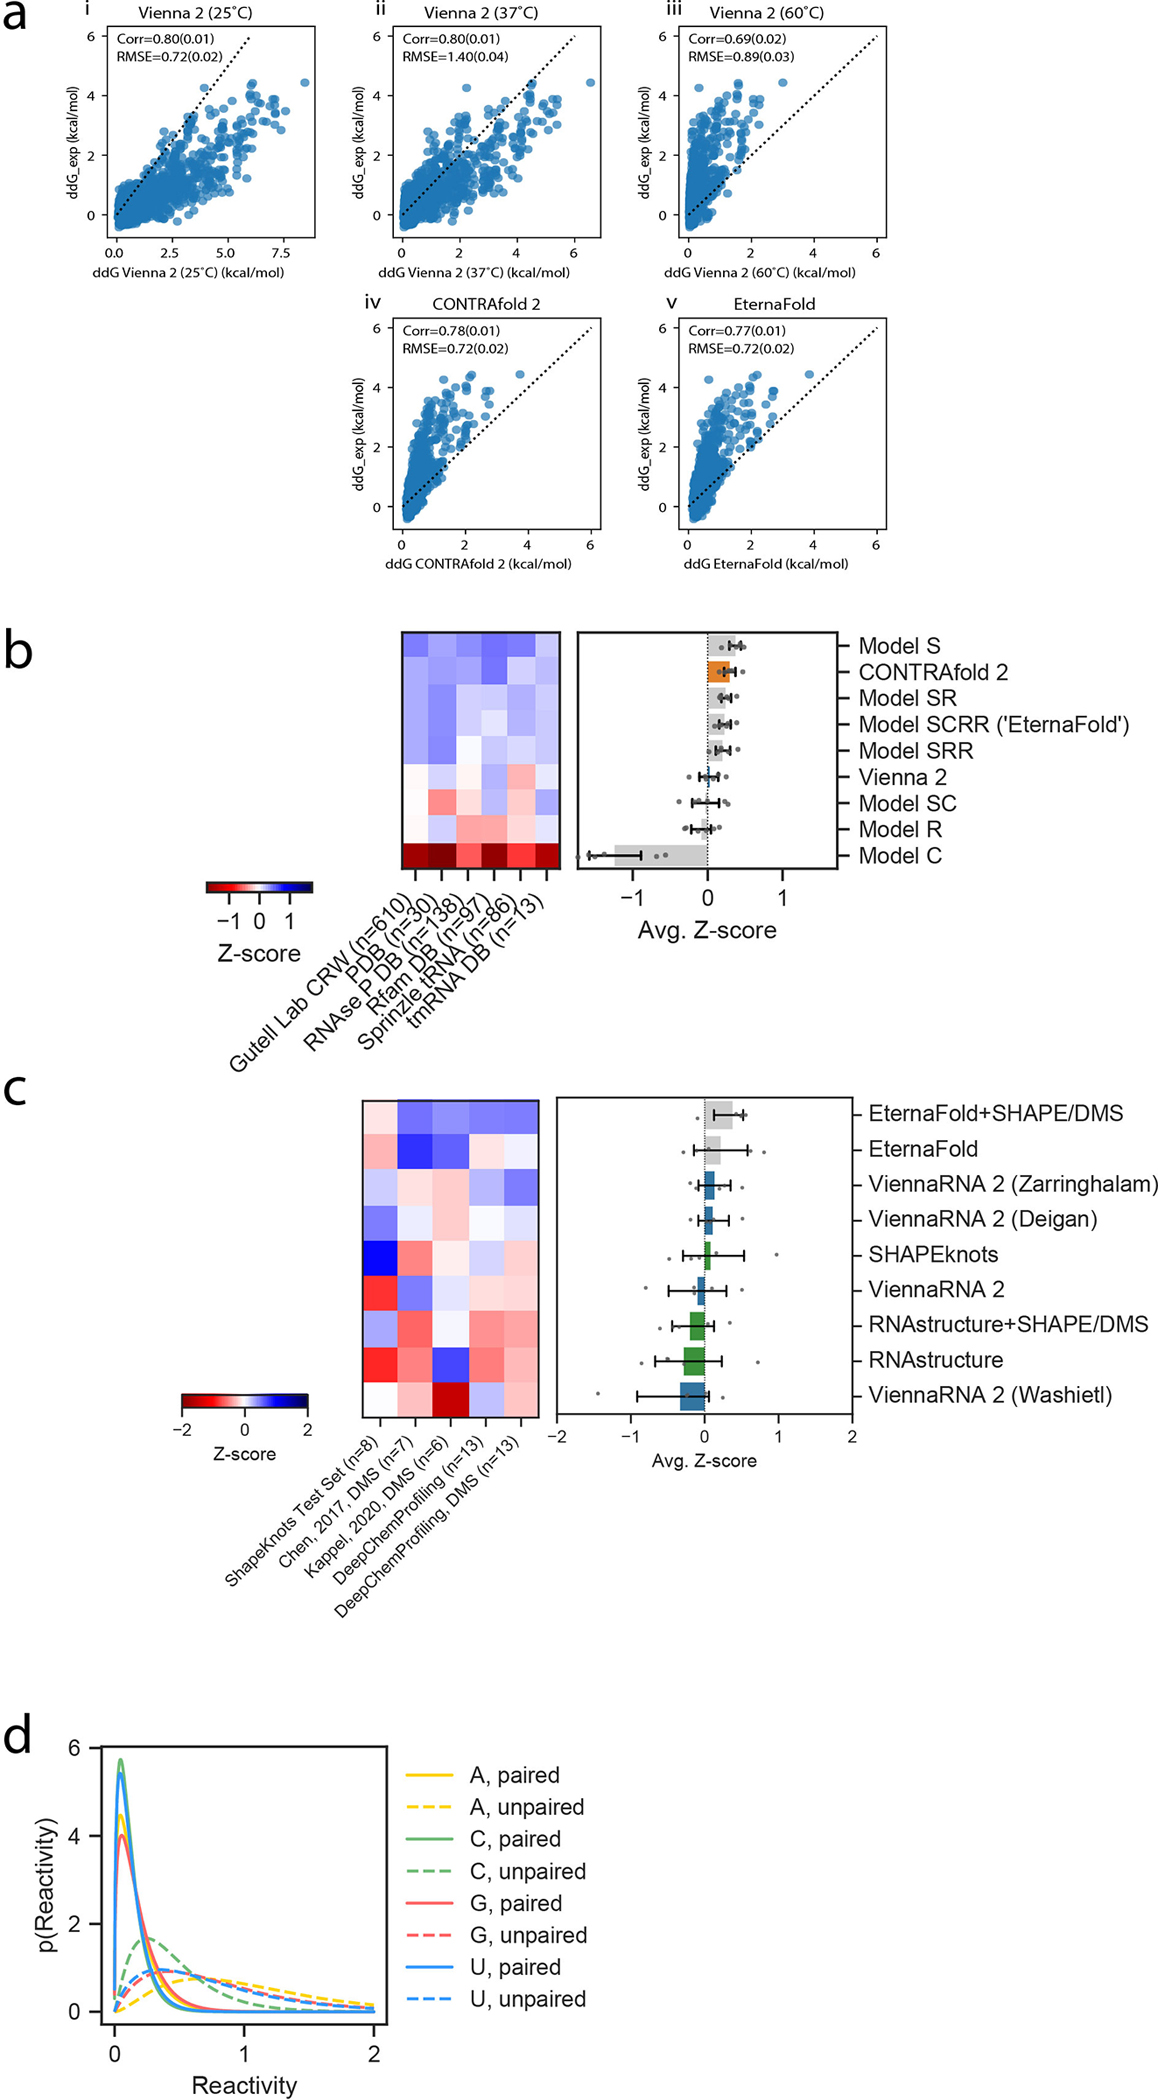
a) Comparing Vienna, CONTRAfold, and EternaFold predictions in predicting free energy of PUM binding. i) Replication of ddG_exp for both PUM WT and mutant binding from (Becker, 2019). The same calculation in Vienna 2 at 37°C shows lower Root-mean-squared error (RMSE) (ii), but higher RMSE at 60°C (iii). CONTRAfold 2 shows no improvement over Vienna at 37°C (iv), but EternaFold shows modest improvement over both (v). b) Package performance for the S-Processed test set is qualitatively similar to results on the ArchiveII-NR test set (cf. Fig. 3b). Error bars represent 95% confidence interval of the mean calculated with 1000 iterations of bootstrapping over n=6 independent datasets, which contain 974 independent constructs total. C) Evaluating SHAPE- and DMS- directed folding. Error bars represent 95% confidence interval of the mean calculated with 1000 iterations of bootstrapping over n=5 independent datasets of RNAs with known secondary structures,, which contain 47 constructs total. d) Potentials learned from EternaFold training and used in SHAPE-directed structure prediction.
Extended Data Fig. 10. Extended data corresponding to predicting riboswitch affinity in the presence of small molecule ligands.
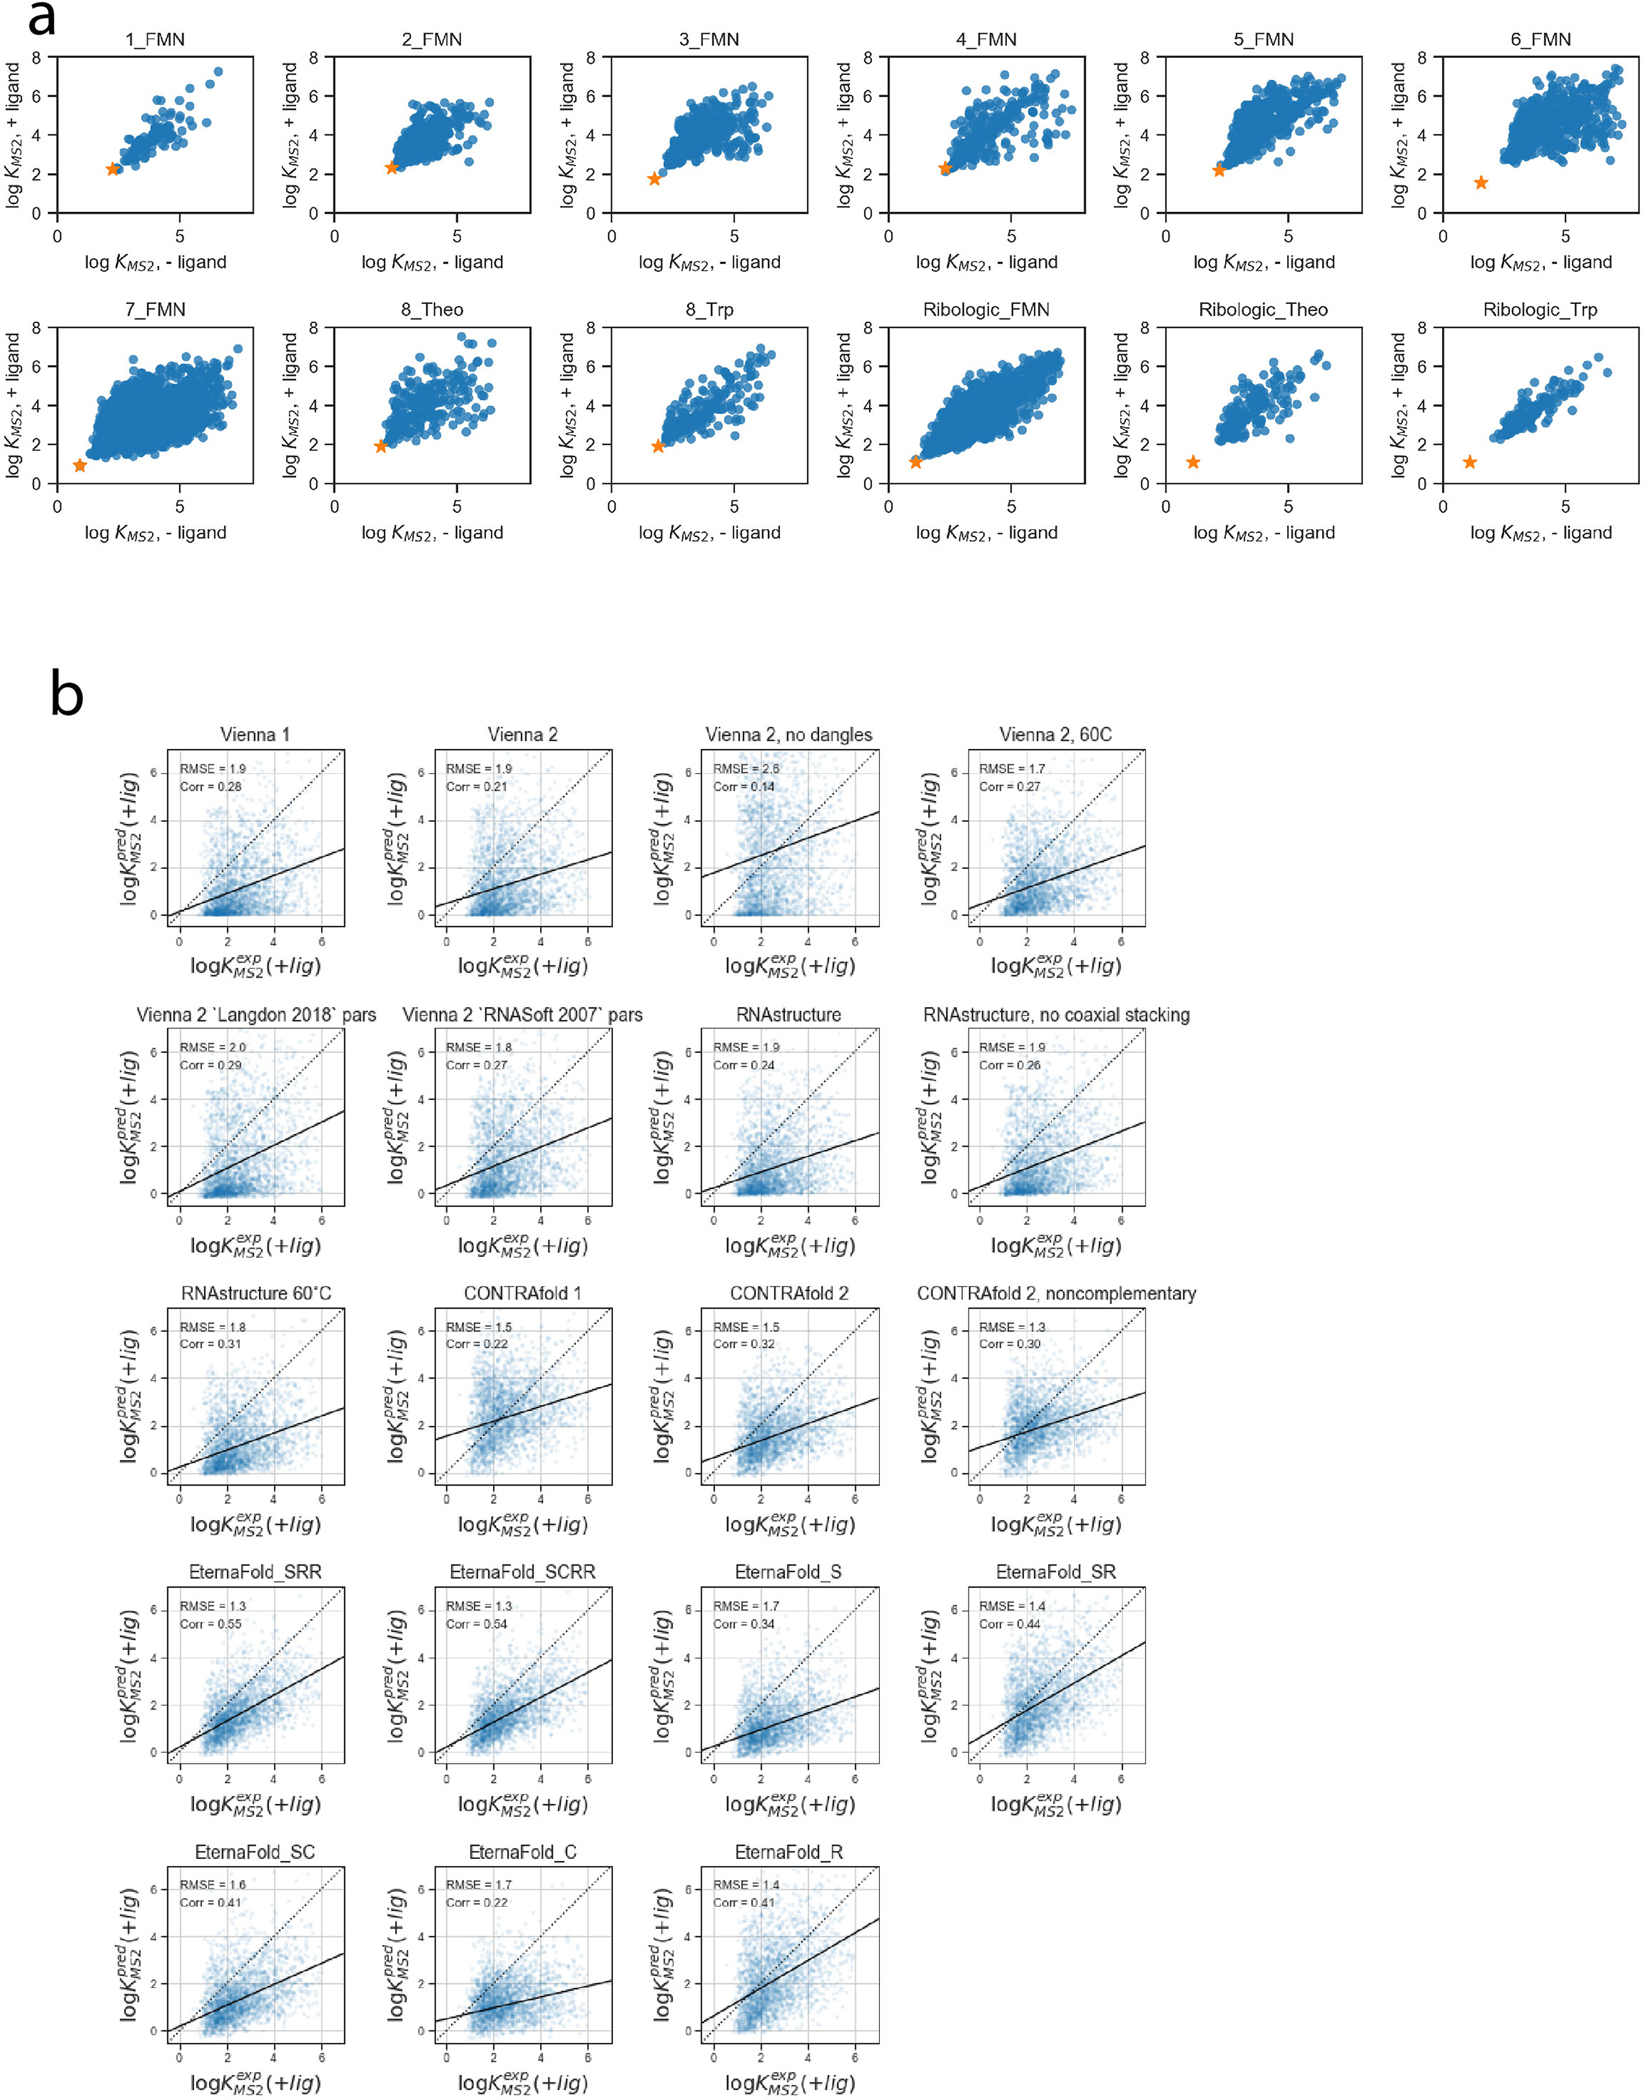
a) and values of riboswitches included in filtered datasets. Black starred datapoint indicates reference value used for . b) Estimates for the RiboLogic FMN dataset for in all package options able to make estimates with constrained partition functions.
Supplementary Material
Acknowledgements
We thank members of the Das and Barna labs (Stanford University), C. Pop, and C.-S. Foo for useful discussions. We thank I. Jarmoskaite, V. V. Topkar, R. Rangan, and J. Townley for helpful comments on the manuscript. Calculations and model training were performed on the Stanford Sherlock cluster. We acknowledge funding from the National Science Foundation (GRFP to H.K.W.S.), the National Institute of Health (R35 GM122579 to R.D.), and gifts to the Eterna OpenVaccine project from donors listed in Table S13.
Footnotes
Competing Interest. H.K.W.S. and R.D. are authors of EternaFold, which is being licensed by Stanford University for commercial use. The remaining authors declare no competing interests.
Peer review information: Primary Handling editor: Rita Strack, in collaboration with the Nature Methods team.
Peer review information: Nature Methods thanks Hashim Al-Hashimi and the other, anonymous, reviewer(s) for their contribution to the peer review of this work.
References
- 1.Amaral PP, Dinger ME, Mercer TR & Mattick JS The eukaryotic genome as an RNA machine. Science 319, 1787–1789 (2008). [DOI] [PubMed] [Google Scholar]
- 2.Singh V, Braddick D & Dhar PK Exploring the potential of genome editing CRISPR-Cas9 technology. Gene 599, 1–18 (2017). [DOI] [PubMed] [Google Scholar]
- 3.Jaffrey SR RNA-Based Fluorescent Biosensors for Detecting Metabolites in vitro and in Living Cells. Adv Pharmacol 82, 187–203 (2018). [DOI] [PubMed] [Google Scholar]
- 4.Kramps T & Elbers K in Methods Mol Biol, Vol. 1499, Edn. 2016/12/18 1–11 (2017). [DOI] [PubMed] [Google Scholar]
- 5.Zuker M & Stiegler P Optimal computer folding of large RNA sequences using thermodynamics and auxiliary information. Nucleic Acids Res 9, 133–148 (1981). [DOI] [PMC free article] [PubMed] [Google Scholar]
- 6.Lorenz R et al. ViennaRNA Package 2.0. Algorithms Mol Biol 6, 26 (2011). [DOI] [PMC free article] [PubMed] [Google Scholar]
- 7.Zadeh JN et al. NUPACK: Analysis and design of nucleic acid systems. J Comput Chem 32, 170–173 (2011). [DOI] [PubMed] [Google Scholar]
- 8.Reuter JS & Mathews DH RNAstructure: software for RNA secondary structure prediction and analysis. BMC Bioinformatics 11, 129 (2010). [DOI] [PMC free article] [PubMed] [Google Scholar]
- 9.Xia T et al. Thermodynamic parameters for an expanded nearest-neighbor model for formation of RNA duplexes with Watson-Crick base pairs. Biochemistry 37, 14719–14735 (1998). [DOI] [PubMed] [Google Scholar]
- 10.Andronescu M, Condon A, Hoos HH, Mathews DH & Murphy KP Efficient parameter estimation for RNA secondary structure prediction. Bioinformatics 23, i19–28 (2007). [DOI] [PubMed] [Google Scholar]
- 11.Do CB, Woods DA & Batzoglou S CONTRAfold: RNA secondary structure prediction without physics-based models. Bioinformatics 22, e90–98 (2006). [DOI] [PubMed] [Google Scholar]
- 12.Sloma MF & Mathews DH Base pair probability estimates improve the prediction accuracy of RNA non-canonical base pairs. PLoS Comput Biol 13, e1005827 (2017). [DOI] [PMC free article] [PubMed] [Google Scholar]
- 13.Rezaur Rahman Chowdhury FA, Zhang H & Huang L Learning to Fold RNAs in Linear Time. bioRxiv, 852871 (2019). [Google Scholar]
- 14.Akiyama M, Sato K & Sakakibara Y A max-margin training of RNA secondary structure prediction integrated with the thermodynamic model. J Bioinform Comput Biol 16, 1840025 (2018). [DOI] [PubMed] [Google Scholar]
- 15.Singh J, Hanson J, Paliwal K & Zhou Y RNA secondary structure prediction using an ensemble of two-dimensional deep neural networks and transfer learning. Nature Communications 10, 1–13 (2019). [DOI] [PMC free article] [PubMed] [Google Scholar]
- 16.Puton T, Kozlowski LP, Rother KM & Bujnicki JM CompaRNA: a server for continuous benchmarking of automated methods for RNA secondary structure prediction. Nucleic Acids Res 41, 4307–4323 (2013). [DOI] [PMC free article] [PubMed] [Google Scholar]
- 17.Wayment-Steele H, Wu M, Gotrik M & Das R Evaluating riboswitch optimality. Methods Enzymol 623, 417–450 (2019). [DOI] [PMC free article] [PubMed] [Google Scholar]
- 18.Berens C & Suess B Riboswitch engineering---making the all-important second and third steps. Curr. Opin. Biotechnol. 31, 10–15 (2015). [DOI] [PubMed] [Google Scholar]
- 19.Mauger DM et al. mRNA structure regulates protein expression through changes in functional half-life. Proc Natl Acad Sci U S A 116, 24075–24083 (2019). [DOI] [PMC free article] [PubMed] [Google Scholar]
- 20.Watters KE & Lucks JB Mapping RNA Structure In Vitro with SHAPE Chemistry and Next-Generation Sequencing (SHAPE-Seq). Methods Mol Biol 1490, 135–162 (2016). [DOI] [PubMed] [Google Scholar]
- 21.Wilkinson KA, Merino EJ & Weeks KM Selective 2’-hydroxyl acylation analyzed by primer extension (SHAPE): quantitative RNA structure analysis at single nucleotide resolution. Nat Protoc 1, 1610–1616 (2006). [DOI] [PubMed] [Google Scholar]
- 22.Tian S & Das R RNA structure through multidimensional chemical mapping. Q Rev Biophys 49, e7 (2016). [DOI] [PubMed] [Google Scholar]
- 23.Denny SK et al. High-Throughput Investigation of Diverse Junction Elements in RNA Tertiary Folding. Cell 174, 377–390 e320 (2018). [DOI] [PMC free article] [PubMed] [Google Scholar]
- 24.Buenrostro JD et al. Quantitative analysis of RNA-protein interactions on a massively parallel array reveals biophysical and evolutionary landscapes. Nat Biotechnol 32, 562–568 (2014). [DOI] [PMC free article] [PubMed] [Google Scholar]
- 25.Lee J et al. RNA design rules from a massive open laboratory. Proc Natl Acad Sci U S A 111, 2122–2127 (2014). [DOI] [PMC free article] [PubMed] [Google Scholar]
- 26.Delli Ponti R, Marti S, Armaos A & Tartaglia GG A high-throughput approach to profile RNA structure. Nucleic Acids Res 45, e35 (2017). [DOI] [PMC free article] [PubMed] [Google Scholar]
- 27.Eddy SR Computational Analysis of Conserved RNA Secondary Structure in Transcriptomes and Genomes. Annual Review of Biophysics (2014). [DOI] [PMC free article] [PubMed] [Google Scholar]
- 28.Cordero P, Lucks JB & Das R An RNA Mapping DataBase for curating RNA structure mapping experiments. Bioinformatics 28, 3006–3008 (2012). [DOI] [PMC free article] [PubMed] [Google Scholar]
- 29.Wellington-Oguri R et al. Evidence of an Unusual Poly(A) RNA Signature Detected by High-Throughput Chemical Mapping. Biochemistry 59, 2041–2046 (2020). [DOI] [PubMed] [Google Scholar]
- 30.Anderson-Lee J et al. Principles for Predicting RNA Secondary Structure Design Difficulty. J Mol Biol 428, 748–757 (2016). [DOI] [PMC free article] [PubMed] [Google Scholar]
- 31.Beisel CL & Smolke CD Design principles for riboswitch function. PLoS Comput. Biol. 5, e1000363 (2009). [DOI] [PMC free article] [PubMed] [Google Scholar]
- 32.Breaker RR Prospects for riboswitch discovery and analysis. Mol. Cell 43, 867–879 (2011). [DOI] [PMC free article] [PubMed] [Google Scholar]
- 33.Andreasson JOL et al. Crowdsourced RNA design discovers diverse, reversible, efficient, self-contained molecular switches. Proc Natl Acad Sci U S A 119, e2112979119 (2022). [DOI] [PMC free article] [PubMed] [Google Scholar]
- 34.Wu MJ, Andreasson JOL, Kladwang W, Greenleaf W & Das R Automated Design of Diverse Stand-Alone Riboswitches. ACS Synth Biol 8, 1838–1846 (2019). [DOI] [PMC free article] [PubMed] [Google Scholar]
- 35.Andronescu M, Condon A, Hoos HH, Mathews DH & Murphy KP in RNA, Vol. 16 2304–2318 (2010). [DOI] [PMC free article] [PubMed] [Google Scholar]
- 36.Foo C-S & Pop C Learning RNA secondary structure (only) from structure probing data. bioRxiv, 152629 (2017). [Google Scholar]
- 37.Andronescu M, Bereg V, Hoos HH & Condon A RNA STRAND: the RNA secondary structure and statistical analysis database. BMC Bioinformatics 9, 340 (2008). [DOI] [PMC free article] [PubMed] [Google Scholar]
- 38.Sloma MF & Mathews DH Exact calculation of loop formation probability identifies folding motifs in RNA secondary structures. RNA 22, 1808–1818 (2016). [DOI] [PMC free article] [PubMed] [Google Scholar]
- 39.Watters KE et al. Probing of RNA structures in a positive sense RNA virus reveals selection pressures for structural elements. Nucleic Acids Res 46, 2573–2584 (2018). [DOI] [PMC free article] [PubMed] [Google Scholar]
- 40.Watts JM et al. Architecture and secondary structure of an entire HIV-1 RNA genome. Nature 460, 711–716 (2009). [DOI] [PMC free article] [PubMed] [Google Scholar]
- 41.Kutchko KM et al. Structural divergence creates new functional features in alphavirus genomes. Nucleic Acids Res 46, 3657–3670 (2018). [DOI] [PMC free article] [PubMed] [Google Scholar]
- 42.Siegfried NA, Busan S, Rice GM, Nelson JA & Weeks KM RNA motif discovery by SHAPE and mutational profiling (SHAPE-MaP). Nat Methods 11, 959–965 (2014). [DOI] [PMC free article] [PubMed] [Google Scholar]
- 43.Dadonaite B et al. The structure of the influenza A virus genome. Nat Microbiol 4, 1781–1789 (2019). [DOI] [PMC free article] [PubMed] [Google Scholar]
- 44.Simon LM et al. In vivo analysis of influenza A mRNA secondary structures identifies critical regulatory motifs. Nucleic Acids Res 47, 7003–7017 (2019). [DOI] [PMC free article] [PubMed] [Google Scholar]
- 45.Huber RG et al. Structure mapping of dengue and Zika viruses reveals functional long-range interactions. Nat Commun 10, 1408 (2019). [DOI] [PMC free article] [PubMed] [Google Scholar]
- 46.Huston NC et al. Comprehensive in vivo secondary structure of the SARS-CoV-2 genome reveals novel regulatory motifs and mechanisms. Mol Cell 81, 584–598 e585 (2021). [DOI] [PMC free article] [PubMed] [Google Scholar]
- 47.Manfredonia I et al. Genome-wide mapping of SARS-CoV-2 RNA structures identifies therapeutically-relevant elements. Nucleic Acids Res 48, 12436–12452 (2020). [DOI] [PMC free article] [PubMed] [Google Scholar]
- 48.Sun L et al. In vivo structural characterization of the SARS-CoV-2 RNA genome identifies host proteins vulnerable to repurposed drugs. Cell 184, 1865–1883 e1820 (2021). [DOI] [PMC free article] [PubMed] [Google Scholar]
- 49.Lavender CA, Gorelick RJ & Weeks KM Structure-Based Alignment and Consensus Secondary Structures for Three HIV-Related RNA Genomes. PLoS Comput Biol 11, e1004230 (2015). [DOI] [PMC free article] [PubMed] [Google Scholar]
- 50.Deigan KE, Li TW, Mathews DH & Weeks KM Accurate SHAPE-directed RNA structure determination. Proc Natl Acad Sci U S A 106, 97–102 (2009). [DOI] [PMC free article] [PubMed] [Google Scholar]
- 51.McGinnis JL & Weeks KM Ribosome RNA assembly intermediates visualized in living cells. Biochemistry 53, 3237–3247 (2014). [DOI] [PMC free article] [PubMed] [Google Scholar]
- 52.Leppek K et al. Combinatorial optimization of mRNA structure, stability, and translation for RNA-based therapeutics. bioRxiv (2021). [DOI] [PMC free article] [PubMed] [Google Scholar]
- 53.Sun L et al. RNA structure maps across mammalian cellular compartments. Nat Struct Mol Biol 26, 322–330 (2019). [DOI] [PMC free article] [PubMed] [Google Scholar]
- 54.Becker WR et al. Quantitative high-throughput tests of ubiquitous RNA secondary structure prediction algorithms via RNA/protein binding. bioRxiv, 571588 (2019). [Google Scholar]
- 55.Rouskin S, Zubradt M, Washietl S, Kellis M & Weissman JS Genome-wide probing of RNA structure reveals active unfolding of mRNA structures in vivo. Nature 505, 701–705 (2014). [DOI] [PMC free article] [PubMed] [Google Scholar]
- 56.Morandi E et al. Genome-scale deconvolution of RNA structure ensembles. Nat Methods 18, 249–252 (2021). [DOI] [PubMed] [Google Scholar]
- 57.Hajdin CE et al. Accurate SHAPE-directed RNA secondary structure modeling, including pseudoknots. Proc Natl Acad Sci U S A 110, 5498–5503 (2013). [DOI] [PMC free article] [PubMed] [Google Scholar]
- 58.Zarringhalam K, Meyer MM, Dotu I, Chuang JH & Clote P Integrating chemical footprinting data into RNA secondary structure prediction. PLoS One 7, e45160 (2012). [DOI] [PMC free article] [PubMed] [Google Scholar]
- 59.Sato K, Akiyama M & Sakakibara Y RNA secondary structure prediction using deep learning with thermodynamic integration. Nat Commun 12, 941 (2021). [DOI] [PMC free article] [PubMed] [Google Scholar]
- 60.Chen X, Li Y, Umarov R, Gao X, Song L in International Conference on Learning Representations (2020). [Google Scholar]
- 61.Ward M, Datta A, Wise M & Mathews DH Advanced multi-loop algorithms for RNA secondary structure prediction reveal that the simplest model is best. Nucleic Acids Res 45, 8541–8550 (2017). [DOI] [PMC free article] [PubMed] [Google Scholar]
- 62.Zhao BS, Roundtree IA & He C Post-transcriptional gene regulation by mRNA modifications. Nat Rev Mol Cell Biol 18, 31–42 (2017). [DOI] [PMC free article] [PubMed] [Google Scholar]
- 63.Rinnenthal J et al. Mapping the landscape of RNA dynamics with NMR spectroscopy. Acc Chem Res 44, 1292–1301 (2011). [DOI] [PubMed] [Google Scholar]
- 64.Kappel K et al. Accelerated cryo-EM-guided determination of three-dimensional RNA-only structures. Nat Methods 17, 699–707 (2020). [DOI] [PMC free article] [PubMed] [Google Scholar]
Online Methods References
- 1.McCaskill JS The equilibrium partition function and base pair binding probabilities for RNA secondary structure. Biopolymers 29, 1105–1119 (1990). [DOI] [PubMed] [Google Scholar]
- 2.Washietl S, Hofacker IL, Stadler PF & Kellis M RNA folding with soft constraints: reconciliation of probing data and thermodynamic secondary structure prediction. Nucleic Acids Res. 40, 4261–4272 (2012). [DOI] [PMC free article] [PubMed] [Google Scholar]
- 3.Deng F, Ledda M, Vaziri S & Aviran S Data-directed RNA secondary structure prediction using probabilistic modeling. RNA 22, 1109–1119 (2016). [DOI] [PMC free article] [PubMed] [Google Scholar]
- 4.Eddy SR Computational Analysis of Conserved RNA Secondary Structure in Transcriptomes and Genomes. Annual Review of Biophysics (2014). [DOI] [PMC free article] [PubMed] [Google Scholar]
- 5.Cordero P & Das R Rich RNA structure landscapes revealed by mutate-and-map analysis. PLoS Comput Biol 11, e1004473 (2015). [DOI] [PMC free article] [PubMed] [Google Scholar]
- 6.Xu Y et al. Hoogsteen base pairs increase the susceptibility of double-stranded DNA to cytotoxic damage. J Biol Chem 295, 15933–15947 (2020). [DOI] [PMC free article] [PubMed] [Google Scholar]
- 7.Cordero P, Lucks JB & Das R An RNA Mapping DataBase for curating RNA structure mapping experiments. Bioinformatics 28, 3006–3008 (2012). [DOI] [PMC free article] [PubMed] [Google Scholar]
- 8.Kladwang W et al. Standardization of RNA Chemical Mapping Experiments. Biochemistry 53, 3063–3065 (2014). [DOI] [PMC free article] [PubMed] [Google Scholar]
- 9.Seetin MG, Kladwang W, Bida JP & Das R Massively parallel RNA chemical mapping with a reduced bias MAP-seq protocol. Methods Mol Biol 1086, 95–117 (2014). [DOI] [PubMed] [Google Scholar]
- 10.Fu L, Niu B, Zhu Z, Wu S & Li W CD-HIT: accelerated for clustering the next-generation sequencing data. Bioinformatics 28, 3150–3152 (2012). [DOI] [PMC free article] [PubMed] [Google Scholar]
- 11.Kladwang W et al. Anomalous reverse transcription through chemical modifications in polyadenosine stretches. bioRxiv, 2020.2001.2007.897843 (2020). [DOI] [PMC free article] [PubMed] [Google Scholar]
- 12.Wayment-Steele H, Wu M, Gotrik M & Das R Evaluating riboswitch optimality. Methods Enzymol 623, 417–450 (2019). [DOI] [PMC free article] [PubMed] [Google Scholar]
- 13.Andreasson JOL et al. Crowdsourced RNA design discovers diverse, reversible, efficient, self-contained molecular switches. Proc Natl Acad Sci U S A 119, e2112979119 (2022). [DOI] [PMC free article] [PubMed] [Google Scholar]
- 14.Wu MJ, Andreasson JOL, Kladwang W, Greenleaf W & Das R Automated Design of Diverse Stand-Alone Riboswitches. ACS Synth Biol 8, 1838–1846 (2019). [DOI] [PMC free article] [PubMed] [Google Scholar]
- 15.Do CB, Woods DA & Batzoglou S CONTRAfold: RNA secondary structure prediction without physics-based models. Bioinformatics 22, e90–98 (2006). [DOI] [PubMed] [Google Scholar]
- 16.Foo C-S & Pop C Learning RNA secondary structure (only) from structure probing data. bioRxiv, 152629 (2017). [Google Scholar]
- 17.Andronescu M, Bereg V, Hoos HH & Condon A RNA STRAND: the RNA secondary structure and statistical analysis database. BMC Bioinformatics 9, 340 (2008). [DOI] [PMC free article] [PubMed] [Google Scholar]
- 18.Andronescu M, Condon A, Hoos HH, Mathews DH & Murphy KP Efficient parameter estimation for RNA secondary structure prediction. Bioinformatics 23, i19–28 (2007). [DOI] [PubMed] [Google Scholar]
- 19.Sloma MF & Mathews DH Exact calculation of loop formation probability identifies folding motifs in RNA secondary structures. RNA 22, 1808–1818 (2016). [DOI] [PMC free article] [PubMed] [Google Scholar]
- 20.Zhang H, Zhang L, Mathews DH & Huang L LinearPartition: linear-time approximation of RNA folding partition function and base-pairing probabilities. Bioinformatics 36, i258–i267 (2020). [DOI] [PMC free article] [PubMed] [Google Scholar]
- 21.Hajdin CE et al. Accurate SHAPE-directed RNA secondary structure modeling, including pseudoknots. Proc Natl Acad Sci U S A 110, 5498–5503 (2013). [DOI] [PMC free article] [PubMed] [Google Scholar]
- 22.Deigan KE, Li TW, Mathews DH & Weeks KM Accurate SHAPE-directed RNA structure determination. Proc Natl Acad Sci U S A 106, 97–102 (2009). [DOI] [PMC free article] [PubMed] [Google Scholar]
- 23.Zarringhalam K, Meyer MM, Dotu I, Chuang JH & Clote P Integrating chemical footprinting data into RNA secondary structure prediction. PLoS One 7, e45160 (2012). [DOI] [PMC free article] [PubMed] [Google Scholar]
- 24.Zou GY Toward using confidence intervals to compare correlations. Psychol Methods 12, 399–413 (2007). [DOI] [PubMed] [Google Scholar]
- 25.Diedenhofen B & Musch J cocor: a comprehensive solution for the statistical comparison of correlations. PLoS One 10, e0121945 (2015). [DOI] [PMC free article] [PubMed] [Google Scholar]
Associated Data
This section collects any data citations, data availability statements, or supplementary materials included in this article.
Supplementary Materials
Data Availability Statement
All datasets used here for evaluation are available at https://www.github.com/eternagame/EternaBench. The original cloud lab datasets are available at the RNA Mapping Database7 under accession IDs ETERNA_R00_0000 (Round 00), ETERNA_R69_0000 (Round 01), ETERNA_R70_0000 (Round 02), ETERNA_R71_0000 (Round 03), ETERNA_R72_0000 (Round 04), ETERNA_R73_0000 (Round 05), ETERNA_R74_0000 (Round 06), ETERNA_R75_0000 (Round 07), ETERNA_R76_0000 (Round 08), ETERNA_R77_0002 (Round 09), ETERNA_R78_0001 (Round 10), ETERNA_R79_0001 (Round 11), ETERNA_R80_0001 (Round 12), ETERNA_R81_0001 (Round 13), ETERNA_R82_0001 (Round 14), ETERNA_R83_0003 (Round 15), ETERNA_R84_0000 (Round 16), ETERNA_R85_0000 (Round 17), ETERNA_R86_0000 (Round 18), ETERNA_R87_0001 (Round 19), ETERNA_R89_0000 (Round 20), ETERNA_R91_0000 (Round 21), ETERNA_R92_0000 (Round 22), ETERNA_R94_0000 (Round 23). A list of RMDB accession IDs or urls corresponding to the data used for benchmarking SHAPE-guided folding is in Table S12.


