

Abstract
Cell competition, a fitness sensing process is essential for tissue homeostasis. Employing cancer metastatic latency models, we show that cell competition results in displacement of latent metastatic (Lat-M) cells from the primary tumor. Lat-M cells resist anoikis and survive as residual metastatic disease. Remodelled extracellular matrix facilitates Lat-M cell displacement and survival in circulation. Disrupting cell competition dynamics by depleting SPARC reduced displacement from orthotopic tumors and attenuated metastases. In contrast, depletion of SPARC post-extravasation in lung resident Lat-M cells increased metastatic outgrowth. Furthermore, multi-regional transcriptomic analyses of matched primary tumors and metachronous metastases from kidney cancer patients identified tumor subclones with latent metastatic traits. Kidney cancer enriched for these latent metastatic traits had rapid onset of metachronous metastases and significantly reduced disease-free survival. Thus, an unexpected consequence of cell competition is displacement of cells with latent metastatic potential, thereby shaping metastatic latency and relapse.
Statement of Significance
We demonstrate cell competition within the primary tumor results in displacement of latent metastatic cells. We further show the impact of altering cell competition dynamics on metastatic incidence that may guide strategies to limit metastatic recurrences.
Keywords: Cell competition, metastatic latency, metastasis, ccRCC, dormancy, SPARC
Introduction
Cellular fitness is determined based on cell intrinsic features and relative fitness compared to surrounding cells (1-4). Cell fitness sensing mechanisms or cell competition is important in maintaining tissue homeostasis and may play a role in ageing and tumorigenesis (5-11). Cell competition results in the elimination or displacement of less fit cells in favor of more capable neighboring cells (12-20). During tumorigenesis cancer cells acquire genomic and epigenomic alterations adapting to selective pressures that results in heterogeneous clonal populations (13). Clonal populations with proliferative advantage become over-represented within the tumor while less competitive subclones will either succumb under selective pressure or be displaced (1-4).
Displaced primary tumor cells could disseminate through the vasculature and lymphatics and serve as metastatic seeds (21-24). However, not all displaced cells will disseminate or initiate metastases. Most tumor cells perish in the circulation or post extravasation into distal organs, while a few survive. These survivors may initiate metastasis or persist as latent residual disease (25-28). Given that intrinsic and extrinsic factors determine tumor cell fitness in distal organs, metastatic incidence in cancer patients is variable and indeterminate (25,29-32).
We hypothesized that cell competition driven by intra-tumoral heterogeneity may select for fit clones and promote displacement of less fit latent metastatic cells from primary tumors, which may disseminate and seed metastases. Moreover, given that cell fitness sensing and selection of dominant clones is a relative process, fitness of the less fit displaced cells in the distal organs may dictate whether they perish, persist as latent residual disease or initiate metastasis. To test these concepts, we chose to focus on clear cell renal cell carcinoma (ccRCC), the most common type of kidney cancer that displays high intra-tumoral heterogeneity. Moreover, most kidney cancer patients develop metachronous metastatic disease, more commonly to the lung and the adrenal gland relative to other organs(33-37).
Results
ccRCC latent metastatic (Lat-M) cell isolation
First, to isolate latent metastatic cells from heterogenous tumor cell populations, we transduced 769-P cells derived from a primary ccRCC with luciferase and antibiotic resistance marker hygromycin (Parental cells; PA). These cells were orthotopically implanted into athymic FOXN1nu mice and tumor growth was monitored weekly. 4 weeks post implantation, primary tumors were surgically removed, and mice were monitored for metastatic incidence by bioluminescent imaging (BLI) for up to 5 months (Supplementary Fig. S1A). No overt metastases were observed in these mice. As lungs are the most common site of metastatic relapse in ccRCC patients, we harvested lungs from these mice, dissociated them into single cell suspensions and assessed for hygromycin resistant disseminated latent metastatic (Lat-M) cells. Using this approach, we recovered Lat-M cells from the lungs of (n=4/20) mice. Next, to establish if isolated Lat-M cells were phenotypically stable, we re-injected them intracardially into athymic and severely immunocompromised NOD.Cg-Prkdcscid Il2rgtm1Wjl/SzJ (NSG) mice. BLI signal was detected in the lungs starting 3 weeks post-injection and remained stable for over 12 weeks (Fig. 1A and Supplementary Fig. S1B). Ex vivo lung imaging and immunohistochemical analysis further revealed Lat-M cells persist as residual disease in the lungs (Supplementary Fig. S1C).
Fig. 1. Cell competition results in displacement and dissemination of Lat-M cells.
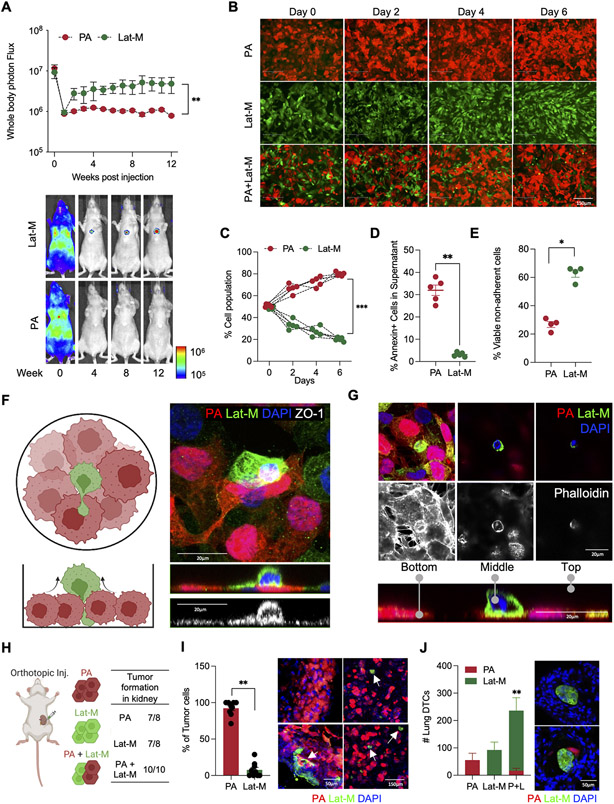
A. Luciferase labeled PA and Lat-M were intracardially injected and metastasis was tracked by whole body bioluminescent imaging (BLI: Total photon flux (p/s)) in athymic mice. n=5 each group. Data are presented as mean +/− SEM. Mann-Whitney U-test. B-D. Cell competition assay was performed using RFP-labeled PA, GFP-labeled Lat-M and both RFP-labeled PA, GFP-labeled Lat-M in 1:1 ratio (B). Quantification of cell competition from day 0 to 6. n=5 each group. All data points are presented. Mann-Whitney U-test (C). Supernatant cells were stained with Annexin V to measure alive displaced cells (D). E. Anoikis assay showing increased percentage of viable non-adherent Lat-M cells n=4 each group. Data are presented as mean +/− SEM. Mann-Whitney U-test. F-G. Schematic illustration of cell competition assay (F) and cell surface staining by ZO-1 (F) and actin staining by Phalloidin (G) along with RFP (PA), GFP (Lat-M) and DAPI staining. Orthogonal projections show cell displacement in cell competition. H-J. PA, Lat-M, or both of PA and Lat-M cells (1:1 ratio) were orthotopically injected to generate primary kidney tumor (H). Primary kidney tumor (I) and lungs (J) were sectioned and stained with GFP and RFP antibody to identify PA and Lat-M cells. n=9 each group. White arrows indicate GFP+ Lat-M cells. Data are presented as mean+/− SEM. Mann-Whitney U-test (I). n=4 for PA and Lat-M. n=5 for PA + Lat-M group. Data are presented as mean+/− SEM. Mann-Whitney U-test (J).
Cell competition promotes displacement of Lat-M cells
To investigate whether cell competition resulted in displacement of Lat-M cells and establishment of latent metastasis, we labeled parental cells with red fluorescent protein (RFP) and Lat-M cells with green fluorescent protein (GFP). Parental cells had a competitive edge and were overrepresented when cocultured with Lat-M cells under cell competition assay conditions(9,38) (Fig. 1B-C). Concomitantly, a significantly higher number of displaced viable Lat-M cells were observed in the culture media (Fig. 1D and Supplementary Video S1A and B). Of note, no significant differences in proliferation were observed between parental and Lat-M cells when cultured alone (Supplementary Fig. S1D) or with supernatants from Lat-M and parental cells (Supplementary Fig. S1E). Next, we seeded displaced cells under cell competition conditions in new culture plates to evaluate their ability to survive and form colonies. A significantly higher number of Lat-M cells were able to form colonies in these assays (Supplementary Fig. S1F). Moreover, Lat-M cells resist anoikis (39,40), cell death resulting from loss of cell-cell or cell-matrix interactions that is vital for survival of displaced cancer cells during systemic dissemination (Fig. 1E). Staining with an epithelial marker ZO-1 and Phalloidin demonstrates Lat-M cell displacement during cell competition (Fig. 1F-G and Supplementary Fig. S1G). Akin to ccRCC Lat-M cells, latent breast (HCC1954) and lung (H2087) adenocarcinoma cells (Lat-M/LCCs) (26) were displaced in cell competition assays with their matched PA cells and resisted anoikis (Supplementary Fig. S1H-K).
Next, to assess the impact of cell competition on displacement and establishment of latent residual disease in vivo, we orthotopically implanted parental and Lat-M cells alone or together (PA and Lat-M (1:1 ratio) (Fig. 1H). Mice implanted with parental, Lat-M or both formed orthotopic tumors with no significant differences in tumor sizes (Fig. 1H and Supplementary Fig. S1L). We sectioned PA (RFP+) and Lat-M (GFP+) co-implanted orthotopic tumors to visualize impact of cell competition in vivo. In agreement with our in vitro studies, RFP+ PA cells represented a significantly larger proportion of the orthotopic tumor compared to GFP+ Lat-M cells, which were interspersed as single cell or small clumps within the primary tumor (Fig. 1I). Next, we assessed latent lung metastasis in mice bearing these orthotopic tumors by analyzing serial sections of lung tissue stained for RFP and GFP to identify parental and Lat-M cells respectively. An increased number of disseminated tumor cells were observed in the lungs of mice co-implanted with PA and Lat-M compared to PA or Lat-M alone (Fig. 1J). Taken together, these data show that cell competition contributes to the displacement of Lat-M cells and establishment of latent metastasis.
Demethylation results in enrichment of extracellular matrix proteins in Lat-M cells
Next, to uncover molecular mediators of cell displacement and metastatic latency, we analyzed transcriptomic profiles of PA and Lat-M cells (Fig. 2A). Gene Set Enrichment Analysis (GSEA) using the Reactome database showed an enriched cluster of genes associated with extracellular matrix (ECM) in Lat-M cells (Supplementary Fig. S2A). We confirmed increased expression of Secreted Protein And Rich in Cysteine (SPARC), Collagen I, Laminin, Osteopontin and Fibronectin in Lat-M cells (Supplementary Fig. S2B). Of note, GSEA analysis also indicated DNA hypomethylation and the associated loss of histone H3K27me3 may result in increased transcription of genes observed in Lat-M cells (Supplementary Fig. S2C). Consistent with this observation, whole genome bisulfite sequencing (WGBS) revealed significantly decreased DNA methylation in Lat-M cells (Fig. 2B and Supplementary Fig. S2D). Likewise, western blot analysis revealed attenuated H3K27me3 in Lat-M cells (Supplementary Fig. S2E). Moreover, among 138 genes upregulated in Lat-M cells (Log2FC > 1 and p-value < 0.05), 51 genes had hypomethylated loci and the majority encoded plasma membrane and extracellular space proteins (Fig. 2C).
Fig. 2. DNA/Histone demethylation induces expression of Lat-M genes.
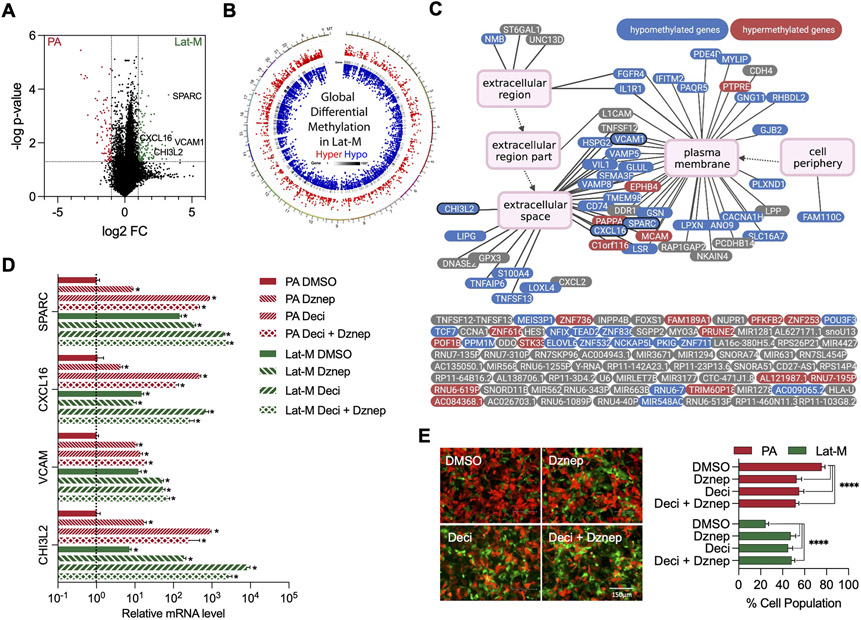
A. Volcano plot highlighting differentially expressed genes in PA and Lat-M cells. Significantly upregulated (Log2FC>1 and p-value<0.05, green dots) and downregulated (Log2FC <−1 and p-value<0.05, red dots) genes in Lat-M are highlighted. B. Circos diagram (68) reflects distribution of differentially methylated regions (DMR) on genome in Lat-M cells. From outside to inside: 1. Hyper DMR statistical value, log5 (∣area stat∣), with red color dots 2. Heat map of gene density 3. Hypo DMR statistical value, log5 (∣area stat∣), with blue color dots. C. Methylation status of genes (n=138) enriched in Lat-M cells compared to PA. Methylation status of genes in Lat-M are color coded: red (hyper), blue (hypo), and gray (no significant change). Each gene is connected to enriched GO terms with a line and parent GO term points to child GOterm by an arrow. D. qPCR result showing change in expression of extracellular and cell surface genes in the presence of demethylation agent Decitabine (2.5 μM), H3K27me3 inhibitor Dznep (2.5 μM), or both in PA and Lat-M cells. n=4 each group. Data are presented as mean +/− SEM. Kruskal-wallis test was used, followed by Dunn’s test for each gene. (E) Images and quantification of cell competition assay under Decitabine and Dznep. n=10 each group. Data are presented as mean +/− SD. Kruskal-wallis test was used, followed by Dunn’s test for each column to PA-DMSO.
Administration of Decitabine (5-Aza-2-deoxy), a DNA methyl transferase inhibitor (41) to parental cells resulted in increased expression of the differentially expressed ECM genes observed in Lat-M cells (Fig. 2D). Likewise, 3-deazaneplanocin A (DZNep) (42), which is reported to selectively inhibit trimethylation of lysine 27 on histone H3 (H3K27me3) and lysine 20 on histone H4 (H4K20me3) activated expression of ECM genes in parental cells (Fig. 2D). Administration of either DNA/Histone demethylating agents disrupted the competitive advantage parental cells had over Lat-M cells in vitro (Fig. 2E). SPARC expression was also high in breast and lung cancer derived Lat-M cells (Supplementary Fig. 2F-G) and DNA/Histone demethylating agents induces SPARC expression in breast and lung cancer parental cells (Supplementary Fig. S2H-I). These observations suggest altered cellular chromatin state shapes clonal heterogeneity and selection of latent metastatic cells.
Lat-M cell fitness is context dependent
Next, to molecularly alter cell competition dynamics and assess its impact on metastatic latency, we focused on SPARC that is enriched in Lat-M cells, for the following reasons. First, SPARC is located on chromosome 5q, that is gained as a consequence of chromothripsis in approximately 70% of ccRCCs (43) and its expression may be regulated by methylation (44-46). Second, SPARC belongs to a family of matricellular proteins that modulate cell-ECM interactions and is implicated in tumor cell invasion and dissemination (47-49). Third and more notably, drosophila SPARC (dSparc) had been reported to be upregulated in displaced loser cells and serves as a self-protective signal for displaced cells during cell competition (50,51).
Thus, we depleted SPARC in Lat-M cells using two independent doxycycline inducible shRNAs (Supplementary Fig. S3A). Although no significant difference in proliferation rates were observed between Ctrl and SPARC depleted cells under normal 2D culture conditions (Supplementary Fig. S3B), SPARC depleted Lat-M cells were more susceptible to anoikis compared to control cells (Fig. 3A). To test whether SPARC promotes disseminated tumor cell survival in circulation, we cultured Ctrl and SPARC shRNA induced Lat-M cells in doxycycline media and injected these cells orthotopically into mice fed with doxycycline diet. No significant differences in tumor growth were observed in mice injected with either Ctrl or SPARC deficient Lat-M cells (Fig. 3B and C). However, there was a significant reduction in spontaneously disseminated tumor cells in the lungs (Fig. 3D). Likewise, a significant reduction in number of disseminated luciferase positive cells were observed in lungs of mice injected intracardially with SPARC depleted Lat-M cells compared to controls (Fig. 3E and F). These data suggest SPARC mediates survival in circulation and also enables Lat-M cell dissemination into distal organs.
Fig. 3. SPARC determines relative fitness of Lat-M cells during metastasis.
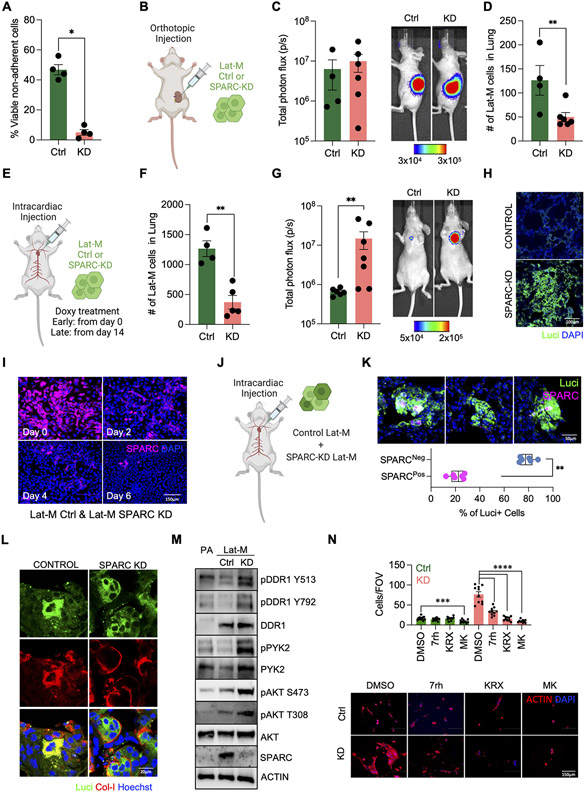
A. SPARC knockdown (KD) Lat-M cells are more susceptible to anoikis compared to controls (Ctrl). n=4 each group. Data are presented as mean +/− SEM. Mann-Whitney U-test. B-D. Lat-M Ctrl and KD were orthotopically injected into kidney to compare tumorigenic and metastatic potential of cells (B). Primary tumor growth was tracked by whole body bioluminescence imaging (C). Metastatic dissemination of Lat-M cells was measured by sectioning lungs of mice and staining for luciferase (D). E-H Experimental metastasis assay was performed by injecting Lat-M Ctrl and KD cells intracardially. SPARC knockdown was maintained by supplementing mouse diet with doxycycline (E). Lat-M Ctrl and KD cells were cultured with doxycycline and injected intracardially. Mice were kept on doxycycline diet to deplete SPARC. 3 days post intracardiac injection mice were sacrificed and disseminated Lat-M cells in lungs were quantified by luciferase immunofluorescence staining. n=4 (Ctrl) and n=5 (KD). Data are presented as mean +/− SEM. Mann-Whitney U-test (F). To deplete SPARC in disseminated lung-resident Lat-M cells, Doxycycline diet was administered to mice 2 weeks after intracardially injecting Ctrl or SPARC shRNA transduced Lat-M cells. Metastatic burden was tracked weekly by bioluminescence imaging until 12 weeks. n=6 (Ctrl) and n=7 (KD). Data are presented as mean +/− SEM. Mann-Whitney U-test (G). Increased metastatic burden was observed upon SPARC depletion by luciferase immunofluorescence staining on lung sections (H). I. Cell competition assay of Lat-M Ctrl and KD. SPARC immunocytochemistry was performed every 2days (Day 0, 2, 4, and 6). J-K. In vivo metastatic cell competition assay was performed by injecting mixture of Ctrl and SPARC KD Lat-M cells intracardially (J). After 12 weeks of injection, immunofluorescence staining of luciferase and SPARC was performed in lung section to see SPARC positive and negative Lat-M cells in metastatic lung. n=5 (Ctrl) and n=6 (KD). Data are presented as mean +/− SEM. Mann-Whitney U-test (K). L. Collagen-I staining of Ctrl and SPARC-KD Lat-M cells in lung. Immunohistochemistry was performed using luciferase and Collagen-I antibody and Hoechst. M. Western blots of DDR1, PYK2, and AKT showing changes in phosphorylation status as a consequence of SPARC depletion in PA, Lat-M Ctrl, and KD. N. Lat-M Ctrl and KD were cultured in collagen gels with DDR1 inhibitor 7rh or AKT inhibitor Perifosine (KRX-0401) or MK-2206. After 4 days of culture, cells were fixed and stained with Actin and Hoechst to observe cell morphology and nuclei. n=10 each group. Data are presented as mean +/− SEM. One-way ANOVA was used, followed by Dunnett’s test.
As SPARC high Lat-M cells persist in lung parenchyma as residual disease, we assessed the impact of depleting SPARC post extravasation into distal organs. To perform this analysis, we cultured Ctrl and SPARC shRNA transduced Lat-M cells in doxycycline-free media for over a week and injected these cells into mice intracardially (Fig. 3E). 2 weeks post injection, we induced Ctrl and SPARC shRNAs by supplementing doxycycline in diet of mice bearing Ctrl and SPARC shRNA transduced Lat-M cells (Fig. 3E). In contrast to our earlier observations of attenuated metastatic incidence upon depleting SPARC in orthotopically implanted tumors or in circulating cells, we observed increased metastatic burden upon SPARC depletion in lung resident Lat-M cells compared to control (Fig. 3G and H). Further supporting these in vivo observations, SPARC depleted Lat-M cells exhibited competitive growth advantage over controls and increased in numbers overtime in cell competition assays (Fig. 3I). Likewise, depletion of SPARC in breast and lung cancer derived Lat-M cells (Supplementary Fig. S3C and D) gives competitive growth advantage over controls (Supplementary Fig. S3E and F).
Next, we assayed cell competition in vivo by injecting an equal number of Ctrl and SPARC shRNA transduced Lat-M cells intracardially. 2 weeks post injection, mice were put on doxycycline diet to deplete SPARC (Fig. 3J). 10 weeks later, we harvested lungs from these mice and stained for luciferase and SPARC. Increased number of SPARC negative luciferase positive cells were observed compared to SPARC and luciferase double positive cells (Fig. 3K). Taken together, these studies highlight differential impact of SPARC depletion on Lat-M cell fitness in the primary tumor and upon extravasation to lung.
Although several genes including SPARC were differentially enriched in phenotypically distinct Lat-M cells, to check if SPARC alone was sufficient to promote displacement and metastatic latency, we generated SPARC over-expressing PA (PA-SPARChigh) cells (Supplementary Fig. S3G). SPARC overexpressing PA were underrepresented in cell competition assays when cultured with Ctrl PA cells (Supplementary Fig. S3H). However, no significant advantage in resisting anoikis was observed upon SPARC expression in parental cells (Supplementary Fig. S3I). In agreement with these data, orthotopic implantation of PA, PA-SPARChigh or combination showed no detectable GFP+ cells in lungs. Furthermore, intracardiac injection of PA-SPARChigh cells in mice did not show an increase in surviving latent lung metastatic cells (Supplementary Fig. S3J-L). Thus, we conclude SPARC is sufficient to promote displacement and a necessary pre-requisite to maintain Lat-M cell phenotype.
Collagen receptor signaling response alters Lat-M cell fitness in distal organs
Given that SPARC is a key modulator of collagen signaling response(52-54) and a determinant of the fate of disseminated latent metastatic seeds, we assessed the impact of SPARC depletion on collagen signaling. Immunofluorescent imaging of Lat-M cells in the lungs of mice revealed that loss of SPARC resulted in localization of collagen on the surface of tumor cell clusters compared to Ctrl Lat-M cells, where collagen was detected more diffusely (Fig. 3L and Supplementary Fig. S3M). Collagen can initiate cell signaling pathways by interacting with discoidin domain receptor (DDR) tyrosine kinases, integrins, glycoprotein VI and leukocyte-associated immunoglobulin-like receptors(55,56). SPARC competes with DDRs for binding to collagen and attenuates collagen induced DDR signaling in pancreatic ductal adenocarcinomas(52,57). Therefore, we checked the DDR1 signaling response in PA, Ctrl and SPARC depleted Lat-M cells. DDR1 expression is high in Ctrl and SPARC depleted Lat-M cells and increased DDR1 phosphorylation was observed upon SPARC depletion in Lat-M cells. Furthermore, AKT and PYK2, bona-fide DDR1 effectors were also phosphorylated upon SPARC depletion in Lat-M cells (Fig. 3M). Although SPARC depletion had no impact on Lat-M proliferation under 2D culture conditions, SPARC depleted Lat-M had increased proliferation in 3D collagen and matrigel cultures further highlighting the contribution of SPARC mediated ECM remodeling on metastatic progression (Supplementary Fig. S3M and N). Several small molecule inhibitors have been developed to target tyrosine activity of DDR1(58). N-isopropyl-4-methyl-3-(2-(pyrazolo-[1,5-a]pyrimidin-6-yl)ethynyl) 7rh benzamide (7rh), a potent DDR1 inhibitor, attenuated DDR1 signaling and the observed growth advantage in SPARC depleted Lat-M cells in 3D collagen and Matrigel cultures (Fig. 3N and Supplementary Fig. S3O). Likewise, AKT inhibitors (MK2206 and KRX-0401) in clinical trials for kidney cancer patients inhibited SPARC deficient Lat-M cells (Fig. 3N). Overall, these data suggest that ECM remodeling and altered collagen signaling provide a competitive growth advantage and facilitate metastatic outbreak upon SPARC depletion in lung resident Lat-M cells.
Lat-M cell traits associated with recurrences and poor clinical outcomes in ccRCC patients
Next, as displaced Lat-M cells can initiate non-synchronous metastases, we sought to validate these observations in ccRCC patients that developed metachronous metastases post primary diagnosis and treatment. We analyzed transcriptomic profiles of multi-region samples (n=10) from morphologically distinct regions within the primary tumor and metastatic lesion biopsies from two ccRCC patients that developed metachronous metastasis (59). Patient-1 (P1) developed adrenal metastasis - 16 months post primary diagnosis, while lung metastases were observed in Patient-2 (P2) 7 months post primary diagnosis (Supplementary Fig. S4A). Principal component analysis revealed clustering of a subclone within the primary tumor and metachronous metastatic lesions in both patients indicating metachronous metastases may have originated from a distinct subclone in the primary tumor (Fig. 4A). Component 2 includes ECM genes which separate T1 and Metastasis from T2, T3, and T4. Moreover, TIMER analysis revealed no significant differences in stromal composition between these multi-region samples of primary tumor (Supplementary Fig. S4B). Gene ontology analysis of the differentially expressed genes in the primary tumor subclone (P1-T1 and P2-T1) and the metachronous metastasis (P1-M and P2-M) revealed enrichment for gene programs akin to what was observed in Lat-M cells (Supplementary Fig. S4C-E). Notably, collagen and ECM proteins were enriched in the metachronous metastatic lesions and the corresponding subclone in the primary tumor analogous to Lat-M cells (Fig. 4B). Moreover, SPARC expression was high in a primary tumor subclone (P2-T1) and reduced in P2-M1 (lung metastasis) that developed after 6 months post- diagnosis, while SPARC expression was retained in subclone (P1-T1) and adrenal metastasis (P1-M) that developed 16 months post diagnosis in P1 - highlighting diverse mechanisms of relative cell fitness sensing and selection exist.
Fig. 4. Lat-M gene signature associated with poor survival outcome and disease relapse.
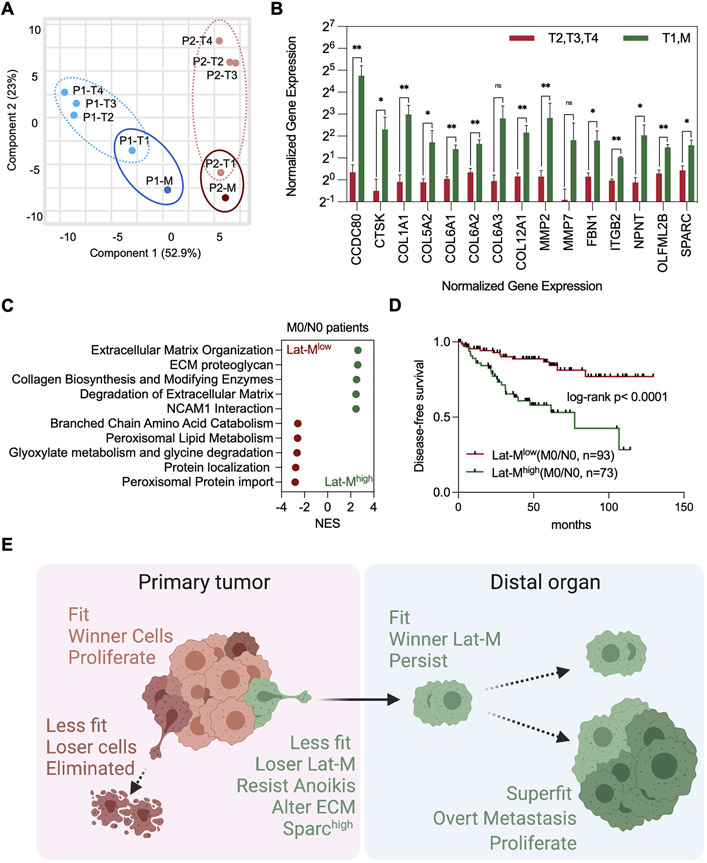
A. PCA plot was generated using transcriptomic profiles of multi-region sampling of primary tumor regions (8 samples, P1-T1/2/3/4 and P2-T1/2/3/4) and metastasis (2 samples, P1-M and P2-M) from 2 clear cell renal cell carcinoma patients with metachronous metastasis. B. Significantly upregulated ECM genes in P1-T1/M and P2-T1/M (primary tumor clones which showed similar gene expression with metastatic clones and metastatic clones) compared to P1-T1/T2/T3 and P2-T1/T2/T3. C. Top enriched Reactome pathways from gene set enrichment analysis comparing Lat-Mlow and Lat-Mhigh M0/N0 ccRCC patients in Firehose legacy database from TCGA. P<0.0001 for all plotted gene sets. D. M0/N0 Lat-Mhigh patients show reduced disease-free survival and more recurrence rate compared to M0/N0 Lat-Mlow patients in two independent ccRCC patients’ groups (Firehose Legacy). Kaplan-Meier (log-rank) test. E. Model summarizing key findings of this study.
Next, we classified ccRCC patients from TCGA firehose legacy databases into two groups - Lat-MHigh and Lat-MLow, by employing differentially expressed genes common to the metachronous metastatic lesion and its analogous primary tumor subclones from these two patients (Supplementary Fig. S4F). ECM genes and signaling responses were significantly enriched in Lat-Mhigh non-metastatic patients at the time of diagnosis (N0/M0 patient group) (Fig. 4C and Supplementary Table S1). Moreover, a significant reduction in disease-free survival and increased disease recurrence was observed in Lat-MHigh N0/M0 ccRCC patients compared to Lat-MLow N0/M0 ccRCC patients, while no such significant differences in survival benefit was observed in metastatic patients at the time diagnosis (N1/M1 patient group) (Fig. 4D and Supplementary Fig. S4G). Higher tumor grade (III and IV) tumors were found in Lat-Mhigh N0/M0 ccRCC patients and there were no significant difference of mutation count and genetic alteration in Lat-Mhigh N0/M0 ccRCC patients (Supplementary Fig. S4H and I). Similar trends were also observed in recently published ccRCC patient datasets (Supplementary Fig. S4J-L) (59,60) but not in papillary renal cell carcinoma, breast, and lung cancer patient data sets. Given the distinct oncogenomic status and origin of papillary renal cell carcinoma, breast, and lung tumors, it is not surprising that the latent signature we derived from ccRCC patients is specific to ccRCCs.
In summary, we identified an unintended and previously unrecognized consequence of the cell fitness sensing process in shaping tumor progression and latent metastatic disease. Employing metastatic latency models, we show cell competition aids displacement and dissemination of less-fit Lat-M clones to distal organs and promotes latent metastatic disease. ECM remodeling and altered signaling response determines cellular fitness of Lat-M cells in the primary tumor and at the distal organ (Fig. 4E).
Discussion
Our findings show that disease progression is not necessarily driven by the dominant aggressive clone but could be driven by a non-dominant less-fit clone within the primary tumor. These findings follow on previous studies showing that metastases are not always driven by the dominant or most aggressive clone in the primary tumor (59,61-63). We report less fit Lat-M cells that are displaced from the primary tumor are capable of initiating metastasis. Depending on the relative fitness of their surrounding cells, Lat-M cells could be loser or winner cells. SPARC high Lat-M are of suboptimal fitness within the primary tumor amongst heterogenous transformed cells and are displaced. In contrast, amid untransformed cells in distal organs they are fit and could persist as latent cells or proliferate and initiate metastasis.
ECM remodeling is important in facilitating Lat-M cell displacement during cell competition. SPARC, a matricellular regulator of tumorigenesis is important in mediating cell displacement and metastatic latency. SPARC activity is context and cell type dependent and is a consequence of ECM composition, availability of growth factors and signaling conduits in tumor cells (48,64,65). Depleting SPARC impedes Lat-M cell displacement from primary tumors and limits metastatic latency. In contrast, altering ECM driven signaling in Lat-M cells post extravasation by depleting SPARC results in metastatic outbreaks. These findings uncover the centrality of cell competition to the “context” during tumor progression, and highlights the distinct consequences of cell competition on latent metastatic cells in the primary tumor and distal organ.
Epigenomic reprogramming, alterations in genomic and signaling responses, and other selective pressures could alter the cellular state within latent metastatic seeds and determine their relative fitness in the primary tumor and distal organs. The fitness selection process maybe further shaped by therapeutic interventions such as targeted or immunotherapies, which may result in selective pruning of most sensitive clones (66,67). Future investigations defining how latent metastatic cells spatially persist under competition stress within the primary tumor and understanding the consequences of disrupting cell competition are likely to provide insights that could be harnessed to limit disease progression and metastatic relapses.
Materials and Methods
Animal experiments
All procedures were performed in strict accordance with the Guide for Care and Use of Laboratory Animals approved by the UT Southwestern Institutional Animal Care and Use Committee (IACUC). Healthy Hsd:Athymic Nude-Foxn1nu (Envigo) and NOD.CB17-Prkdcscid Il2rgtm1Wjl/SzJ (Jackson) female mice from 4-6 weeks of age were used for studies. All mice were housed in pathogen free conditions. For orthotopic kidney injection, luciferase labelled (5.0 x 10⁵) cells were resuspended in matrigel (20μl) and inoculated under left renal capsule. For experimental metastasis assay, luciferase labelled (2.0 x 10⁵) cells were resuspended in PBS (100μl) and intracardially injected into the right ventricle of mice. Tumors were detected by non-invasive bioluminescence imaging of experimental animals using an AMI-HTX (Spectral Instruments Imaging). Bioluminescence images were quantified using ROI tool in Aura software.
Lat-M cell isolation
769-P cells transduced with luciferase and hygromycin selection marker were injected orthotopically into athymic Foxn1nu mice to isolate disseminated latent metastatic (Lat-M) cells. Briefly, mice were anesthetized (100 μl of ketamine (25mg/ml) and xylazine mixture (2.5mg/ml)), and 1.5cm incision was made below the rib and 1cm from spine. 769-P ccRCC tumor cells ( 5x10⁵) suspended in matrigel (20ul) were injected into kidney capsule under sterile conditions. Primary and metastatic tumor growth was tracked weekly by bioluminescent imaging (BLI) using AMI-HTX (Spectral Imaging). Bioluminescence was measured using ROT tool in Aura software. After 4-5weeks, primary tumors were surgically removed, and mice were tracked for 3 months. No overt metastasis was observed by BLI signal. Lungs from mice with no BLI signal were harvested and dissociated into single cell suspension and plated for Lat-M cell isolation as previously described (26,32). Luciferase positive Lat-M cells were selected using hygromycin (200μg/ml).
In vitro studies
769-P cells were obtained from ATCC and validated for mycoplasma-free using Universal Mycoplasma Detection Kit (ATCC). Cells were cultured in RPM-1640 with penicillin/streptomycin, L-glutamine and 10% fetal bovine serum (FBS) at 37 degree in a humidified atmosphere with 5% CO2, 2D proliferation rate was measured using Incucyte every 4 hours for 48 hours and quantified using Incucyte software (Satorius). For 3D cell culture, matrigel (corning) and collagen gel were used. To make 1ml of collagen gel, 867μl of collagen, 100μl of 10X RPMI, 32μl of 1N Sodium hydroxide were mixed on the ice. 300μl of matrigel or collagen gel were added to an well of 24 well plates and maintained in 37 degree for 30 min to solidify the gels. 2,000 cells were seeded on the top of matrigel with cell culture media and imaged daily. Anchorage independent culture was performed using ultra low attachment plate (corning) and cell survival was measured by CountessTM 3 Automated Cell Counter (Invitrogen) after 0.4% trypan blue staining.
Cell competition assay
PA and Lat-M cells were infected with lentiviral particles expressing GFP and RFP, respectively for 24h. PA (106 cells) and Lat-M (106 cells) were seeded together in 6-well plates and imaged every other day. For competition assays with Lat-M Ctrl and SPARC knockdown cells were fixed on days 0, 2, 4 and 6 and stained with anti-SPARC antibody (R and D Systems Cat# AF941, RRID:AB_355728). Demethylation agent Decitabine (2.5 or 5μM), H3K27me3 inhibitor Dznep (2.5 μM) or DDR1 inhibitor 7rh (1μM) were added to media immediately after seeding cells. Live imaging was performed using Nikon CSU-W1 Spinning Disk Confocal.
Western blot
Cultured cell lines were washed with ice-cold phosphate buffered saline (PBS) and PBS were completely aspirated. 300μl RIPA buffer with cOmplete™ Mini Protease Inhibitor Cocktail (Roche) and PhosSTOP (Roche) was added to each 10cm cell culture plate. Cells were scraped and transferred into a 1.5ml eppendorf tube and incubated on ice for 10 minutes. The lysates were centrifuged for 5 minutes at 13,000rpm and supernatants were collected and protein concentration was measured using Pierce™ BCA Protein Assay Kit (Thermo). 10μg of protein was loaded on SDA-PAGE gel with 100V for 1.5 hour and transferred to nitrocellulose membrane. The membranes were blocked for 1hour with 5% non-fat milk TBST and incubated with dilutions of primary antibodies overnight and washed. Primary antibodies for SPARC (R and D Systems Cat# AF941, RRID:AB_355728, 1:1000), Collagen (Abcam Cat# ab34710, RRID:AB_731684, 1:1000), Laminin (Novus Cat# NB300-144, RRID:AB_10001146, 1:1000), Fibronectin (BD Biosciences Cat# 610077, RRID:AB_2105706, 1:500), Osteopontin (Abcam Cat# ab8448, RRID:AB_306566, 1:500), Vitronectin/S-protein (Abcam Cat# ab13413, RRID:AB_2216293, 1:500), DDR1 (Cell Signaling Technology Cat# 5583, RRID:AB_10694842, 1:1000), p-DDR1 Tyr792 (Cell Signaling Technology Cat# 11994, RRID:AB_2797793, 1:1000), p-DDR1 Tyr513 (Cell Signaling Technology Cat# 14513, 1:1000), PYK2 (Cell Signaling Technology Cat# 3292, RRID:AB_2174097, 1:1000), p-PYK2 (Cell Signaling Technology Cat# 3291, RRID:AB_2300530, 1:1000), AKT (Cell Signaling Technology Cat# 4691, RRID:AB_915783, 1:1000), p-AKT Thr308 (Cell Signaling Technology Cat# 13038, RRID:AB_2629447, 1:1000), p-AKT (Cell Signaling Technology Cat# 4060, RRID:AB_2315049, 1:1000), and Beta Actin (Abcam Cat# ab49900, RRID:AB_867494, 1:15000) were used. After secondary antibody incubation, the membranes were developed using chemiluminescence method. Goat anti-mouse IgG HRP conjugate (Millipore Cat# AP308P, RRID:AB_92635, 1:5000), Goat anti-rabbit IgG HRP conjugate (Millipore Cat# AP307P, RRID:AB_11212848, 1:5000), and Donkey Anti-goat IgG HRP conjuage (Millipore Cat# AP180P, RRID:AB_92573, 1:5000) were used as secondary antibody.
Immunofluorescence staining
Isolated kidney and lung tissues were fixed with 4 % paraformaldehyde for 12hour at 4 degree, washed in PBS twice for 10min each and dehydrated in 20% sucrose for 3days. Tissues were frozen in optimal cutting temperature compound at −20 degree. Using cryostat, 20μm sections stored in section storage buffer (30% glycerol, 30% ethylene glycol, and 40% PBS). Sections were permeabilized in PBST (PBS with 0.05% of Triton X) for 1 hour at room temperatures and blocked another 1 hour in 10 % goat or horse serum in PBST. Sections were incubated with primary antibodies overnight, washed 3 times with PBST (5 min each) and incubated with secondary antibodies for 2-4 hours in the dark. After 3 washes, were stained with Hoechst (1:000) for 5 min and mounted with prolong gold. Cultured cells were fixed with 4 % paraformaldehyde for 10 minute at 4 degree and washed PBS three times before staining. Fixed cells were permeabilized in PBST (PBS with 0.05% of Triton X) for 10 minutes at room temperatures and blocked 1 hour in 1% bovine serum albumin in PBST. Cells were incubated with primary antibodies overnight, washed 3times with PBST (5 min each) and incubated with secondary antibodies for 2-4 hours in the dark. After 3 washes, were stained with Hoechst (1:000) for 5 min and mounted with prolong gold. Primary antibodies for Collagen (Abcam Cat# ab34710, RRID:AB_731684, 1:200), Beta Actin (Abcam, Cat# ab49900, 1:500), SPARC (R and D Systems Cat# AF941, RRID:AB_355728, 1:100), RFP (ThermoFisher, Cat# R10367, 1:200), Luciferase (Abcam, Cat# Ab21176, 1:250), GFP (Aves, Cat# GFP-1020, 1:500), Phalloidin (Abcam, Cat# ab176759), and ZO-1 (Innovative Research Cat# 61-7300, RRID:AB_138452, 1:100) were used. Goat anti-rabbit IgG Alexa Fluor™ plus 488 (Thermo Fisher Scientific Cat# A32731, RRID:AB_2633280, 1:1000), Goat anti-chicken IgG Alexa Fluor™ plus 488 (Thermo Fisher Scientific Cat# A32931, RRID:AB_2762843, 1:1000) Donkey anti-goat IgG Alexa Fluor™ plus 488 (Thermo Fisher Scientific Cat# A32814, RRID:AB_2762838, 1:1000) Goat anti-rabbit IgG Alex Fluor™ plus 555 (Thermo Fisher Scientific Cat# A32732, RRID:AB_2633281, 1:1000), Donkey anti-goat IgG Alexa Fluor™ plus 555 (Thermo Fisher Scientific Cat# A32816, RRID:AB_2762839, 1:1000) and Donkey anti-goat IgG Alexa Fluor™ plus 647 (Thermo Fisher Scientific Cat# A32849, RRID:AB_2762840, 1:1000) were used as secondary antibodies.
RNA extraction and quantitative RT-PCR
Total RNA was extracted using RNeasy Kit (Qiagen). 1 μg of RNA was subjected to reverse transcription using Bio-Rad iScript reagents. To determine relative mRNA expression quantitative RT-PCR was performed using SYBR green Supermix Bio-Rad. All mRNA quantification data were normalized to β-actin. Primers used for q-PCR are listed in Supplementary Table. S2.
RNA sequencing
Quality of RNA was checked with an Agilent BioAnalyzer 2000. RNA with an integrity number of greater than 9.5 were used for subsequent analyses. Libraries were prepared with either TruSeq RNA Sample Prep Kit v2 (Illumina) or Next Ultra RNA Library Prep Kit (New England Biolabs). Generated libraries were run on a HiSeq2500 system and 25-50 million raw reads were collected per sample. Raw reads were quality-checked and subsequently mapped to the human genome (hg19) using Tophat2 (2.2.4) using default settings (2). Differential expression analysis was performed using edgeR and nominal p-values and Log2 fold changes were used for volcano plot. RNA-sequencing results for P1 and P2 were obtained from European Genome-phenome Archieve (EGA) under accession number EGAS00001005512. Read per kilobase million (RPKM) values were determined from read count of genes. whole genes were used for principal component analyses using Clustvis web tool. ECM related genes in “collagen catabolic process” and “extracellular matrix organization” were plotted for Fig. 4B. Sequencing and clinical information of 534 ccRCC patient tumors from Firehose legacy TCGA dataset used for further analysis. Using differentially expressed genes in P1-T1 and P2-T1 compared to P1-T2/3/4 and P2-T2/3/4, 534 ccRCC tumors were separated into 2 groups by KMeans clustering with one minus pearson correlation and cleared marked by heat map as Lat-Mhigh and Lat-Mlow using Morpheus software. Patients were categorized based on Lat-M gene expression (high or low), metastasis (M0 or M1), lymph node invasion (N0 or N1) and clinical parameters were analyzed.
Gene Set Enrichment Analysis (GSEA)
Ranked Gene Set Enrichment Analysis (GSEA) was performed with software version 4.1.0. Default settings were used except for “No Collapse” and “Phenotype” permutation type to “Gene_set”. Defined lists from the Broad Institute were used: h.all.v.8.0.symbol.gmt [Hallmarks], c2.all.v.8.0.symbol.gmt [Curated], c3. all.v.8.0.symbol.gmt [motif], and c5.all.v.8.0.symbol.gmt [Gene Ontology]. Statistical criteria are described in results and Fig. legends.
Whole Global Bisulfite Sequencing (WGBS)
DNA samples were collected using PurelinkTM Genomic DNA mini kit (Invitrogen). DNA quality was examined by agarose gel electrophoresis analysis for DNA degradation and RNA contamination and Qubit for accurate quantification of DNA. After DNA sample quality test, lambda DNA (negative control) was added, and DNA samples were fragmented into 200-400bp using Covaris S220. The DNA fragments were repaired, dA-tailed to sequencing adaptors that all cytosines were methylated. After that, The DNA fragments were bisulfite treated with EZ DNA Methylation Gold Kit (Zymo Research). After treatment, cytosines without methylation changed into U, whereas cytosines with methylation remain unchanged. The final DNA library was obtained by size selection and PCR amplification. Quality of library was measured with Qubit 2.0 and sequencing was performed using Hiseq platform.
Supplementary Material
Acknowledgments
We are grateful to the patients whose information and samples were vital for this study. Illustrations created with BioRender.com. This work was supported by grants from the CPRIT RP210041 (PKP), NSF grant 2019281049 (MMP), CPRIT RR170003 (SM), KCP SPORE DRP P50CA196516 (SM), ACS RSG-20-47-01-CSM (SM), KCRP-DOD KC200273 (SM), and NIH/NCI R01CA258629 (SM). Cancer Center Support P30 CA142543, CPRIT RP180770 (preclinical radiation core facility), NIH/NCI Research Project R01CA258629 (SM). We gratefully acknowledge Small Animal Imaging and Tissue Management Cores supported by Cancer Center Support P30 CA142543 and the assistance of Preclinical Radiation Core Facility which is supported by the Cancer Prevention and Research Institute of Texas (CPRIT; RP180770) for all imaging services.
Footnotes
Data and materials availability
RNA-sequencing and WGBS data are deposited in GSE212175 and GSE212176. Patient P1 and P2 RNA sequencing were obtained from EGAS00001005512. RNA sequencing and clinical information from ccRCC patients were obtained from TCGA ccRCC database (Firehose Legacy). All other data are available in the main text or the supplementary materials.
Disclosure: The authors have no competing interest to declare for this work.
References
- 1.Di Gregorio A, Bowling S, Rodriguez TA. Cell Competition and Its Role in the Regulation of Cell Fitness from Development to Cancer. Dev Cell 2016;38:621–34 [DOI] [PubMed] [Google Scholar]
- 2.Parker TM, Gupta K, Palma AM, Yekelchyk M, Fisher PB, Grossman SR, et al. Cell competition in intratumoral and tumor microenvironment interactions. EMBO J 2021;40:e107271. [DOI] [PMC free article] [PubMed] [Google Scholar]
- 3.Pelham CJ, Nagane M, Madan E. Cell competition in tumor evolution and heterogeneity: Merging past and present. Semin Cancer Biol 2020;63:11–8 [DOI] [PubMed] [Google Scholar]
- 4.Johnston LA. Competitive interactions between cells: death, growth, and geography. Science 2009;324:1679–82 [DOI] [PMC free article] [PubMed] [Google Scholar]
- 5.Murai K, Skrupskelyte G, Piedrafita G, Hall M, Kostiou V, Ong SH, et al. Epidermal Tissue Adapts to Restrain Progenitors Carrying Clonal p53 Mutations. Cell Stem Cell 2018;23:687–99 e8 [DOI] [PMC free article] [PubMed] [Google Scholar]
- 6.Ellis SJ, Gomez NC, Levorse J, Mertz AF, Ge Y, Fuchs E. Distinct modes of cell competition shape mammalian tissue morphogenesis. Nature 2019;569:497–502 [DOI] [PMC free article] [PubMed] [Google Scholar]
- 7.Sanaki Y, Nagata R, Kizawa D, Leopold P, Igaki T. Hyperinsulinemia Drives Epithelial Tumorigenesis by Abrogating Cell Competition. Dev Cell 2020;53:379–89 e5 [DOI] [PubMed] [Google Scholar]
- 8.Chang CH, Qiu J, O'Sullivan D, Buck MD, Noguchi T, Curtis JD, et al. Metabolic Competition in the Tumor Microenvironment Is a Driver of Cancer Progression. Cell 2015;162:1229–41 [DOI] [PMC free article] [PubMed] [Google Scholar]
- 9.Madan E, Pelham CJ, Nagane M, Parker TM, Canas-Marques R, Fazio K, et al. Flower isoforms promote competitive growth in cancer. Nature 2019;572:260–4 [DOI] [PubMed] [Google Scholar]
- 10.Martins VC, Busch K, Juraeva D, Blum C, Ludwig C, Rasche V, et al. Cell competition is a tumour suppressor mechanism in the thymus. Nature 2014;509:465–70 [DOI] [PubMed] [Google Scholar]
- 11.Ramos CV, Martins VC. Cell competition in hematopoietic cells: Quality control in homeostasis and its role in leukemia. Dev Biol 2021;475:1–9 [DOI] [PubMed] [Google Scholar]
- 12.Morata G Cell competition: A historical perspective. Dev Biol 2021; 476:33–40 [DOI] [PubMed] [Google Scholar]
- 13.Parker TM, Henriques V, Beltran A, Nakshatri H, Gogna R. Cell competition and tumor heterogeneity. Semin Cancer Biol 2020;63:1–10 [DOI] [PubMed] [Google Scholar]
- 14.Madan E, Peixoto ML, Dimitrion P, Eubank TD, Yekelchyk M, Talukdar S, et al. Cell Competition Boosts Clonal Evolution and Hypoxic Selection in Cancer. Trends Cell Biol 2020;30:967–78 [DOI] [PubMed] [Google Scholar]
- 15.Gogna R, Moreno E. Emerging Role of Cell Competition in Cancer. Semin Cancer Biol 2020;63:iii–iv [DOI] [PubMed] [Google Scholar]
- 16.Bowling S, Lawlor K, Rodriguez TA. Cell competition: the winners and losers of fitness selection. Development 2019;146 [DOI] [PubMed] [Google Scholar]
- 17.Levayer R, Moreno E. Mechanisms of cell competition: themes and variations. J Cell Biol 2013;200:689–98 [DOI] [PMC free article] [PubMed] [Google Scholar]
- 18.Moreno E Is cell competition relevant to cancer? Nat Rev Cancer 2008;8:141–7 [DOI] [PubMed] [Google Scholar]
- 19.Baker NE. Emerging mechanisms of cell competition. Nat Rev Genet 2020;21:683–97 [DOI] [PMC free article] [PubMed] [Google Scholar]
- 20.Morata G Cell competition: A historical perspective. Dev Biol 2021;476:33–40 [DOI] [PubMed] [Google Scholar]
- 21.Lambert AW, Pattabiraman DR, Weinberg RA. Emerging Biological Principles of Metastasis. Cell 2017;168:670–91 [DOI] [PMC free article] [PubMed] [Google Scholar]
- 22.Massague J, Obenauf AC. Metastatic colonization by circulating tumour cells. Nature 2016;529:298–306 [DOI] [PMC free article] [PubMed] [Google Scholar]
- 23.Wagstaff L, Goschorska M, Kozyrska K, Duclos G, Kucinski I, Chessel A, et al. Mechanical cell competition kills cells via induction of lethal p53 levels. Nat Commun 2016;7:11373. [DOI] [PMC free article] [PubMed] [Google Scholar]
- 24.Rosenblatt J, Raff MC, Cramer LP. An epithelial cell destined for apoptosis signals its neighbors to extrude it by an actin- and myosin-dependent mechanism. Curr Biol 2001;11:1847–57 [DOI] [PubMed] [Google Scholar]
- 25.Kim K, Marquez-Palencia M, Malladi S. Metastatic Latency, a Veiled Threat. Front Immunol 2019;10:1836. [DOI] [PMC free article] [PubMed] [Google Scholar]
- 26.Malladi S, Macalinao DG, Jin X, He L, Basnet H, Zou Y, et al. Metastatic Latency and Immune Evasion through Autocrine Inhibition of WNT. Cell 2016;165:45–60 [DOI] [PMC free article] [PubMed] [Google Scholar]
- 27.Risson E, Nobre AR, Maguer-Satta V, Aguirre-Ghiso JA. The current paradigm and challenges ahead for the dormancy of disseminated tumor cells. Nat Cancer 2020;1:672–80 [DOI] [PMC free article] [PubMed] [Google Scholar]
- 28.Aguirre-Ghiso JA. Models, mechanisms and clinical evidence for cancer dormancy. Nat Rev Cancer 2007;7:834–46 [DOI] [PMC free article] [PubMed] [Google Scholar]
- 29.Hanahan D Hallmarks of Cancer: New Dimensions. Cancer Discov 2022;12:31–46 [DOI] [PubMed] [Google Scholar]
- 30.Massague J, Ganesh K. Metastasis-Initiating Cells and Ecosystems. Cancer Discov 2021;11:971–94 [DOI] [PMC free article] [PubMed] [Google Scholar]
- 31.Hanahan D, Coussens LM. Accessories to the crime: functions of cells recruited to the tumor microenvironment. Cancer Cell 2012;21:309–22 [DOI] [PubMed] [Google Scholar]
- 32.Parida PK, Marquez-Palencia M, Nair V, Kaushik AK, Kim K, Sudderth J, et al. Metabolic diversity within breast cancer brain-tropic cells determines metastatic fitness. Cell Metab 2022;34:90–105 e7 [DOI] [PMC free article] [PubMed] [Google Scholar]
- 33.Abu-Ghanem Y, Powles T, Capitanio U, Beisland C, Jarvinen P, Stewart GD, et al. The Impact of Histological Subtype on the Incidence, Timing, and Patterns of Recurrence in Patients with Renal Cell Carcinoma After Surgery-Results from RECUR Consortium. Eur Urol Oncol 2020;4:473–482 [DOI] [PubMed] [Google Scholar]
- 34.Rini BI, Campbell SC, Escudier B. Renal cell carcinoma. Lancet 2009;373:1119–32 [DOI] [PubMed] [Google Scholar]
- 35.Turajlic S, Xu H, Litchfield K, Rowan A, Horswell S, Chambers T, et al. Deterministic Evolutionary Trajectories Influence Primary Tumor Growth: TRACERx Renal. Cell 2018;173:595–610 e11 [DOI] [PMC free article] [PubMed] [Google Scholar]
- 36.Gerlinger M, Rowan AJ, Horswell S, Math M, Larkin J, Endesfelder D, et al. Intratumor heterogeneity and branched evolution revealed by multiregion sequencing. N Engl J Med 2012;366:883–92 [DOI] [PMC free article] [PubMed] [Google Scholar]
- 37.Verine J, Colin D, Nheb M, Prapotnich D, Ploussard G, Cathelineau X, et al. Architectural Patterns are a Relevant Morphologic Grading System for Clear Cell Renal Cell Carcinoma Prognosis Assessment: Comparisons With WHO/ISUP Grade and Integrated Staging Systems. Am J Surg Pathol 2018;42:423–41 [DOI] [PubMed] [Google Scholar]
- 38.van Neerven SM, de Groot NE, Nijman LE, Scicluna BP, van Driel MS, Lecca MC, et al. Apc-mutant cells act as supercompetitors in intestinal tumour initiation. Nature 2021;594:436–41 [DOI] [PubMed] [Google Scholar]
- 39.Frisch SM, Screaton RA. Anoikis mechanisms. Curr Opin Cell Biol 2001;13:555–62 [DOI] [PubMed] [Google Scholar]
- 40.Hanahan D, Weinberg RA. Hallmarks of cancer: the next generation. Cell 2011;144:646–74 [DOI] [PubMed] [Google Scholar]
- 41.Christman JK. 5-Azacytidine and 5-aza-2'-deoxycytidine as inhibitors of DNA methylation: mechanistic studies and their implications for cancer therapy. Oncogene 2002;21:5483–95 [DOI] [PubMed] [Google Scholar]
- 42.Miranda TB, Cortez CC, Yoo CB, Liang G, Abe M, Kelly TK, et al. DZNep is a global histone methylation inhibitor that reactivates developmental genes not silenced by DNA methylation. Mol Cancer Ther 2009;8:1579–88 [DOI] [PMC free article] [PubMed] [Google Scholar]
- 43.Mitchell TJ, Turajlic S, Rowan A, Nicol D, Farmery JHR, O'Brien T, et al. Timing the Landmark Events in the Evolution of Clear Cell Renal Cell Cancer: TRACERx Renal. Cell 2018;173:611–23 e17 [DOI] [PMC free article] [PubMed] [Google Scholar]
- 44.Cancer Genome Atlas Research N. Comprehensive molecular characterization of clear cell renal cell carcinoma. Nature 2013;499:43–9 [DOI] [PMC free article] [PubMed] [Google Scholar]
- 45.Clark DJ, Dhanasekaran SM, Petralia F, Pan J, Song X, Hu Y, et al. Integrated Proteogenomic Characterization of Clear Cell Renal Cell Carcinoma. Cell 2019;179:964–83 e31 [DOI] [PMC free article] [PubMed] [Google Scholar]
- 46.Kaiser MF, Johnson DC, Wu P, Walker BA, Brioli A, Mirabella F, et al. Global methylation analysis identifies prognostically important epigenetically inactivated tumor suppressor genes in multiple myeloma. Blood 2013;122:219–26 [DOI] [PMC free article] [PubMed] [Google Scholar]
- 47.Clark CJ, Sage EH. A prototypic matricellular protein in the tumor microenvironment--where there's SPARC, there's fire. J Cell Biochem 2008;104:721–32 [DOI] [PubMed] [Google Scholar]
- 48.Arnold SA, Brekken RA. SPARC: a matricellular regulator of tumorigenesis. J Cell Commun Signal 2009;3:255–73 [DOI] [PMC free article] [PubMed] [Google Scholar]
- 49.Ting DT, Wittner BS, Ligorio M, Vincent Jordan N, Shah AM, Miyamoto DT, et al. Single-cell RNA sequencing identifies extracellular matrix gene expression by pancreatic circulating tumor cells. Cell Rep 2014;8:1905–18 [DOI] [PMC free article] [PubMed] [Google Scholar]
- 50.Portela M, Casas-Tinto S, Rhiner C, Lopez-Gay JM, Dominguez O, Soldini D, et al. Drosophila SPARC is a self-protective signal expressed by loser cells during cell competition. Dev Cell 2010;19:562–73 [DOI] [PubMed] [Google Scholar]
- 51.Petrova E, Soldini D, Moreno E. The expression of SPARC in human tumors is consistent with its role during cell competition. Commun Integr Biol 2011;4:171–4 [DOI] [PMC free article] [PubMed] [Google Scholar]
- 52.Aguilera KY, Rivera LB, Hur H, Carbon JG, Toombs JE, Goldstein CD, et al. Collagen signaling enhances tumor progression after anti-VEGF therapy in a murine model of pancreatic ductal adenocarcinoma. Cancer Res 2014;74:1032–44 [DOI] [PMC free article] [PubMed] [Google Scholar]
- 53.Hohenester E, Sasaki T, Giudici C, Farndale RW, Bachinger HP. Structural basis of sequence-specific collagen recognition by SPARC. Proc Natl Acad Sci U S A 2008;105:18273–7 [DOI] [PMC free article] [PubMed] [Google Scholar]
- 54.Carafoli F, Bihan D, Stathopoulos S, Konitsiotis AD, Kvansakul M, Farndale RW, et al. Crystallographic insight into collagen recognition by discoidin domain receptor 2. Structure 2009;17:1573–81 [DOI] [PMC free article] [PubMed] [Google Scholar]
- 55.Xu S, Xu H, Wang W, Li S, Li H, Li T, et al. The role of collagen in cancer: from bench to bedside. J Transl Med 2019;17:309. [DOI] [PMC free article] [PubMed] [Google Scholar]
- 56.Leitinger B Transmembrane collagen receptors. Annu Rev Cell Dev Biol 2011;27:265–90 [DOI] [PubMed] [Google Scholar]
- 57.Bradshaw AD. The role of SPARC in extracellular matrix assembly. J Cell Commun Signal 2009;3:239–46 [DOI] [PMC free article] [PubMed] [Google Scholar]
- 58.Gao M, Duan L, Luo J, Zhang L, Lu X, Zhang Y, et al. Discovery and optimization of 3-(2-(Pyrazolo[1,5-a]pyrimidin-6-yl)ethynyl)benzamides as novel selective and orally bioavailable discoidin domain receptor 1 (DDR1) inhibitors. J Med Chem 2013;56:3281–95 [DOI] [PubMed] [Google Scholar]
- 59.Kim K, Zhou Q, Christie A, Stevens C, Ma Y, Onabolu O, et al. Determinants of renal cell carcinoma invasion and metastatic competence. Nat Commun 2021;12:5760. [DOI] [PMC free article] [PubMed] [Google Scholar]
- 60.Braun DA, Hou Y, Bakouny Z, Ficial M, Sant' Angelo M, Forman J, et al. Interplay of somatic alterations and immune infiltration modulates response to PD-1 blockade in advanced clear cell renal cell carcinoma. Nat Med 2020;26:909–18 [DOI] [PMC free article] [PubMed] [Google Scholar]
- 61.Marusyk A, Tabassum DP, Altrock PM, Almendro V, Michor F, Polyak K. Non-cell-autonomous driving of tumour growth supports sub-clonal heterogeneity. Nature 2014;514:54–8 [DOI] [PMC free article] [PubMed] [Google Scholar]
- 62.Casasent AK, Schalck A, Gao R, Sei E, Long A, Pangburn W, et al. Multiclonal Invasion in Breast Tumors Identified by Topographic Single Cell Sequencing. Cell 2018;172:205–17 e12 [DOI] [PMC free article] [PubMed] [Google Scholar]
- 63.Turajlic S, Xu H, Litchfield K, Rowan A, Chambers T, Lopez JI, et al. Tracking Cancer Evolution Reveals Constrained Routes to Metastases: TRACERx Renal. Cell 2018;173:581–94 e12 [DOI] [PMC free article] [PubMed] [Google Scholar]
- 64.Chong HC, Tan CK, Huang RL, Tan NS. Matricellular proteins: a sticky affair with cancers. J Oncol 2012;2012:351089. [DOI] [PMC free article] [PubMed] [Google Scholar]
- 65.Nagaraju GP, Dontula R, El-Rayes BF, Lakka SS. Molecular mechanisms underlying the divergent roles of SPARC in human carcinogenesis. Carcinogenesis 2014;35:967–73 [DOI] [PubMed] [Google Scholar]
- 66.Bozic I, Allen B, Nowak MA. Dynamics of targeted cancer therapy. Trends Mol Med 2012;18:311–6 [DOI] [PMC free article] [PubMed] [Google Scholar]
- 67.Bozic I, Reiter JG, Allen B, Antal T, Chatterjee K, Shah P, et al. Evolutionary dynamics of cancer in response to targeted combination therapy. Elife 2013;2:e00747. [DOI] [PMC free article] [PubMed] [Google Scholar]
- 68.Krzywinski M, Schein J, Birol I, Connors J, Gascoyne R, Horsman D, et al. Circos: an information aesthetic for comparative genomics. Genome Res 2009;19:1639–45 [DOI] [PMC free article] [PubMed] [Google Scholar]
Associated Data
This section collects any data citations, data availability statements, or supplementary materials included in this article.