

Abstract
Inorganic pyrophosphate (PPi) is a crucial extracellular mineralization regulator. Low plasma PPi concentrations underlie the soft tissue calcification present in several rare hereditary mineralization disorders as well as in more common conditions like chronic kidney disease and diabetes. Even though deregulated plasma PPi homeostasis is known to be linked to multiple human diseases, there is currently no reliable assay for its quantification. We here describe a PPi assay that employs the enzyme ATP sulfurylase to convert PPi into ATP. Generated ATP is subsequently quantified by firefly luciferase-based bioluminescence. An internal ATP standard was used to correct for sample-specific interference by matrix compounds on firefly luciferase activity. The assay was validated and shows excellent precision (<3.5%) and accuracy (93-106%) of PPi spiked into human plasma samples. We found that of several anticoagulants tested only EDTA effectively blocked conversion of ATP into PPi in plasma after blood collection. Moreover, filtration over a 300,000 Da molecular weight cut-off membrane, reduced variability of plasma PPi and removed ATP present in a membrane-enclosed compartment, possibly platelets. Applied to plasma samples of wild type and Abcc6−/− rats, an animal model with established low circulating levels of PPi, the new assay showed lower variability than the assay that was previously in routine use in our laboratory. In conclusion, we here report a new and robust assay to determine PPi concentrations in plasma, which outperforms currently available assays because of its high sensitivity, precision, and accuracy.
Keywords: Pyrophosphate, ectopic mineralization, ATP-sulfurylase, plasma, vascular calcification, mineralization inhibitor
Graphical Abstract

Introduction
Extracellular inorganic pyrophosphate (PPi) is a key regulator of mineralization [1]. Disturbances in extracellular PPi homeostasis underlie several ectopic calcification disorders [2]. A complex system of proteins mediating cellular ATP efflux and ecto-nucleotidases together regulate PPi homeostasis in the extracellular environment, including blood plasma [2,3]. All PPi detected in plasma is derived from ATP released from cells into the extracellular environment [4]. Mechanisms involving the plasma membrane proteins hepatic ATP-binding cassette subfamily C member 6 (ABCC6) and the more ubiquitous Ankylosis homologue (ANKH) account for over 80% of all PPi in plasma [5–8]. ATP released into the extracellular environment is rapidly converted by ecto-nucleoside pyrophosphatase/phosphodiesterase 1 (ENPP1) into adenosine monophosphate (AMP) and PPi [4, 6–8]. Tissue Non-specific Alkaline Phosphatase (TNAP) is the major enzyme involved in degradation of PPi to inorganic phosphate (Pi)[9]. An additional layer of regulation is provided by CD73, which converts AMP into adenosine and Pi. Adenosine inhibits expression of TNAP-encoding ALPL. Absence of CD73 activity therefore reduces local formation of adenosine, increases TNAP activity and, consequently, results in low PPi plasma levels[10, 11].
Mutations in each of the genes participating in plasma PPi homeostasis have been linked to specific mineralization disorders, as detailed in a recent review from our group[2]. Low plasma PPi levels not only underlie the ectopic calcification seen in rare genetic ectopic mineralization disorders, but also in more common conditions like diabetes and chronic kidney disease[12]. Importantly, arterial calcification is prevalent and an independent risk factor of early death in patients suffering from cardiovascular disease[13, 14].
Despite its crucial role in the prevention of calcification of soft connective tissues and arteries, no assay is currently available to reliably quantify PPi in plasma and other tissues. As a result, vastly different values for normal plasma PPi concentrations in both animal models and humans have been reported [5, 6, 12, 15–21]. In addition, several of the currently available assays to detect PPi are cumbersome, time consuming, involve the use of radionuclides or do not allow analysis of complex biological matrices like plasma [12,22–32].
We here describe the validation of a sensitive bioluminescence-based assay for the reliable quantification of PPi in plasma, in as little as 5 minutes. This novel assay is highly sensitive, consumes only limited sample, provides reproducible results, and is very robust.
Materials and Methods
Animals and preparation of rat plasma
The Abcc6−/− (Strain A17) and wild type Sprague Dawley rats were bred in house and received water and food ad libitum[33]. Animals were 8-19 months old at the time of blood sampling. Blood was collected by cardiac puncture using a Vacutainer blood collection needle (product # 368607, BD) in CTAD tubes (product # 367947, BD), containing citrate, theophylline, adenosine and dipyridamole[6]. Directly following blood collection (~4 ml), 50 μL of a 15% K3EDTA (w/v, product # :11991, Alfa Aesar) solution was added. Plasma was prepared by centrifugation (10 min, 4 °C). Collected plasma was filtered over a membrane with a molecular weight cutoff (mwco) of 300,000 Da using Centrisart I devices (Sartorius) as previously described6, and stored at −20 °C until analysis.
Animal studies were approved by the Institutional Animal Care and Use Committee of Thomas Jefferson University in accordance with the National Institutes of Health Guide for Care and Use of Laboratory Animals under approval number 02135-1.
Preparation of human plasma
To determine the effect of anticoagulant on plasma PPi concentrations, blood of 3 volunteers, recruited from laboratory staff, was collected in CTAD (product # 367947), EDTA (product # 367841, BD) and heparin (product # 366664, BD) tubes by puncture of the antecubital vein with a Vacutainer Blood Collection Set (product # 367287). In addition, the effect of a combination of CTAD and EDTA was studied by collecting blood in CTAD tubes (~4 ml) and adding 50 μL of a 15% K3EDTA solution directly following collection. Plasma was prepared after centrifugation for 10 min at 1000 RCF at 4 °C. To assess the effect of filtration on plasma PPi concentrations, part of the plasma was filtered using Centrisart I filtration devices (Sartorius, mwco 300,000 Da) at 2250 RCF for 20 minutes at 4 °C, as done previously[6]. After collection, plasma was stored at −20 °C till analysis. The Institutional Review Board of Genetic alliance gave ethical approval for the studies involving blood collection of human participants (Protocol number JKVDW001).
Quantification of ATP
A commercially available glow-type luciferase/luciferin mix (SL-reagent, product number 11-501, Biothema, Sweden), which generates long-lasting light signals, was used to quantify ATP concentrations in plasma. The content of one vial (Prod. No. 11-501-TP) was dissolved in 10 mL of ultrapure water. For each analysis, 100 μL of the dissolved SL reagent and 400 μL TE buffer (2 mM EDTA, 10 mM Tris, pH 7.75, Biothema, Sweden) were mixed in a 3.5 mL round polypropylene cuvette (product # 68.752, Sarstedt, Germany) and introduced into a FB12 tube luminometer (Berthold, Germany).
The ATP concentration was determined by adding 5 μL sample to 500 μL SL-reagent/TE buffer mixture, resulting in an increase in luminescence. Next, 5 μL of a 10 μM ATP standard (Biothema, Sweden) was added to the cuvette and again the increase in luminescence was determined. The ratio of the increase in luminescence (Relative Light Unit, RLU) after sample and standard addition was used to calculate the ATP concentration. All measurements used to quantify ATP were within the linear range of the Berthold FB12 luminometer (< 2,500,000 RLU). When the addition of 5 μL of the 10 μM ATP standard resulted in RLU values > 2,500,000 RLU, the assay was repeated using SL reagent that was further diluted with TE buffer until an RLU value below 3,000,000 was obtained.
Determination of the combined ATP and PPi concentration
Adenosine 5’-phosphosulfate (APS) and PPi can be converted into ATP by the enzyme ATP sulfurylase. The ATP formed can subsequently be sensitively quantified using the enzyme firefly luciferase, which uses ATP and luciferin to generate a light signal. Of note, in a given sample the ATP formed out of PPi and APS adds to the ATP that was already present in the sample at the start of the reaction. Hence, the combined presence of ATP + PPi is quantified using this approach. The assay mixture to quantify ATP and PPi contained APS (6 μM, Santa Cruz Biotechnology, TX), ATP sulfurylase (ATPS, 150 mU/mL, New England Biolabs, Ma), apyrase (250 mU/mL, “ATP removal reagent”, Biothema, Sweden), and SL-reagent (130 μL/mL, Biothema, Sweden), and was incubated for 6 hours at room temperature to degrade contaminating ATP and PPi. The preincubation reduced the light output by the luciferase, but substantially reduced background and increased sensitivity. Of note, the SL-reagents used to quantify ATP-only does not need to be preincubated. This explains why a higher light output is seen in analyses in which only ATP is quantified (compare Figs 1A and 1B).
Figure 1. Concept of quantification of PPi using ATP sulfurylase (ATPS).
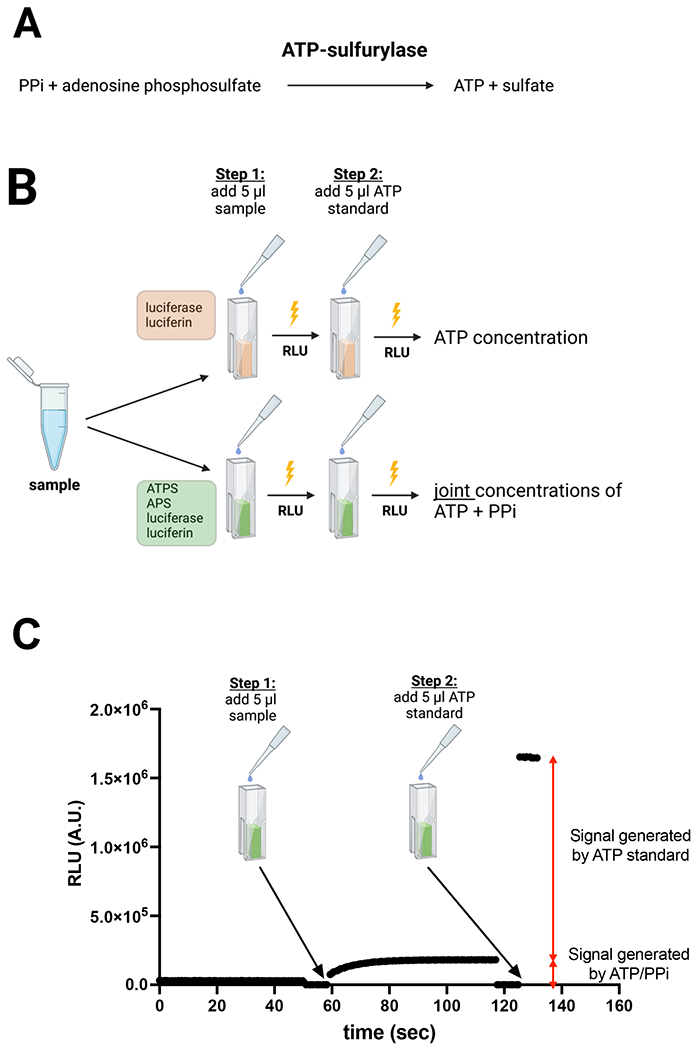
(A) enzymatic reaction used to convert PPi into ATP. (B) Schematic overview of the assay to quantify ATP and PPi in plasma. In cuvette 1, which contains a reaction mixture with luciferase and luciferin, the ATP concentration of the sample is determined. In cuvette 2, which contains a reaction mixture with ATPS, APS, luciferase and luciferin, the combined concentration of ATP and PPi is determined. The PPi concentration is subsequently calculated by subtracting the ATP concentration quantified in cuvette 1 from the combined ATP and PPi concentration quantified in cuvette 2. (C) Example of the assay showing how 5 μl of a 1 μM PPi standard (arrow) was quantitatively converted into ATP. After addition of the 10 μM ATP standard the PPi concentration is calculated from the ratio in increase of luminescence induced by addition of PPi and ATP, respectively. Luminescence is continuously followed in a luminometer. PPi and ATP were added after shortly opening the luminometer. Notably, to add sample as well as ATP standard the luminometer is opened, which automatically stops data acquisition. This explains the absence of signal in panel C at the time the sample or ATP standard is added. RLU: Relative Light Units. Panels B and C were created with BioRender.com.
Notably, the concentration of apyrase (“ATP degradation reagent”) was very low, hence overnight incubation was needed to remove background PPi and ATP from the reagents. Low apyrase concentration was chosen to not affect ATP detection in the samples. The assay mixture was subsequently stored at −20 °C until use.
For each analysis, 500 μL of the assay mixture was put into a 3.5 mL polypropylene cuvette (Sarstedt, Germany) and background luminescence was determined in a Sirius tube luminometer (Berthold, Germany). Next, five (5) μL of sample was added and all PPi in the sample was allowed to be converted into ATP by ATPS as continuously monitored in real time by the luminescent signal. When all PPi had been converted into ATP and the luminescent signal did not further increase (endpoint), 5 μL of a 10 μM ATP standard (Biothema, Sweden) was added and luminescence was monitored in the Berthold FB12 luminometer. The ratio between the increase in luminescence after the addition of the sample and the increase seen after the addition of the ATP standard was used to calculate the combined concentration of ATP and PPi. Finally, the PPi concentration in the sample was calculated by subtracting the ATP concentration from the combined ATP and PPi concentration.
Assay Validation
The precision of the assay was determined (CV%) with analytical PPi standards of 1.0 μM, 0.3 μM, 0.1 μM, 0.03 μM and 0.010 μM (BioThema, Sweden), all in water. Each PPi concentration standard was analysed 6 times (n=6). The accuracy of the assay was evaluated by determining the recovery of the PPi standard added to human plasma. For these analyses a 10 μM PPi standard solution was added to human filtered CTAD/EDTA plasma to increase the concentration by 1.0 μM. A 2.5 μM PPi standard solution was used to increase PPi concentrations in plasma by 0.1 μM. Each spiked plasma sample was analysed 3 times. Stability of PPi and ATP concentrations in plasma prepared from blood using different anticoagulants was determined at room temperature. PPi and ATP concentrations were quantified daily or every other day for up to 9 days. Interday variability was estimated from data obtained in the same experiment in filtered plasma prepared from blood in which CTAD, EDTA or CTAD/EDTA was used as anticoagulant. The performance of the new assay was compared with the assay used in our previous work [5, 6] in rat plasma, collected from wild type and Abcc6−/− animals[33].
Results
In the presence of APS, ATPS converts PPi into ATP (Fig. 1A). The latter can be sensitively quantified by bioluminescence using firefly luciferase. Figure 1B delineates the concept of the optimized ATPS-based assay to quantify PPi in biological samples. First, the concentration of ATP in the sample is quantified in a reaction mixture containing luciferase/luciferin. In a separate cuvette, the joint concentration of ATP and PPi is quantified in a reaction mixture that next to luciferase and luciferin also contains ATPS and APS. Figure 1C demonstrates how addition of 5 μl of a 1 μM PPi standard resulted in increased luminescence, which reached its maximum after 20-30 seconds, showing complete conversion into ATP. At this point the ATP standard was added, resulting in an immediate increase in luminescence. The PPi concentration was calculated from the increase seen by the addition of PPi relative to that caused by the addition of the ATP standard. Due to the glow-type bioluminescent reagent used in the assay, signals induced by the addition of PPi and ATP were very stable over time.
We first determined the linearity of the FB12 Sirius luminometer with ATP in concentrations ranging from 0.08-10 μM (Fig. 2A). Light detection by the FB12 Sirius luminometer was highly linear with a deviation of 1.8 ± 0.7 % and 9.0 ± 0.6 % at 2,500,000 and 5,000,000 relative light units (RLU), respectively. As expected, the assay showed good linearity for concentrations ranging from 0.08 to 10 μM ATP. Figure 2B shows that the assay also showed good linearity for PPi concentrations ranging from 0.08 to 10 μM, indicating that ATPS efficiently converted PPi and APS into ATP.
Figure 2. Linearity of luminescence induced by addition PPi and ATP and application to a human plasma sample.

Increasing concentrations of ATP (A) or PPi (B) were added to the reaction mixture, generating signals that were highly linear with concentration. In panels C and D, the concentration of ATP and of ATP + PPi together were determined in a filtered plasma sample containing CTAD and EDTA as anticoagulants. The PPi concentration was calculated by subtracting the ATP concentration (panel C) from the combined ATP and PPi concentration (panel D). Of note, the first data points after addition of ATP (red arrowheads) are lower due to the shortened integration time after closing the luminometer. RLU: Relative Light Units. In panels A and B, the SD is smaller than the size of the symbols. The data underlying panels A and B are presented in the supplemental data section in tables S1 and S2, respectively.
To assess the suitability of the assay for plasma PPi quantification, we next tested the assay’s performance on a human filtered CTAD/EDTA plasma sample. Figure 2C (ATP) and 2D (ATP + PPi) show the time-course of RLU development upon sample addition. The inset in Figure 2C zooms into the increase in luminescence after adding the plasma sample. Without zooming in the signal generated by the ATP present in the sample would have been masked by the large increase in luminescence seen after addition of the ATP standard. The PPi concentration in the plasma sample analysed in figure 2 was calculated to be 0.87 μM: the combined concentration of PPi and ATP of 1.01 μM (Fig. 2D) minus the 0.14 μM ATP detected (Fig. 2C).
Next, the precision of the assay was evaluated using 1 μM, 0.3 μM, 0.1 μM, 0.03 μM and 0.01 μM PPi standards (Table 1). Even at a PPi concentration as low as 0.01 μM, the assays showed good precision with a CV of 8.3%. It is important to note that normal PPi concentrations in plasma range from 1-3 μM, indicating that our assay is able to accurately detect physiologically significant PPi variations. Notably, the assay yields most accurate values for PPi concentrations <1 μM. In case plasma concentrations are above 1 μM they are best diluted. The internal standard corrects for any effects the dilution has on luciferase activity.
Table 1: Precision (SD) and accuracy (deviation) of the PPi assay.
Values are calculated from 6 replicate determinations.
| PPi-standard (μM) | ||||||
|---|---|---|---|---|---|---|
| 1.000 | 0.300 | 0.100 | 0.030 | 0.010 | ||
| Average | μM | 1.011 | 0.306 | 0.102 | 0.033 | 0.010 |
| SD | σ | 0.014 | 0.006 | 0.002 | 0.004 | 0.001 |
| CV | % | 1.4 | 1.9 | 2.3 | 12.5 | 8.3 |
| Accuracy (deviation) | % | 1.1 | 2.1 | 1.7 | 8.9 | 1.6 |
SD, Standard deviation; CV, coefficient of deviation.
To further evaluate the performance of our assay in biological samples, we determined the recovery of PPi spiked into plasma of three different individuals at 1 and 0.1 μM (Table 2). We found an excellent recovery ranging from 97-106% of the added PPi. These analyses demonstrated that the assay was not substantially affected by plasma constituents and provides robust and accurate results. These analyses also confirmed the excellent precision of the assay in biological samples, with CV% ranging from 1.57 to 3.46% for experiments in which 0.1 μM PPi was spiked into the plasma samples. Notably these CV% are not only affected by the precision of the assay but are also influenced by the additional pipetting that is needed to add the PPi standard to the plasma samples. All plasma samples contained PPi concentrations > 1 μM and were diluted before analysis. The excellent recovery of PPi spiked into plasma (Table 2), demonstrates that sample dilution does not affect accuracy of the assay, as expected because of the use of an internal ATP standard. The limit of detection (LOD, 3.3σ) and the lower limit of quantification (LLOQ, 10σ) were calculated from the noise present in the plasma sample analysed in figure 2C, and the raw data underlying the values presented in table 1, and yielded values of ~3.5 and 10 nM, respectively.
Table 2: Table Recovery of PPi spiked into human plasma indicates excellent accuracy of the PPi assay.
Plasma of three individuals was spiked with the indicated amounts of PPi. Afterwards, the total concentration of PPi was determined in the spiked samples. Samples were diluted 1:5 in TE buffer before analysis. Values are based on triplicate determinations.
| Individual 1 | Individual 2 | Individual 3 | |||||
|---|---|---|---|---|---|---|---|
| Plasma PPi concentration | μM | 2.16 | 1.76 | 1.39 | |||
| PPi added | μM | 1.00 | 0.10 | 1.00 | 0.10 | 1.00 | 0.10 |
| Average PPi concentration detected in spiked plasma | μM | 3.13 | 2.26 | 2.74 | 1.86 | 2.40 | 1.50 |
| SD | σ | 0.04 | 0.08 | 0.08 | 0.03 | 0.04 | 0.04 |
| CV | % | 1.2% | 3.5% | 2.8% | 1.6% | 1.6% | 2.6% |
| PPi recovery (accuracy) | μM | 0.97 | 0.09 | 0.98 | 0.10 | 1.01 | 0.11 |
SD, Standard deviation; CV, coefficient of deviation.
It should be noted that ATP released by, for instance, erythrocytes or platelets, can be converted into AMP and PPi[3] by a soluble form of ENPP1 that is present in plasms[34]. Precautions are therefore needed to prevent ENPP1-mediated conversion of ATP into PPi after blood sampling. ENPP1 requires Mg2+ for its activity[34]. Mg2+ chelating agents, like EDTA and citrate, can therefore be expected to block ENPP1 activity. Platelets are another potential source of PPi released into plasma after blood has been collected. Platelets not only release ATP upon their activation, but also PPi[35], which might further contribute to artificially high plasma PPi concentrations. Platelet activation probably explains why serum contains much higher PPi concentrations than plasma (not shown). We determined the effects of the type of anticoagulant used and platelet removal on ATP and PPi concentrations in plasma samples of 3 human subjects. In all heparinized plasma samples ATP was undetectable, indicating rapid degradation of ATP by Mg2+-dependent ectonucleotidases (Fig. 3A). Hardly any ATP was found in filtered plasma, irrespective of the anticoagulant used. This result indicates that the ATP detected in unfiltered plasma is present in a membrane-enclosed compartment, which is removed by filtration. Surprisingly, the platelet-rich plasma did not contain more ATP than unfiltered plasma. For unknown reasons, CTAD and CTAD/EDTA plasma of participant 1 contained relatively high concentrations of ATP. The PPi amount detected depended on the anticoagulant used in unfiltered plasma, and CTAD and heparin yielded higher concentrations (Fig. 3B). The same was seen for the platelet-rich plasma samples. The type of anticoagulant used did not affect PPi concentrations to the same extent in filtered, platelet-free, plasma samples (Fig. 3B). All plasma had been stored at −20 °C prior to analysis. Possibly, the increased levels of PPi in CTAD and heparin plasma are the result of release of ATP from a membrane-enclosed compartment and its subsequent conversion into PPi, after a freeze-thaw cycle. We did not see the same increase in PPi when EDTA was used as an anticoagulant. These findings indicate that the citrate in CTAD chelates Mg2+ less well than EDTA and is unable to block ENPP1-mediated conversion of released ATP into PPi immediately. Heparinized plasma tended to give the highest PPi concentrations, which can be explained by the continued conversion of ATP into PPi after blood collection.
Figure 3. Blood processing affects the concentrations of ATP and PPi detected in plasma.
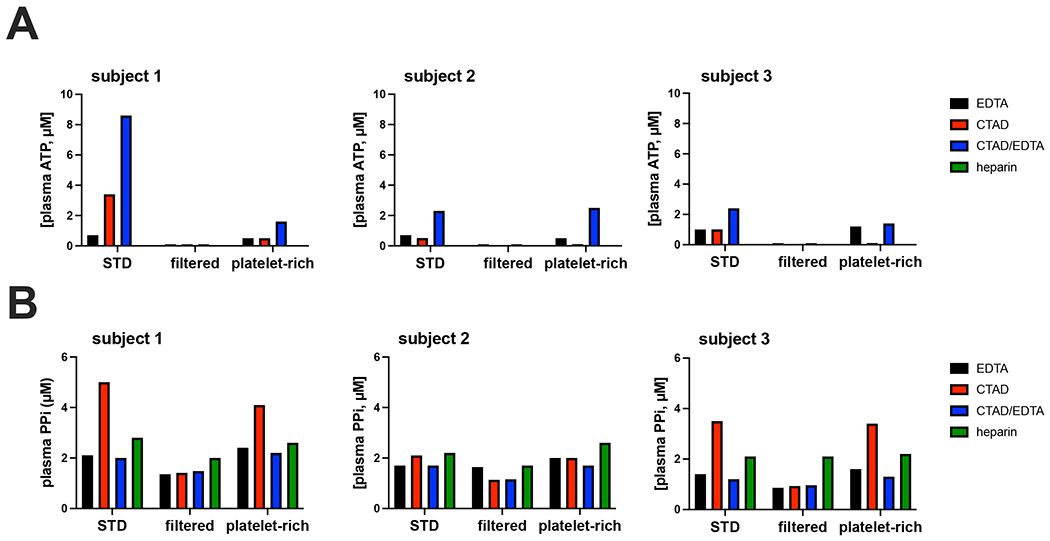
Blood was collected from 3 participants via puncture of the antecubital vein and uncoagulated using the indicated anticoagulants. After preparation of plasma, ATP (A) and PPi (B) were determined in plasma not further processed (“STD”), in plasma that was filtered over a 300,000 mwco filter (“filtered”) and in platelet-rich plasma (“platelet-rich”). Samples were diluted 1:5 in TE buffer before analysis. CTAD: citrate, theophylline, adenosine dipyridamole. EDTA: ethylenediaminetetraacetic acid. Values represent single determinations.
The assay showed excellent reproducibility and inter-day variability in filtered EDTA (CV: 2.6%), CTAD (CV: 2.3%) and CTAD/EDTA (CV: 2.4%) plasma samples of participant 3 (Fig. 4). Notably, the inter-day variability was very similar to the intra-day variability determined in Table 2. ATP was only stable when EDTA was present, with CTAD plasma being completely depleted from ATP one day after storage at room temperature (Fig. 4A). The lower ATP concentrations detected in CTAD/EDTA plasma suggest some ATP degradation before EDTA addition. Notably, the EDTA-only plasma was prepared from blood collected in EDTA vacuum tubes, assuring rapid inactivation of ectonucleotidases. Following PPi concentrations in filtered heparin plasma from the same participant during storage at 22 °C, we first detected a substantial decline, then a clear increase, and finally a steady decline (Fig. 4A). Similar results, though less pronounced, were obtained with filtered heparinized plasma samples of participant 2 (Supplemental figure S1) stored at room temperature. We will come back to these unexpected results in the discussion section.
Figure 4. Stability of PPi and ATP in plasma depends on the used anticoagulant.
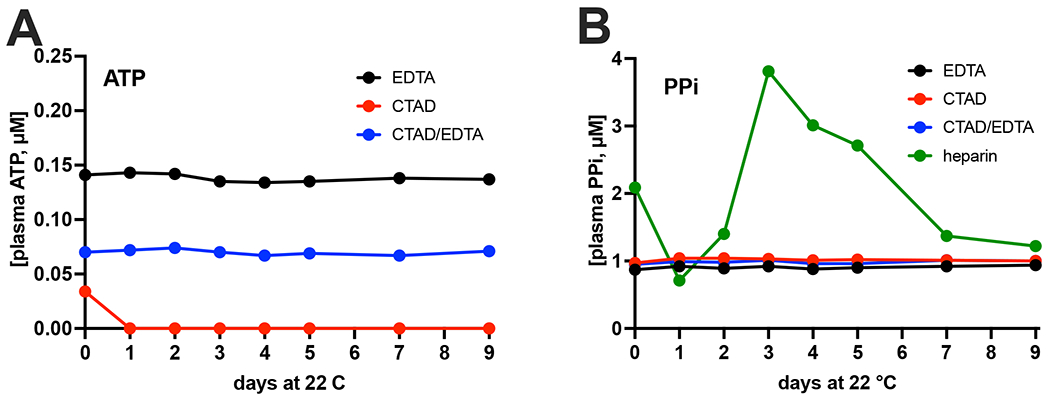
Filtered plasma of participant 3, prepared using the indicated anticoagulants, was stored at room temperature (22 °C) and ATP (A) and PPi (B) were quantified at the indicated days in samples diluted 1:5 in TE buffer. Of note, ATP was below the limit of detection in heparin plasma (see Figure 3B). Data represent single determinations performed on the indicated day after the start of storage at room temperature.
In PXE patients and Abcc6−/− mice, absence of ABCC6 in the liver results in a 60-70% reduction of plasma PPi[5, 6]. This reduction in plasma PPi is caused by the absence of ABCC6-mediated ATP release from the liver[6,36]. We next studied how well the optimized assay was able to detect the ABCC6-dependent difference in plasma PPi concentration in Abcc6−/− rats, a relatively new rodent model for PXE[33]. CTAD/EDTA was used as an anticoagulant in these experiments. The optimized assay returned similar average plasma PPi concentrations but yielded substantially lower variability within experimental groups resulting in a smaller overall p-value than the assay we used for our previous work[6,33] (Fig. 5). The total blood volume of rats allowed to fill multiple CTAD tubes with blood from the same animal. The PPi concentrations in these sequentially drawn blood samples are given in Table 3. There was considerable variability in these sequentially drawn samples in some animals. When blood was collected from the rats, the experiments shown in Figure 4 had not yet been done and we were therefore unaware of the unexpected fact that citrate does not completely block conversion of ATP into PPi in whole blood. The variability in PPi concentration in sequentially drawn blood samples from the same animal is most likely caused by differences in the time between blood collection in the CTAD tubes and the subsequent addition of EDTA: In the absence of EDTA, extracellular ATP continues to be converted into PPi and, hence, results in increased plasma concentrations.
Figure 5. Comparison of the performance of the new (A) and old (B) ATPS-based PPi assay on plasma samples collected from wild type (WT) and Abcc6−/− rats.

Blood was collected from rats under terminal isoflurane anaesthesia by cardiac puncture in CTAD vacuum tubes. Directly after collection 50 μL of a 15% EDTA solution was added, and filtered plasma was prepared as detailed in the materials and methods section. PPi concentrations were determined in the resulting filtered plasma using the old and new assay. Each group contained 2 male and 2 female animals. Data represent individual data points and mean.
Table 3: Sequentially taken blood samples collected from the same animal variation in plasma PPi concentrations.
Blood was collected from Abcc6−/− and wild type (Sprague Dawley) rats by cardiac puncture in CTAD tubes. Sequential blood samples were taken from the same animal till blood stopped flowing. After blood collection, 50 μl of a 15% K3EDTA solution was added per CTAD tube and plasma was prepared by centrifugation and filtration over a 300,000 Da mwco membrane.
| Sample # | |||||||
|---|---|---|---|---|---|---|---|
| Rat # | Genotype | sex | #1 | #2 | #3 | #4 | average |
| 1 | Abcc6 −/− | male | 0.19 | 0.18 | 0.29 | 0.62 | 0.32 |
| 2 | Abcc6 −/− | male | 0.48 | 0.39 | 0.39 | 0.25 | 0.38 |
| 3 | Abcc6 −/− | female | 1.03 | 0.13 | 0.58 | ||
| 4 | wild type | male | 1.61 | 1.38 | 1.43 | 1.47 | |
| 5 | wild type | female | 1.80 | 2.68 | 2.24 | ||
| 6 | wild type | male | 1.37 | 1.29 | 1.33 | ||
| 7 | Abcc6 −/− | female | 0.43 | 0.33 | 0.22 | 0.36 | 0.34 |
| 8 | wild type | female | 1.13 | 1.48 | 1.30 | ||
Discussion
PPi plays a crucial role in the prevention of soft connective tissue mineralization[1]. Moreover, it is abundantly present in the mineral phase of bone[7, 8, 24], where its exact function is still elusive. Several studies have recently explored approaches to increase circulating levels of PPi to counteract ectopic calcification[18, 37–39]. A significant obstacle in furthering these studies is the large variability in different laboratories’ PPi concentrations detected in normal plasma. Moreover, assays relying on radionuclides are cumbersome and expensive. Therefore, we set out to develop an assay that did not employ radionuclides, which could still give reproducible and robust results. The assay that is used by most laboratories to quantify PPi in biological samples relies on the enzyme ATPS, which converts PPi in a one-step enzymatic reaction into ATP[40]. Luciferase allows detection of minute amounts of ATP but is prone to inhibition[41]. In the current assay, interference by luciferase inhibitors was addressed by using a sensitive tube luminometer to quantify the luminescent signal which allowed dilution of plasma, and by employing an internal ATP standard to correct for luciferase inhibition. Our assay has some important advantages over previous ATPS-based methods to quantify PPi. First, a major improvement is the use of an internal ATP standard to correct for any remaining inhibition. Notably, inhibition is not an issue for conversion of PPi into ATP by ATPS, as inhibition of ATPS would only delay the time until all PPi is converted, not the total amount converted. A second improvement involves the preincubation of the reaction mixture with apyrase, which removes any contaminating ATP and PPi. This results in a reduced background and increased sensitivity. Third, the current setup quantifies ATP in each sample, with other luminescence-based assays only correcting for the luminescence signal generated by contaminating ATP.
In table 4 we have summarized the characteristics of our new assay and 3 other enzymatic assays that are used to detect PPi in plasma. The assays described by Silcox et al.[42] and Cook et al. [28] consume large volumes of a plasma and can therefore not be used to quantify PPi levels in rodent plasma samples. Moreover, both assays are time consuming, due to laborious procedures to remove inorganic phosphate and/or protein from the sample. In addition, [32P]-labelled PPi is used in the assay described by Silcox and co-workers, further limiting the applicability of this assay for every-day plasma PPi analyses. Less sample is needed for the enzymatic assay described by McGuire et al.[30]. However, significant drawbacks of this assay are the need for radiolabelled UDP-glucose and the long analysis time per sample. The assay described in the current study does not involve use of radionuclides or complicated sample processing procedures and, despite consuming only very limited sample, is orders of magnitude more sensitive.
Table 4.
Characteristics of currently available enzymatic assays to quantify PPi in plasma.
| Silcox et al. 1973[42] | Cook et al. 1978[28] | MgGuire et al. 1980[30] | Current study[32] | |
|---|---|---|---|---|
| enzymology | 1. Yeast inorganic pyrophosphatase | 1. Pyrophosphate-fructose-6-phosphate 1-phosphotransferase 2. Fructose-bisphosphate aldolase 3. Triosephosphate isomerase 4. Glycerol-3-phosphate dehydrogenase |
1. UDP-glucose pyrophosphorylase 2. Phosphoglucomutase 3. Glucose-6-phosphate dehydrogenase |
1. ATP-sulfurylase 2. Firefly luciferase |
| Sample preparation | Protein precipitation and removal of inorganic phosphate | Perchloric acid extraction with subsequent pH adjustment to 5–6 with potassium hydroxide | Platelet removal by filtration1) | Platelet removal by filtration1) |
| Radionuclides required? | Yes, [32P]PPi | no | Yes, [14C] UDP-glucose or [3H] UDP-glucose2) | no |
| Detection | Colorimetric detection of inorganic phosphate | NADPH generation/fluorescence | Liquid scintillation counting (LSC) | Bioluminescence |
| Sample volume 3) | 5 ml | 2 ml | 80 μl4) | Max. 10 μl |
| Time/sample | >1 hour (30 samples/week) | ~5 minutes + time needed for protein removal and pH adjustment | ~ 1 hour + time needed for LSC | ~5 minutes |
| Sensitivity | ND | ~ 250 pmol5) | 10 pmol | < 50 fmol6) |
Platelets are a source of contaminating PPi and ATP and their removal provides more accurate estimations plasma PPi concentrations [32].
The same enzymes can also be used to quantify PPi in plasma in an assay that follows NADPH reduction fluorometrically. The fluorometric variant of this assay has a reported sensitivity of ~ 50 pmol [24, 29, 30].
Plasma volume needed to complete the assay.
Includes an inorganic pyrophosphatase treated control.
Estimation based on figure 2 of Cook et al. [28].
Clotting induces not only induces cellular release of PPi, but also of ATP, which, due to the absence of EDTA, will be converted into PPi by ENPP1. Serum PPi levels are therefore 3-to-4-fold higher than in plasma[42], independent of the assay used. Another problem with the absence of EDTA in serum is that TNAP can be expected to degrade PPi into Pi over time. In conclusion, serum is not a good matrix to follow extracellular PPi concentrations in the circulation.
The ATPS-based assay was highly sensitive, with a lower limit of quantification (LLOQ) of at least 10 nM. Moreover, the assay took less than 5 minutes per plasma sample and showed good reproducibility and excellent recovery of spiked ATP/PPi. Taken together, these data confirm that the assay provides highly accurate and robust results as confirmed in human and rat plasma samples. We envision that if widely implemented in PPi plasma analysis, the absolute concentration values obtained with this assay would allow for the direct comparison of results obtained in different laboratories. The analyses of rat plasma showed that compared with the ATPS-based assay that we used in previous work, our current assay offers reduced variability within experimental groups, suggesting higher accuracy. In future studies, this lower variability should allow for a reduction in sample size, e.g., fewer animals or patients per experimental group, while still retaining enough power to detect statistically significant differences. The high sensitivity of the used tube luminometer, allows for detecting PPi in complex matrices, like highly acidic bone extracts, even when the samples are quite dilute[7, 8]. We expect the assay will perform equally well on other complex PPi-containing matrices, like extracts of teeth[43]. As the assay relies on the conversion of PPi into ATP, in its current form it performs less well on samples containing high concentrations of ATP. This will, for instance, prevent determining intracellular PPi concentrations. A potential solution would be to degrade ATP using apyrase. Future work should reveal if it is possible to specifically deplete samples from ATP without affecting PPi concentrations.
Analyses of rat and human plasma demonstrate that the type of assay used is not the only factor contributing to variability in PPi concentrations detected in plasma. The technique used for blood collection, the anticoagulant used, and the processing of prepared plasma all affected PPi plasma concentrations. Using an anticoagulant that strongly chelates Mg2+ and Ca2+ seems crucial, as this quickly blocks generation of PPi from ATP that is released by cells into the extracellular environment (i.e. into plasma) after blood collection. Most laboratories currently use CTAD as an anticoagulant when PPi needs to be quantified in plasma[17, 18, 44–47]. Our data show, however, that in citrate plasma ATP is being converted into PPi after collection and that EDTA is the anticoagulant of choice, as it quickly blocks conversion of ATP into PPi. This notion is supported by the striking stability of ATP and PPi in EDTA plasma stored at room temperature. This also demonstrates that ATP and PPi degradation requires divalent cations and is almost entirely enzymatic in nature. Our results indicate that heparin did not block ATP degradation and conversion into PPi, as apparent from the complete absence of ATP and the higher PPi concentrations detected in heparinized plasma samples. Stored at room temperature, PPi concentration detected in heparinized plasma showed an unexpected pattern over time. First, a decrease was seen, possibly due to the known TNAP activity in plasma[9]. The subsequent increase in plasma PPi concentrations after prolonged storage at room temperature is more difficult to explain. Filtered plasma was used in these experiments (mwco 300,000). Therefore, ATP release from a membrane-enclosed compartment with subsequent conversion into PPi cannot underlie these increased concentrations. Potential explanations include ENPP1-mediated conversion of polyphosphate, known to be present in plasma[48], into PPi and slow release of protein-bound PPi[49].
The multiple CTAD/EDTA blood tubes collected from individual rats showed substantial variability in plasma PPi concentrations in some animals. The samples were collected by inserting a dedicated blood collection needle into the heart and sequentially filling CTAD vacuum tubes without removing the needle. Differences in the time between blood sampling and addition of EDTA, differences in time before the blood samples were put on ice, or other slight alterations in the blood collection procedure might have contributed to the found variability. These data clearly indicate that blood collection and processing technique affects plasma PPi concentration. We expect that the points mentioned above also contribute to variability in plasma PPi concentrations detected in humans. Implementation of a detailed standardized procedure, therefore, seems critical to reducing variability.
ATP was virtually absent from filtered plasma, irrespective of the anticoagulant used. This indicates that in plasma ATP is present in a membrane-enclosed compartment or bound to a high molecular weight plasma protein. Lower levels of PPi were detected after filtration of plasma. Platelet dense granules contain high concentrations of ATP and PPi[35]. An attractive explanation is that the absence of ATP and reduced PPi concentrations in filtered plasma result from platelet removal. These data align well with previous studies exploring the effect of filtration on plasma PPi concentrations[12, 32] and suggest that using filtered plasma will reduce variability and provides a better estimate of the free PPi concentration in plasma.
In conclusion, we here describe a rapid, precise, accurate and reproducible assay to determine PPi in biological matrices. Analyses of rat and human plasma samples indicate that blood collection procedure, the choice of anticoagulant and the filtration step all affect the amount of PPi measured. To compare plasma PPi concentrations quantified in different laboratories, it is crucial to standardize blood collection and processing, possibly using the data presented in this study as a guideline. This seems especially important when normal plasma PPi concentrations in adult and paediatric individuals are being established.
Supplementary Material
Acknowledgements
We thank Arne Lundin (BioThema, SE) for valuable discussions and are grateful to individuals affected by pseudoxanthoma elasticum (PXE) and their continued support of our research.
Funding
This research was funded by National Institutes of Health, Grant R01AR072695 (K.v.d.W.), U.S. Department of State (Fulbright Visiting Scholar Program), National Research, Development and Innovation Office (OTKA FK131946), Hungarian Academy of Sciences (Bolyai János Fellowship BO/00730/19/8, Mobility grant), ELKH-PoC-2022-023 grant, and the Ministry for Innovation and Technology from the source of the National Research, Development and Innovation Fund (ÚNKP-2022 New National Excellence Program) to F.S. Further funding for this work was provided by PXE International for K.v.d.W. and F.S.
Footnotes
Conflicts of Interest
The authors declare no competing conflict of interest
Ethics approval
The Institutional Review Board of Genetic Alliance gave ethical approval for the studies involving blood collection of human participants (Protocol number JKVDW001). Animal studies were approved by the Institutional Animal Care and Use Committee of Thomas Jefferson University in accordance with the National Institutes of Health Guide for Care and Use of Laboratory Animals under approval number 02135-1.
Animal welfare
Experiments were set up in a way to prevent pain and suffering of involved animals.
References
- 1.Orriss IR (2020) Extracellular pyrophosphate: The body’s “water softener”. Bone 134:115243. 10.1016/j.bone.2020.115243 [DOI] [PubMed] [Google Scholar]
- 2.Ralph D, Wetering K van de, Uitto J, Li Q (2022) Inorganic pyrophosphate deficiency syndromes and potential treatments for pathologic tissue calcification. Am J Pathol 192:762–770. 10.1016/j.ajpath.2022.01.012 [DOI] [PMC free article] [PubMed] [Google Scholar]
- 3.Villa-Bellosta R (2019) ATP-based therapy prevents vascular calcification and extends longevity in a mouse model of Hutchinson-Gilford progeria syndrome. Proc Natl Acad Sci USA 116:23698–23704. 10.1073/pnas.1910972116 [DOI] [PMC free article] [PubMed] [Google Scholar]
- 4.Lomashvili KA, Narisawa S, Millán JL, O’Neill WC (2014) Vascular calcification is dependent on plasma levels of pyrophosphate. Kidney Int 85:1–6. 10.1038/ki.2013.521 [DOI] [PMC free article] [PubMed] [Google Scholar]
- 5.Jansen RS, Küçükosmanoglu A, Haas M de, Sapthu S, Otero JA, Hegman IEM, Bergen AAB, Gorgels TGMF, Borst P, Wetering K van de (2013) ABCC6 prevents ectopic mineralization seen in pseudoxanthoma elasticum by inducing cellular nucleotide release. Proc Natl Acad Sci USA 110:20206–20211. 10.1073/pnas.1319582110 [DOI] [PMC free article] [PubMed] [Google Scholar]
- 6.Jansen RS, Duijst S, Mahakena S, Sommer D, Szeri F, Váradi A, Plomp A, Bergen AA, Elferink RPJO, Borst P, Wetering K van de (2014) ABCC6-mediated ATP secretion by the liver is the main source of the mineralization inhibitor inorganic pyrophosphate in the systemic circulation-brief report. Arterioscler Thromb Vasc Biol 34:1985–1989. 10.1161/atvbaha.114.304017 [DOI] [PMC free article] [PubMed] [Google Scholar]
- 7.Szeri F, Lundkvist S, Donnelly S, Engelke UFH, Rhee K, Williams CJ, Sundberg JP, Wevers RA, Tomlinson RE, Jansen RS, Wetering K van de (2020) The membrane protein ANKH is crucial for bone mechanical performance by mediating cellular export of citrate and ATP. PLoS Genet 16:e1008884. 10.1371/journal.pgen.1008884 [DOI] [PMC free article] [PubMed] [Google Scholar]
- 8.Szeri F, Niaziorimi F, Donnelly S, Fariha N, Tertyshnaia M, Patel D, Lundkvist S, Wetering K (2022) The Mineralization Regulator ANKH Mediates Cellular Efflux of ATP, Not Pyrophosphate. J Bone Miner Res 37:1024–1031. 10.1002/jbmr.4528 [DOI] [PMC free article] [PubMed] [Google Scholar]
- 9.Whyte MP, Landt M, Ryan LM, Mulivor RA, Henthorn PS, Fedde KN, Mahuren JD, Coburn SP (1995) Alkaline phosphatase: placental and tissue-nonspecific isoenzymes hydrolyze phosphoethanolamine, inorganic pyrophosphate, and pyridoxal 5’-phosphate. Substrate accumulation in carriers of hypophosphatasia corrects during pregnancy. J Clin Invest 95:1440–1445. 10.1172/jci117814 [DOI] [PMC free article] [PubMed] [Google Scholar]
- 10.Jin H, Hilaire CS, Huang Y, Yang D, Dmitrieva NI, Negro A, Schwartzbeck R, Liu Y, Yu Z, Walts A, Davaine J-M, Lee D-Y, Donahue D, Hsu KS, Chen J, Cheng T, Gahl W, Chen G, Boehm M (2016) Increased activity of TNAP compensates for reduced adenosine production and promotes ectopic calcification in the genetic disease ACDC. Sci Signal 9:ra121–ra121. 10.1126/scisignal.aaf9109 [DOI] [PMC free article] [PubMed] [Google Scholar]
- 11.Hilaire CS, Ziegler SG, Markello TC, Brusco A, Groden C, Gill F, Carlson-Donohoe H, Lederman RJ, Chen MY, Yang D, Siegenthaler MP, Arduino C, Mancini C, Freudenthal B, Stanescu HC, Zdebik AA, Chaganti RK, Nussbaum RL, Kleta R, Gahl WA, Boehm M (2011) NT5E mutations and arterial calcifications. N Engl J Med 364:432–442. 10.1056/nejmoa0912923 [DOI] [PMC free article] [PubMed] [Google Scholar]
- 12.O’Neill WC, Sigrist MK, McIntyre CW (2009) Plasma pyrophosphate and vascular calcification in chronic kidney disease. Nephrol Dial Transplant 25:187–91. 10.1093/ndt/gfp362 [DOI] [PMC free article] [PubMed] [Google Scholar]
- 13.Lioufas NM, Pedagogos E, Hawley CM, Pascoe EM, Elder GJ, Badve SV, Valks A, Toussaint ND, on behalf of the IMPROVE-CKD Investigators (2020) Aortic Calcification and Arterial Stiffness Burden in a Chronic Kidney Disease Cohort with High Cardiovascular Risk: Baseline Characteristics of the Impact of Phosphate Reduction On Vascular End-Points in Chronic Kidney Disease Trial. Am J Nephrol 51:201–215. 10.1159/000505717 [DOI] [PubMed] [Google Scholar]
- 14.Kavousi M, Desai CS, Ayers C, Blumenthal RS, Budoff MJ, Mahabadi A-A, Ikram MA, Lugt A van der, Hofman A, Erbel R, Khera A, Geisel MH, Jöckel K-H, Lehmann N, Hoffmann U, O’Donnell CJ, Massaro JM, Liu K, Möhlenkamp S, Ning H, Franco OH, Greenland P (2016) Prevalence and Prognostic Implications of Coronary Artery Calcification in Low-Risk Women. JAMA 316:2126–9. 10.1001/jama.2016.17020 [DOI] [PubMed] [Google Scholar]
- 15.Ryan LM, Kozin F, Mccarty DJ (1979) Quantification of human plasma inorganic pyrophosphate. Arthritis Rheumatism 22:892–895. 10.1002/art.1780220813 [DOI] [PubMed] [Google Scholar]
- 16.Bernhard E, Nitschke Y, Khursigara G, Sabbagh Y, Wang Y, Rutsch F (2021) A Reference Range for Plasma Levels of Inorganic Pyrophosphate in Children Using the ATP Sulfurylase Method. J Clin Endocrinol Metab 107:109–118. 10.1210/clinem/dgab615 [DOI] [PMC free article] [PubMed] [Google Scholar]
- 17.Sánchez-Tévar AM, García-Fernández M, Murcia-Casas B, Rioja-Villodres J, Carrillo JL, Camacho M, Gils MV, Sánchez-Chaparro MA, Vanakker O, Valdivielso P (2019) Plasma inorganic pyrophosphate and alkaline phosphatase in patients with pseudoxanthoma elasticum. Ann Transl Medicine 7:798. 10.21037/atm.2019.12.73 [DOI] [PMC free article] [PubMed] [Google Scholar]
- 18.Dedinszki D, Szeri F, Kozák E, Pomozi V, Tőkési N, Mezei TR, Merczel K, Letavernier E, Tang E, Saux OL, Arányi T, Wetering K van de, Váradi A (2017) Oral administration of pyrophosphate inhibits connective tissue calcification. EMBO Mol Med 9:1463–1470. 10.15252/emmm.201707532 [DOI] [PMC free article] [PubMed] [Google Scholar]
- 19.Li Q, Guo H, Chou DW, Berndt A, Sundberg JP, Uitto J (2013) Mutant Enpp1asj mice as a model for generalized arterial calcification of infancy. Dis Models Mech 6:1227–1235. 10.1242/dmm.012765 [DOI] [PMC free article] [PubMed] [Google Scholar]
- 20.Li Q, Chou DW, Price TP, Sundberg JP, Uitto J (2014) Genetic modulation of nephrocalcinosis in mouse models of ectopic mineralization: the Abcc6(tm1Jfk) and Enpp1(asj) mutant mice. Lab Invest 94:623–632. 10.1038/labinvest.2014.52 [DOI] [PMC free article] [PubMed] [Google Scholar]
- 21.Kiss N, Fésűs L, Bozsányi S, Szeri F, Gils MV, Szabó V, Nagy AI, Hidvégi B, Szipőcs R, Martin L, Vanakker O, Arányi T, Merkely B, Wikonkál NM, Medvecz M (2020) Nonlinear optical microscopy is a novel tool for the analysis of cutaneous alterations in pseudoxanthoma elasticum. Laser Med Sci 35:1821–1830. 10.1007/s10103-020-03027-w [DOI] [PMC free article] [PubMed] [Google Scholar]
- 22.Johnson JC, Shanoff M, Bass ST, Boezi JA, Hansen RG (1968) An enzymic method for determination of inorganic pyrophosphate and its use as an assay for RNA polymerase. Anal Biochem 26:137–145 [DOI] [PubMed] [Google Scholar]
- 23.Alfrey AC, Solomons CC (1976) Bone pyrophosphate in uremia and its association with extraosseous calcification. J Clin Invest 57:700–705. 10.1172/jci108327 [DOI] [PMC free article] [PubMed] [Google Scholar]
- 24.Cartier PH, Thuillier L (1974) Measurement of inorganic pyrophosphate in biological fluids and bone tissues. Anal Biochem 61:416–428. 10.1016/0003-2697(74)90407-2 [DOI] [PubMed] [Google Scholar]
- 25.Russell RG, Edwards NA, Hodgkinson A (1964) Urinary Pyrophosphate and Urolithiasis. Lancet 2:1446. [DOI] [PubMed] [Google Scholar]
- 26.Gu C, Chen X, Liu H (2021) Portable, quantitative, and sequential monitoring of copper ions and pyrophosphate based on a DNAzyme-Fe3O4 nanosystem and glucometer readout. Anal Bioanal Chem 413:6941–6949. 10.1007/s00216-021-03662-4 [DOI] [PMC free article] [PubMed] [Google Scholar]
- 27.Kiran S, Khatik R, Schirhagl R (2019) Smart probe for simultaneous detection of copper ion, pyrophosphate, and alkaline phosphatase in vitro and in clinical samples. Anal Bioanal Chem 411:6475–6485. 10.1007/s00216-019-02027-2 [DOI] [PMC free article] [PubMed] [Google Scholar]
- 28.Cook GA, O’Brien WE, Wood HG, King MT, Veech RL (1978) A rapid, enzymatic assay for the measurement of inorganic pyrophosphate in animal tissues. Anal Biochem 91:557–565. 10.1016/0003-2697(78)90543-2 [DOI] [PubMed] [Google Scholar]
- 29.Lust G, Seegmiller JE (1976) A rapid, enzymatic assay for measurement of inorganic pyrophosphate in biological samples. Clin Chim Acta 66:241–249 [DOI] [PubMed] [Google Scholar]
- 30.McGuire MB, Colman CH, Baghat N, Russell RGG (1980) Radiometric measurement of pyrophosphate in cell cultures. Biochem Soc T 8:529–530. 10.1042/bst0080529 [DOI] [PubMed] [Google Scholar]
- 31.Helenius M, Jalkanen S, Yegutkin GG (2012) Enzyme-coupled assays for simultaneous detection of nanomolar ATP, ADP, AMP, adenosine, inosine and pyrophosphate concentrations in extracellular fluids. Biochim Biophys Acta 1823:1967–1975. 10.1016/j.bbamcr.2012.08.001 [DOI] [PubMed] [Google Scholar]
- 32.Tolouian R, Connery SM, O’Neill WC, Gupta A (2012) Using a filtration technique to isolate platelet free plasma for assaying pyrophosphate. Clin Lab 58:1129–34. 10.7754/clin.lab.2012.111101 [DOI] [PMC free article] [PubMed] [Google Scholar]
- 33.Li Q, Kingman J, Wetering K van de, Tannouri S, Sundberg JP, Uitto J (2017) Abcc6 Knockout Rat Model Highlights the Role of Liver in PPi Homeostasis in Pseudoxanthoma Elasticum. J Invest Dermatol 137:1025–1032. 10.1016/j.jid.2016.11.042 [DOI] [PMC free article] [PubMed] [Google Scholar]
- 34.Jansen S, Perrakis A, Ulens C, Winkler C, Andries M, Joosten RP, Acker MV, Luyten FP, Moolenaar WH, Bollen M (2012) Structure of NPP1, an ectonucleotide pyrophosphatase/phosphodiesterase involved in tissue calcification. Structure 20:1948–1959. 10.1016/j.str.2012.09.001 [DOI] [PubMed] [Google Scholar]
- 35.Gerrard JM, McNicol A (2009) Platelet Storage Pool Deficiency, Leukemia, and Myelodysplastic Syndromes. Leuk Lymphoma 8:277–281. 10.3109/10428199209051007 [DOI] [PubMed] [Google Scholar]
- 36.Borst P, Váradi A, Wetering K van de (2019) PXE, a Mysterious Inborn Error Clarified. Trends Biochem Sci 44:125–140. 10.1016/j.tibs.2018.10.005 [DOI] [PMC free article] [PubMed] [Google Scholar]
- 37.O’Neill WC, Lomashvili KA, Malluche HH, Faugere M-C, Riser BL (2010) Treatment with pyrophosphate inhibits uremic vascular calcification. Kidney Int 79:512–517. 10.1038/ki.2010.461 [DOI] [PMC free article] [PubMed] [Google Scholar]
- 38.Pomozi V, Brampton C, Wetering K van de, Zoll J, Calio B, Pham K, Owens JB, Marh J, Moisyadi S, Váradi A, Martin L, Bauer C, Erdmann J, Aherrahrou Z, Saux OL (2017) Pyrophosphate Supplementation Prevents Chronic and Acute Calcification in ABCC6-Deficient Mice. Am J Pathol 187:1258–1272. 10.1016/j.ajpath.2017.02.009 [DOI] [PMC free article] [PubMed] [Google Scholar]
- 39.Li Q, Huang J, Pinkerton AB, Millán JL, Zelst BD van, Levine MA, Sundberg JP, Uitto J (2018) Inhibition of Tissue-Nonspecific Alkaline Phosphatase Attenuates Ectopic Mineralization in the Abcc6−/− Mouse Model of PXE but not in the Enpp1 Mutant Mouse Models of GACI. J Invest Dermatol. 10.1016/j.jid.2018.07.030 [DOI] [PMC free article] [PubMed] [Google Scholar]
- 40.Yegutkin GG (2008) Nucleotide- and nucleoside-converting ectoenzymes: Important modulators of purinergic signalling cascade. Biochim Biophys Acta 1783:673–694. 10.1016/j.bbamcr.2008.01.024 [DOI] [PubMed] [Google Scholar]
- 41.Lundin A (2014) Optimization of the Firefly Luciferase Reaction for Analytical Purposes. In: Bioluminescence: Fundamentals and Applications in Biotechnology - Volume 2. Springer, pp 31–62 [DOI] [PubMed] [Google Scholar]
- 42.Silcox DC, McCarty DJ (1973) Measurement of inorganic pyrophosphate in biological fluids. Elevated levels in some patients with osteoarthritis, pseudogout, acromegaly, and uremia. J Clin Invest 52:1863–1870. 10.1172/jci107369 [DOI] [PMC free article] [PubMed] [Google Scholar]
- 43.Suarez-Moreira E, Hannibal L, Smith CA, Chavez RA, Jacobsen DW, Brasch NE (2006) A simple, convenient method to synthesize cobalamins: synthesis of homocysteinylcobalamin, N-acetylcysteinylcobalamin, 2-N-acetylamino-2-carbomethoxyethanethiolatocobalamin, sulfitocobalamin and nitrocobalamin. Dalton Trans 5269. 10.1039/b610158e [DOI] [PMC free article] [PubMed] [Google Scholar]
- 44.Veiga-Lopez A, Sethuraman V, Navasiolava N, Makela B, Olomu I, Long R, Wetering K van de, Martin L, Arányi T, Szeri F (2020) Plasma Inorganic Pyrophosphate Deficiency Links Multiparity to Cardiovascular Disease Risk. Front Cell Dev Biol 8:573727. 10.3389/fcell.2020.573727 [DOI] [PMC free article] [PubMed] [Google Scholar]
- 45.Kauffenstein G, Yegutkin GG, Khiati S, Pomozi V, Saux OL, Leftheriotis G, Lenaers G, Henrion D, Martin L (2018) Alteration of Extracellular Nucleotide Metabolism in Pseudoxanthoma Elasticum. J Invest Dermatol 138:1862–1870. 10.1016/j.jid.2018.02.023 [DOI] [PMC free article] [PubMed] [Google Scholar]
- 46.Pomozi V, Julian CB, Zoll J, Pham K, Kuo S, Tőkési N, Martin L, Váradi A, Saux OL (2019) Dietary Pyrophosphate Modulates Calcification in a Mouse Model of Pseudoxanthoma Elasticum: Implication for Treatment of Patients. J Invest Dermatol 139:1082–1088. 10.1016/j.jid.2018.10.040 [DOI] [PMC free article] [PubMed] [Google Scholar]
- 47.Verschuere S, Navassiolava N, Martin L, Nevalainen PI, Coucke PJ, Vanakker OM (2020) Reassessment of causality of ABCC6 missense variants associated with pseudoxanthoma elasticum based on Sherloc. Genet Med 29:205–9. 10.1038/s41436-020-00945-6 [DOI] [PubMed] [Google Scholar]
- 48.Müller WEG, Schröder HC, Wang X (2019) Inorganic Polyphosphates As Storage for and Generator of Metabolic Energy in the Extracellular Matrix. Chem Rev 119:12337–12374. 10.1021/acs.chemrev.9b00460 [DOI] [PMC free article] [PubMed] [Google Scholar]
- 49.Krishnamurthy GT, Huebotter RJ, Walsh CF, Taylor JR, Kehr MD, Tubis M, Blahd WH (1975) Kinetics of 99mTc-labeled pyrophosphate and polyphosphate in man. J Nucl Med 16:109–115 [PubMed] [Google Scholar]
Associated Data
This section collects any data citations, data availability statements, or supplementary materials included in this article.