

Abstract
Benzalkyldimethylammonium (or benzalkonium; BACs), alkyltrimethylammonium (ATMACs), and dialkyldimethylammonium compounds (DDACs) have been widely used for over six decades as disinfectants, particularly during the COVID-19 pandemic. Here, we describe methods for determination of 7 BACs, 6 ATMACs, 6 DDACs, 8 BAC metabolites, and the structurally similar quaternary ammonium compound (QAC) herbicides diquat, paraquat, and difenzoquat in human serum and urine using liquid chromatography-tandem mass spectrometry. The methods were optimized using isotopically labelled internal standards and solid-phase extraction with weak cation-exchange cartridges. We separated diquat and paraquat chromatographically using a mixed-mode LC column, and BACs, ATMACs, DDACs, difenzoquat, and BAC metabolites using reversed-phase (C8 and C18) columns. Method limits of detection (MLODs) and quantification (MLOQs) were 0.002–0.42 and 0.006–1.40 ng/mL, respectively. Recoveries of all analytes fortified at 1, 5, and 20 ng/mL concentrations in serum and urine matrices were 61–129%, with standard deviations of 0–20%. Repeated analysis of similarly fortified serum and urine samples yielded intra-day and inter-day variations of 0.22–17.4% and 0.35–17.3%, respectively. Matrix effects for analytes spiked into serum and urine matrices ranged from −27% to 15.4%. Analysis of real urine and serum samples revealed several QACs in human serum. Although no BACs were found in urine, we detected ω-hydroxy and ω-carboxylic acid metabolites of BACs at average concentrations in the range of 0.05–0.35 ng/mL. The method is useful for application in large-scale biomonitoring of human exposure to QACs and metabolites in human serum and urine.
Keywords: Benzalkonium, Quaternary ammonium compound, Paraquat, Benzalkonium metabolites, Serum, Urine
1. Introduction
Owing to their broad-spectrum antimicrobial properties, quaternary ammonium compounds (QACs) including benzalkyldimethylammonium (BACs, also known as benzalkonium), alkyltrimethylammonium (ATMACs), and dialkyldimethylammonium compounds (DDACs) (Fig. 1) have been the most extensively used class of biocides, disinfectants, and sanitizers since the late 1940s [1]. The length of the carbon chain influences the antimicrobial activity of QACs, with alkyl chain lengths of C12–C16 generally optimal. During the COVID-19 pandemic, QAC disinfectants were used intensively in hospitals, day care centers, public places, and homes to prevent the spread of severe acute respiratory syndrome coronavirus 2 (SARS-CoV-2) [1]. The production volume of each of BAC, ATMAC, and DDAC was ~10–50 million pounds in the United States in 2015 (https://www.epa.gov/chemical-data-reporting/access-cdr-data). The global market for disinfectants is projected to increase at an estimated 9.1% annually from 2020 to 2027 [2]. The large-scale application of QACs in consumer products has rendered them ubiquitous in the environment [1, 3–5], foodstuffs [6, 7], and human serum and breast milk [8–10]. For instance, ΣQAC concentrations in residential dust collected during the COVID-19 pandemic in 2020 (median: 58.9 μg/g) were significantly higher than those in dust collected before the pandemic during 2018–2019 (median: 36.3 μg/g) [4]. ΣQAC concentrations in human sera from the U.S. general population collected during COVID-19 in 2020 (median: 6.04 ng/mL) were also higher than those collected before it in 2019 (median: 3.41 ng/mL) [10].
Fig. 1.
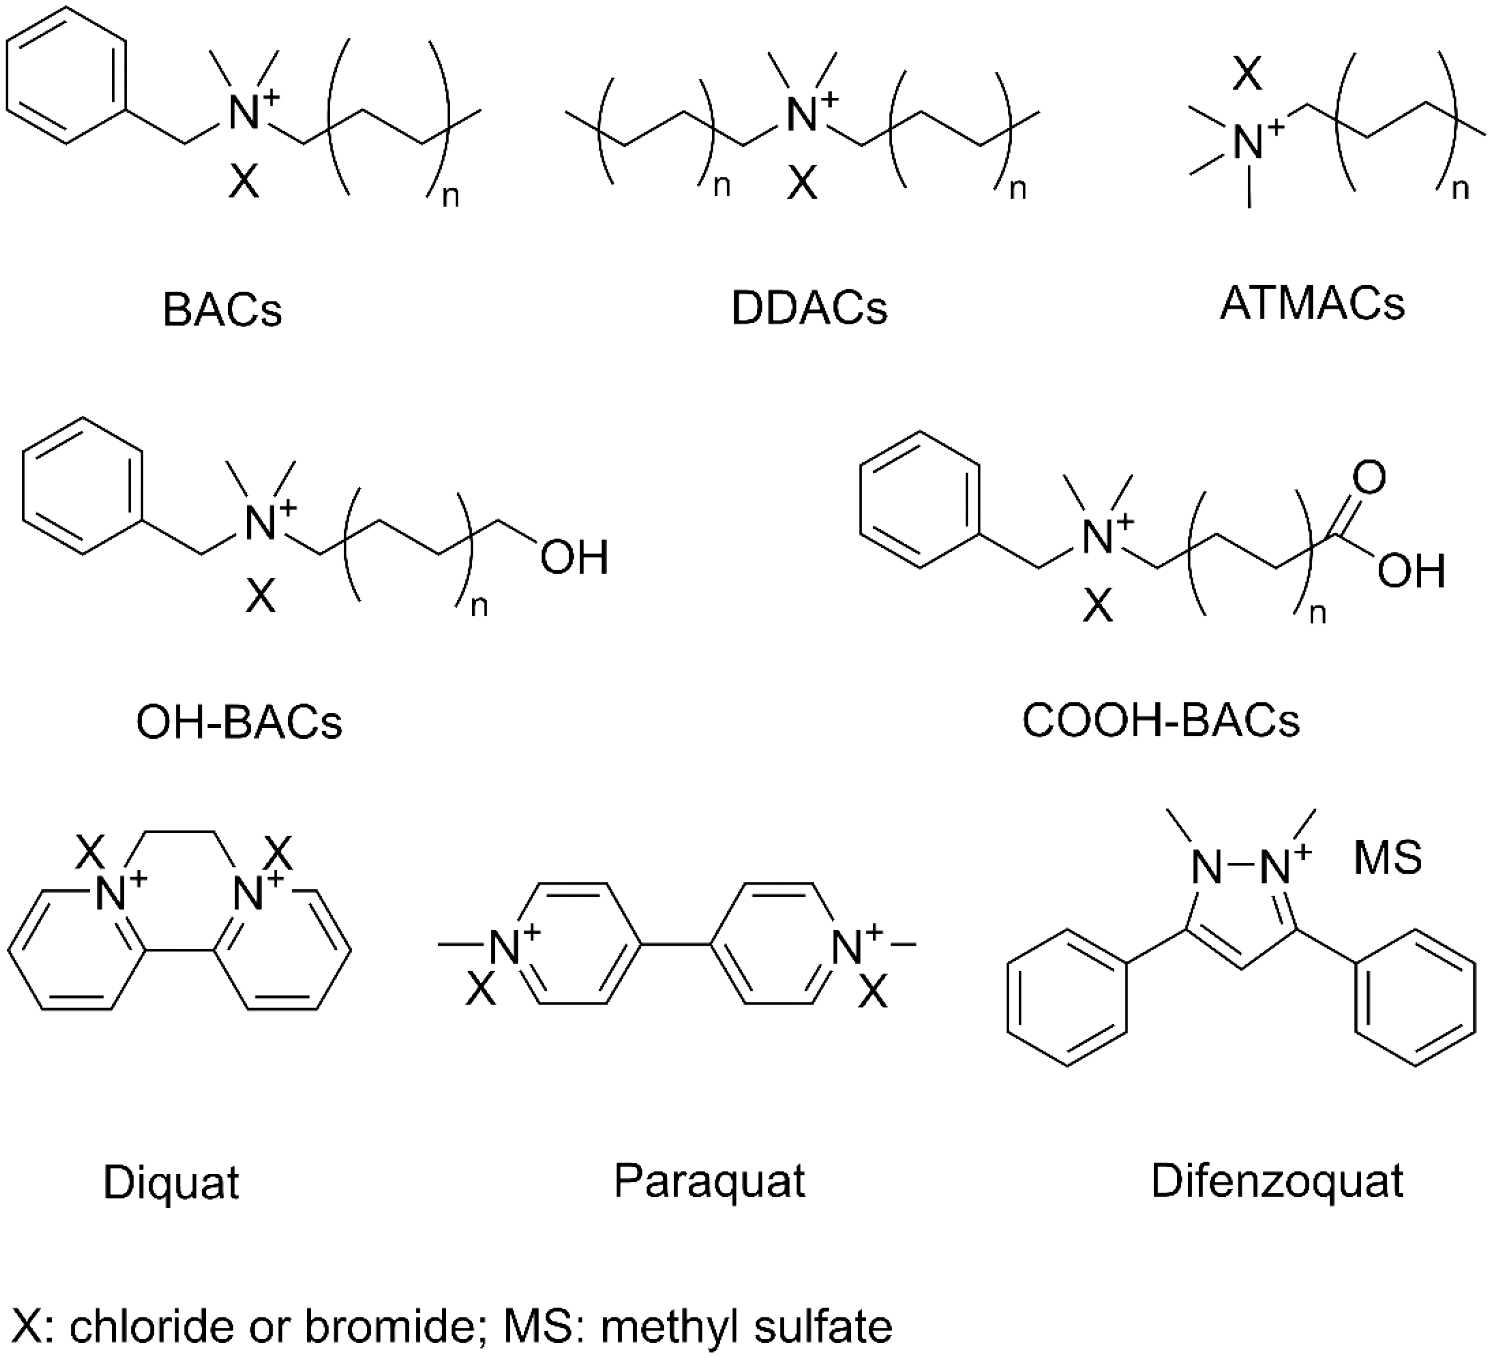
Molecular structures of the compounds tested, including benzalkyldimethylammonium compounds (BACs), alkyltrimethylammonium compounds (ATMACs), dialkyldimethylammonium compounds (DDACs), OH-BACs, COOH-BACs, and the herbicides diquat, paraquat, and difenzoquat.
While exposure to QACs is inevitable, there is growing concern about their adverse health effects in humans. Studies have linked QAC exposure to skin irritation [11–13], adverse respiratory outcomes [14–16], immunotoxicity [17], metabolic disorders [18], and reproductive toxicity [19, 20].
Diquat (DQ), paraquat (PQ), and difenzoquat (DFQ) (Fig. 1) are herbicides in the QAC class. PQ and DQ are non-selective contact herbicides used to control agricultural and aquatic weeds, whereas DFQ is a selective herbicide typically used for post-emergence control of wild oats in barley and wheat cultivation [21]. PQ is one of the most toxic herbicides used, with oral LD50 values of 150 mg/kg body weight (BW) in rats [22] and 35 mg/kg BW in humans [23], and is reported to be a risk factor for Parkinson’s disease [24]. PQ is a restricted herbicide in the United States and has been banned in several other countries [25]. DQ (oral LD50 in rats: 231 mg/kg) and DFQ (470 mg/kg) are relatively less toxic [22], but exposure can lead to kidney failure, central nervous system disorders, and inflammation [25–27].
Little is known about internal exposure doses to BACs, ATMACs, DDACs, PQ, DQ, and DFQ in humans. Recent studies reported the occurrence of QACs in human blood and breast milk [8–10] and indicated that humans are exposed to QACs mainly through oral ingestion [28]. In rats, QACs are rapidly metabolized and eliminated through feces with half-lives of a few hours [29, 30]. It is plausible that QACs may be excreted through urine either as parent compounds or as hydroxylated and carboxylated metabolites. Therefore, a method to quantify QACs and their metabolites in serum and urine is needed.
Analysis of trace concentrations of PQ and DQ in urine or serum can be challenging due to their cationic properties, low volatility, and high water solubility [31]. Earlier studies relied on gas chromatography-mass spectrometry (GC-MS) [32], capillary electrophoresis [33], and enzyme-linked immunoassay [34] for the determination of PQ and DQ. Methods based on liquid chromatography-tandem mass spectrometry (LC-MS/MS) offer superior sensitivity and selectivity and have been used for PQ and DQ analysis of human urine (Table 1) and foodstuffs (Table S1, Supplementary Material). Ion-pair reversed-phase chromatography [35–39], hydrophilic interaction liquid chromatography (HILIC) [40, 41], and mixed-mode chromatography [42, 43] have also been used, although sufficient resolution and retention were not always achieved. In addition, PQ and DQ exhibit complex mass spectrometric ionization patterns, yielding inconsistent ion fragmentation and mass transitions [31].
Table 1.
Reported LC-MS/MS methods for the determination of paraquat and diquat in human urine.
| Analytes | Urine volume (μL) | IS | Sample cleanup | LC condition | MS/MS | LOD (ng/mL) | Ref. |
|---|---|---|---|---|---|---|---|
| DQ, PQ | 100 | DQ-d4; PQ-d8 | Dilution with water; back-washing with dichloromethane; centrifugation | Column: Agilent ZORBAX SB-Aq (100 × 2.1 mm, 1.8 μm); A: 15 mM HFBA in water; B: ACN |
DQ: 183/157; PQ: 185/115 |
DQ: 50; PQ: 100 |
[35] |
| DQ, PQ | 1000 | Ethyl paraquat dibromide | SPE: Sep-Pak C18 cartridge | Column: Suplex pkb-100 (250 × 2.1 mm, 5 μm); A: 20 mM AmAc containing 15 mM HFBA (pH 3.3); B: ACN |
DQ: 183/157; PQ: 185/169 |
DQ: 5; PQ: 10 |
[50] |
| PQ | 2000 | Not used | Extraction with magnetic beads; single-walled carbon nanotube | Column: Capcell Pak ST (150 × 2.0 mm, 2.6 μm); A: water containing 0.4% TFA; B: ACN |
PQ: 185 | PQ: 0.94 | [54] |
| PQ | 100 | Ethyl viologen dibromide | Extraction with ACN | Column: Waters HILIC (100 × 2.1 mm, 1.7 μm); A: 40 mM AmFm containing 0.5% FA; B: ACN |
PQ: 93/171 | PQ: 0.1 ppb | [55] |
| PQ | 100 | Ethyl viologen dibromide | Extraction with cold can | Column: Kinetex HILIC (50 × 2.1 mm, 2.6 μm); A: 250 mM AmFm with 0.8% FA; B: ACN |
PQ: 93/171 | PQ: 10 | [56] |
| DQ, PQ | 2000 | DQ-d4; PQ-d8 | SPE: weak cation-exchange cartridges | Column: Atlantis HILIC Silica (150 × 2.1 mm, 5 μm); A: 250 mM AmFm, pH 3.7; B: ACN |
DQ: 183/157; PQ: 185/169 |
DQ: 0.13 PQ: 0.63 |
[40] |
| DQ, PQ | 1000 | DQ-d4; PQ-d8 | Magnetic-phase extraction | Column: SIELC Obelsic R (150 × 2.1 mm, 5 μm); A: 50 mM AmFm (pH 3.7); B: ACN |
DQ: 186/171; PQ: 184/184 |
DQ: 0.14; PQ: 0.12 |
[57] |
| DQ,PQ | 250 | DQ-d4; PQ-d8 | SPE: weak cation-exchange cartridges | Column: Acclaim™ Trinity Q1 (100 × 2.1 mm, 3 μm) A: 100 mM AmFm (pH 5.0); B: ACN |
DQ: 183/157; PQ: 93/171 |
DQ: 0.04; PQ: 0.05 |
This study |
Abbreviations: PQ, paraquat; DQ, diquat; HFBA, heptafluorobutyric acid; TFA: trifluoroacetic acid; AmFm, ammonium formate; AmAc, ammonium acetate.
The goal of this study was to develop methods for sensitive and selective determination of BACs, ATMACs, DDACs, PQ, DQ, DFQ, and hydroxylated/carboxylated metabolites of BACs in human serum and urine using isotope dilution LC-MS/MS. We used a mixed-mode column comprising reversed-phase, cation-exchange, and anion-exchange mechanisms to separate PQ and DQ, and reversed-phase columns for the determination of BACs, ATMACs, DDACs, DFQ, and BAC metabolites. Mass spectrometric and chromatographic conditions were optimized to eliminate interferences and improve sensitivity and selectivity, and sample purification was optimized to reduce matrix effects and improve sensitivity. The methods were evaluated and validated for sensitivity, accuracy, and precision using fortified human serum or synthetic urine and then used to analyze QACs in real human serum and urine.
2. Materials and methods
2.1. Chemicals and reagents
The names, abbreviations, and molecular structures of the target analytes are shown in Table 2 and Fig. 1. DQ, PQ, DFQ, C6-BAC, C8-BAC, C10-BAC, C12-BAC, C14-BAC, C10-DDAC, C12-DDAC, C14-DDAC, C16-DDAC, C8-ATMAC, C10-ATMAC, C12-ATMAC, C14-ATMAC, C16-ATMAC, DQ-d4, and PQ-d8 with purities ≥ 96% were purchased from Sigma-Aldrich (St. Louis, MO, USA). C16-BAC, C18-BAC, C8-DDAC, C18-DDAC, C18-ATMAC, C10-BAC-d5, C12-BAC-d7, C16-BAC-d7, C18-BAC-d7, C12-DDAC-d25, C18-DDAC-d74, C10-ATMAC-d21, C12-ATMAC-d3, and C16-ATMAC-d33 with purities ≥ 97% were from Toronto Research Chemicals (Toronto, ON, Canada). OH-BACs, COOH-BACs, OH-C10-BAC-d5, and COOH-C10-BAC-d5 with purities ≥ 95% were custom synthesized (WuXi AppTec; Tianjin, China). Ammonium formate, formic acid (88%), and ammonium hydroxide (NH4OH, 28–30%) of analytical grade were from Sigma-Aldrich (St. Louis, MO, USA). LC/MS-grade acetonitrile (ACN), methanol (MeOH), isopropanol (IPA), and water were purchased from Fisher Scientific (Waltham, MA, USA). Oasis® WCX cartridges (60 mg/3 mL) were obtained from Waters Corp. (Milford, MA, USA). Synthetic urine was from Cerilliant (Round Rock, TX, USA). Pooled human serum was from Sigma-Aldrich (St. Louis, MO, USA).
Table 2.
Target analytes, isotopically labeled internal standards, and their MRM parameters.
| Analyte name | Abbreviation | CAS | Q1 | Q3 | DP (V) | EP (V) | CE (V) | CXP (V) | Dwell (ms) |
|---|---|---|---|---|---|---|---|---|---|
| First injection | |||||||||
| Benzyldimethylhexylammonium chloride | C6-BAC | 22559-57-5 | 220 | 91 (q) | 130 | 10 | 30 | 10 | 30 |
| 128 (c) | 122 | 10 | 23 | 13 | 30 | ||||
| Benzyldimethyloctylammonium chloride | C8-BAC | 959-55-7 | 248 | 91 (q) | 100 | 10 | 35 | 15 | 30 |
| 156 (c) | 100 | 10 | 25 | 20 | 30 | ||||
| Benzyldimethyldecylammonium chloride | C10-BAC | 965-32-2 | 276 | 91 (q) | 120 | 10 | 30 | 10 | 30 |
| 184 (c) | 120 | 10 | 28 | 10 | 30 | ||||
| Benzyldimethyldodecylammonium chloride | C12-BAC | 139-07-1 | 304 | 91 (q) | 100 | 10 | 33 | 10 | 30 |
| 212 (c) | 100 | 10 | 27 | 15 | 30 | ||||
| Benzyldimethyltetradecylammonium chloride | C14-BAC | 147228-81-7 | 332 | 91 (q) | 200 | 10 | 30 | 9 | 30 |
| 240 (c) | 200 | 10 | 30 | 18 | 30 | ||||
| Benzyldimethylhexadecylammonium chloride | C16-BAC | 122-18-9 | 360 | 91 (q) | 130 | 10 | 35 | 10 | 30 |
| 268 (c) | 130 | 10 | 31 | 9 | 30 | ||||
| Benzyldimethyloctadecylammonium chloride | C18-BAC | 122-19-0 | 388 | 91 (q) | 150 | 10 | 36 | 13 | 30 |
| 296 (c) | 150 | 10 | 34 | 26 | 30 | ||||
| Dioctyldimethylammonium bromide | C8-DDAC | 3026-69-5 | 270 | 158 (q) | 150 | 10 | 32 | 14 | 30 |
| 57 (c) | 135 | 10 | 77 | 15 | 30 | ||||
| Didecyldimethylammonium bromide | C10-DDAC | 2390-68-3 | 326 | 186 (q) | 120 | 10 | 37 | 14 | 30 |
| 57 (c) | 120 | 10 | 35 | 10 | 30 | ||||
| Didodecyldimethylammonium bromide | C12-DDAC | 3282-73-3 | 382 | 214 (q) | 80 | 10 | 40 | 8 | 30 |
| 57 (c) | 80 | 10 | 75 | 8 | 30 | ||||
| Dimethylditetradecylammonium bromide | C14-DDAC | 68105-02-2 | 438 | 242 (q) | 100 | 10 | 45 | 28 | 30 |
| 57 (c) | 100 | 10 | 85 | 17 | 30 | ||||
| Dihexadecyldimethylammonium bromide | C16-DDAC | 70755-47-4 | 494 | 270 (q) | 100 | 10 | 47 | 8 | 30 |
| 57 (c) | 100 | 10 | 94 | 8 | 30 | ||||
| Dimethyldioctadecylammonium bromide | C18-DDAC | 3700-67-2 | 550 | 298 (q) | 40 | 10 | 57 | 15 | 30 |
| 57 (c) | 56 | 10 | 100 | 9 | 30 | ||||
| Octyltrimethylammonium chloride | C8-ATMAC | 10108-86-8 | 172 | 60 (q) | 120 | 10 | 25 | 10 | 30 |
| 57 (c) | 110 | 10 | 26 | 12 | 30 | ||||
| Decyltrimethylammonium bromide | C10-ATMAC | 2082-84-0 | 200 | 60 (q) | 120 | 10 | 27 | 10 | 30 |
| 57 (c) | 120 | 10 | 29 | 15 | 30 | ||||
| Dodecyltrimethylammonium chloride | C12-ATMAC | 112-00-5 | 228 | 60 (q) | 120 | 10 | 31 | 10 | 30 |
| 57 (c) | 120 | 10 | 30 | 18 | 30 | ||||
| Tetradecyltrimethylammonium chloride | C14-ATMAC | 4574-04-3 | 256 | 60 (q) | 140 | 10 | 32 | 12 | 30 |
| 57 (c) | 140 | 10 | 30 | 12 | 30 | ||||
| Hexadecyltrimethylammonium chloride | C16-ATMAC | 112-02-7 | 284 | 60 (q) | 120 | 10 | 33 | 8 | 30 |
| 57 (c) | 120 | 10 | 35 | 10 | 30 | ||||
| Octadecyltrimethylammonium chloride | C18-ATMAC | 112-03-8 | 312 | 60 (q) | 120 | 10 | 67 | 14 | 30 |
| 57 (c) | 120 | 10 | 67 | 20 | 30 | ||||
| Difenzoquat methyl sulfate | DFQ | 43222-48-6 | 249.4 | 193 (q) | 152 | 10 | 36 | 12 | 30 |
| 130 (c) | 152 | 10 | 47 | 15 | 30 | ||||
| Internal standards | |||||||||
| (Benzyl)decyldimethylammonium chloride-d5 | C10-BAC-d5 | 281 | 96 | 120 | 10 | 31 | 16 | 30 | |
| Benzyldimethyldodecylammonium chloride-d7 | C12-BAC-d7 | 311 | 98 | 127 | 10 | 33 | 15 | 30 | |
| Benzylhexadecyldimethylammonium chloride-d7 | C16-BAC-d7 | 367 | 98 | 120 | 10 | 34 | 7 | 30 | |
| Benzyldimethyloctadecylammonium chloride-d7 | C18-BAC-d7 | 395 | 98 | 120 | 10 | 36 | 15 | 30 | |
| Di-n-dodecyl-dimethylammonium bromide-d25 | C12-DDAC-d25 | 407 | 239 | 107 | 10 | 50 | 12 | 30 | |
| Dimethyldi(n-octadecyl)ammonium bromide-d74 | C18-DDAC-d74 | 625 | 337 | 153 | 10 | 67 | 24 | 30 | |
| n-Decyl-trimethylammonium bromide-d21 | C10-ATMAC-d21 | 221 | 61 | 130 | 10 | 31 | 10 | 30 | |
| Dodecyltrimethylammonium chloride-d3 | C12-ATMAC-d3 | 231 | 63 | 130 | 10 | 30 | 8 | 30 | |
| n-Hexadecyl-trimethylammonium chloride-d33 | C16-ATMAC-d33 | 317 | 61 | 240 | 10 | 65 | 8 | 30 | |
| Second injection | |||||||||
| Diquat dibromide monohydrate | DQ | 6385-62-2 | 183 | 157 (q) | 85 | 10 | 31 | 24 | 700 |
| 92 | 84.5 (c) | 85 | 10 | 20 | 10 | 700 | |||
| Paraquat dichloride hydrate | PQ | 75365-73-0 | 93 | 171 (q) | 70 | 10 | 18 | 10 | 700 |
| 185 | 169 (c) | 94 | 10 | 41 | 11 | 700 | |||
| Internal standards | |||||||||
| Diquat dibromide-d4 | DQ-d4 | 186 | 158 | 85 | 10 | 31 | 24 | 700 | |
| Paraquat dichloride hydrate-d8 | PQ-d8 | 97 | 179 | 70 | 10 | 18 | 10 | 700 | |
| Third injection | |||||||||
| ω-Hydroxyl-benzyldimethylhexylammonium chloride | OH-C6-BAC | 236 | 91 (q) | 100 | 35 | 10 | 4 | 30 | |
| 144 (c) | 90 | 27 | 10 | 8 | 30 | ||||
| ω-Hydroxyl-benzyldimethyloctylammonium chloride | OH-C8-BAC | 264 | 91 (q) | 100 | 37 | 10 | 10 | 30 | |
| 172 (c) | 120 | 29 | 10 | 9 | 30 | ||||
| ω-Hydroxyl-benzyldimethyldecylammonium chloride | OH-C10-BAC | 292 | 91 (q) | 110 | 35 | 10 | 12 | 30 | |
| 200 (c) | 110 | 31 | 10 | 12 | 30 | ||||
| ω-Hydroxyl-benzyldimethyldodecylammonium chloride | OH-C12-BAC | 320 | 91 (q) | 120 | 46 | 10 | 16 | 30 | |
| 228 (c) | 120 | 32 | 10 | 13 | 30 | ||||
| ω-Carboxylic acid-benzyldimethylhexylammonium chloride | COOH-C6-BAC | 250 | 91 (q) | 70 | 34 | 10 | 10 | 30 | |
| 158 (c) | 100 | 26 | 10 | 26 | 30 | ||||
| ω-Carboxylic acid-benzyldimethyloctylammonium chloride | COOH-C8-BAC | 278 | 91 (q) | 93 | 42 | 10 | 12 | 30 | |
| 186 (c) | 92 | 29 | 10 | 26 | 30 | ||||
| ω-Carboxylic acid-benzyldimethyldecylammonium chloride | COOH-C10-BAC | 306 | 91 (q) | 104 | 37 | 10 | 13 | 30 | |
| 214 (c) | 129 | 31 | 10 | 13 | 30 | ||||
| ω-Carboxylic acid-benzyldimethyldodecylammonium chloride | COOH-C12-BAC | 334 | 91 (q) | 102 | 41 | 10 | 11 | 30 | |
| 242 (c) | 120 | 34 | 10 | 12 | 30 | ||||
| Internal standards | |||||||||
| ω-Hydroxyl-benzyldimethyldecylammonium-d5 chloride | OH-C10-BAC-d5 | 294 | 96 | 100 | 38 | 10 | 18 | 30 | |
| ω-Carboxylic acid-benzyldimethyldecylammonium-d5 chloride | COOH-C10-BAC-d5 | 311 | 96 | 108 | 39 | 10 | 15 | 30 |
Two transitions were optimized for each analyte, one for quantification (q) and the other for confirmation (c), and one transition was optimized for each internal standard. MRM parameters include precursor ion (Q1), product ion (Q3), declustering potential (DP), entrance potential (EP), collision energy (CE), collision cell exit potential (CXP), and dwell time.
Anonymous serum samples collected in New York City during 2002–2003, from 10 volunteers that were archived in our laboratory from a previous study and 20 urine samples collected from individuals in New York City in May–June 2022 were analyzed to test the application of the developed method to real samples. The samples were deidentified and therefore fell under the exempt category for institutional review board approval.
2.2. Preparation of standard solutions
Individual stock solutions (1 mg/mL) of DQ, PQ, and DFQ were prepared in water and were further diluted with water to a concentration of 10 μg (cation)/mL. Individual stock solutions (1 mg/mL) of BACs, ATMACs, and DDACs were prepared in MeOH and were further diluted to 10 μg (cation)/mL using MeOH. Individual stock solutions (1 mg/mL) of OH- and COOH-BACs were prepared in ACN:water (50:50, v/v) and were further diluted to 10 μg (cation)/mL using ACN:water (50:50, v/v). Working solutions were diluted from stock solutions using ACN:water (60:40, v/v). All solutions were prepared and stored in polypropylene (PP) tubes to prevent adsorption loss.
2.3. Preparation of urine samples
A 250-μL aliquot of a urine sample was pipetted into a 15-mL PP centrifuge tube. Synthetic urine fortified with target analytes (at concentrations of 1, 5, and 20 ng/mL) was used for method development and validation. Isotopically labeled internal standards (2.5 ng each) were spiked into each sample. The sample was vortexed vigorously and kept at room temperature for 30 min. The mixture was then loaded onto an Oasis® WCX cartridge (60 mg/3 mL) which had been preconditioned with 2 mL MeOH and 2 mL water. The cartridge was then washed successively with 2 mL water, 2 mL water:MeOH (1:1, v/v), and 2 mL MeOH and dried for 3 min using a vacuum pump. The analytes were then eluted into a 15-mL PP tube using 3 mL MeOH containing 3% formic acid (v/v). The eluate was evaporated to dryness under gentle N2 at 40 °C. The residue was reconstituted in 250 μL of ACN:water (60:40, v/v) mixture, vortexed, and transferred into an amber glass vial with a plastic insert. Finally, 5 μL of the extract was injected into an LC-MS/MS instrument for the combined analysis of BACs, DDACs, ATMACs, and DFQ; 5 μL was injected for OH- and COOH-BAC analysis; and 4 μL was injected for PQ and DQ analysis.
2.4. Preparation of serum samples
An aliquot of 500 μL pooled human serum from Sigma-Aldrich was transferred into a 15-mL PP tube. The serum was fortified with target analytes (at concentrations of 1, 5, and 20 ng/mL) for method development and validation. Isotopically labeled internal standards (2.5 ng each) were also spiked into each sample. After addition of 2 mL ACN, the serum sample was sonicated for 30 min and then shaken in an orbital shaker at 250 oscillations/min for 30 min. The mixture was centrifuged at 4000 rpm for 5 min, and the supernatant was decanted into a new 15-mL PP tube. The extraction was repeated twice with 2 mL ACN:water (60:40, v/v). The extracts were combined and then concentrated to ~ 3 mL. The mixture was further purified using Oasis WCX cartridges as described above.
2.5. LC-MS/MS analysis
Quantitative determination of target analytes was achieved using an ABSciex 5500 Q-trap mass spectrometer (Framingham, MA, USA) coupled to a Shimadzu LC-30 AD ultra-high-performance liquid chromatography (Shimadzu Corp., Kyoto, Japan). Three separate injections were performed with different LC columns to obtain optimal performance. The LC separation of PQ and DQ was accomplished using an Acclaim™ Trinity Q1 column (100 × 2.1 mm, 3 μm; Thermo Fisher Scientific, Waltham, MA, USA) connected to a Betasil C18 guard column (20 × 2.1 mm, 5 μm; Thermo Fisher Scientific, Waltham, MA, USA). Target analytes were eluted isocratically using 25% ammonium formate (100 mM, pH 5.0) and 75% ACN for 11 min with a mobile-phase flow rate of 0.35 mL/min. The IonSpray voltage was set at 1.0 kV and the ion source temperature was maintained at 600 °C.
The chromatographic separation of BACs, ATMACs, DDACs, and DFQ was achieved using an Agilent XDB C8 column (100 × 3 mm, 3.5 μm; Agilent, Santa Clara, CA, USA) connected to a Betasil C18 guard column (20 × 2.1 mm, 5 μm; Thermo Fisher Scientific, Waltham, MA, USA). The mobile phases were 5 mM ammonium formate containing 0.1% formic acid (eluent A) and ACN:IPA (40:60, v/v) containing 0.1% formic acid (eluent B) with the following gradient program: 10% B held for 0.1 min, linear ramps to 80% B in 0.9 min and then to 95% B in 8 min, a hold at 95% B for 0.5 min, then a return to initial conditions in over 0.5 min, and equilibration for another 0.5 min prior to the next injection. The mobile-phase flow rate was 0.35 mL/min. The IonSpray voltage was set at 5.5 kV and the ion source temperature was maintained at 500 °C.
The chromatographic separation of OH- and COOH-BACs was achieved using an Ultra AQ C18 column (100 × 2.1 mm, 3 μm; Restek, Bellefonte, PA, USA) connected to a BetaSil C18 guard column (20 × 2.1 mm, 5 μm; Thermo Fisher Scientific, Waltham, MA, USA). The mobile phases were 5 mM ammonium formate containing 0.1% formic acid (eluent A) and ACN:IPA (40:60, v/v) containing 0.1% formic acid (eluent B). The following gradient program was applied: hold at 10% B for 0.5 min, linear ramp to 95% over 6.5 min, hold at 95% B for 2 min, then return to the initial condition over 0.5 min, and equilibrate for another 1 min before the next injection. The mobile-phase flow rate was 0.3 mL/min. The IonSpray voltage was set at 5.5 kV and the ion source temperature was maintained at 500 °C. For all methods, the column temperature and autosampler temperature were maintained at 30 °C and 15 °C, respectively. All analytes were determined using electrospray ionization (ESI) multiple reaction monitoring (MRM) positive mode. Curtain gas and collision gas flow rates were maintained at 20 and 9 psi, respectively; ion source gases 1 and 2 were set at 70 and 60 psi, respectively. The optimized MRM parameters including declustering potential (DP), collision energy (CE), and collision cell exit potential (CXP), and dwell times for all the target analytes and internal standards are shown in Table 2.
2.6. Method validation
Calibration curves were prepared both with solvent and with fortified human serum and synthetic urine. Calibration standards ranging in concentrations from 0.05 to 150 ng/mL, with 10 ng/mL of internal standards, were prepared in ACN:water (60:40, v/v). Matrix-matched calibration curves were prepared by spiking QACs into urine and serum extract at a variety of concentrations in the range of 0.05–150 ng/mL.
The sensitivity of the method was evaluated from the instrument limits of detection and quantification (ILOD and ILOQ) and method limits of detection and quantification (MLOD and MLOQ). ILOD and ILOQ were defined as the lowest concentrations of an analyte in solvent that produced a peak with a signal-to-noise ratio (S/N) of 3 and 10, respectively. In order to calculate the MLODs and MLOQs, fortification of the target analytes was performed in eight pooled human serum (at 1 ng/mL) or synthetic urine samples (at 0.5 ng/mL). MLOD and MLOQ were defined as three and ten times the standard deviation (SD), respectively.
The matrix effect was determined as the percentage of signal enhancement or suppression, as shown in Eq. (1):
| (1) |
where A and B are the slopes of the calibration curves in urine or serum matrix and in solvent, respectively.
We assessed the accuracy of the method based on the recoveries of target analytes spiked into serum and urine matrix, which were performed at low (1 ng/mL), medium (5 ng/mL), and high (20 ng/mL) concentrations. The precision/trueness of the method was evaluated from intra-day and inter-day variations, which were calculated as the coefficient of variation (CV%) in the measured concentrations in three pooled human serum or synthetic urine samples (fortified at 1, 5, and 20 ng/mL). The inter-day CV was measured from repeated injection of fortified samples on three different days.
3. Results and discussion
3.1. Chromatographic separation of PQ and DQ
Studies reporting LC-MS/MS methods for the analysis of PQ and DQ in human urine are summarized in Table 1. We were not able to separate PQ and DQ on traditional reversed-phase columns due to their high polarity. However, we found that addition of ion-pair reagents in mobile phases improved chromatographic retention and separation of these two herbicides. First, we used an Agilent XDB C8 column along with water/ACN, containing the ion-pair reagent heptafluorobutyric acid (HFBA), as mobile phases. This resulted in improved retention and peak shape of PQ and DQ, but chromatographic separation was not achieved (Fig. S1). Furthermore, residual ion-pair reagent in the LC system suppressed the ionization of other target analytes [44]. An earlier study used HILIC column to separate PQ and DQ [40] and that method required 250 mM ammonium formate (pH 3.7) as an additive in the mobile phase. Mixed-mode LC columns exhibit multiple functionalities and have been shown to provide improved retention of DQ and PQ [43, 45, 46]. We found that Acclaim™ mixed-mode HILIC-1 column (with a combination of reversed-phase and HILIC) offered optimal retention and acceptable peak shape for PQ and DQ (Fig. S2). However, this did not result in adequate baseline separation, as was also reported in an earlier study [46]. Given the complex and often unpredictable ionization patterns of PQ and DQ, we deemed baseline separation to be essential for accurate quantification.
The Acclaim™ Trinity Q1 LC column provided baseline separation and acceptable peak shape of PQ and DQ (Fig. 2). This mixed-mode column provides multiple retention mechanisms, including reversed-phase, cation-exchange, and anion-exchange, to enhance chromatographic separation. The cation-exchange function enables separation of PQ and DQ, while the anion-exchange mechanism may deactivate the undesirable interaction between analytes and silanols. Using this column, we examined several mobile-phase flow rates and combinations. Use of ammonium formate as an additive (relative to the use of ammonium acetate) increased the intensities of the PQ and DQ signals. Increasing the ammonium formate concentration shortened the retention time and improved the peak shape. We found that an isocratic elution of the mobile phase containing 100 mM ammonium formate (pH 5.0):ACN (25:75, v/v) yielded optimal separation, peak shape, retention time, and sensitivity. However, even under these optimal conditions, PQ and DQ exhibited broad and tailing peaks (Fig. 2), which was consistent with those reported in an earlier study involving determination of PQ and DQ in potato samples [42]. This was considered acceptable because of the high sensitivity of the method for trace analysis of PQ and DQ in human serum and urine.
Fig. 2.
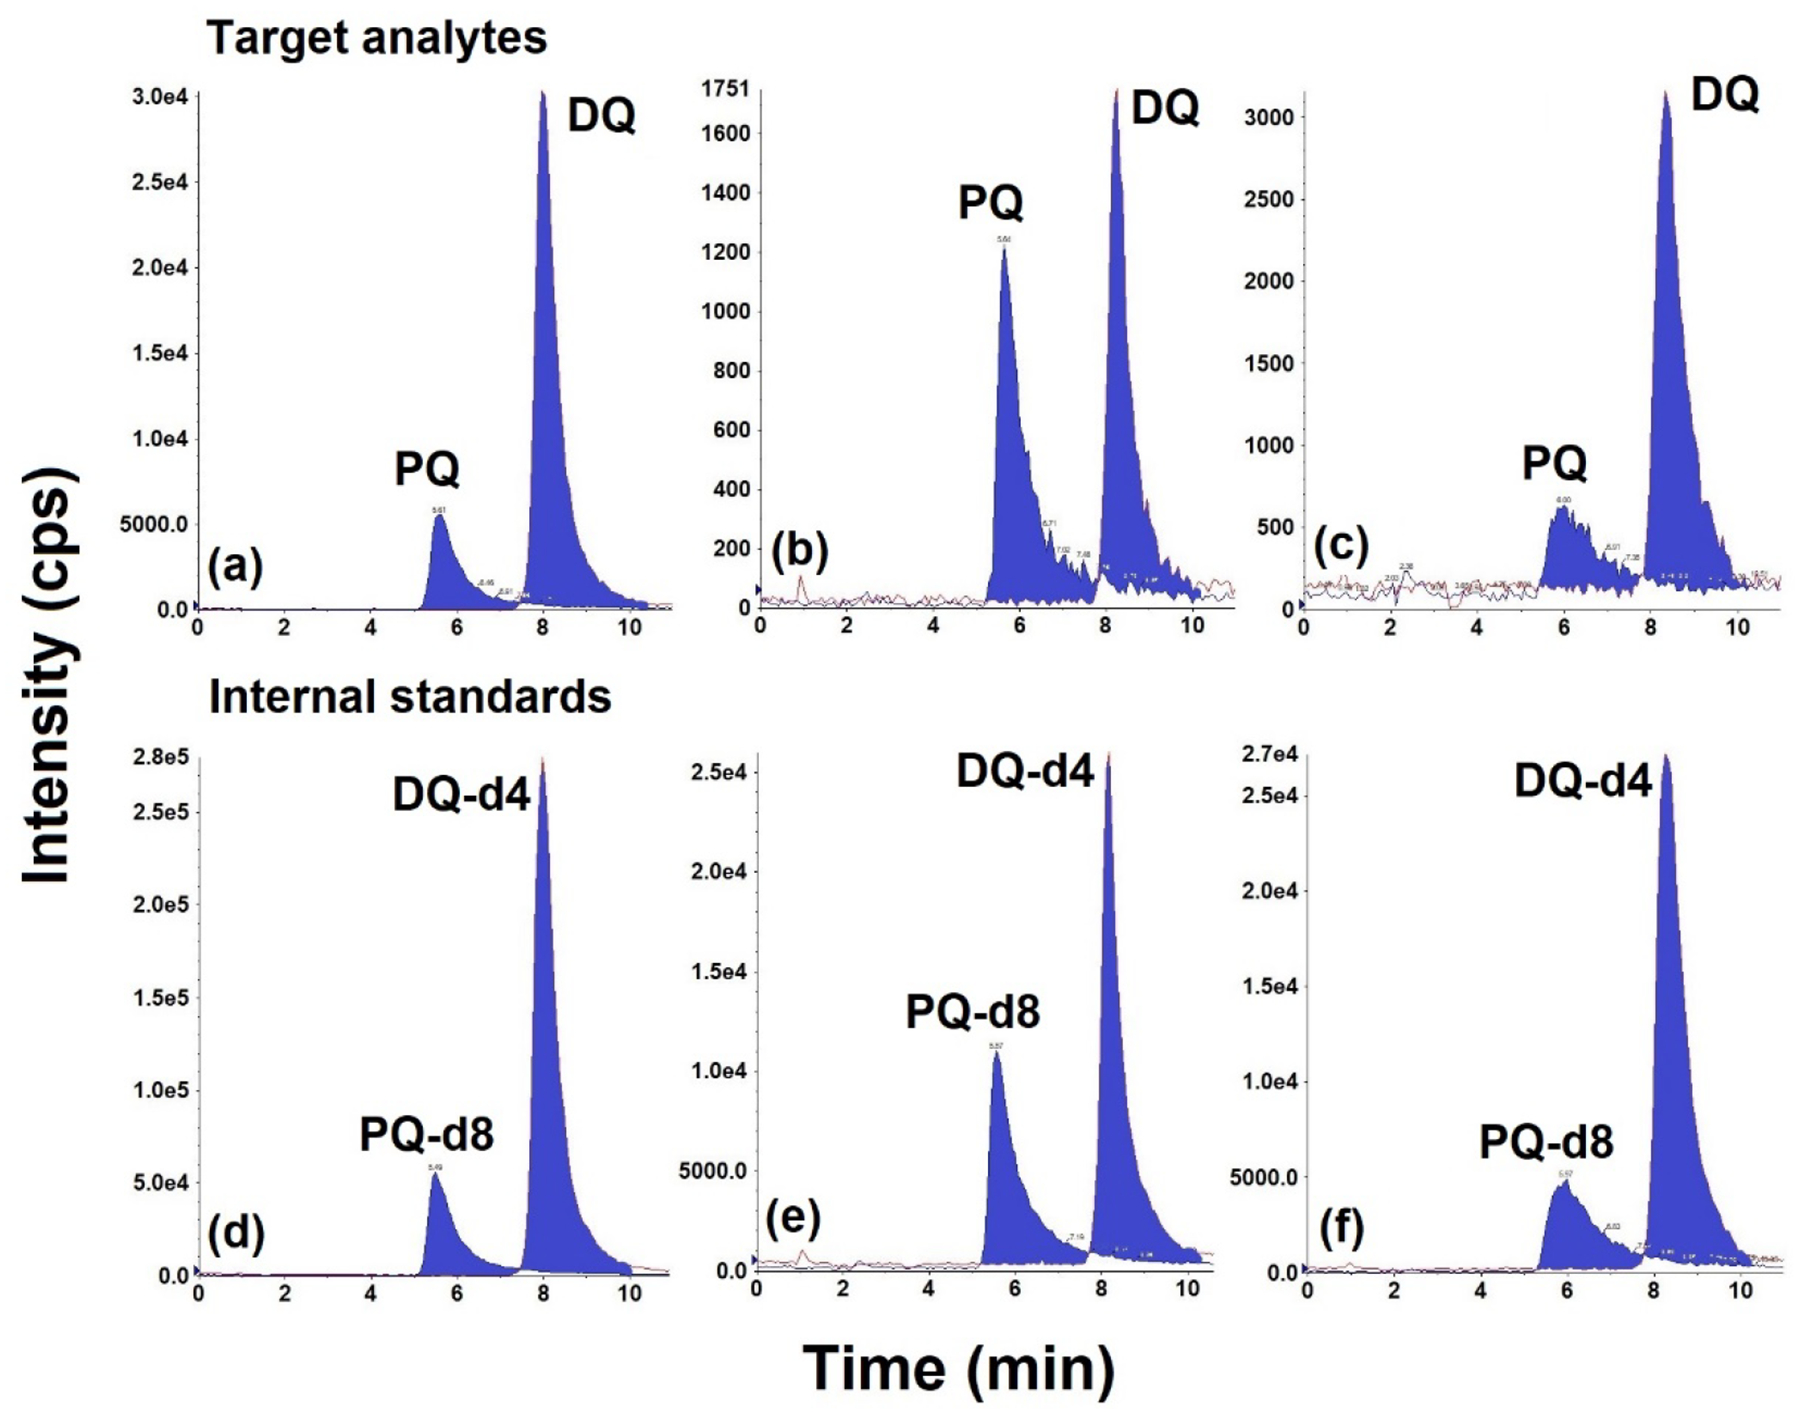
Representative chromatograms of paraquat (PQ) and diquat (DQ) in solvent and urine/serum matrix. PQ and DQ (1 ng/mL each) in (a) solvent; (b) fortified synthetic urine; and (c) fortified pooled human serum. Internal standards containing PQ-d8 and DQ-d4 (10 ng/mL each) in (d) solvent; (e) fortified synthetic urine; and (f) fortified human serum. Injection volume: 4 μL.
3.2. Mass spectrometric detection of PQ and DQ
PQ and DQ exhibited complex fragmentation pattern and mass spectrometric behavior [31]. Radical cations M+• (m/z 184 for DQ and 186 for PQ), singly charged cations [M-H]+ (m/z 183 for DQ and 185 for PQ), and dications [M2+] (m/z 92 for DQ and 93 for PQ) have been reported for these two herbicides in the literature [31]. Earlier studies typically used m/z 183/170 [46], 183/168 [37], 183/165 [38], 183/157 [47, 48], 183/150 [38], 183/130 [40], 184/168 [49] and 184/157 [49] for the analysis of DQ, and m/z 185/171 [38], 185/170 [37], 185/169 [50], 185/167 [38], 185/166 [38], 185/158 [37] , and 186/171 [49] for the analysis of PQ. Interference of ions of PQ and DQ at certain MRM transitions has been reported [46].
We first examined the mass fragmentation pattern of PQ and DQ obtained on an ABSciex 5500 Q-trap mass spectrometer by direct infusion of standard solution (100 ng/mL) via a syringe pump. We observed four transitions for DQ (m/z 183/157, 183/130, 183/78, and 92/84.5) and eight transitions for PQ (m/z 93/171, 171/155, 171/103, 171/77, 186/171, 185/170, 185/169, and 185/158) at high intensities. We also found cross-interferences of mass transitions between PQ and DQ. Mass transitions m/z 185/170, 185/169, and 185/158 of PQ showed two peaks, the second of which exhibited the same retention time for DQ (Fig. S3); these were likely produced by DQ. For example, the 13C isotope [DQ+1]+• (m/z 185) can produce a fragment ion of m/z 170 by losing a CH3• [46]. Nevertheless, m/z 93/171 ([PQ2+-CH3+]+) and 186/169 ([PQ2+-CH4-H+]+) for PQ and m/z 183/157 ([DQ2+-CNH+•]+•) and 92/84.5 ([DQ2+-CH3]2+) for DQ each exhibited only one peak with high intensities (Fig. 2). Therefore, we used these specific transitions for the detection of PQ and DQ in our method. We used the most abundant transitions, m/z 93/171 (PQ) and 183/157 (DQ), for quantification and m/z 185/169 (PQ) and 92/84.5 (DQ) for confirmation. In contrast to our results, an earlier study had reported the highest abundance of m/z 92/84.5 for DQ, while 183/157 exhibited interferences [46], a difference that can be explained by the different instruments and mobile phases used.
We also investigated the effects of IonSpray voltage and ion source temperature on the intensities of PQ and DQ. The highest intensities were obtained at an uncommon and low IonSpray voltage of 1.0 kV, which is probably due to the strongly ionic nature of PQ and DQ [46]. The intensities of PQ and DQ also increased with the ion source temperature (Fig. S4), and we selected an optimal temperature of 600 °C. Other parameters were optimized by direct infusion of standard solution (100 ng/mL) into the mass spectrometer.
3.3. Chromatography and mass spectrometry of BACs, ATMACs, DDACs, DFQ, and BAC metabolites
Although the Acclaim™ Trinity Q1 column provided good chromatographic separation of PQ and DQ, other QACs, namely BACs, ATMACs, DDACs, and DFQ, exhibited poor peak shape and separation on this column, likely due to their non-polar properties. We therefore compared the performance of reversed-phase columns (C8 and C18) for the separation of BACs, ATMACs, DDACs and DFQ. On C18 columns, DDACs required long retention times (>30 min) and exhibited carry-over, likely due to the strong affinities of these compounds to C18 sorbents. The Agilent XDB C8 column (100 × 3 mm, 3.5 μm) provided excellent peak shape and resolution, with C16-DDAC and C18-DDAC exhibiting retention times of >20 min. As reported in earlier studies [5, 51], we found that including IPA in mobile phase B shortened the retention of both compounds. Throughout, ACN/IPA (40:60, v/v) was used as mobile phase B. We also optimized the additive concentrations and pH of mobile phase A, the flow rate, and the column temperature. In particular, inclusion of 5 mM ammonium formate in mobile phase A improved the peak shape and analyte intensities, while inclusion of 0.1% formic acid further improved the resolution. Following the optimization of several LC parameters, all analytes exhibited excellent peak shape and intensities, and the retention times of all analytes were <10 min (Figs. 3, S5 & S6). The MRM parameters of BACs, ATMACs, DDACs, and DFQ were optimized through the infusion of a standard solution (100 ng/mL) directly into the mass spectrometer; the optimized parameters are shown in Table 2.
Fig. 3.
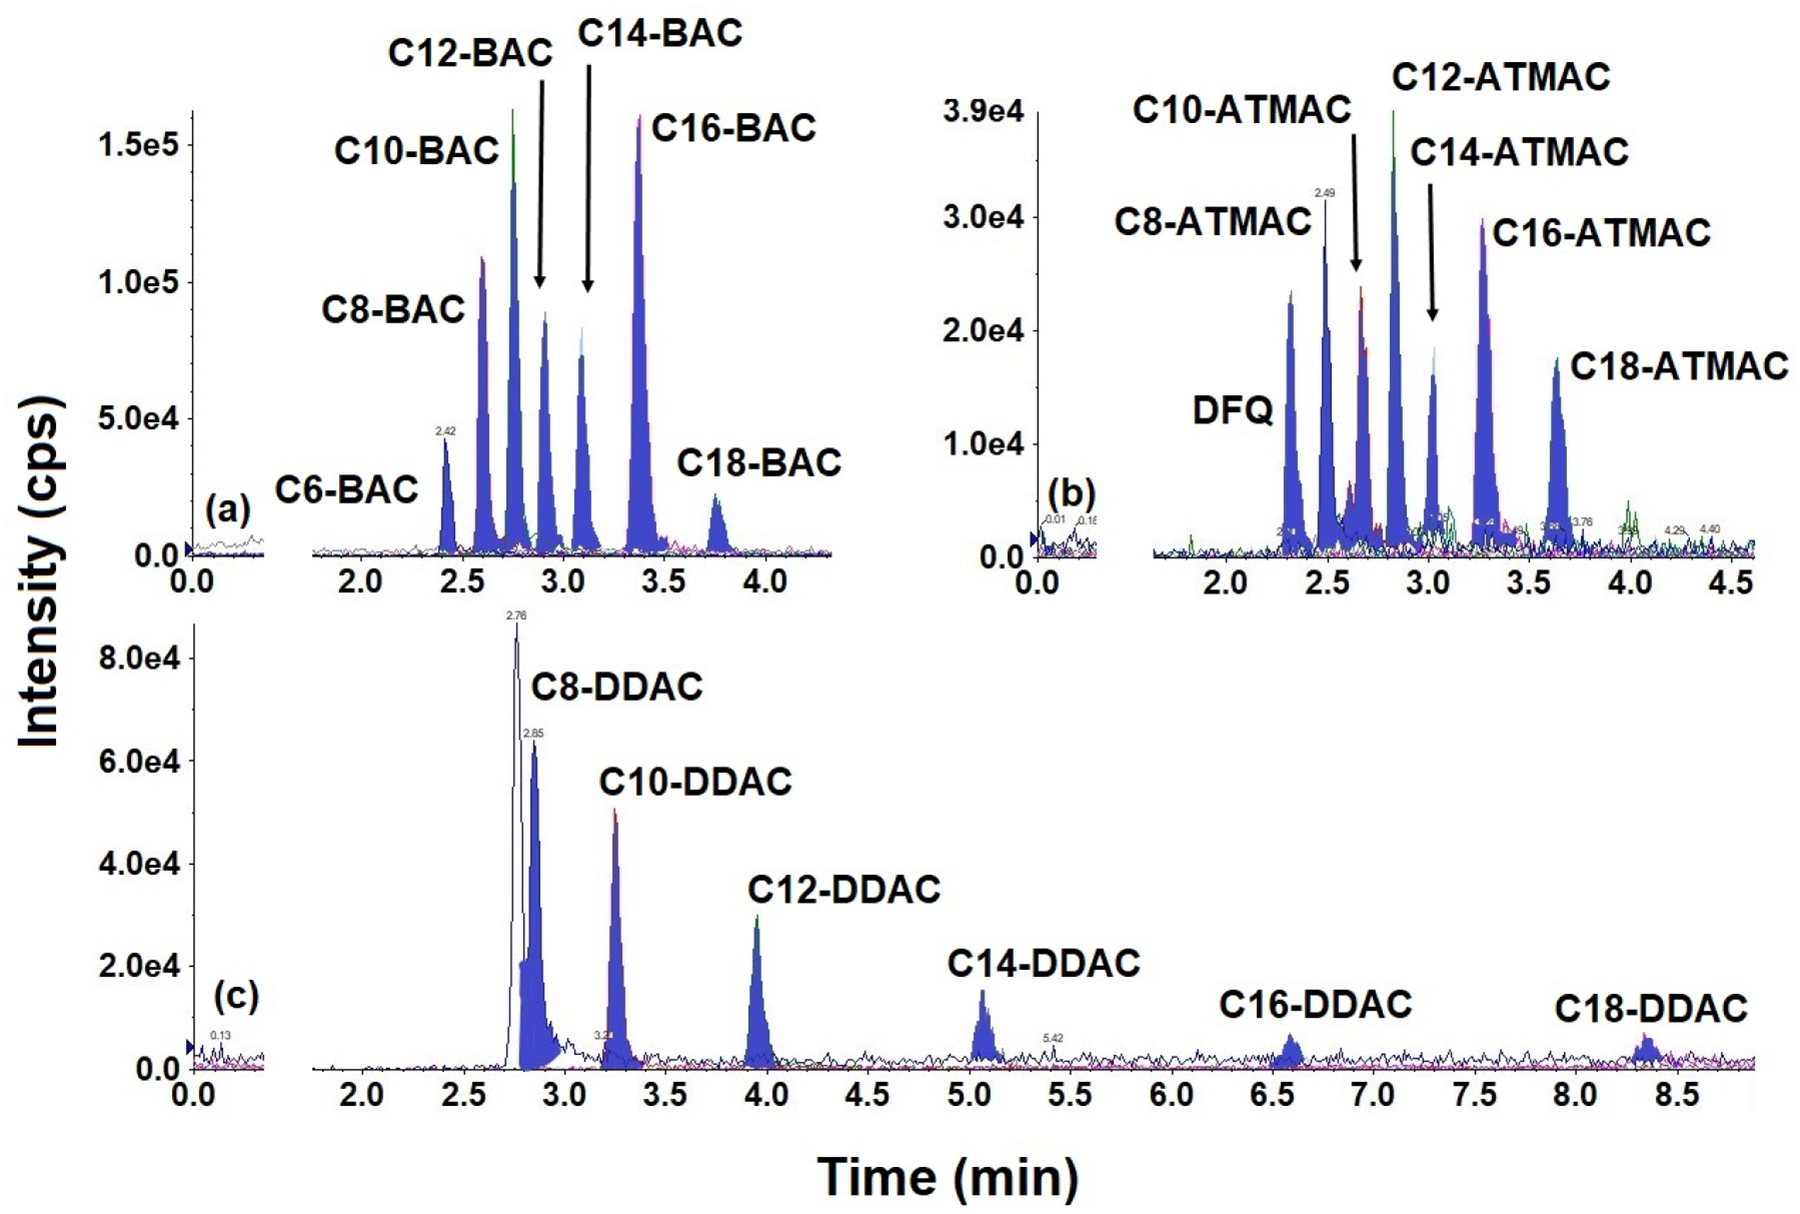
Representative chromatograms of benzalkyldimethylammonium compounds (BACs), alkyltrimethylammonium compounds (ATMACs), dialkyldimethylammonium compounds (DDACs), and difenzoquat (DFQ) in pooled human serum fortified at 1 ng/mL. (a–c) Extracted ion chromatograms of (a) BACs; (b) ATMACs and DFQ; and (c) DDACs are presented individually to differentiate the analytes. Injection volume: 5 μL
Although OH- and COOH-BACs exhibited good peak shapes on Agilent XDB C8 column, they were not chromatographically separated (Fig. S7). Alternatively, OH- and COOH-BACs were determined on a C18 column using the same mobile phases as those of their parent compounds, which yielded adequate chromatographic resolution (Figs. 4 & S8).
Fig. 4.
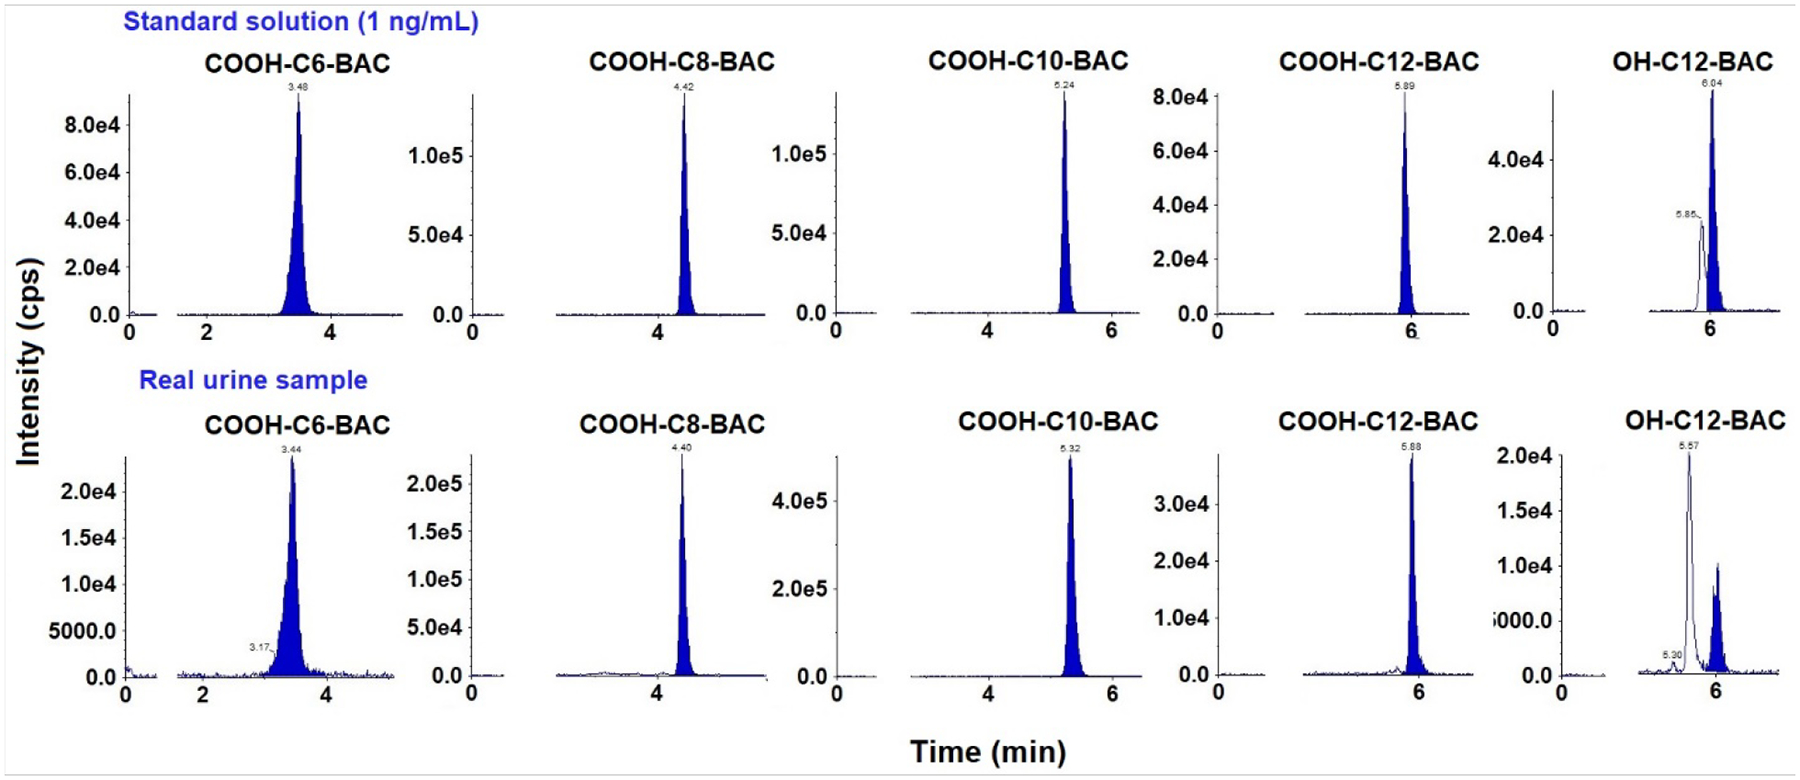
Representative chromatograms of COOH-C6-BAC, COOH-C8-BAC, COOH-C10-BAC, COOH-C12-BAC, and OH-C12-BAC spiked in synthetic urine (at 1 ng/mL) and real human urine samples. Injection volume: 5 μL.
3.4. Optimization of sample preparation
Since QACs are permanently positively charged, weak cation-exchange cartridges, which have negatively charged sorbents that bind to positively charged analytes, are suitable for their extraction and purification. Oasis® WCX cartridges have been used for the analysis of QACs in environmental and human matrices [4, 10, 40]. Indeed, we found that Oasis® WCX cartridges could efficiently remove matrix interferences and prevent matrix effects. An earlier study reported the addition of 5% NH4OH into blood extract prior to loading onto WCX cartridges [10]. However, we found that sample basification can lead to high recoveries of certain target analytes (i.e., the recoveries of DFQ, C8-BAC, and C10-BAC were 180–250%). Therefore, in our study, we loaded serum and urine samples onto Oasis WCX cartridges without basification. All analytes exhibited well-resolved peaks with acceptable accuracies (61–129%).
3.5. Method validation
We assessed the linearity of the instrumental response to target analytes by injecting standard solutions prepared in both solvent and serum/urine matrix at concentrations between 0.05 and 150 ng/mL. All analytes exhibited excellent linearity in solvent, in serum matrix, and in urine matrix, with R values > 0.99 (Tables 3, S2 & S3).
Table 3.
Regression coefficient (R) of the calibration curve, method limit of detection (MLOD), method limit of quantification (MLOQ), spike recoveries (%), and intra-day and inter-day precision (CV%) of the optimized method for the determination of quaternary ammonium compounds in human serum and urine.
| 1 ng/mL | 5 ng/mL | 20 ng/mL | |||||||||||
|---|---|---|---|---|---|---|---|---|---|---|---|---|---|
| CV% | CV% | CV% | |||||||||||
| Analytes | R | MLOD | MLOQ | ME% | Recovery% | Intra-day | Inter-day | Recovery % | Intra-day | Inter-day | Recovery % | Intra-day | Inter-day |
| Human serum | |||||||||||||
| C6-BAC | 0.9996 | 0.19 | 0.63 | −11.6 | 72.7 ± 6.8 | 9.32 | 9.75 | 75.0 ± 2.8 | 3.70 | 4.74 | 75.5 ± 3.3 | 4.34 | 7.07 |
| C8-BAC | 0.9992 | 0.11 | 0.38 | −7.66 | 92.3 ± 2.6 | 2.79 | 4.94 | 89.4 ± 4.7 | 5.30 | 5.78 | 86.3 ± 1.6 | 1.86 | 6.71 |
| C10-BAC | 0.9990 | 0.13 | 0.44 | −2.80 | 103 ± 3 | 2.44 | 3.33 | 98.9 ± 4.3 | 4.32 | 4.30 | 95.5 ± 4.3 | 4.48 | 5.68 |
| C12-BAC | 0.9994 | 0.26 | 0.88 | −9.68 | 102 ± 17 | 16.4 | 1.81 | 88.6 ± 7.7 | 8.73 | 3.56 | 90.7 ± 2.8 | 3.13 | 4.69 |
| C14-BAC | 0.9990 | 0.27 | 0.91 | −12.7 | 118 ± 15 | 12.3 | 10.4 | 84.0 ± 7.8 | 9.22 | 8.07 | 81.1 ± 6.1 | 7.54 | 7.23 |
| C16-BAC | 0.9999 | 0.29 | 0.98 | 4.46 | 129 ± 15 | 11.2 | 1.52 | 114 ± 12 | 10.7 | 3.52 | 106 ± 4 | 3.41 | 1.37 |
| C18-BAC | 0.9995 | 0.17 | 0.58 | −11.5 | 94.0 ± 2.4 | 2.51 | 4.72 | 94.4 ± 7.1 | 7.49 | 0.86 | 97.7 ± 2.8 | 2.82 | 2.15 |
| C8-DDAC | 0.9973 | 0.15 | 0.48 | 7.13 | 106 ± 7 | 6.84 | 4.50 | 120 ± 5 | 4.20 | 5.41 | 112 ± 5 | 4.81 | 2.31 |
| C10-DDAC | 0.9979 | 0.09 | 0.30 | 15.4 | 119 ± 1 | 0.84 | 5.89 | 127 ± 2 | 1.25 | 2.32 | 119 ± 10 | 8.07 | 7.26 |
| C12-DDAC | 0.9993 | 0.13 | 0.43 | 12.1 | 118 ± 3 | 2.14 | 2.94 | 113 ± 5 | 4.10 | 0.35 | 112 ± 2 | 1.43 | 1.78 |
| C14-DDAC | 0.9998 | 0.21 | 0.71 | 6.91 | 89.2 ± 7.3 | 8.14 | 3.22 | 97.4 ± 8.9 | 9.13 | 3.30 | 77.3 ± 8.5 | 11.0 | 3.46 |
| C16-DDAC | 0.9991 | 0.32 | 1.07 | −0.50 | 63.5 ± 6.6 | 10.3 | 5.44 | 81.1 ± 9.6 | 11.8 | 5.61 | 67.5 ± 8.5 | 14.7 | 11.3 |
| C18-DDAC | 0.9988 | 0.42 | 1.40 | −5.56 | 101 ± 9 | 8.98 | 7.66 | 118 ± 20 | 16.6 | 2.83 | 106 ± 10 | 9.04 | 1.70 |
| C8-ATMAC | 0.9969 | 0.24 | 0.81 | 9.30 | 90.2 ± 3.5 | 3.91 | 16.3 | 95.5 ± 0.6 | 0.64 | 10.3 | 102 ± 5 | 4.41 | 12.1 |
| C10-ATMAC | 0.9987 | 0.25 | 0.83 | 3.46 | 108 ± 15 | 13.9 | 7.07 | 101 ± 4 | 4.23 | 1.33 | 113 ± 1 | 1.12 | 5.85 |
| C12-ATMAC | 0.9994 | 0.20 | 0.66 | 10.4 | 96.3 ± 3.8 | 3.93 | 6.09 | 118 ± 10 | 8.86 | 7.08 | 115 ± 5 | 3.97 | 1.42 |
| C14-ATMAC | 1.0000 | 0.24 | 0.79 | 11.8 | 98.2 ± 11.0 | 11.2 | 3.85 | 121 ± 9 | 7.54 | 4.98 | 114 ± 2 | 1.66 | 0.80 |
| C16-ATMAC | 0.9998 | 0.21 | 0.64 | −2.45 | 98.7 ± 10.4 | 10.5 | 12.9 | 108 ± 16 | 15.1 | 3.10 | 106 ± 2 | 1.52 | 0.99 |
| C18-ATMAC | 0.9997 | 0.13 | 0.44 | 2.62 | 85.2 ± 5.3 | 6.18 | 3.24 | 91.5 ± 8.9 | 9.67 | 3.98 | 98.7 ± 7.3 | 7.34 | 1.82 |
| DFQ | 0.9986 | 0.28 | 0.92 | −4.74 | 101 ± 11 | 10.8 | 3.27 | 107 ± 12 | 11.1 | 2.05 | 110 ± 9 | 8.41 | 4.40 |
| PQ | 0.9996 | 0.09 | 0.31 | 1.92 | 103 ± 4 | 4.07 | 1.79 | 103 ± 0 | 0.22 | 1.54 | 102 ± 2 | 1.86 | 0.76 |
| DQ | 0.9996 | 0.06 | 0.19 | −0.92 | 104 ± 3 | 2.41 | 4.63 | 104 ± 0 | 0.33 | 7.56 | 103 ± 1 | 1.29 | 6.08 |
| Human urine | |||||||||||||
| PQ | 0.9999 | 0.05 | 0.20 | 0 | 92.2 ± 3.3 | 3.57 | 8.27 | 102 ± 1 | 1.18 | 1.03 | 101 ± 1 | 1.03 | 0.85 |
| DQ | 0.9997 | 0.04 | 0.20 | 2.73 | 112 ± 5 | 4.14 | 8.65 | 118 ± 5 | 3.91 | 10.3 | 123 ± 5 | 3.98 | 11.4 |
| DFQ | 0.9988 | 0.03 | 0.10 | 5.31 | 111 ± 2 | 1.80 | 4.32 | 114 ± 4 | 3.70 | 4.87 | 113 ± 4 | 3.59 | 5.37 |
| OH-C6-BAC | 0.9997 | 0.004 | 0.015 | 3.70 | 94.3 ± 3.5 | 3.66 | 6.47 | 82.5 ± 4.1 | 5.03 | 3.88 | 92.7 ± 3.0 | 3.24 | 2.76 |
| OH-C8-BAC | 0.9995 | 0.002 | 0.006 | −1.70 | 101 ± 1 | 1.35 | 2.35 | 72.1 ± 5.0 | 6.87 | 4.06 | 101 ± 1 | 0.99 | 4.32 |
| OH-C10-BAC | 0.9998 | 0.007 | 0.025 | −16.5 | 87.5 ± 1.9 | 2.21 | 5.48 | 65.5 ± 3.2 | 4.91 | 4.42 | 87.3 ± 2.2 | 2.52 | 3.40 |
| OH-C12-BAC | 0.9999 | 0.002 | 0.008 | −26.9 | 75.5 ± 2.3 | 3.10 | 13.8 | 60.6 ± 3.3 | 5.49 | 8.23 | 76.6 ± 1.4 | 1.78 | 9.08 |
| COOH-C6-BAC | 0.9996 | 0.002 | 0.008 | −4.60 | 108 ± 6 | 5.65 | 1.76 | 105 ± 2 | 1.77 | 4.75 | 102 ± 5 | 4.63 | 2.55 |
| COOH-C8-BAC | 0.9999 | 0.006 | 0.020 | −13.3 | 93.8 ± 4.0 | 4.31 | 2.33 | 88.0 ± 4.3 | 4.90 | 2.76 | 90.8 ± 2.8 | 3.03 | 4.00 |
| COOH-C10-BAC | 0.9999 | 0.008 | 0.028 | −5.00 | 78.2 ± 2.4 | 3.10 | 10.5 | 81.8 ± 3.0 | 3.62 | 2.60 | 74.3 ± 2.5 | 3.31 | 9.80 |
| COOH-C12-BAC | 0.9999 | 0.003 | 0.010 | −24.0 | 73.8 ± 0.9 | 1.15 | 17.3 | 79.8 ± 3.1 | 3.94 | 3.70 | 70.3 ± 4.1 | 5.78 | 13.8 |
Abbreviations: MLOD, method limit of detection; MLOQ, method limit of quantification; CV, coefficient of variation.
We determined the accuracy of the method by calculating recoveries of analytes fortified at three different levels (1, 5, and 20 ng/mL) in pooled human serum and synthetic urine. In human serum, the recoveries of all analytes at three fortification levels were in the range of 64–129%, 71–127%, and 68–119%, respectively, and the standard deviations (SD) of triplicate analyses were 1–17%, 0–20%, and 1–11%, respectively (Tables 3 & S3). In synthetic urine, the recoveries of all analytes at the three fortification levels were in the range of 72–125%, 61–127%, and 70–128%, respectively, and the SD of triplicate analyses were 1–16%, 1–15%, and 1–9%, respectively (Tables 3 & S2). The low recoveries found for C16-DDAC and OH-C12-BAC can be explained by the lack of corresponding isotopically labelled internal standards for these compounds.
We calculated the precision of the method as the intra-day and inter-day variations found upon repeated analysis of fortified human serum and urine (Tables 3, S2 & S3). In human serum, the intra-day CVs of target analytes fortified at 1, 5, and 20 ng/mL were 0.84–16.4%, 0.22–16.6%, and 1.12–14.7%, respectively, while the inter-day CVs were 1.52–16.3%, 0.35–10.3%, and 0.76–14.8%, respectively. In synthetic urine, the intra-day CVs of analytes fortified at 1, 5, and 20 ng/mL were 0.79–17.4%, 1.18–12.9%, and 0.99–6.52%, respectively, while the inter-day CVs were 1.76–17.3%, 0.53–12.8%, and 0.63–13.8%, respectively. These results suggested that the optimized method yielded acceptable precision for the quantification of QACs in urine.
Matrix effect values between −20% and 20% are considered weak ion suppression or enhancement. In this study, the matrix effects for all analytes (except for OH-C12-BAC and COOH-C12-BAC) ranged from −19.8% to 15.4% in human serum and from −16.5% to 15.2% in synthetic urine. These results indicated that the optimized sample clean-up procedure adequately removed matrix interferences for most of the analytes. Nevertheless, OH-C12-BAC (matrix effect: −27%) and COOH-C12-BAC (−24%) exhibited moderate ionization suppression in urine.
We determined the sensitivity of the method using IDLs and IQLs as well as MDLs and MQLs (Tables 3, S2–4). The IDLs ranged from 0.003 ng/mL (0.013 pg on column) to 0.05 ng/mL (0.25 pg on column); IQLs ranged from 0.01 ng/mL (0.04–0.05 pg on column) to 0.2 ng/mL (1 pg on column). In human serum, the MDLs were between 0.003 ng/mL and 0.42 ng/mL, and the MQLs were between 0. 01 ng/mL and 1.40 ng/mL. In human urine, the MDLs and MQLs were 0.002–0.20 ng/mL and 0.006–0.50 ng/mL, respectively. These results implied that our method had adequate sensitivity for trace analysis of target chemicals in human serum and urine. The MLODs of PQ (0.05 ng/mL) and DQ (0.04 ng/mL) in urine were at least two times lower than those reported earlier (Table 1).
3.6. Occurrence of QACs in human urine and serum
The optimized method was applied for the determination of QACs in human serum (n=11) and urine (n=27) collected from New York city in 2002–2003 and 2022, respectively [52]. We found C14-BAC, C16-BAC, C18-DDAC, and C14-ATMAC in human serum at concentrations ranging from 0.28 to 3.40 ng/mL (Table S5). However, QACs were all <MLOD in human urine samples, indicating that BACs, ATMACs, and DDACs are metabolized rapidly following exposure [53]. In contrast, BAC metabolites including COOH-C6-BAC, COOH-C8-BAC, COOH-C10-BAC, COOH-C12-BAC, and OH-C12-BAC were quantified in human urine at average concentrations in the range of 0.05–0.35 ng/mL (Fig. 4 & Table S6). COOH-C10-BAC was the most abundant, accounting for 35–46% of the total concentrations (Fig. 5). In human serum, OH-C8-BAC (DF: 30%; concentration: 0.03–0.04 ng/mL) and COOH-C10-BAC (DF: 10%; concentration: 0.01 ng/mL) were found. However, further studies with larger sample size are needed to investigate exposure doses to QACs in human populations. Our results indicate that BACs, ATMACs, and DDACs can be found in human blood, while their metabolites are prevalent in urine.
Fig. 5.
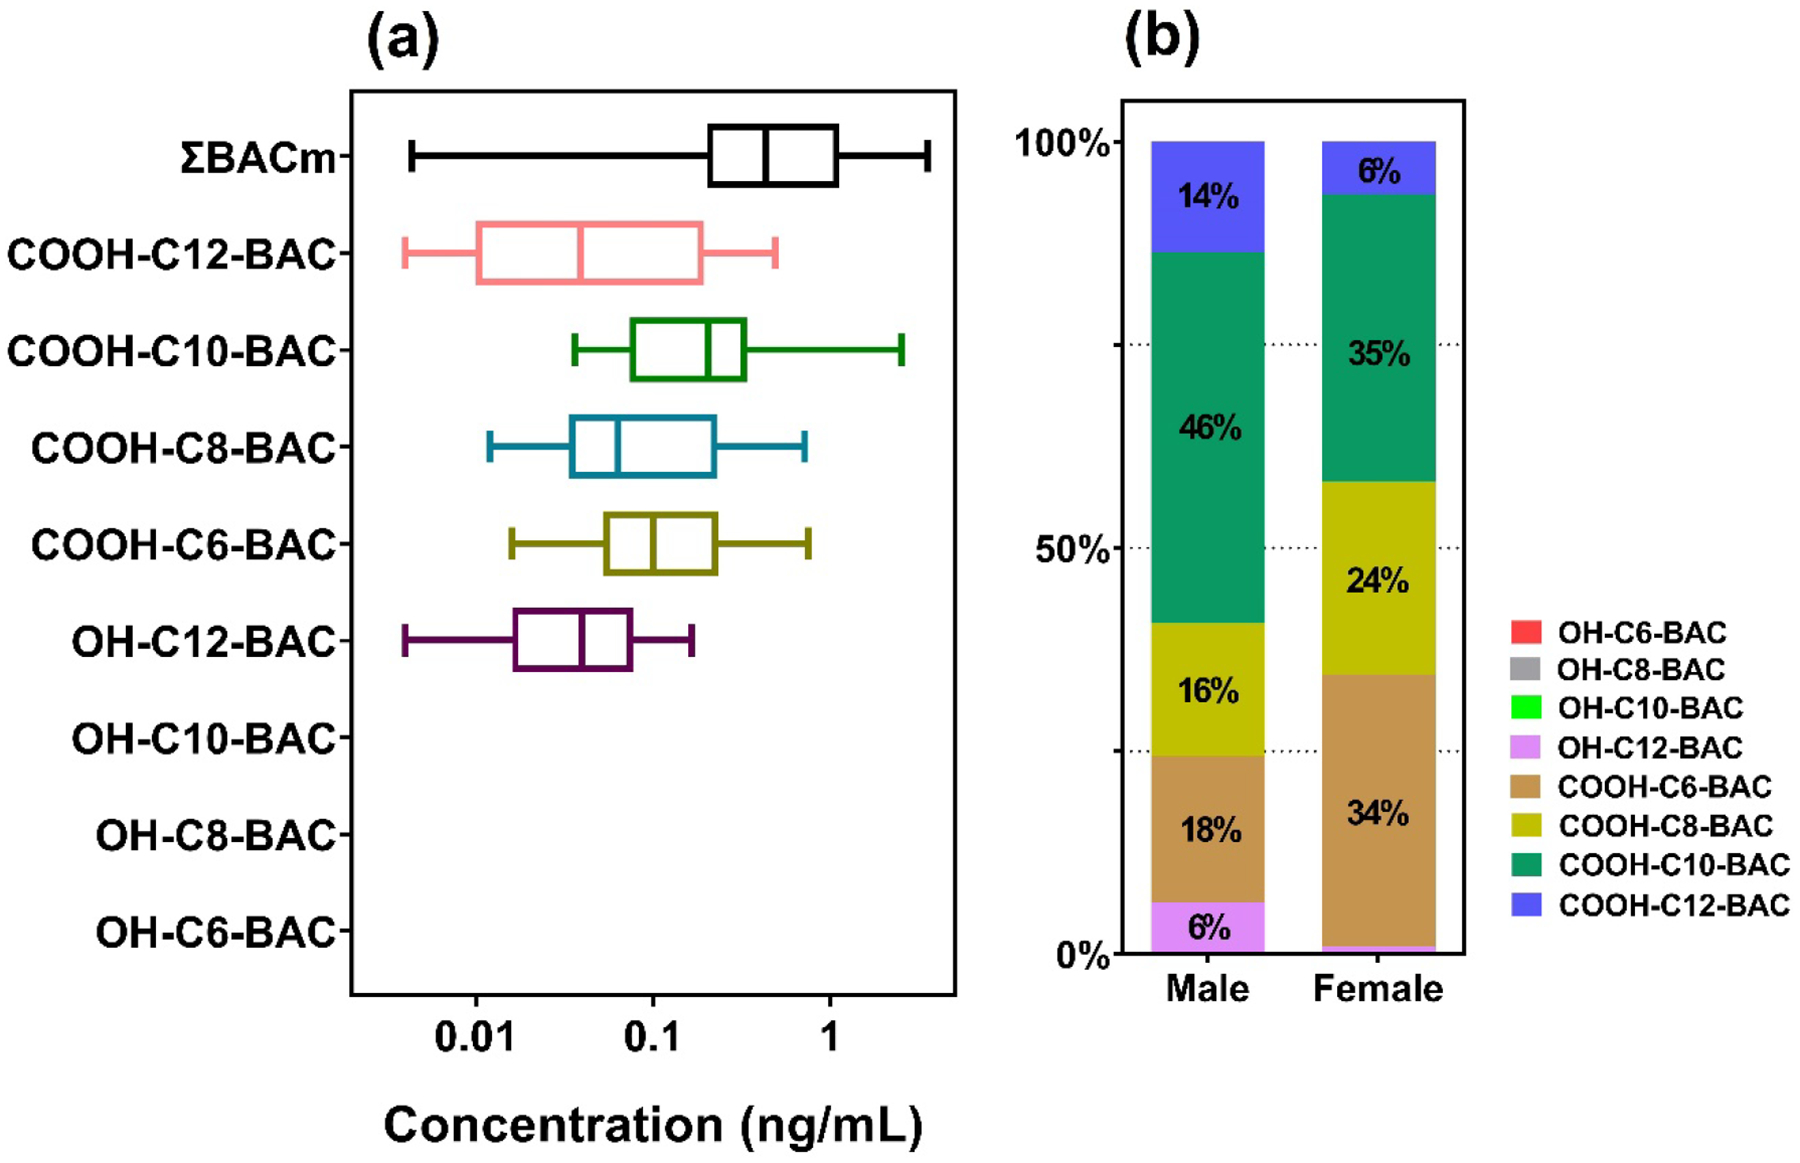
Concentration (a) and distribution (b) of OH- and COOH-BACs measured in 18 male and 9 female volunteer urine samples from New York, United States during May-June, 2022.
4. Conclusions
We developed and validated LC-MS/MS methods for the determination of 30 quaternary ammonium compounds: 7 BACs, 6 DDACs, 6 ATMACs, paraquat, diquat, difenzoquat, 4 OH-BACs, and 4 COOH-BACs in human serum and urine. Passage of samples through a weak cation-exchange solid-phase extraction cartridge efficiently removed matrix interferences. Reversed-phase chromatography was optimized for the determination of BACs, DDACs, ATMACs, difenzoquat, and BAC metabolites, whereas mixed-mode chromatography provided optimal performance for paraquat and diquat analysis. The MRM transitions of paraquat and diquat were optimized to eliminate cross-interferences in the quantification of these two compounds with high accuracy. Human serum can be used for the assessment of exposure to BACs, ATMACs, and DDACs, whereas COOH-BACs and OH-C12-BAC were frequently found in urine. Further studies are warranted to investigate the effects of DDAC and ATMAC metabolites on human health.
Supplementary Material
Highlights.
Methods were developed for the determination 30 quaternary ammonium compounds.
Weak cation-exchange cartridges were used for sample purification.
The methods were validated for accuracy, precision, and sensitivity.
Several quaternary ammonium compounds were found in human serum.
Benzalkonium metabolites were quantified in human urine for the first time.
Acknowledgements
We thank Ms. Sunmi Lee for urine sample collection. The research reported here was supported, in part, by the US National Institute of Environmental Health Sciences (NIEHS) under award number U2CES026542 (KK). The content is solely the responsibility of the authors and does not necessarily represent the official views of the NIEHS.
Footnotes
Publisher's Disclaimer: This is a PDF file of an unedited manuscript that has been accepted for publication. As a service to our customers we are providing this early version of the manuscript. The manuscript will undergo copyediting, typesetting, and review of the resulting proof before it is published in its final form. Please note that during the production process errors may be discovered which could affect the content, and all legal disclaimers that apply to the journal pertain.
Declaration of Competing Interest
The authors declare that there are no conflict of interest.
CRediT Authorship Contribution Statement
Zhong-Min Li: Methodology, Data curation, Formal analysis, Writing - original draft. Mathusa Lakuleswaran: Methodology, Writing - review. Kurunthachalam Kannan: Conceptualization, Funding acquisition, Supervision, Writing - review & editing.
Appendix A. Supplementary data
Supplementary material associated with this article can be found online.
Declaration of competing interest
The authors declare that they have no known competing financial interests or personal relationships that could have appeared to influence the work reported in this paper.
References
- [1].Hora PI, Pati SG, McNamara PJ, Arnold WA, Increased use of quaternary ammonium compounds during the SARS-CoV-2 pandemic and beyond: consideration of environmental implications, Environ. Sci. Technol. Lett, 7 (2020) 622–631. [DOI] [PubMed] [Google Scholar]
- [2].Surface disinfectant market size to reach USD 1,547.7 million by 2027; Rising prevalence of hospital-acquired infections to boost growth, Fortune business insights, June 24, 2020. [Google Scholar]
- [3].Zhang C, Cui F, Zeng GM, Jiang M, Yang ZZ, Yu ZG, Zhu MY, Shen LQ, Quaternary ammonium compounds (QACs): a review on occurrence, fate and toxicity in the environment, Sci. Total. Environ, 518–519 (2015) 352–362. [DOI] [PubMed] [Google Scholar]
- [4].Zheng G, Filippelli GM, Salamova A, Increased indoor exposure to commonly used disinfectants during the COVID-19 pandemic, Environ. Sci. Technol. Lett, 7 (2020) 760–765. [DOI] [PMC free article] [PubMed] [Google Scholar]
- [5].Dai X, Wang C, Lam JCW, Yamashita N, Yamazaki E, Horii Y, Chen W, Li X, Accumulation of quaternary ammonium compounds as emerging contaminants in sediments collected from the Pearl River Estuary, China and Tokyo Bay, Japan, Mar Pollut Bull, 136 (2018) 276–281. [DOI] [PubMed] [Google Scholar]
- [6].Xian Y, Dong H, Wu Y, Guo X, Hou X, Wang B, QuEChERS-based purification method coupled to ultrahigh performance liquid chromatography-tandem mass spectrometry (UPLC-MS/MS) to determine six quaternary ammonium compounds (QACs) in dairy products, Food Chem, 212 (2016) 96–103. [DOI] [PubMed] [Google Scholar]
- [7].Yu L, Malik S, Duncan TV, Jablonski JE, High throughput quantification of quaternary ammonium cations in food simulants by flow-injection mass spectrometry, J. AOAC. Int, 101 (2018) 1873–1880. [DOI] [PubMed] [Google Scholar]
- [8].Hrubec TC, Seguin RP, Xu L, Cortopassi GA, Datta S, Hanlon AL, Lozano AJ, McDonald VA, Healy CA, Anderson TC, Musse NA, Williams RT, Altered toxicological endpoints in humans from common quaternary ammonium compound disinfectant exposure, Toxicol. Rep, 8 (2021) 646–656. [DOI] [PMC free article] [PubMed] [Google Scholar]
- [9].Zheng G, Schreder E, Sathyanarayana S, Salamova A, The first detection of quaternary ammonium compounds in breast milk: Implications for early-life exposure, J. Expo. Sci. Environ. Epidemiol, 32 (2022) 682–688. [DOI] [PMC free article] [PubMed] [Google Scholar]
- [10].Zheng G, Webster TF, Salamova A, Quaternary ammonium compounds: bioaccumulation potentials in humans and levels in blood before and during the Covid-19 pandemic, Environ Sci Technol, 55 (2021) 14689–14698. [DOI] [PMC free article] [PubMed] [Google Scholar]
- [11].Anderson SE, Shane H, Long C, Lukomska E, Meade BJ, Marshall NB, Evaluation of the irritancy and hypersensitivity potential following topical application of didecyldimethylammonium chloride, J. Immunotoxicol, 13 (2016) 557–566. [DOI] [PMC free article] [PubMed] [Google Scholar]
- [12].EPA, Alkyl dimethyl benzyl ammonium chloride (ADBAC) final work plan, 2017. Available at: https://www.turi.org/content/download/13430/205412/file/ADBAC_EPA_final_workplan_2017_EPA-HQ-OPP-2015-0737-0004.pdf (Accessed April 2022), 2017.
- [13].EPA, Didecyl dimethyl ammonium chloride (DDAC) final work plan, 2017. Available at: https://www.turi.org/content/download/13431/205422/file/DDAC_Final%20Work%20Plan%20Registration%20Review_2017.pdf (Accessed April 2022), 2017.
- [14].LaKind JS, Goodman M, Methodological evaluation of human research on asthmagenicity and occupational cleaning: a case study of quaternary ammonium compounds (“quats”), Allergy Asthma Clin. Immunol, 15 (2019) 69. [DOI] [PMC free article] [PubMed] [Google Scholar]
- [15].Dumas O, Varraso R, Boggs KM, Quinot C, Zock JP, Henneberger PK, Speizer FE, Le Moual N, Camargo CA Jr., Association of occupational exposure to disinfectants with incidence of chronic obstructive pulmonary disease among US female nurses, JAMA Netw, 2 (2019) e1913563. [DOI] [PMC free article] [PubMed] [Google Scholar]
- [16].Walters GI, Burge PS, Moore VC, Robertson AS, Cleaning agent occupational asthma in the West Midlands, UK: 2000–16, Occup. Med. (Lond), 68 (2018) 530–536. [DOI] [PubMed] [Google Scholar]
- [17].Abdelhamid L, Cabana-Puig X, Mu Q, Moarefian M, Swartwout B, Eden K, Das P, Seguin RP, Xu L, Lowen S, Lavani M, Hrubec TC, Jones CN, Luo XM, Quaternary ammonium compound disinfectants reduce lupus-associated splenomegaly by targeting neutrophil migration and T-cell fate, Front. Immunol, 11 (2020) 575179. [DOI] [PMC free article] [PubMed] [Google Scholar]
- [18].Herron J, Reese RC, Tallman KA, Narayanaswamy R, Porter NA, Xu L, Identification of environmental quaternary ammonium compounds as direct inhibitors of cholesterol biosynthesis, Toxicol. Sci, 151 (2016) 261–270. [DOI] [PMC free article] [PubMed] [Google Scholar]
- [19].Melin VE, Melin TE, Dessify BJ, Nguyen CT, Shea CS, Hrubec TC, Quaternary ammonium disinfectants cause subfertility in mice by targeting both male and female reproductive processes, Reprod. Toxicol, 59 (2016) 159–166. [DOI] [PubMed] [Google Scholar]
- [20].Melin VE, Potineni H, Hunt P, Griswold J, Siems B, Werre SR, Hrubec TC, Exposure to common quaternary ammonium disinfectants decreases fertility in mice, Reprod. Toxicol, 50 (2014) 163–170. [DOI] [PMC free article] [PubMed] [Google Scholar]
- [21].Pateiro-Moure M, Arias-Estevez M, Simal-Gandara J, Critical review on the environmental fate of quaternary ammonium herbicides in soils devoted to vineyards, Environ Sci Technol, 47 (2013) 4984–4998. [DOI] [PubMed] [Google Scholar]
- [22].WHO, The WHO recommended classification of pesticides by hazard and guidelines to classification 2019. Available at: https://apps.who.int/iris/bitstream/handle/10665/332193/9789240005662-eng.pdf?ua=1 (Accessed May 2022). 2019.
- [23].Suntres ZE, Exploring the potential benefit of natural product extracts in paraquat toxicity, Fitoterapia, 131 (2018) 160–167. [DOI] [PubMed] [Google Scholar]
- [24].Berry C, La Vecchia C, Nicotera P, Paraquat and parkinson’s disease, Cell Death Differ, 17 (2010) 1115–1125. [DOI] [PubMed] [Google Scholar]
- [25].Fortenberry GZ, Beckman J, Schwartz A, Prado JB, Graham LS, Higgins S, Lackovic M, Mulay P, Bojes H, Waltz J, Mitchell Y, Leinenkugel K, Oriel MS, Evans E, Calvert GM, Magnitude and characteristics of acute paraquat- and diquat-related illnesses in the US: 1998–2013, Environ. Res, 146 (2016) 191–199. [DOI] [PMC free article] [PubMed] [Google Scholar]
- [26].Jones GM, Vale JA, Mechanisms of toxicity, clinical features, and management of diquat poisoning: a review, J. Toxicol. Clin. Toxicol, 38 (2000) 123–128. [DOI] [PubMed] [Google Scholar]
- [27].EPA, R.E.D FACTS Difenzoquat. Available at: https://www3.epa.gov/pesticides/chem_search/reg_actions/reregistration/fs_PC-106402_1-Sep-94.pdf (Accessed May 2022), 1994.
- [28].Li D, Sangion A, Li L, Evaluating consumer exposure to disinfecting chemicals against coronavirus disease 2019 (COVID-19) and associated health risks, Environ. Int, 145 (2020) 106108. [DOI] [PMC free article] [PubMed] [Google Scholar]
- [29].Xue Y, Hieda Y, Saito Y, Nomura T, Fujihara J, Takayama K, Kimura K, Takeshita H, Distribution and disposition of benzalkonium chloride following various routes of administration in rats, Toxicol. Lett, 148 (2004) 113–123. [DOI] [PubMed] [Google Scholar]
- [30].Luz A, DeLeo P, Pechacek N, Freemantle M, Human health hazard assessment of quaternary ammonium compounds: Didecyl dimethyl ammonium chloride and alkyl (C12-C16) dimethyl benzyl ammonium chloride, Regul. Toxicol. Pharmacol, 116 (2020) 104717. [DOI] [PubMed] [Google Scholar]
- [31].Evans CS, Startin JR, Goodall DM, Keely BJ, Tandem mass spectrometric analysis of quaternary ammonium pesticides, Rapid Commun. Mass. Spectrom, 15 (2001) 699–707. [DOI] [PubMed] [Google Scholar]
- [32].de Almeida RM, Yonamine M, Gas chromatographic-mass spectrometric method for the determination of the herbicides paraquat and diquat in plasma and urine samples, J. Chromatogr. B Analyt. Technol. Biomed. Life Sci, 853 (2007) 260–264. [DOI] [PubMed] [Google Scholar]
- [33].Wigfield YY, McCormack KA, Grant R, Simultaneous determination of residues of paraquat and diquat in potatoes using high-performance capillary electrophoresis with ultraviolet detection, J. Agric. Food Chem, 41 (1993) 2315–2318. [Google Scholar]
- [34].Selisker MY, Herzog DP, Erber RD, Fleeker JR, Itak JA, Determination of paraquat in fruits and vegetables by a magnetic particle based enzyme-linked immunosorbent assay, J. Agric. Food Chem, 43 (1995) 544–547. [Google Scholar]
- [35].Tsao YC, Lai YC, Liu HC, Liu RH, Lin DL, Simultaneous determination and quantitation of paraquat, diquat, glufosinate and glyphosate in postmortem blood and urine by LCMS-MS, J. Anal. Toxicol, 40 (2016) 427–436. [DOI] [PubMed] [Google Scholar]
- [36].Pateiro-Moure M, Martinez-Carballo E, Arias-Estevez M, Simal-Gandara J, Determination of quaternary ammonium herbicides in soils. Comparison of digestion, shaking and microwave-assisted extractions, J. Chromatogr. A, 1196–1197 (2008) 110–116. [DOI] [PubMed] [Google Scholar]
- [37].Aramendía MA, Borau V, Lafont F, Marinas A, Marinas JM, Moreno JM, Porras JM, Urbano FJ, Determination of diquat and paraquat in olive oil by ion-pair liquid chromatography–electrospray ionization mass spectrometry (MRM), Food Chem, 97 (2006) 181–188. [Google Scholar]
- [38].Ariffin MM, Anderson RA, LC/MS/MS analysis of quaternary ammonium drugs and herbicides in whole blood, J. Chromatogr. B Analyt. Technol. Biomed. Life Sci, 842 (2006) 91–97. [DOI] [PubMed] [Google Scholar]
- [39].Nagatomi Y, Yoshioka T, Yanagisawa M, Uyama A, Mochizuki N, Rapid analysis of paraquat and diquat in beer and malt using LC-MS/MS, J. Pestic. Sci, 38 (2013) 144–146. [Google Scholar]
- [40].Whitehead RD Jr., Montesano MA, Jayatilaka NK, Buckley B, Winnik B, Needham LL, Barr DB, Method for measurement of the quaternary amine compounds paraquat and diquat in human urine using high-performance liquid chromatography-tandem mass spectrometry, J. Chromatogr. B Analyt. Technol. Biomed. Life Sci, 878 (2010) 2548–2553. [DOI] [PubMed] [Google Scholar]
- [41].Zou T, He P, Cao J, Li Z, Determination of paraquat in vegetables using HPLC-MS-MS, J. Chromatogr. Sci, 53 (2015) 204–209. [DOI] [PubMed] [Google Scholar]
- [42].Chamkasem N, Morris C, Harmon T, Determination of paraquat and diquat in potato by liquid chromatography/tandem mass spectrometer, J. Regul. Sci, 05 (2017) 1–8. [Google Scholar]
- [43].Kolberg DI, Mack D, Anastassiades M, Hetmanski MT, Fussell RJ, Meijer T, Mol HG, Development and independent laboratory validation of a simple method for the determination of paraquat and diquat in potato, cereals and pulses, Anal. Bioanal. Chem, 404 (2012) 2465–2474. [DOI] [PubMed] [Google Scholar]
- [44].Gustavsson SA, Samskog J, Markides KE, L. B, Studies of signal suppression in liquid chromatography–electrosprayionization mass spectrometry using volatile ion-pairing reagents, J. Chromatogr. A, 937 (2001). [DOI] [PubMed] [Google Scholar]
- [45].Bauer A, Luetjohann J, Rohn S, Kuballa J, Jantzen E, Development of an LC-MS/MS method for simultaneous determination of the quaternary ammonium herbicides paraquat, diquat, chlormequat, and mepiquat in plant-derived commodities, Food Anal. Methods, 11 (2018) 2237–2243. [Google Scholar]
- [46].Hao C, Zhao X, Morse D, Yang P, Taguchi V, Morra F, Optimized liquid chromatography tandem mass spectrometry approach for the determination of diquat and paraquat herbicides, J. Chromatogr. A, 1304 (2013) 169–176. [DOI] [PubMed] [Google Scholar]
- [47].Núñez O, Moyano E, Galceran MT, Time-of-flight high resolution versus triple quadrupole tandem mass spectrometry for the analysis of quaternary ammonium herbicides in drinking water, Anal. Chim. Acta, 525 (2004) 183–190. [Google Scholar]
- [48].Marr JC, King JB, A simple high performance liquid chromatographyIonspray tandem mass spectrometry method for the direct determination of paraquat and diquat in water, Rapid Commun. Mass Spectrom, 11 (1997) 479–483. [Google Scholar]
- [49].Castro R, Moyano E, Galceran MT, Determination of quaternary ammonium pesticides by liquid chromatography–electrospray tandem mass spectrometry, J. Chromatogr. A, 914 (2001) 111–121. [DOI] [PubMed] [Google Scholar]
- [50].Lee XP, Kumazawa T, Fujishiro M, Hasegawa C, Arinobu T, Seno H, Ishii A, Sato K, Determination of paraquat and diquat in human body fluids by high-performance liquid chromatography/tandem mass spectrometry, J. Mass Spectrom, 39 (2004) 1147–1152. [DOI] [PubMed] [Google Scholar]
- [51].Ruan T, Song S, Wang T, Liu R, Lin Y, Jiang G, Identification and composition of emerging quaternary ammonium compounds in municipal sewage sludge in China, Environ Sci Technol, 48 (2014) 4289–4297. [DOI] [PubMed] [Google Scholar]
- [52].Horii Y, Jiang Q, Hanari N, Lam PK, Yamashita N, Jansing R, Aldous KM, Mauer MP, Eadon GA, Kannan K, Polychlorinated dibenzo-p-dioxins, dibenzofurans, biphenyls, and naphthalenes in plasma of workers deployed at the World Trade Center after the collapse, Environ Sci Technol, 44 (2010) 5188–5194. [DOI] [PubMed] [Google Scholar]
- [53].Seguin RP, Herron JM, Lopez VA, Dempsey JL, Xu L, Metabolism of benzalkonium chlorides by human hepatic cytochromes P450, Chem. Res. Toxicol, 32 (2019) 2466–2478. [DOI] [PMC free article] [PubMed] [Google Scholar]
- [54].Ruan XL, Qiu JJ, Wu C, Huang T, Meng RB, Lai YQ, Magnetic single-walled carbon nanotubes-dispersive solid-phase extraction method combined with liquid chromatography-tandem mass spectrometry for the determination of paraquat in urine, J. Chromatogr. B Analyt. Technol. Biomed. Life Sci, 965 (2014) 85–90. [DOI] [PubMed] [Google Scholar]
- [55].Lu H, Yu J, Wu L, Xing J, Wang J, Huang P, Zhang J, Xiao H, Gao R, Optimized ultra performance liquid chromatography tandem high resolution mass spectrometry method for the quantification of paraquat in plasma and urine, J. Chromatogr. B Analyt. Technol. Biomed. Life Sci, 1027 (2016) 96–102. [DOI] [PubMed] [Google Scholar]
- [56].Wunnapuk K, Medley GA, Liu X, Grice JE, Jayasinghe S, Gawarammana I, Buckley NA, Roberts MS, Simple and sensitive liquid chromatography-tandem mass spectrometry methods for quantification of paraquat in plasma and urine: application to experimental and clinical toxicological studies, J. Chromatogr. B Analyt. Technol. Biomed. Life Sci, 879 (2011) 3047–3052. [DOI] [PubMed] [Google Scholar]
- [57].Pan S, Zhang J, He Q, Chen X, Jin M, Fabrication of benzenesulfonic acid groups modified magnetic microspheres as an MSPE adsorbent for fast determination of paraquat and diquat in human urine combined with UPLC-HRMS, J. Chromatogr. B Analyt. Technol. Biomed. Life Sci, 1136 (2020) 121880. [DOI] [PubMed] [Google Scholar]
Associated Data
This section collects any data citations, data availability statements, or supplementary materials included in this article.