

Abstract
A nanopore device is capable of providing single-molecule level information of an analyte as they translocate through the sensing aperture—a nanometer-sized through-hole—under the influence of an applied electric field. In this study, a silicon nitride (SixNy) based nanopore was used to characterize the human serum transferrin receptor protein (TfR) under various applied voltages. The presence of dimeric forms of TfR was found to decrease exponentially as the applied electric field increased. Further analysis of monomeric TfR also revealed that its unfolding behaviors were positively dependent on the applied voltage. Furthermore, a comparison between the data of monomeric TfR and its ligand protein, human serum transferrin (hSTf), showed that these two protein populations, despite their nearly identical molecular volumes, could be distinguished from each other by means of a solid-state nanopore. Lastly, the excluded volumes of TfR were experimentally determined at each voltage and were found to be within error of their theoretical values. The results herein demonstrate the successful application of a solid-state nanopore for accurately classifying monomeric and dimeric molecules while the two populations coexist in a heterogeneous mixture.
Keywords: dielectric breakdown, human serum transferrin, nanopore, protein unfolding, transferrin receptor protein
1. Introduction
In recent years, solid-state nanopores (SSNs) have demonstrated several attributes which make them an attractive tool for single-molecule studies, such as high throughput [1], label-free sensing [2], and the ability to provide indirect measurements of excluded volume [3]. Of particular importance is the ability of SSNs to detect proteins on a single-molecule basis, identifying subpopulations that may be lost in traditional average-ensemble analysis methods [4]. Briefly, an SSN is a nanometer-sized aperture through an ultra-thin membrane that separates two reservoirs containing electrolyte solution; analyte is added in one of the reservoirs, and a voltage is applied to the other reservoir to drive the analyte through the nanopore (Fig. 1D). During translocation through the nanopore, the analyte causes a transient change in ionic current that is dependent on its size, shape, and charge. SSNs have been successfully implemented to characterize the rigidity of viral particles [5], the iron-binding characteristics of transferrin [6], and for many other applications [7].
Figure 1.
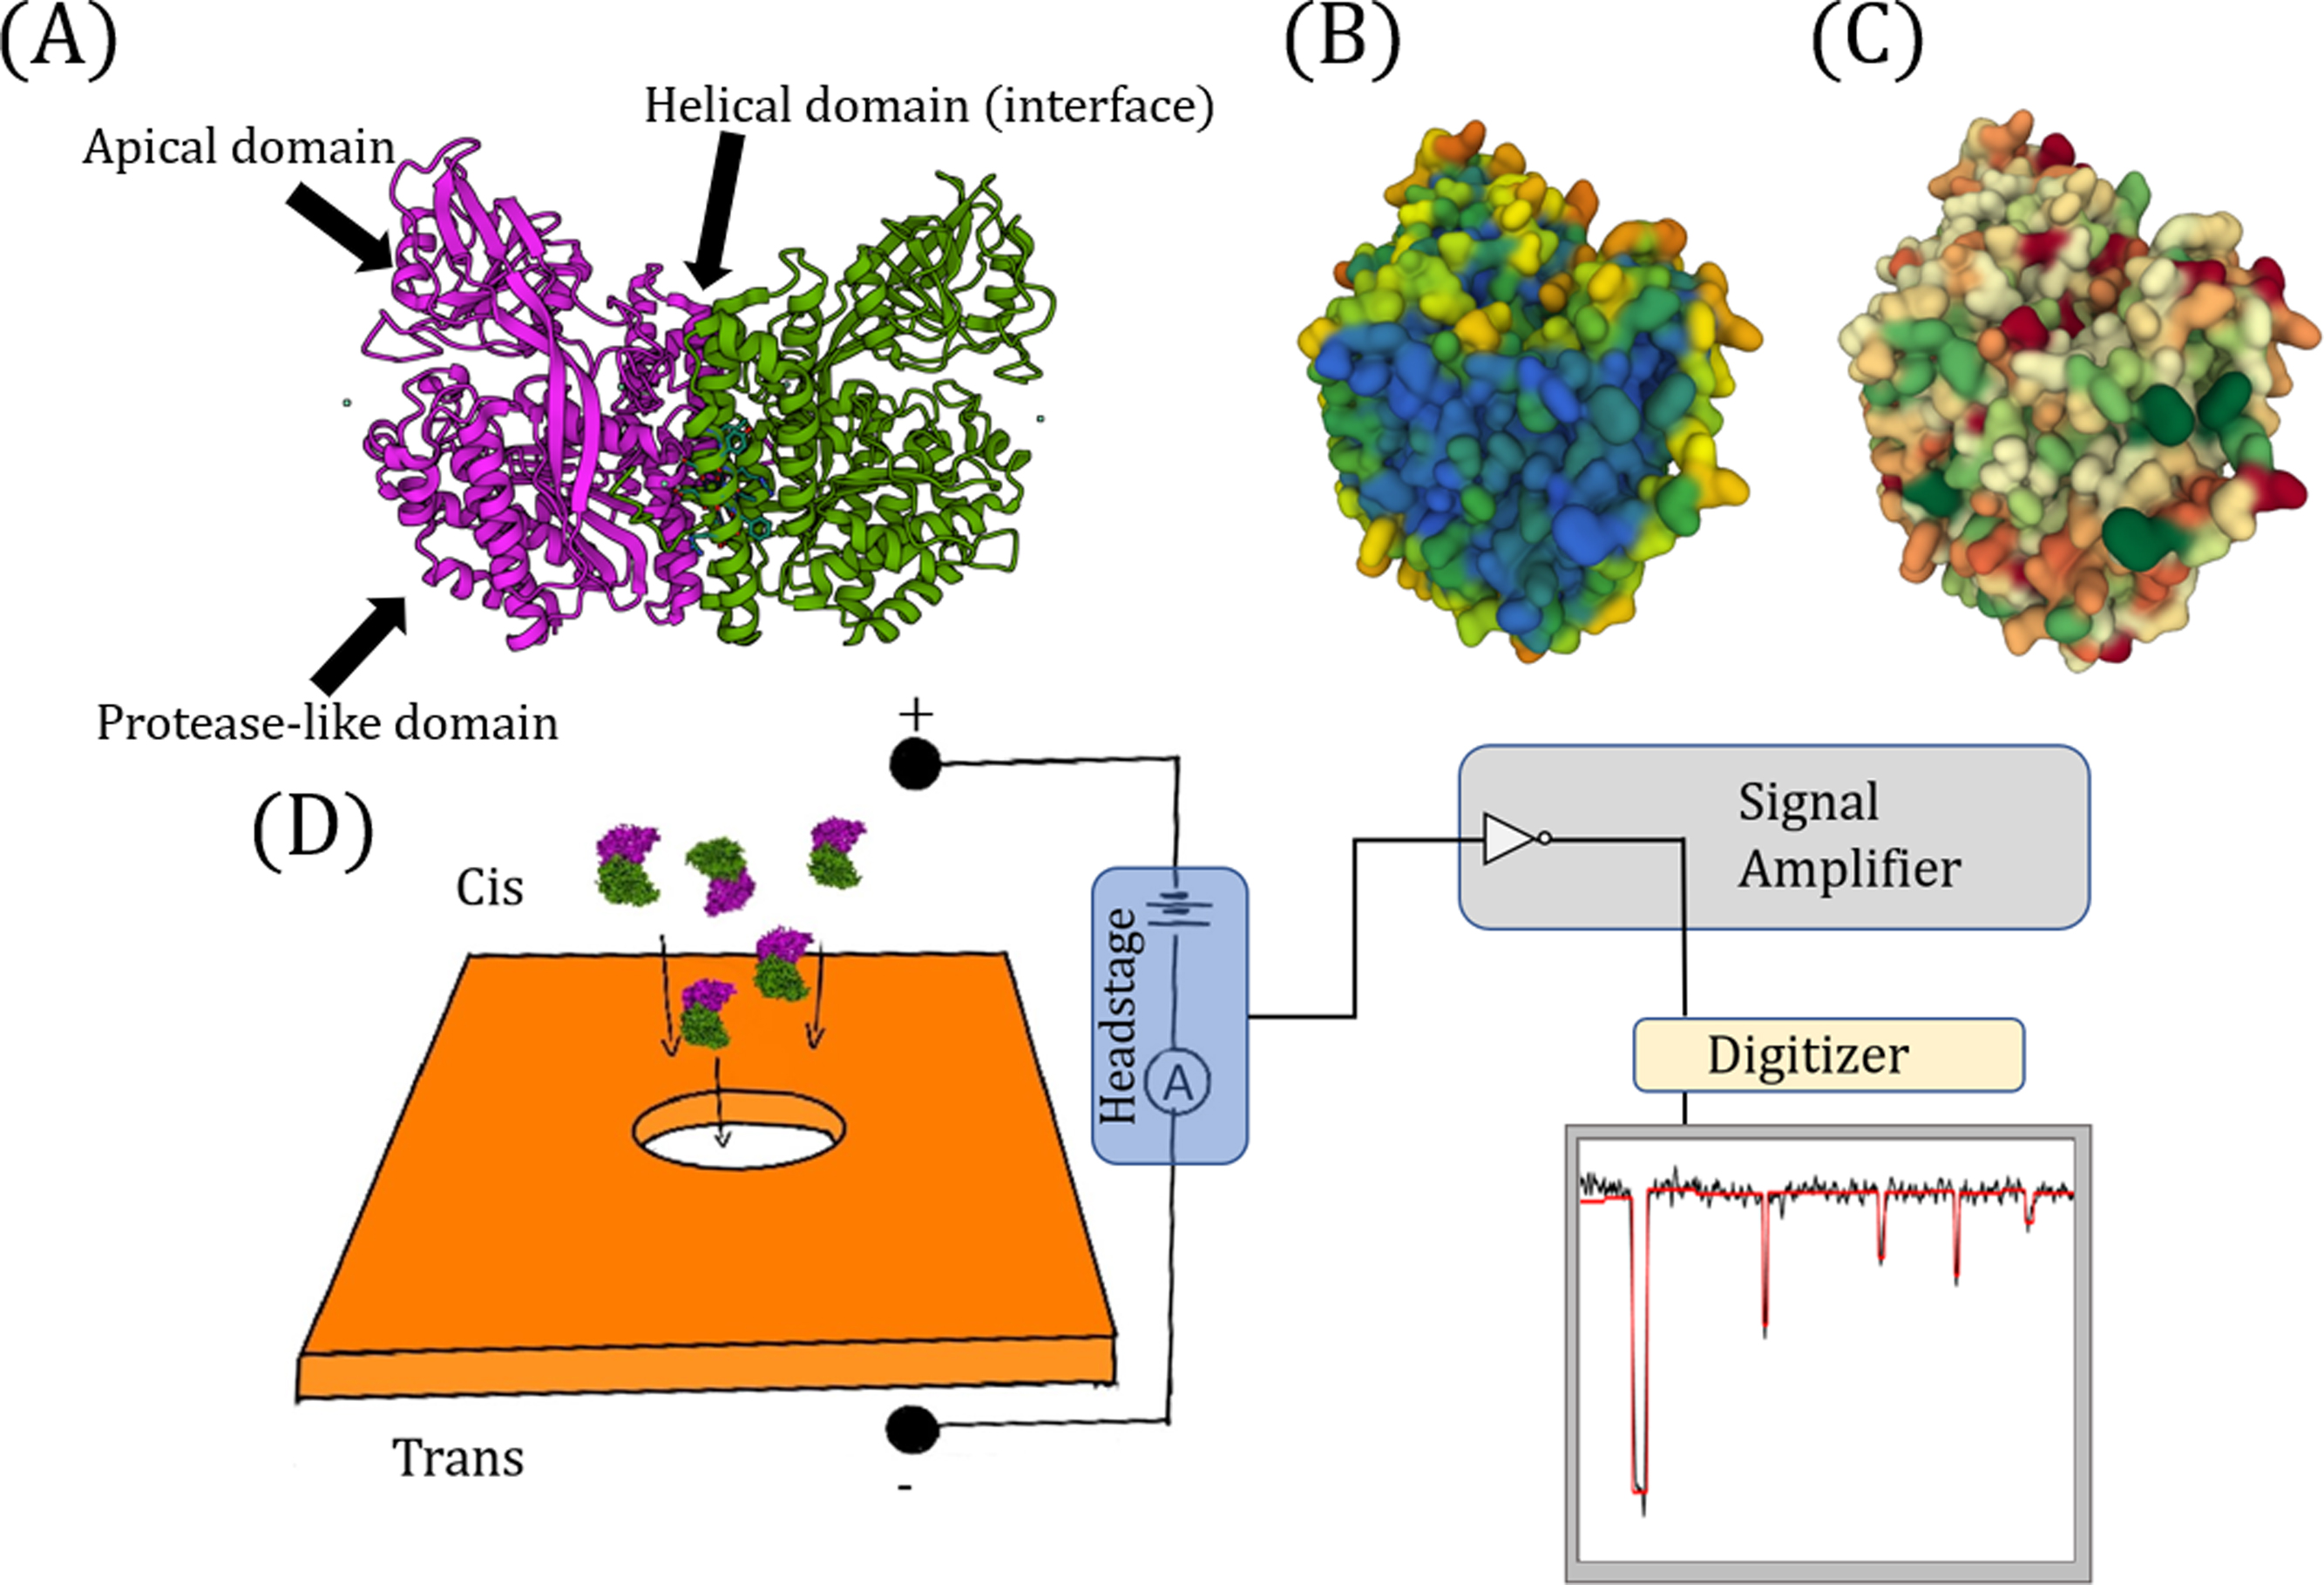
Structure of human serum transferrin receptor (TfR) and experimental setup. (A) Protein Data Bank (PDB) structure of transferrin receptor protein. The serum form of transferrin receptor is a 659 amino acid receptor that acts as the cellular gatekeeper of cells. PDB ID: 1CX8 [12]. (B) and (C) show the interaction interface of a monomeric TfR molecule, where it binds with another TfR molecule to form a dimer. (B) Interface of the monomeric TfR as colored by its accessible surface area (area accessible by water). Shades of blue represent inaccessible regions while shades of orange are accessible. The binding site for TfR is mostly blue. (C) Interface of the monomeric TfR as colored by hydrophobicity. Hydrophobic residues are colored in shades of green and hydrophilic residues are colored in shades of red. The interface is mainly hydrophobic. (D) Experimental setup for nanopore experiments. An external voltage is applied through the headstage (blue square in the figure) while the current is measured, and proteins are electrophoretically or electroosmotically driven across a nanopore from the cis side to the trans side. Upon transiting the nanopore, the protein causes a perturbation in the open pore current, which is amplified by the signal amplifier and is digitized and recorded by a digitizer. The real-time ionic current trace is then displayed, recorded, and fit with an event analysis software. Real-time ionic current traces from experiments can be found in the supplementary information (SI-7).
The transportation of iron from the blood into cells is mediated by a dimeric protein receptor called human transferrin receptor 1 [8]. Human transferrin receptor 1 is the cellular gatekeeper for iron uptake in most cells, importing iron through the receptor-mediated endocytosis of iron-containing transferrin [8]. Human serum transferrin receptor protein 1 (herein called TfR) is a 659 amino acid homodimer that is found in human serum. TfR’s binding domain is structurally identical to its membrane-bound form [9, 10]. Serum TfR differs from its membrane-bound form in that it lacks the transmembrane and cytosolic regions that anchor it to the plasma membrane; these regions are cleaved in vivo by trypsin [11]. The serum form of TfR, which has been imaged via cryo-EM and X-ray crystallography [12, 13], consists of three domains: the protease-like domain, apical domain, and helical domain (Fig. 1A). The protease-like domain is folded such that it has a 7-stranded mixed sheet with flanking helices. The apical domain is folded in a sandwich. The helical domain is formed by 4 -hairpins and is primarily responsible for the dimerization of TfR monomers. A single missense mutation in the gene that encodes TfR causes immunodeficiency in humans [14]. TfR is an important biomarker that has been used in drug tests for athletes [15] and in diagnostic tests for anemia [16]. Furthermore, TfR is used as an entry point for new world arenaviruses [17]. Given TfR’s clinical importance, it is crucial to understand the mechanisms by which its dimerization and conformation – and thus its function – can be manipulated.
The ability of proteins to self-associate and form dimers is a common type of protein-protein interaction that is often necessary for a protein’s function [18,19,20]. Protein dimerization is essential to the function of many enzymes, receptors, and transcription factors [19]. Protein dimerization has been shown to be influenced by pH [21] and electrolyte concentration [22]; Utilizing a solid-state nanopore to examine the effect that an externally applied voltage has on protein dimerization could further the understanding of transmembrane proteins; TfR, natively a transmembrane protein, exists across a voltage gradient which is often dynamic in nature and can cause conformational changes in the proteins [23]; for example, the main type of stimulus that is known to cause ion channels to open is a change in voltage across the membrane [24]. A method for observing voltage-induced monomerization of dimers and the subsequent unfolding of these monomers would provide useful insight into the mechanism of dimerization. Here, we use an SSN to examine the voltage-induced monomerization and unfolding of TfR that are not detected in bulk analysis methods.
In this study, we use a SixNy nanopore to profile TfR under non-equilibrium conditions. The voltage-induced unfolding of TfR and its ligand protein over a voltage range of 50–500mV is discussed. The normalized change in electrical current during translocation () is used to differentiate TfR from hSTf based on their unique current signatures. Next, a change in conductance () analysis is performed to examine the unique unfolding characteristics of TfR and hSTf as voltage is increased. The translocation times of both TfR and hSTf were found to be rapid, and became increasingly rapid with increasing voltage. Finally, the excluded volume of TfR at each voltage and TfR’s voltage-induced monomerization is discussed.
2. Materials and Methods
2.1. Nanopore Fabrication
A nanopore was fabricated through a 30nm±3nm thick, silicon nitride membrane (NBPX5001Z-HR, Norcada) using the chemically-tuned controlled dielectric breakdown (CT-CDB) method [25]. CT-CDB is a modification of the well-established CDB method that uses sodium hypochlorite (425044, Sigma Aldrich) during the fabrication process. CT-CDB has been shown to cause a more stable baseline which is ideal for event analysis. Two polydimethylsiloxane (PDMS) gaskets were placed on each side of the Silicon Nitride chip which was then sandwiched between two polytetrafluoroethylene (PTFE) flow cells. The PDMS gaskets were used to form a watertight seal. The reservoirs of the flow cell were filled with 1M KCl (P9333, Sigma Aldrich) buffered with 10mM HEPES (H0527, Sigma Aldrich) at a pH of ~7. Sodium hypochlorite (425044, Sigma Aldrich) was then added to this solution to a final ratio of 2:9, as previously established [26]. Ag/AgCl electrodes were placed in each half-cell of the flowcell, and a custom-built circuit was used to apply voltage to the solution. A voltage was applied to across the silicon nitride membrane until a sharp spike in current was observed, indicative of a nanopore being formed. The conductance of the solution in the flowcell containing the nanopore was measured and related to the diameter of the nanopore by the equation
| (1) |
where σ, L, and D are the conductivity of the electrolyte solution, nominal thickness of the nanopore, and nanopore diameter, respectively [27, 28]. The size of the nanopore was expanded by applying short voltage pulses (1–3 seconds) until the desired diameter was obtained. The solution used during the CT-CDB process was then replaced with 2M KCl buffered with 10mM HEPES pH 8, and its conductance was again measured. A baseline current was recorded at all voltages used during the experiment to ensure there were no contaminants in the reservoirs of the flowcell. All pores used in the experiment were ohmic, with linear current-voltage curves. All pores created during this process had a diameter of 30nm±3nm, as determined by Equation 1 above. A 30nm diameter nanopore was determined to be optimal for experimentation with transferrin receptor due to the minimal clogging events seen with a larger sized nanopore (SI-4).
2.2. Protein Preparation and Addition
10 μg of recombinant human transferrin receptor protein (TfR, Sigma) were reconstituted in sterile 1× PBS, pH 7.4 to a concentration of 50 μg/mL. A stock solution of human holo-transferrin (hSTf, Sigma) was prepared in a similar manner. For both TFR and hSTf, the protein was added to the cis side reservoir of the flowcell. A concentration of 10nM was used for TfR and 40nM for hSTf.
2.3. Electrical Sensing for Nanopore Experimentation and Analysis
An Axopatch 200B amplifier (Molecular Devices LLC) was used for signal acquisition and digitized using Digidata 1550B (Molecular Devices) device. A sampling rate of 250 kHz was used during experimentation and the raw signal was filtered using Axopatch 200B’s inbuilt 10kHz Bessel Filter. The resistive pulse analysis software EventPro 2.0 was used to extract the data from each event during experimentation, extracting parameters such as duration (Δt) and depth of the resistive pulse ΔI [29]. Custom MATLAB scripts were used to further analyze the data obtained from EventPro 2.0. The quality of all fits of data distributions were quantified by examining Akaike’s Information Criteria (AIC) and Bayesian Information Criteria (BIC), whose values were used to choose which model fit the data best [30, 31]. Measurements in the paper are given with a 95% confidence interval. Additionally, two-sample Kolmogorov-Smirnov tests were used to compare uniqueness between two data sets [32].
3. Results and Discussion
3.1. Nanopore Profiling of TfR and hSTf
TfR and hSTf were separately examined under varying voltage conditions using the same nanopore. The peak current drop of TfR and hSTf with applied voltage is shown in Fig. 2A. Each distribution (Fig. 2C) was fitted with an exponentially-modified Gaussian or a mixed Gaussian function (SI-1), with the maximum value of the fit approximating the peak value of each distribution [33]. Upon observing the peak values, it was seen that TfR statistically differs (95% CI) from hSTf at all voltages except at 200mV. At 200mV, the peak values are within error of each other. However, performing a two-sample Kolmogorov-Smirnov test [32] on the TfR and hSTf distributions at a 5% significance level (p = 0.05) confirms that the TfR distribution is different from the hSTf distribution at this voltage. Thus, although the peak values corresponding to TfR and hSTf were within error of each other at 200mV, their distributions were different from each other (Fig. 2C); these differences are further explored in Section 3.2. The marginal difference in the peak values shown in Fig. 2A might suggest that TfR and hSTf have similar volumes; TfR can exist in solution as a monomer (~80kDa) or dimer (~155kDa), having calculated molecular volumes of ~177nm3 and ~353 nm3 respectively (SI-3). hSTf weighs ~80kDa [34] and its volume in 2M KCl at pH 8 has been experimentally determined to be 104±7nm3 [6]. Given that the during translocations is directly proportional to the excluded volume of the analyte, it would be expected that dimeric TfR would give a peak that is very different from hSTf due to its volume being more than 3× the volume of hSTf. Although a noticeable and statistically significant difference exists between the peaks (Fig. 2A), the peak values of TfR are an average of 16.8% higher than that of hSTf, which is less than what would be expected for a protein more than 3x the volume of hSTf. It is likely that the peak values of TfR depicted in Fig. 2A correspond to its monomeric form (further discussed in Section 3.2 at 3.4). As shown in Fig. 2A, monomeric TfR is distinguishable from hSTf despite their similar molecular weights, demonstrating a promising advantage of using solid-state nanopores for the single molecule discrimination of proteins with similar molecular weights.
Figure 2.
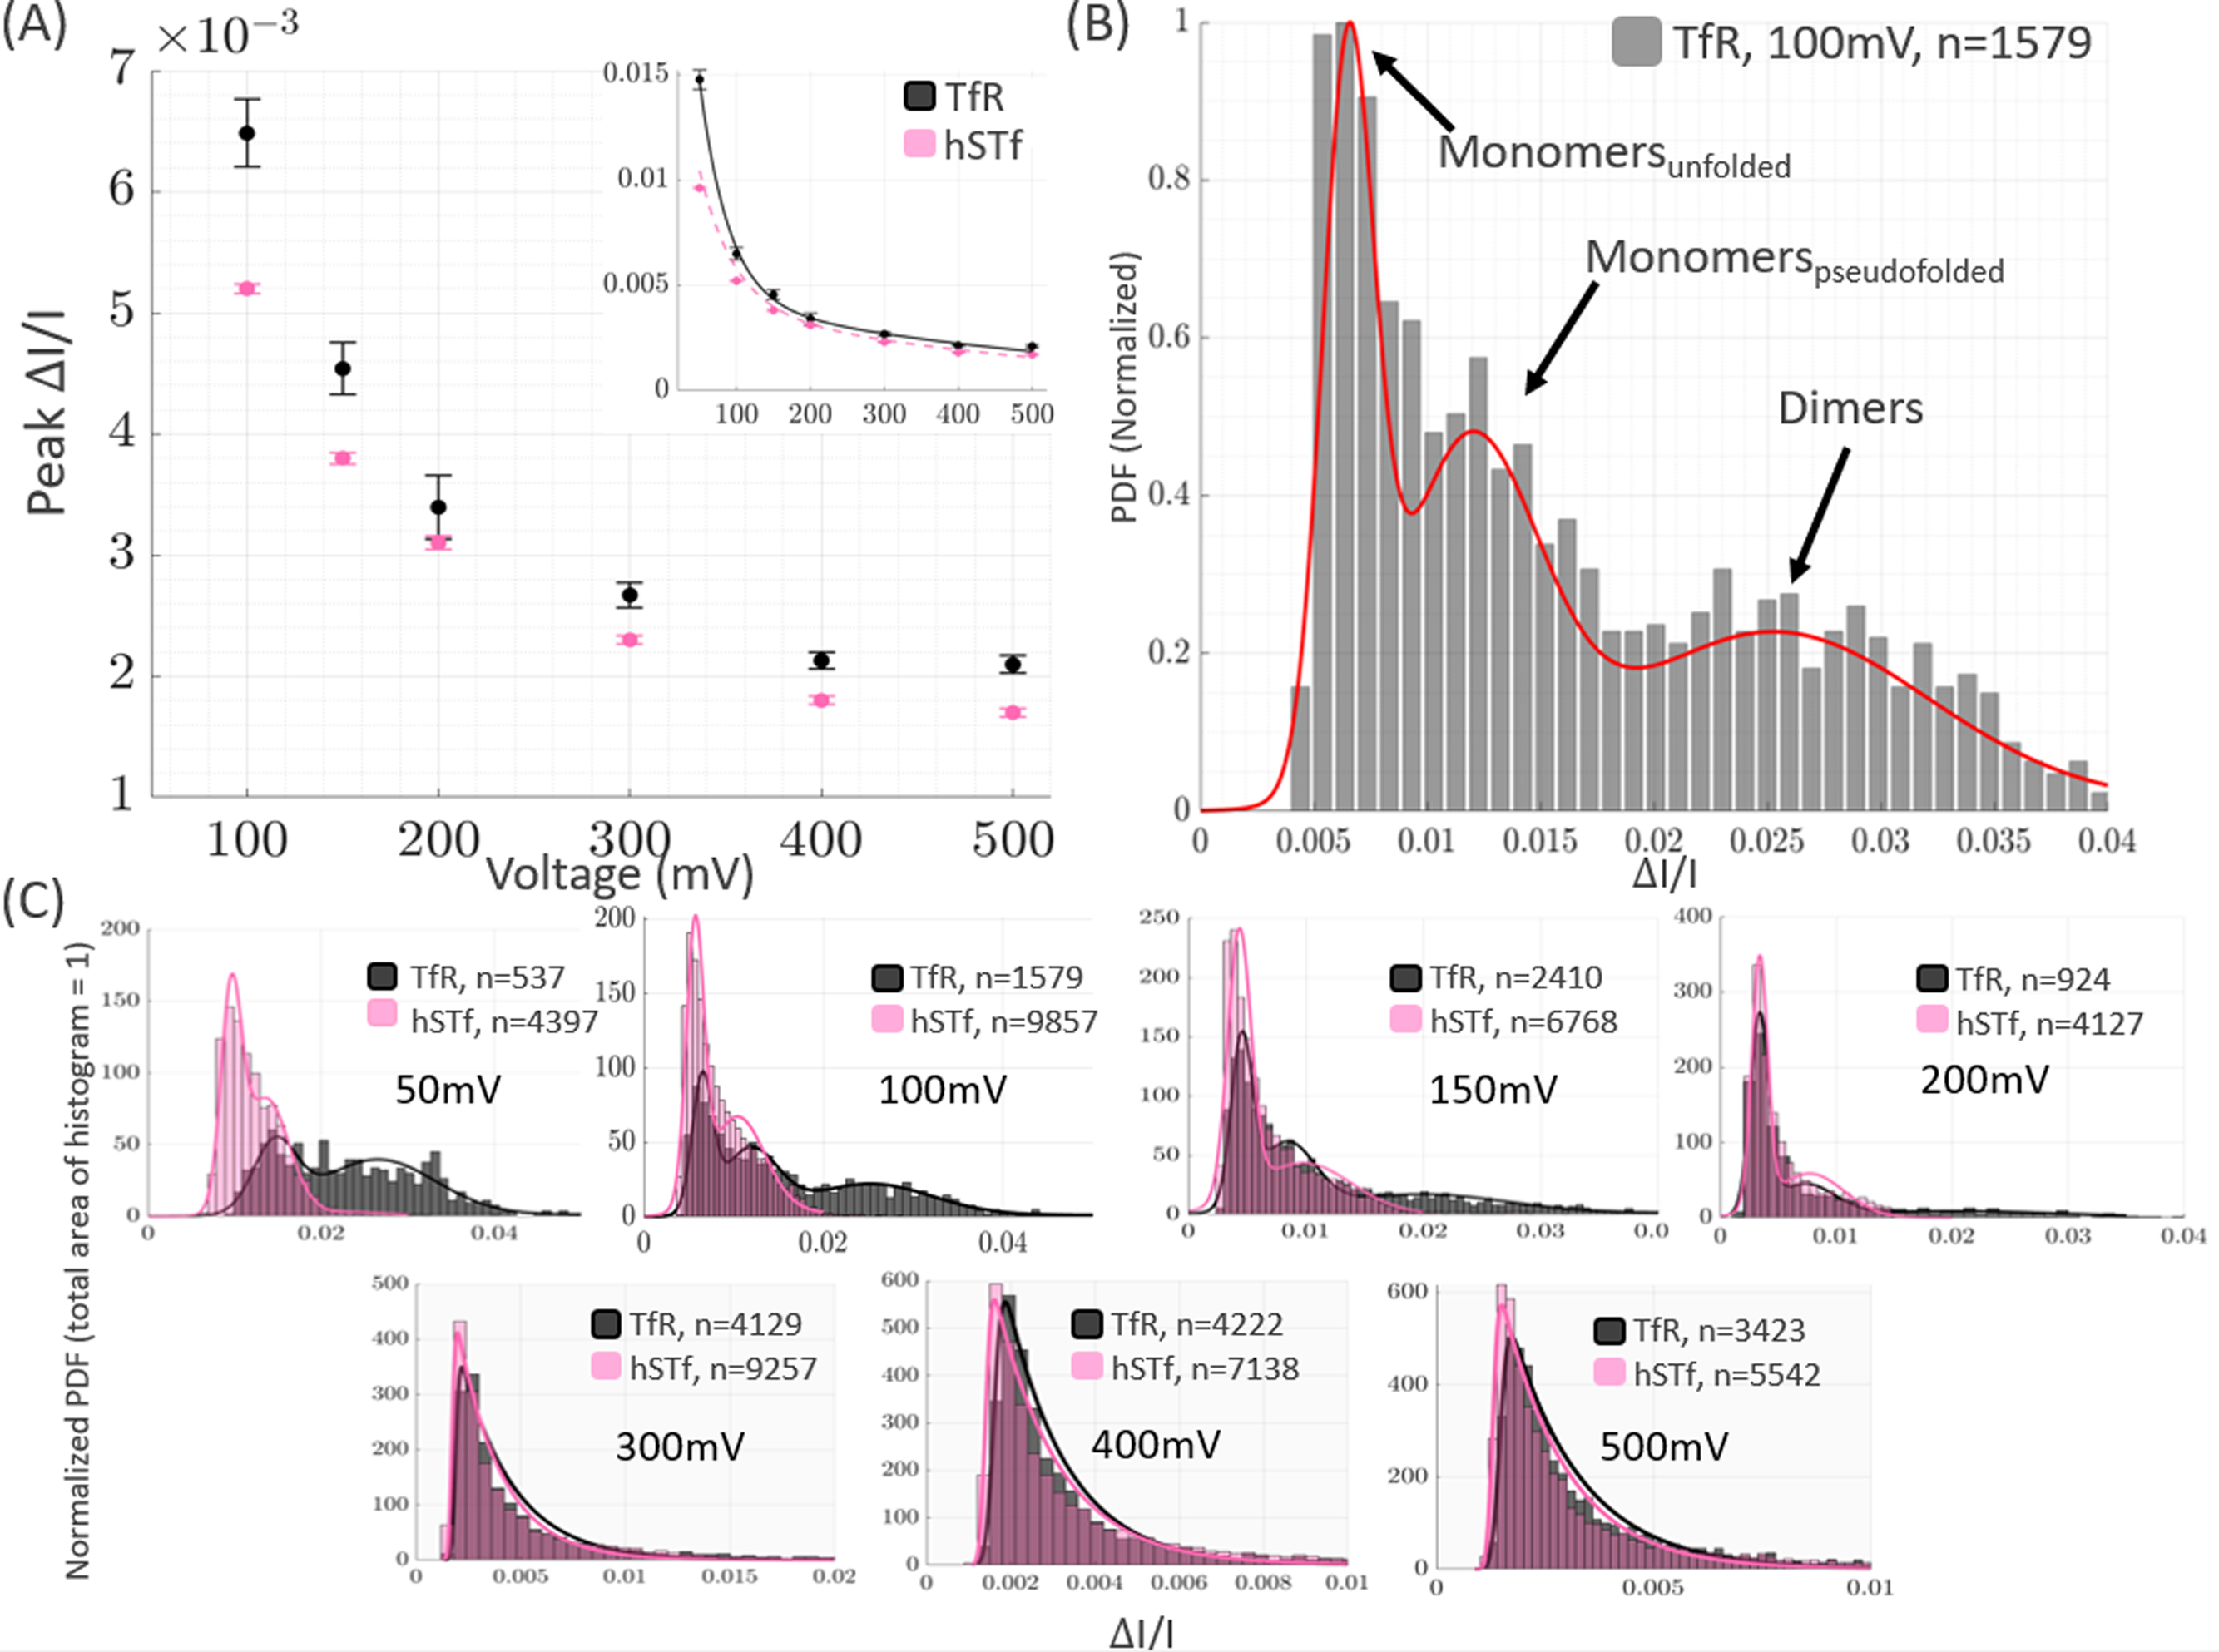
Both holo-hSTf and TfR assume similar current blockage trends as voltage is increased, consistent with voltage-induced unfolding of proteins. (A) Peak current blockage with increasing voltage. TfR and hSTf are distinguishable from each other at all voltages other than 200mV. (B) Exemplary histogram of TfR at 100mV fitted with a Gaussian Mixture Model consisting of three components, which are attributed to its unfolded monomeric form, pseudo-folded monomeric form, and dimeric form, respectively. (C) Current blockage histograms of TfR and hSTf with increasing voltage, showing that at voltages ≤ 200mV, an additional peak exists in the TfR distribution that is not present in hSTf.
The presence of monomeric and dimeric TfR is further supported by the histogram distributions of TfR which show that, unlike hSTf, TfR has a trimodal distribution at voltages below 200mV (Fig. 2C). This trimodal distribution of TfR is most pronounced at lower voltages (50mV to 200mV), with the rightmost peak corresponding to dimeric TfR and the other peaks corresponding to monomeric forms of TfR (Fig. 2B); excluded volume measurements corresponding to this third peak yield volumes that are within error of the theoretical volume of dimeric TfR, further suggesting that this population corresponds to dimeric TfR (Section 3.4). At each voltage, monomeric TfR molecules existed in an unfolded state or a pseudofolded state. The term pseudo-folded describes proteins that mostly maintain their native state as they translocate across the nanopore [6]. The term pseudo-folded is more accurate than describing the proteins as native, since some degree of unfolding occurs as a protein is subjected to electric fields such as those used in this study [3,35]. TfR’s pseudo-folded and unfolded monomeric states are further discussed in Section 3.2. The rightmost peak in Fig. 2B is 2.1x greater than the peak corresponding to TfR’s pseudo-folded monomeric state. Since scales with excluded volume, this difference observed in between TfR’s monomeric and dimeric states is reasonable because dimeric TfR has approximately 2x the volume of monomeric TfR. It is important to note that the peak values in Fig. 2A were determined by selecting the absolute maximum of an exponentially-modified Gaussian fit [33] of the corresponding histograms (SI-1). Therefore, the peak values that are plotted in Fig. 2A are only from the tallest peaks in each histogram (Fig 2C), representing unfolded monomers of TfR. The trimodal nature of the TfR distribution is exemplified in Fig. 2B, where it was fitted with a Gaussian mixture model. With increasing voltage, the TfR distribution shifts to peak at smaller values, and the peak representing dimeric TfR becomes less prominent (Fig. 2C).
For both TfR and hSTf, the peak values of decreased with increasing voltage. This decrease in with increasing voltage has been explained previously as being caused by increased unfolding of the protein as voltage application increases [6]. At higher voltages, there is a greater electric field across the nanopore and thus the force experienced at the nanopore results in partial unfolding of the protein. The electric field experienced by the proteins ranged from 1.6 × 10⁴ V/cm to 1.6 × 10⁵ V/cm. An electric field of this magnitude is more than twice the electric field experienced by proteins during standard gel electrophoresis experiments, and thus a certain degree of protein unfolding can be expected [35]. Globular proteins in their native state have internal cavities and buried waters, which give them a larger molecular volume than their unfolded state [36]. As voltage increases, the protein experiences a greater electric field, causing it to progressively unfold; as the protein unfolds, its molecular volume decreases and thus causes a lesser disruption in the open pore current upon traversing the nanopore. Both TfR and hSTf decreased in their peak as voltage was increased, suggesting that both experience a certain degree of unfolding as the voltage increases. A significant result of the analysis of both TfR and hSTf is that they can be distinguished from each other based on their unique unfolding behavior. As Fig. 2A shows, TfR is distinguishable from hSTf at most of the voltages used.
3.2. Voltage-Induced Unfolding of TfR and hSTf
Calculating the drop in conductance () is a useful metric for examining the unfolding behavior of proteins since it is a factor of analyte size and shape and is independent of the applied voltage [6]. It is particularly useful for observing the unfolding behavior of a protein as voltage increases, since it is normalized by the applied voltage. To determine if a protein is unfolded or in its near-native state, we used the full width half maximum (FWHM) of the distribution at 100mV as the boundary for classifying the proteins as pseudo-folded or unfolded [3,6]. The unfolding behavior of TfR and hSTf was examined as a function of voltage and the percentage of unfolded proteins was shown to exponentially increase as voltage was increased (Fig. 3A). The distributions of TfR and hSTf at each voltage were fit with either a Gaussian-mixed model or an exponentially-modified Gaussian depending on which fit more accurately described the data (Fig. 3C). AIC and BIC values were used to choose which model fit the data best [30, 31]. The TfR distribution at 100mV was used to define the boundaries for the unfolded and pseudo-folded proteins, as both subpopulations were clearly prevalent (Fig. 2B). At this voltage, relatively minimal unfolding is expected; any event that resulted in a change in that was less than the outermost boundary defined in Fig. 3C (yellow shaded region) was classified as being unfolded. Globular proteins in their native state have larger molecular volumes than their unfolded state due to internal cavities and buried waters, and thus globular proteins generally result in larger values (and thus larger values) [36]. Beyond 400mV, the TfR distribution consisted of ~>95% unfolded proteins and was best fit with an exponentially-modified Gaussian. The significant increase of unfolded TfR and hSTf molecules as voltage is increased is similar to what has been previously observed for hSTf [6]. It is likely that the electric field caused by applying >400mV is sufficient to perturb the secondary intramolecular interactions responsible for the tertiary structure of the protein and cause the protein to assume an unfolded conformation.
Figure 3.
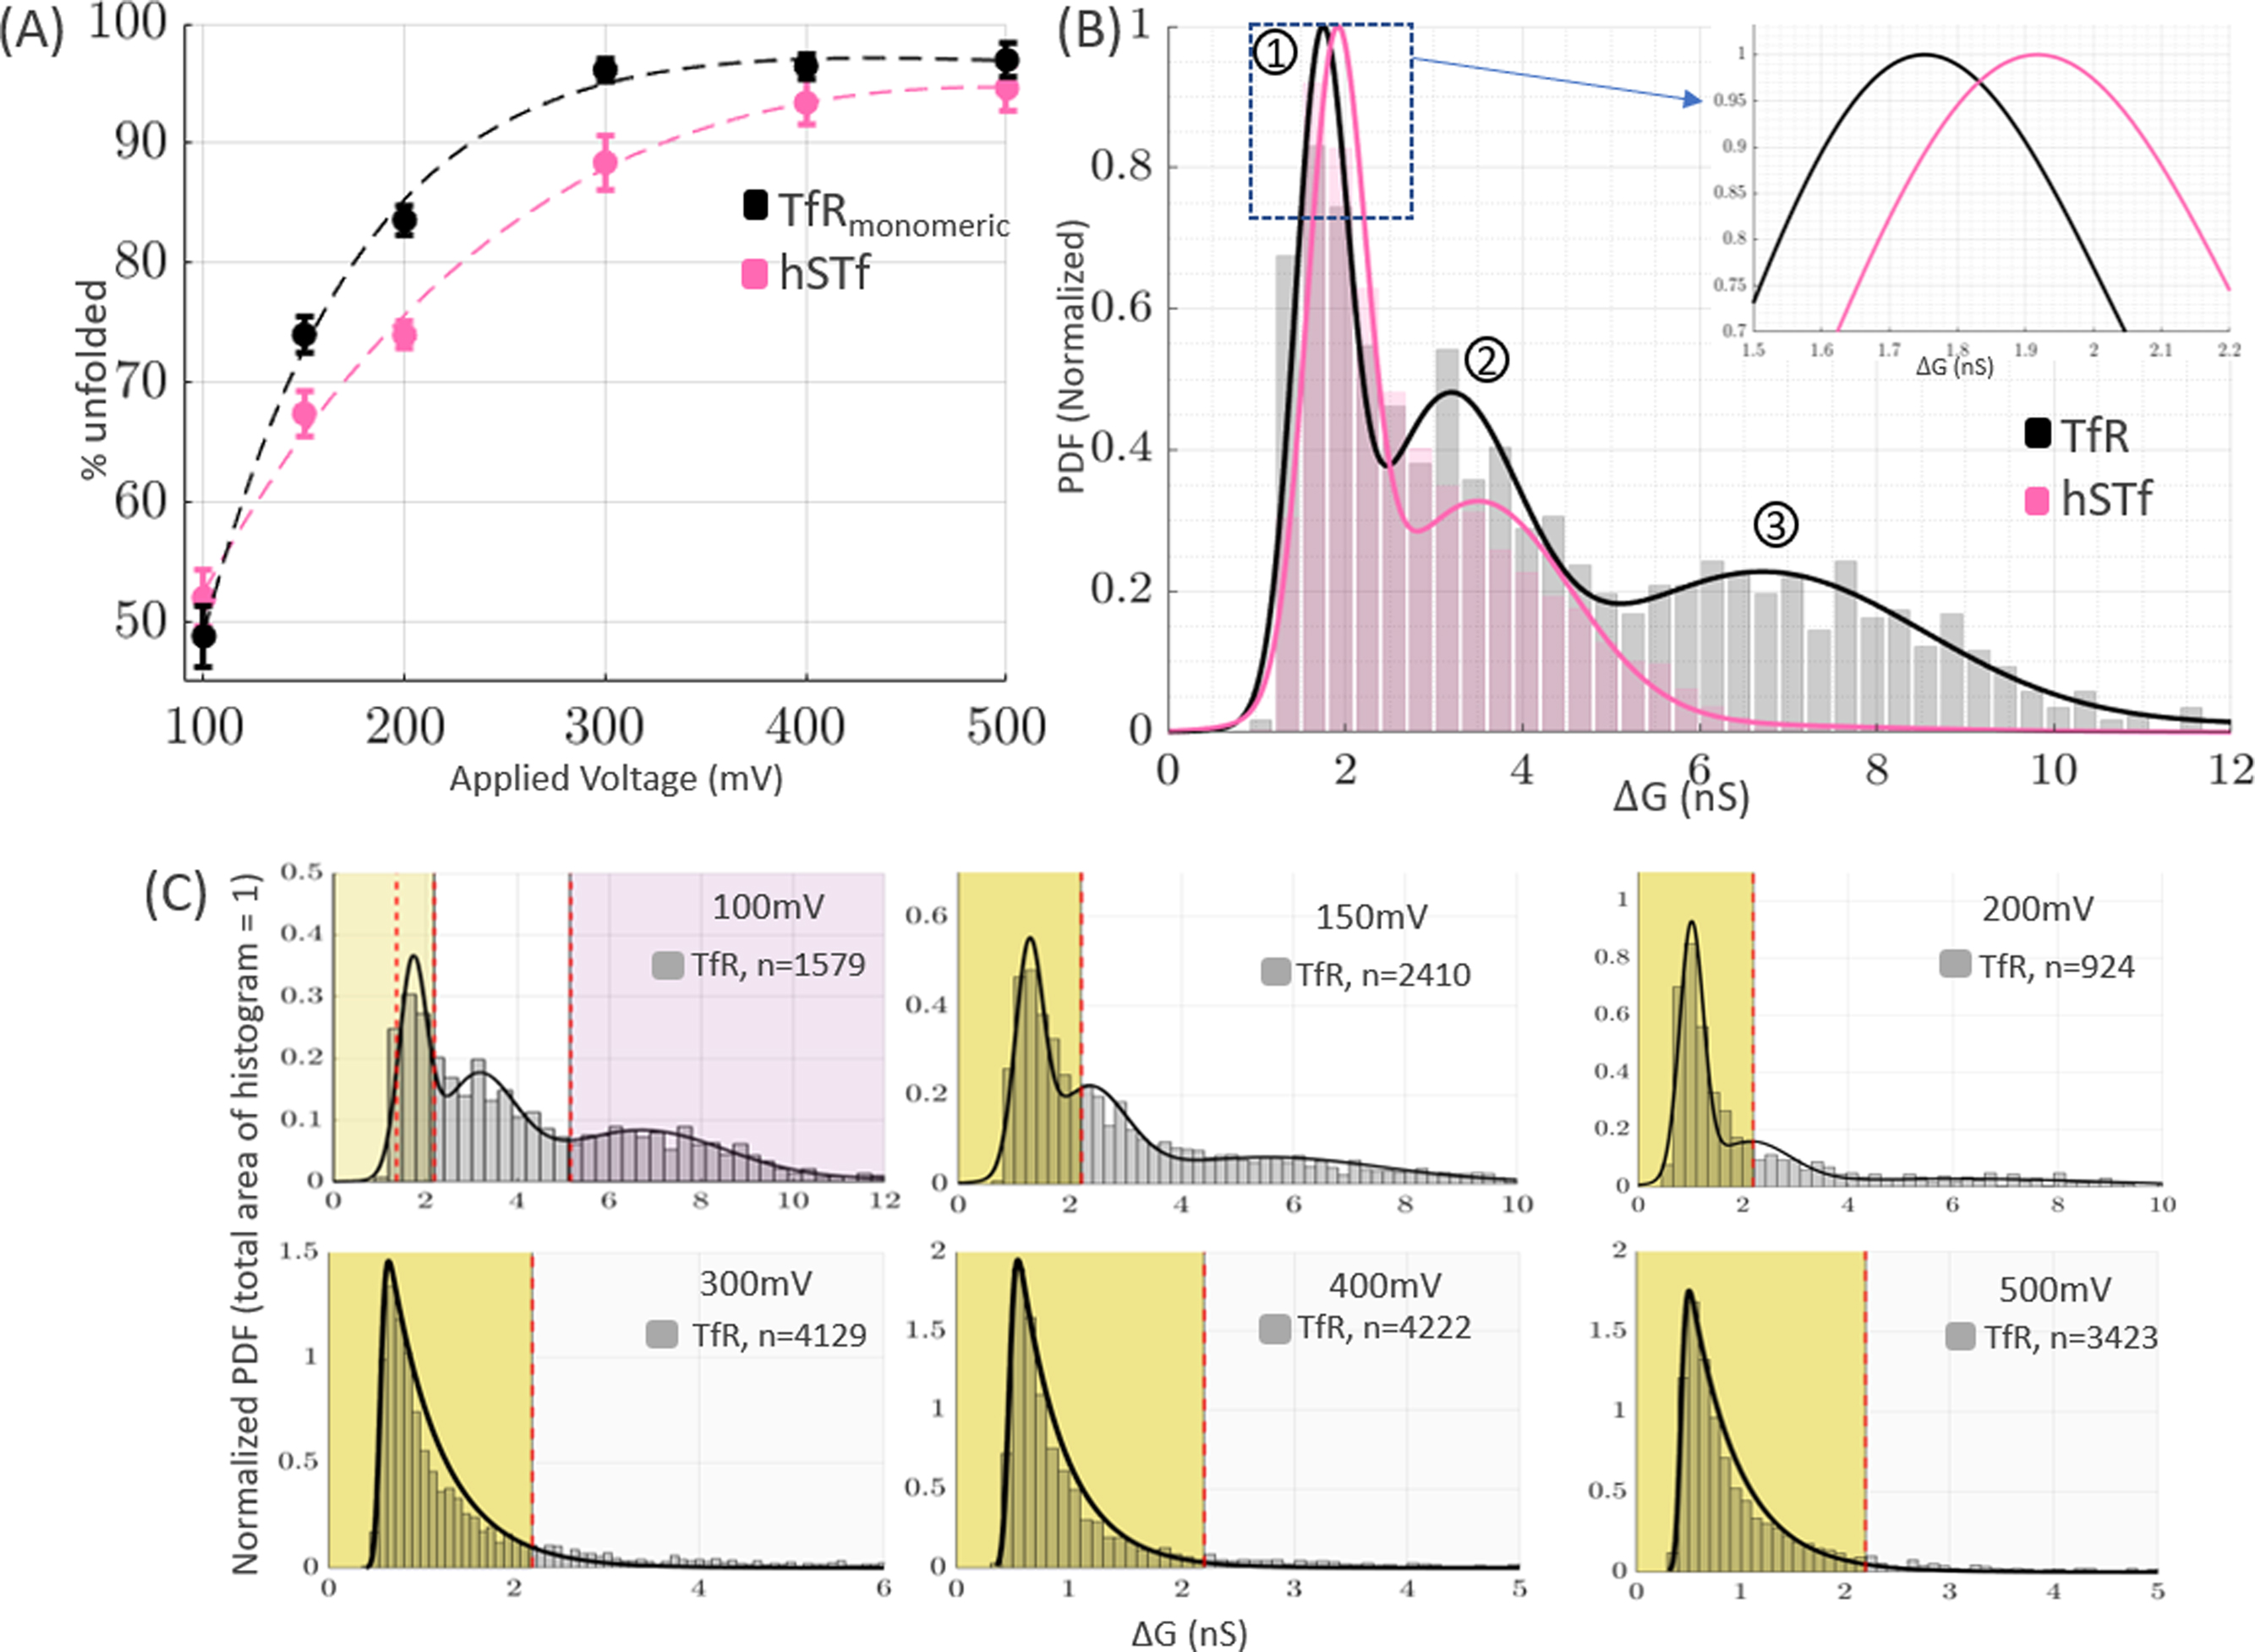
The amount of unfolded TfR and hSTf proteins in each sample increases exponentially as voltage is increased. (A) Percentage of unfolded hSTf and TfR as voltage is increased. Error bars represent 95% confidence intervals on the estimations. (B) Normalized distribution of TfR (black) and hSTf (pink) at 100mV. Three peaks are evident for TfR and are labelled “1”, “2”, and “3”. Peaks 1, 2, and 3 correspond to (1) unfolded monomeric TfR, (2) pseudofolded monomeric TfR, and (3) dimeric TfR, respectively. No such third peak is seen in hSTf. (C) Histograms of TfR from 100–500mV. The distributions were fit with either a mixed Gaussian or an exponentially-modified Gaussian. The yellow-shaded region represents the FWHM cut-off value for classifying a protein as pseudo-folded or unfolded. The purple shaded region represents translocations that were considered to represent dimeric TfR and thus were not considered in this section. Similar histograms for hSTf can be found in SI-6 of the Supplementary Information.
Unlike hSTf at 100mV, TfR showed three distinct peaks (Fig. 3B). The peak corresponding to pseudo-folded monomeric TfR (“1” in Fig. 3B) was 81.3±7.0% larger than the peak corresponding to unfolded monomeric TfR (“2” in Fig. 3B). The difference in the peaks between pseudo-folded and unfolded monomeric TfR is strikingly similar to the difference in the peaks between pseudo-folded and unfolded monomeric hSTf; however, the third peak of TfR at 100mV (“3” in Fig. 3B) is 113±8.6% greater than the peak corresponding to pseudofolded monomeric TfR. Such a peak is not present in the distribution of hSTf (Fig. 3B). As the voltage increases, this third peak disappears.
Since the dimeric and monomeric distribution comparison of TfR is made in another section (Section 3.4), this section focuses only on the unfolding behavior of monomeric TfR. Thus, any events that had a that was greater than 3 standard deviations away from peak 2 (Fig. 3B) at 100mV were excluded from analysis (purple shaded region in Fig. 3C). This was done to ensure that only trends from monomeric TfR would be observed. The percentage of unfolded TfR monomers exponentially increased as voltage was increased and began to plateau beyond 300mV (Fig. 3A). The percentage of unfolded monomers were within error of each other beyond 300mV, at approximately 96.4% unfolded. At 200mV, 83.6% of the TfR monomers were unfolded; this is 9.6% more unfolded than hSTf at the same voltage. This trend of TfR monomers being more unfolded than hSTf held true at all voltages other than 100mV, where they were within error of each other. TfR exists natively as a dimer, and thus it is likely that it is less stable in its monomeric state; When TfR is in its monomeric state, its surface-area-to-volume ratio increases and the largely nonpolar area at the interface between TfR dimers is exposed to the aqueous environment; this may cause instability and serve as an explanation for the increased unfolding observed in TfR monomers as voltage is increased.
3.3. Translocation Time Analysis of TfR and hSTf
Both TfR and hSTf traversed the nanopore extremely rapidly, as shown in Fig. 4C. TfR and hSTf are indistinguishable from each other based on peak translocation time alone. Although the peak Δt values do not change significantly with increasing voltage, the overall distributions of Δt do change with increasing voltage (Fig. 4A). Significant differences in the mean values as voltage was increased suggested that there were characteristic differences in translocation times that were not captured by the peak translocation time values. As done in previous studies with transferrin [6], the percentage of events less than 50 μs (“rapid translocation events’) as voltage increased was analysed and showed that there was an exponential increase in rapid translocation events as voltage was increased (Fig. 4A).
Figure 4.
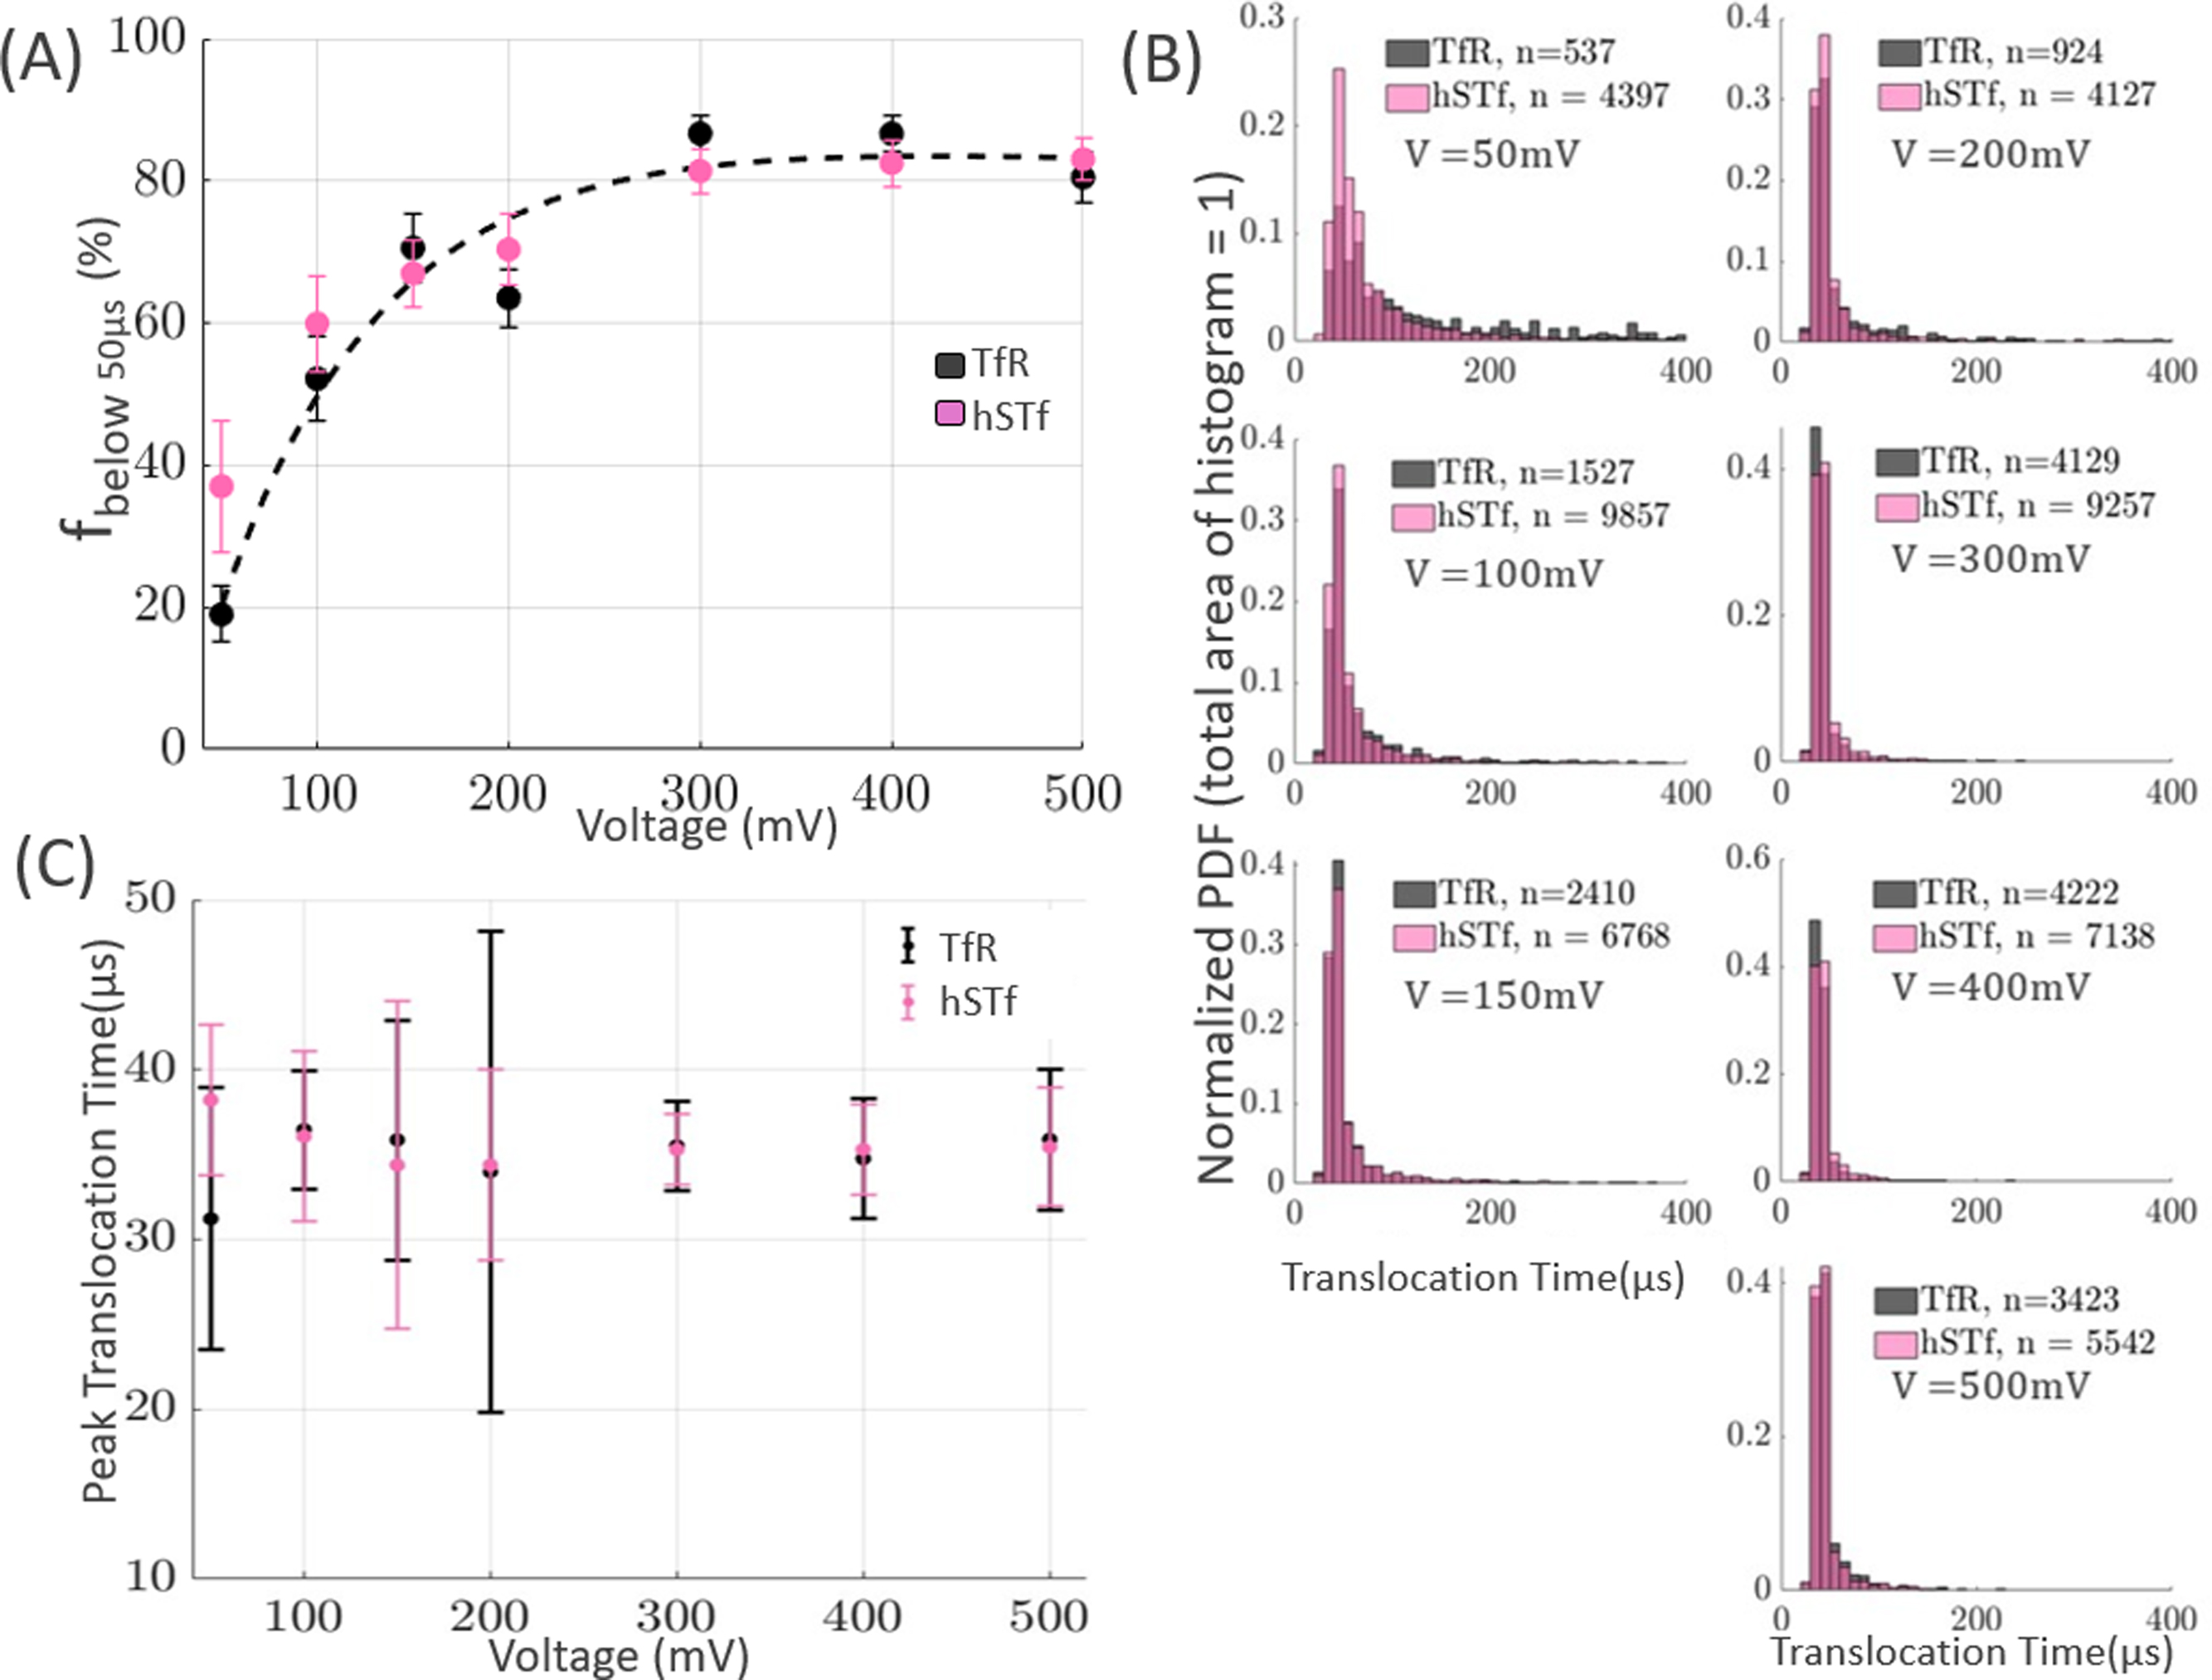
(A) Both hSTf and TfR increase in the fraction of events with a translocation time less than 50 μs as voltage is increased. Error bars represent 95% confidence intervals, and the dashed black line is an exponential fit to TfR’s translocation data. To minimize obscuring the graph, the fit for hSTf is not shown. (B) Histograms of the translocation times of TfR and hSTf at pH 8. TfR is indistinguishable from hSTf based on their peak translocation times alone. (C) Both holo-hSTf and TfR assume similar and rapid peak translocation times at a pH of 8. Error bars represent 95% confidence intervals for peak translocation time.
The translocation speed of a protein through a nanopore is dependent upon the proteins size, shape, and charge [37]. The isoelectric point (pl) of hSTf and TfR are approximately 5.2–5.4 and 5.15 [31, 38, 39]. However, TfR’s calculated net charge at pH 8 is –6.8 mV, which is less than the experimentally-determined charge of hSTf at pH 8 (–7.7±0.5 mV) [6, 38]. The lower charge that TfR has may explain the larger amount of TfR events with translocation times >50 μs. In future experiments, the effective charge of the protein can be modified by changing the pH of the solution. By changing the pH of the solution to a value that is sufficiently close to the pI of the protein, the electrophoretic force experienced by the protein will diminish and thus the protein may transit through the nanopore with a slower velocity.
When a protein adsorbs to the wall of a nanopore, milli-second to second long events frequently occur [40, 41]. The number of events observed with a translocation time greater than 1ms was miniscule (SI-8) and not suggestive of substantial pore-protein interaction.
3.4. Excluded Volume Analysis of TfR
To further examine the monomeric and dimeric populations of TfR, the excluded volume of electrolyte was calculated for TfR at each voltage used. Excluded volume measurements are highly sensitive to dimensional changes in protein conformations [6], and thus it is expected that the dimeric and monomeric populations will be well discriminated from each other. Excluded volume calculations were made as previously established [6]. Shorty, the following equation was used:
| (2) |
Where , and are the excluded volume, change in ionic current, shape factor (assumed to be 1.5 for spheres), length of the nanopore, conductivity of the electrolyte solution, applied voltage, and the correction factor. The correction factor was determined by using the known volume of hSTf at pH 8 from literature [6]. At 100mV, a relatively minimal amount of voltage-induced unfolding is present and the peaks defining pseudo-folded and unfolded hSTf are easily discriminated from each other. Thus the for hSTf at 100mV was used to determine the correction factor, . The correction factor is explained in depth elsewhere [35]. Using a volume of 107±4 nm3 [6] and the of hSTf at 100mV, the correction factor was calculated (SI-9).
The excluded volume is dependent on the shape of the molecule and was used simply to detect changes in the shape of the molecule. hSTf was analyzed for the primary purpose of serving as a biological ruler for ultimately determining the excluded volumes of monomeric and dimeric TfR.
For voltages lower than 300mV, 3 peaks were prominent in the distributions for TfR (Fig. 2B and Fig. 3C). Thus, three different excluded volumes were calculated for TfR at these voltages. As mentioned in Section 3.1, TfR can exist in solution as a monomer (~80kDa) or a dimer (~155kDa), having calculated molecular volumes of ~177nm3 and ~353 nm3 respectively (SI-3). Thus, it is expected that the calculated volumes for TfR based on our analysis will yield similar values. As shown in Fig. 5A, the excluded volumes are strikingly similar to their theoretical volumes; The dimeric population (green in Fig. 5A) has an excluded volume of 342±19.7nm3, which is within error of the theoretical volume of dimeric TfR. Additionally, the excluded volume for the dimeric population remained constant (within error) for all the voltages in which the dimeric population was present. Unlike dimeric TfR, the monomeric forms of TfR did decrease in excluded volume with increasing voltage (Fig. 5A). The lack of a similar decrease in the dimeric population may suggest that TfR dissociates into its monomeric form before significant protein unfolding occurs.
Figure 5.
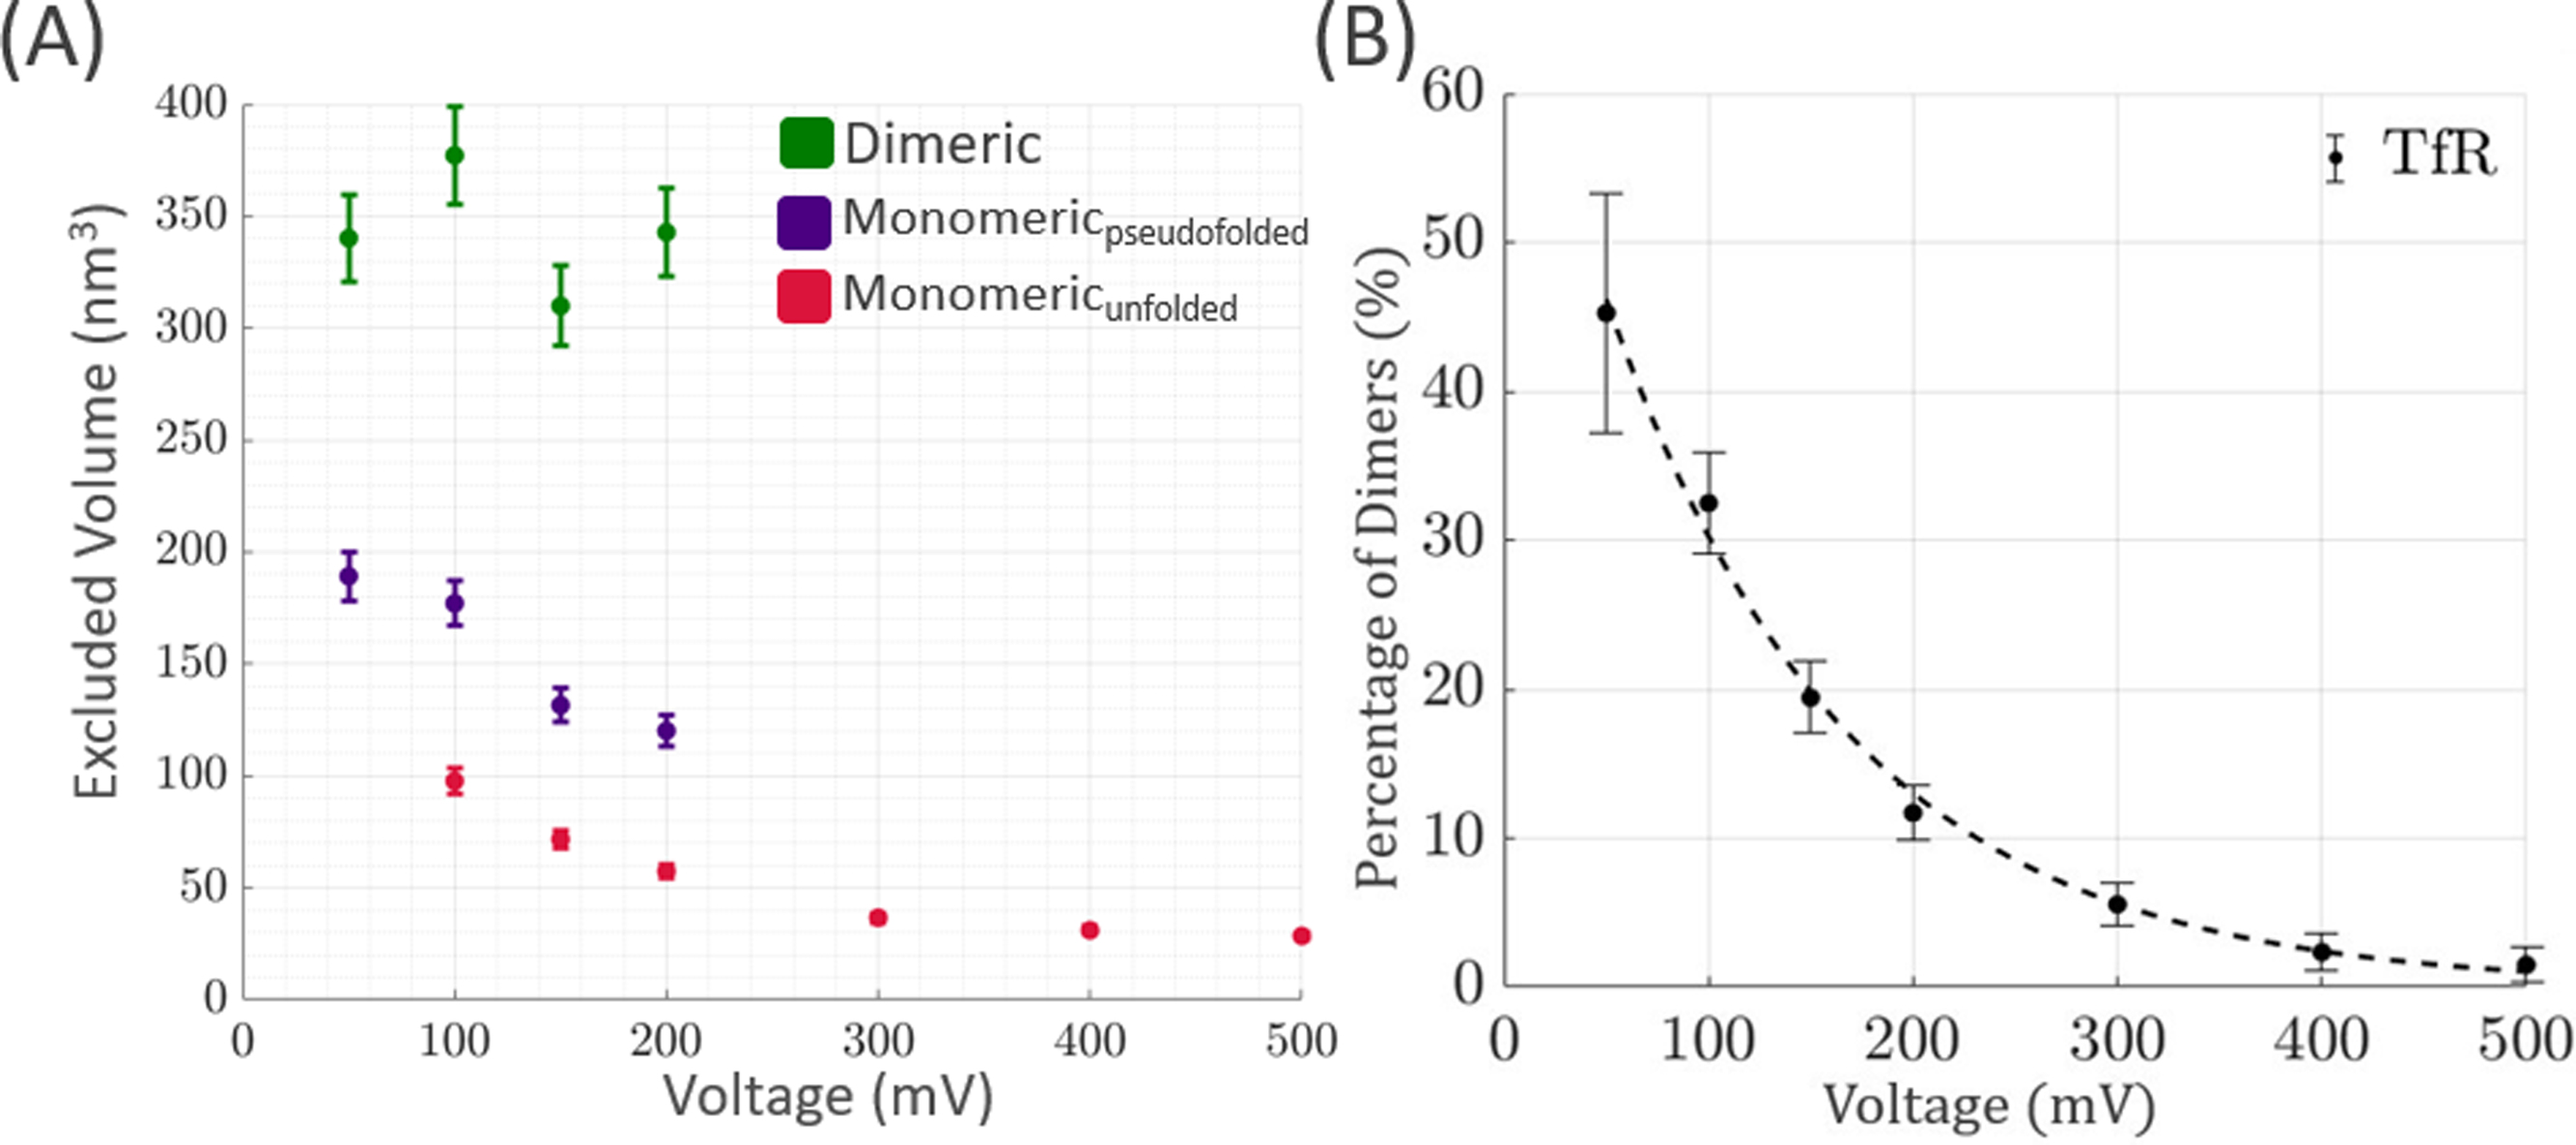
Excluded Volume analysis of TfR (A) Monomeric and dimeric excluded volumes of TfR as a function of voltage. Both dimeric and monomeric TfR have similar excluded volumes to their geometrical volumes (SI-3) at lower voltages. As voltage increases, monomeric TfR experiences a decrease in excluded volume, and dimeric TfR disappears entirely. (B) Percentage of overall TfR population that is in its dimeric state. Boundaries for classifying the dimers were determined from the excluded volume distribution of TfR at 50mV, where the protein is expected to be mostly in its native state. The black dotted line is an exponential fit to the data (RMSE = 1.258). Increasing voltage causes an exponential drop in the percentage of dimeric proteins.
At 50mV, where the least amount of voltage-induced unfolding is expected to occur, monomeric TfR had an excluded volume of 189±10.9 nm3, which is slightly larger than the theoretical value of ~177nm3. The excluded volume of monomeric TfR continues to decrease until it becomes completely unfolded (>95% unfolded). Beyond 300mV, there is no significant dimeric population, and the excluded volumes of unfolded TfR are within error of each other at all voltages 300mV.
Boundaries for classifying the dimeric population of TfR were established from the data at 50mV (SI-2). At 50mV, dimeric TfR had an excluded volume of 342±19.7nm3. For classification of dimeric and monomeric TfR in the solution, all events with an excluded volume greater than or equal to 342±19.7nm3 were considered to be dimeric TfR (SI-2). This is a conservative estimate, and the actual amount of dimeric TfR in the solution is likely to be slightly higher.
The dimeric TfR population exponentially diminishes to ~1% as the applied voltage increases (Fig. 5B); It can be seen that at an applied voltage of 50mV, nearly 50% of the TfR solution was in its dimeric form. The amount of dimeric TfR exponentially decreases as voltage increases and levels off to ~1% at voltages greater than 400mV. These findings suggest that the dimeric state of TfR can be exponentially disrupted by an externally applied voltage, providing insight as to how a membrane voltage may affect the stability of dimeric TfR.
4. Concluding Remarks
Solid-state nanopores were used to profile the translocation behavior of human serum transferrin receptor (TfR) and human serum transferrin (hSTf) under various voltages. Monomeric TfR and hSTf were able to be distinguished based on their unique resistive pulse signatures, providing a cheap and effective method for differentiating between the two protein populations. An increase in voltage was found to exponentially increase the amount of unfolded proteins for both TfR and hSTf. Additionally, the dimerization behavior of TfR was probed under varying voltages, showing that an increase in electric field causes a decrease in the prevalence of TfR dimers. It was found that increasing the applied voltage – and thus the electric field experienced by the protein – induced greater monomerization of transferrin receptor dimers. In future studies, the effect that the interaction between the pore wall and the proteins had on translocation characteristics could be minimized by coating the nanopore wall with a non-adsorptive coating such as Tween 20 [42]. Additionally, applying a wider range of voltages within the 50–200mV range may provide more insight to the unfolding mechanism and monomerization characteristics of TfR. Also, perhaps modifying the pH, and thus the net charge of the protein, may result in slower translocation times at these voltages; however, significant modification of the pH may induce conformational changes in TfR that would not accurately represent TfR in its native state.
Supplementary Material
Acknowledgements
This work was supported by the National Science Foundation (CBET #20222398 and #2022374) and National Institute of Health (R21CA240220). The authors would also like to acknowledge Dr. Chiwon Ahn at the National NanoFab Center and Mr. Richard H. Choi at the University of Southern California for their engineering support and insightful discussion. Additionally, the authors would like to thank Clara Godoy for her artistic rendition of Fig. 1D.
Abbreviations:
- hSTf
human serum transferrin protein
- SSN
solid-state nanopore
- TfR
transferrin receptor protein 1
Footnotes
Conflict of interest
The authors have declared no conflict of interest.
Supporting information file: Link to Supplementary Information
Data availability statement
The data that support the findings of this study are available from the corresponding author upon reasonable request.
References
- [1].Prabhu AS, Jubery TZN, Freedman KJ, Mulero R, Dutta P, Kim MJ. Chemically modified solid state nanopores for high throughput nanoparticle separation. J Phys Condens Matter. 2010;22(45):454107. [DOI] [PubMed] [Google Scholar]
- [2].Han A, Creus M, Schürmann G, Linder V, Ward TR, De Rooij NF, et al. Label-free detection of single protein molecules and protein− protein interactions using synthetic nanopores. Analytical chemistry. 2008;80(12):4651–8. [DOI] [PubMed] [Google Scholar]
- [3].Freedman KJ, Haq SR, Edel JB, Jemth P, Kim MJ. Single molecule unfolding and stretching of protein domains inside a solid-state nanopore by electric field. Sci Rep. 2013;3(1):1638. [DOI] [PMC free article] [PubMed] [Google Scholar]
- [4].Gu L-Q, Shim JW. Single molecule sensing by nanopores and nanopore devices. Analyst. 2010;135(3):441–51. [DOI] [PMC free article] [PubMed] [Google Scholar]
- [5].Darvish A, Lee JS, Peng B, Saharia J, VenkatKalyana Sundaram R, Goyal G, et al. Mechanical characterization of HIV-1 with a solid-state nanopore sensor. Electrophoresis. 2019;40(5):776–83. [DOI] [PMC free article] [PubMed] [Google Scholar]
- [6].Saharia J, Bandara YMNDY, Goyal G, Lee JS, Karawdeniya BI, Kim MJ. Molecular-level profiling of human serum transferrin protein through assessment of nanopore-based electrical and chemical responsiveness. ACS Nano. 2019;13(4):4246–54. [DOI] [PubMed] [Google Scholar]
- [7].Xue L, Yamazaki H, Ren R, Wanunu M, Ivanov AP, Edel JB. Solid-state nanopore sensors. Nat Rev Mater. 2020;5(12):931–51. [Google Scholar]
- [8].Aisen P. Transferrin receptor 1. Int J Biochem Cell Biol. 2004;36(11):2137–43. [DOI] [PubMed] [Google Scholar]
- [9].Kohgo Y, Nishisato T, Kondo H, Tsushima N, Niitsu Y, Urushizaki I. Circulating transferrin receptor in human serum. Br J Haematol. 1986;64(2):277–81. [DOI] [PubMed] [Google Scholar]
- [10].Cook JD, Skikne BS, Baynes RD. Serum transferrin receptor. Annu Rev Med. 1993;44(1):63–74. [DOI] [PubMed] [Google Scholar]
- [11].Shih YJ, Baynes RD, Hudson BG, Flowers CH, Skikne BS, Cook JD. Serum transferrin receptor is a truncated form of tissue receptor. J Biol Chem. 1990;265(31):19077–81. [PubMed] [Google Scholar]
- [12].Lawrence CM, Ray S, Babyonyshev M, Galluser R, Borhani DW, Harrison SC. Crystal structure of the ectodomain of human transferrin receptor. Science. 1999;286(5440):779–82. [DOI] [PubMed] [Google Scholar]
- [13].Cheng Y, Zak O, Aisen P, Harrison SC, Walz T. Structure of the human transferrin receptor-transferrin complex. Cell. 2004;116(4):565–76. [DOI] [PubMed] [Google Scholar]
- [14].Jabara HH, Boyden SE, Chou J, Ramesh N, Massaad MJ, Benson H, et al. A missense mutation in TFRC, encoding transferrin receptor 1, causes combined immunodeficiency. Nat Genet. 2016;48(1):74–8. [DOI] [PMC free article] [PubMed] [Google Scholar]
- [15].McGrowder D, Brown P, Alexander-Lindo RL, Budall S, Irving R, Gordon L. The use of soluble transferrin receptor in the detection of rHuEPO abuse in sports. Biochem Insights. 2010;3:S3943. [Google Scholar]
- [16].Ahluwalia N. Diagnostic utility of serum transferrin receptors measurement in assessing iron status. Nutr Rev. 1998;56(5 Pt 1):133–41. [DOI] [PubMed] [Google Scholar]
- [17].Radoshitzky SR, Abraham J, Spiropoulou CF, Kuhn JH, Nguyen D, Li W, et al. Transferrin receptor 1 is a cellular receptor for New World haemorrhagic fever arenaviruses. Nature. 2007;446(7131):92–6. [DOI] [PMC free article] [PubMed] [Google Scholar]
- [18].Marianayagam NJ, Sunde M, Matthews JM. The power of two: protein dimerization in biology. Trends Biochem Sci. 2004;29(11):618–25. [DOI] [PubMed] [Google Scholar]
- [19].Hébert TE, Bouvier M. Structural and functional aspects of G protein-coupled receptor oligomerization. Biochem Cell Biol. 1998;76(1):1–11. [DOI] [PubMed] [Google Scholar]
- [20].Lodish HF. Molecular Cell Biology. 4th ed. New York: Macmillan Learning; 2021. [Google Scholar]
- [21].Varongchayakul N, Huttner D, Grinstaff MW, Meller A. Sensing native protein solution structures using a solid-state nanopore: Unraveling the states of VEGF. Sci Rep. 2018;8(1):1017. [DOI] [PMC free article] [PubMed] [Google Scholar]
- [22].Sakurai K, Oobatake M, Goto Y. Salt-dependent monomer-dimer equilibrium of bovine β-lactoglobulin at pH 3. Protein Sci. 2001;10(11):2325–35. [DOI] [PMC free article] [PubMed] [Google Scholar]
- [23].Zhang XC, Li H. Interplay between the electrostatic membrane potential and conformational changes in membrane proteins. Protein Sci. 2019;28(3):502–12. [DOI] [PMC free article] [PubMed] [Google Scholar]
- [24].Chaffey N, Alberts B, Johnson A, Lewis J, Raff M, Roberts K, Walter P. Molecular biology of the cell. 4th ed. Ann Bot. 2003;91(3):401–401. [Google Scholar]
- [25].Saharia J, Bandara YMNDY, Karawdeniya BI, Alexandrakis G, Kim MJ. Assessment of 1/f noise associated with nanopores fabricated through chemically tuned controlled dielectric breakdown. Electrophoresis. 2021;42(7–8):899–909. [DOI] [PMC free article] [PubMed] [Google Scholar]
- [26].Bandara YND, Saharia J, Karawdeniya BI, Hagan JT, Dwyer JR, Kim MJ. Beyond nanopore sizing: improving solid-state single-molecule sensing performance, lifetime, and analyte scope for omics by targeting surface chemistry during fabrication. Nanotechnology. 2020;31(33):335707. [DOI] [PubMed] [Google Scholar]
- [27].Kwok H, Briggs K, Tabard-Cossa V. Nanopore fabrication by controlled dielectric breakdown. PLoS One. 2014;9(3):e92880. [DOI] [PMC free article] [PubMed] [Google Scholar]
- [28].Kowalczyk SW, Grosberg AY, Rabin Y, Dekker C. Modeling the conductance and DNA blockade of solid-state nanopores. Nanotechnology. 2011;22(31):315101. [DOI] [PubMed] [Google Scholar]
- [29].Bandara YMNDY, Saharia J, Karawdeniya BI, Kluth P, Kim MJ. Nanopore data analysis: Baseline construction and abrupt change-based multilevel fitting. Anal Chem. 2021;93(34):11710–8. [DOI] [PubMed] [Google Scholar]
- [30].Kuha J. AIC and BIC: Comparisons of assumptions and performance. Sociol Methods Res. 2004;33(2):188–229. [Google Scholar]
- [31].Burnham KP, Anderson DR. Multimodel inference: understanding AIC and BIC in model selection. Sociol Methods Res. 2004;33(2):261–304. [Google Scholar]
- [32].Frank J. The Kolmogorov-Smirnov test for goodness of fit. J Am Stat Assoc. 1951;46(253):68–78. [Google Scholar]
- [33].Bandara YMNDY, Farajpour N, Freedman KJ. Nanopore current enhancements lack protein charge dependence and elucidate maximum unfolding at protein’s isoelectric point. J Am Chem Soc. 2022;144(7):3063–73. [DOI] [PubMed] [Google Scholar]
- [34].Welch S. Transferrin: The Iron Carrier. Boca Raton, FL: CRC Press; 1992. [Google Scholar]
- [35].Talaga DS, Li J. Single-molecule protein unfolding in solid state nanopores. J Am Chem Soc. 2009;131(26):9287–97. [DOI] [PMC free article] [PubMed] [Google Scholar]
- [36].Rashin AA, Iofin M, Honig B. Internal cavities and buried waters in globular proteins. Biochemistry. 1986;25(12):3619–25. [DOI] [PubMed] [Google Scholar]
- [37].Plesa C, Kowalczyk SW, Zinsmeester R, Grosberg AY, Rabin Y, Dekker C. Fast translocation of proteins through solid state nanopores. Nano Lett. 2013;13(2):658–63. [DOI] [PMC free article] [PubMed] [Google Scholar]
- [38].Kozlowski LP. IPC-isoelectric point calculator. Biology Direct. 2016;11(1):1–16. [DOI] [PMC free article] [PubMed] [Google Scholar]
- [39].Hunt RC, Ruffin R, Yang YS. Alterations in the transferrin receptor of human erythroleukemic cells after induction of hemoglobin synthesis. J Biol Chem. 1984;259(15):9944–52. [PubMed] [Google Scholar]
- [40].Varongchayakul N, Song J, Meller A, Grinstaff MW. Single-molecule protein sensing in a nanopore: a tutorial. Chem Soc Rev. 2018;47(23):8512–24. [DOI] [PMC free article] [PubMed] [Google Scholar]
- [41].Niedzwiecki DJ, Movileanu L. Monitoring protein adsorption with solid-state nanopores. J Vis Exp. 2011;(58):e3560. [DOI] [PMC free article] [PubMed] [Google Scholar]
- [42].Li X, Hu R, Li J, Tong X, Diao JJ, Yu D, et al. Non-sticky translocation of bio-molecules through Tween 20-coated solid-state nanopores in a wide pH range. Appl Phys Lett. 2016;109(14), 143105. [Google Scholar]
Associated Data
This section collects any data citations, data availability statements, or supplementary materials included in this article.
Supplementary Materials
Data Availability Statement
The data that support the findings of this study are available from the corresponding author upon reasonable request.