

ABSTRACT
Background
Studies examining diet and its links to birth outcomes among socioeconomically disadvantaged populations in the United States are scarce.
Objectives
We aimed to identify prenatal dietary patterns, examine their relationships with birth outcomes, and evaluate the variation of these associations by maternal diabetes status [no diabetes, gestational diabetes mellitus (GDM), preexisting diabetes].
Methods
Women in the Maternal and Developmental Risks from Environmental and Social Stressors (MADRES) study (n = 465)—an ongoing, prospective pregnancy cohort of predominantly low-income Hispanic/Latina women in Los Angeles—completed up to two 24-hour dietary recalls in the third trimester of pregnancy. We identified prenatal dietary patterns via factor analysis and evaluated their associations with infant birth weight and gestational age at birth (GA) z-scores, separately, using linear regression, as well as the associations of the dietary patterns with premature births, having an infant that was small for gestational age (SGA), and having an infant that was large for gestational age, using logistic regression and adjusting for relevant covariates. We additionally tested interaction terms between prenatal dietary patterns and maternal diabetes status in separate models. We adjusted for multiple comparisons using the false discovery rate.
Results
We identified 2 dietary patterns: 1) a dietary pattern of solid fats, refined grains, and cheese (SRC); and 2) a dietary pattern of vegetables, oils, and fruit (VOF). Comparing the highest to lowest quartiles, the VOF was significantly associated with a greater infant birth weight (β = 0.40; 95% CIs: 0.10, 0.70; Ptrend = 0.011), a greater GA (β = 0.32; 95% CIs: 0.03, 0.61; Ptrend = 0.036), lower odds of a premature birth (OR = 0.31; 95% CIs: 0.10, 0.95; Ptrend = 0.049), and lower odds of having an infant that was SGA (OR = 0.18; 95% CIs: 0.06, 0.58; Ptrend = 0.028). Only among women with GDM, a 1-SD score increase in the prenatal SRC was significantly associated with a lower infant birth weight (β = −0.20; 95% CIs −0.39, −0.02; Pinteraction = 0.040).
Conclusions
Among low-income Hispanic/Latina pregnant women, greater adherence to the prenatal VOF may lower the risk of a premature birth and having an infant that is SGA. Greater adherence to the SRC, however, may adversely affect newborn birth weight among mothers with GDM, but future research is needed to verify our findings.
Keywords: dietary patterns, 24-hour dietary recalls, birth outcomes, preterm, birth weight, MADRES, Hispanics, Latinas, health disparities, pregnancy
Introduction
In the United States, preterm births and low infant birth weights (LBWs), together, ranked as the second leading cause of infant death in 2018 (1). LBW may result from a preterm birth or fetal growth restriction, for which being small for gestational age (SGA) is a common proxy (2). A recent trend analysis of infants with LBW between 2003–2018 not only suggests the annual prevalence of LBW is increasing in the overall US population but also shows a widening of LBW disparities by ethnic backgrounds and education groups over time (3). Additionally, the prevalence of excessive fetal growth [i.e., being large for gestational age (LGA)] among US newborns has climbed in the last few decades (4). In general, being born too early, too small, or too large has been associated with morbidity and mortality risks among newborns (5, 6). Systematic evidence also suggests these adverse birth outcomes disproportionately affect socioeconomically disadvantaged groups, such as Hispanics and Latinas (7). Studies focusing on these high-risk populations, however, are scarce.
The maternal dietary pattern, or overall diet, during pregnancy has been posited to be an important modifiable risk factor for suboptimal fetal growth and, consequently, adverse birth outcomes (8, 9). Relatedly, a recent review and meta-analysis of previous works evaluating links between maternal dietary patterns during the prenatal period and birth outcomes demonstrated that, in the context of the United States, most studies defined dietary patterns using a theory-based approach, which typically applies a priori diet criteria previously linked to health (e.g., Healthy Eating Index) (10). Alternatively, data-driven approaches empirically derive dietary patterns directly from the dietary intake data in the study population (8). Previous studies of data-driven dietary patterns during pregnancy, however, have mostly been conducted outside the United States (11–18) or reflect the dietary behaviors of the majority group in the study sample, which, in most US-based studies, has typically been non-Hispanic white participants (17, 19). These findings may, therefore, not generalize to diverse and socioeconomically disadvantaged populations (3), for whom interventions are most needed.
Relatedly, dietary findings generalizable to US Hispanics and Latinas in the context of pregnancy are scarce (8, 20, 21), mostly focusing on individual foods or nutrients (22) as compared with the overall diet. The 1 study that characterized data-driven diets and evaluated their associations with infant birth weights in this population (n = 549) captured the diet 5 years postpartum (18), which is very unlikely to reflect the maternal diet during pregnancy. Additionally, these data are dated (early 1980s) and, thus, a scientific update on the characteristics of current dietary behaviors and their relationships with birth outcomes in this population is warranted (20). Additionally, there may be other factors (e.g., maternal diabetes, newborn sex) (23, 24) that may place some women at greater risk for adverse birth outcomes, depending on their eating behaviors, but this has not yet been investigated (25). The findings may ultimately inform tailoring of current prenatal dietary recommendations for low-income US Hispanic/Latina women.
Therefore, this study aims to: 1) empirically derive and characterize prenatal dietary patterns in a predominantly low-income Hispanic/Latina pregnancy cohort; 2) examine relationships between prenatal dietary patterns and infant birth weight outcomes, including birth weight, gestational age at birth (GA), having a preterm birth, being SGA, and being LGA; and 3) evaluate variations in these associations by newborn sex and maternal diabetes status [no diabetes, gestational diabetes mellitus (GDM), and preexisting diabetes].
Methods
Study participants
Data came from the Maternal and Developmental Risks from Environmental and Social Stressors (MADRES) study, an ongoing, prospective pregnancy cohort of predominantly low-income Hispanic/Latina adult women (18 years or older) residing in Los Angeles, CA. MADRES began study enrollment in November 2015 and has been previously described (26). Briefly, participants were mostly recruited from 4 prenatal care facilities serving low-income Hispanic and Latino communities in Los Angeles, CA, including a county hospital prenatal clinic, 2 community health clinics, and 1 private obstetrics and gynecology practice. To a lesser extent, participants were also recruited through self-referral from community meetings and local advertisements. Study eligibility included being ≥18 years of age, having a singleton pregnancy, being <30 weeks gestation, and having language fluency in English or Spanish. Out of 584 participants with relevant data at the third trimester, 119 participants were excluded based on missing or incomplete 24-hour dietary recalls (n = 92), 24-hour dietary recalls with implausible daily total energy intakes (kcals <500 or >5000; n = 4), missing infant birth weight or GA data (n = 5), or missing covariates (n = 18), resulting in a final analytic sample of 465 women (see Supplemental Figure 1). We also include select demographic maternal and newborn characteristics among women with a live birth enrolled thus far in MADRES (n = 724; see Supplemental Table 1). Informed consent was obtained from all participants and study approval was obtained from the University of Southern California's Institutional Review Board.
Birth outcomes
Infant birth weight (grams) was abstracted from the electronic medical record (EMR) of the delivery (99.6%), with a small proportion of participants having a maternal proxy–reported infant birth weight noted on the EMR (<1%). GA values were derived using a hierarchy of methods (27). The highest-quality GA estimates were those from the first-trimester (<14 weeks GA) ultrasound measurement of crown-rump length (62.5%). When those were unavailable, however, second-trimester (<28 weeks GA) ultrasound measurements of fetal biparietal diameter were used (26.1%). When ultrasound measurements from early pregnancy were unavailable, physician-reported estimates abstracted from the EMR were used (11.2%). When all of these measures were missing, the GA was determined using self-reported data from the last menstrual period (<1%). We generated infant birth weight and GA z-scores, separately, by newborn sex [derived mostly from EMRs (96.8%)]. Differences in infant birth weight and GA, however, may not necessarily reflect clinical significance. For this reason, birth outcomes were evaluated dichotomously based on standard clinical definitions. Like previous work, neonates who were SGA and LGA were identified using newborn sex-standardized infant birth weight values <10th and >90th percentiles among births in the study sample, respectively (28). Lastly, premature births were classified as those occurring before the start of the 37th week of pregnancy.
Prenatal dietary assessment
Dietary intake was assessed 2 times (1 weekday and 1 weekend day) using 1 or more staff-administered 24-hour dietary recalls over the phone during the third trimester of pregnancy, using the validated and web-based National Cancer Institute's Automated Self-Administered 24-Hour Dietary Assessment Tool (ASA24; versions 2016–18) (29, 30). No more than 10 attempts were made to reach participants for scheduling ASA24 dietary recall interviews. The second ASA24 dietary recall interviews were completed within 2 weeks of the first interview. During their scheduled interviews, participants were asked to recall all food and beverages consumed in the previous 24 hours. Following the ASA24 protocol, interviewers asked participants detailed questions about food preparation, portion size (with the help of images to assist in estimation), and additions (e.g., sugar, coffee cream). The ASA24 estimates day-level nutrient and food group values using the following 2 unmodified databases: the Food and Nutrient Database for Dietary Studies (version 4.1, 2010) and the MyPyramid Equivalents Database (version 2.0, 2008) (31). Out of the 28 predefined food group serving equivalents, the fish and shellfish food groups were combined and organ meats and alcoholic beverages were excluded from analysis due to <5% consumption (32), resulting in a total of 25 food groups used for analysis. Among those participants with 2 or more recalls, daily food group servings and pregnancy-relevant micronutrients (i.e., folate, choline, calcium, vitamin D, vitamin B12, iron, selenium, and zinc) were averaged. Lastly, all food group intakes with 0 values were replaced by an arbitrarily small value (0.001) and then log-transformed to address skewness (33).
Maternal characteristics
Interviewer-administered questionnaires collected data on confounders, including maternal age (years), education [less than high school (HS), HS degree or equivalent, or more than HS], gestational age at the time of informed consent (weeks), total household income (<$15,000, $15,000–$29,999, ≥$30,000, don't know), Hispanic/Latina ethnicity and nativity (non-Hispanic and non-Latina; US-born Hispanic/Latina; and foreign-born Hispanic/Latina), birth order of the index pregnancy (number), prepregnancy BMI, smoking during pregnancy (yes, no), total physical activity (score) based on metabolic equivalents using the validated Pregnancy Physical Activity Questionnaire (34), and daily total energy intake (kcals/day), which was automatically calculated from the ASA24 and was averaged among participants with multiple 24-hour dietary recalls. Additionally, the modifiers were also considered: newborn sex and maternal diabetes status (no diabetes, GDM, and preexisting diabetes), with the latter based on laboratory values (80%) (35), physician diagnoses (13.6%), and self-reports (6.5%). Given the nature of the maternal medical records, classification of type 1 and type 2 diabetes was not possible.
Dietary pattern derivation
Prior to exploratory factor analysis, high intercorrelations among the 25 food groups [Kaiser–Meyer–Olkin index = 0.60 (>0.50 needed for passing) and Barlett's test for sphericity (P < 0.001)] confirmed adequately high intercorrelations (36), indicating the appropriateness of the factor analysis. Principal factor analysis (PFA) was used to identify the smallest number of unique factors that best explain the common variance across foods. In contrast, principal component analysis analyzes the total variance across foods and is not typically used to identify latent variables (e.g., dietary patterns) (37). Factor retention was guided by a scree plot (see Supplemental Figure 2), factor loadings, the variance explained by each factor, interpretability of the factors, the Kaiser criterion (eigenvalues >1) (38), and previous literature (8, 21). To be consistent with previous work (36), orthogonal (varimax) rotation was performed. Factors (henceforth referred to as dietary patterns) were then characterized based on the largest factor loadings in absolute terms (>0.20) (8, 21) and generated standardized dietary pattern scores for each individual by multiplying the scoring coefficient of each food group by the individual's corresponding food group intake and summing across foods (32, 39). Finally, due to weak and nonlinear relationships between dietary pattern scores and continuous infant birth weight and GA data, dietary pattern scores were divided into quartiles (Qs), with increasing quartiles indicating higher dietary pattern adherence. Due to rare birth outcomes (≤10%), however, we also evaluated associations between continuous dietary patterns (scores) and birth outcomes in a secondary analysis. Because using 1 compared with 2 or more 24-hour dietary recalls has been previously found to be associated with measurement error in energy intake (40), a sensitivity analysis was performed to investigate whether excluding participants with only one 24-hour dietary recall (n = 90) would affect the dietary pattern findings. Lastly, an additional sensitivity analysis was conducted to examine whether dietary pattern findings varied between the study samples including and excluding non-Hispanic and non-Latina women.
Statistical analysis
Maternal characteristics were compared using the highest to lowest quartiles (Q4 compared with Q1, respectively) of each prenatal dietary pattern using t-tests and Pearson chi-squared tests as appropriate. To evaluate the roles of prenatal dietary patterns on infant birth weight and GA, mean differences in infant birth weight and GA were tested comparing the highest to lowest quartiles of each prenatal dietary pattern, separately, using multivariable linear regression models. For dichotomous birth outcomes (having a premature birth, being SGA, being LGA), multivariable logistic regression was employed. Additionally, linear trends were tested by using the midpoint value of each quartile in each prenatal dietary pattern as a continuous measure (41). In separate models, we investigated these associations using the continuous dietary pattern (scores).
Guided by a directed acyclic graph based on a priori knowledge, previous work (8, 21), and the data in the study population, the models were adjusted for maternal age; education; prepregnancy BMI, calculated using weight (kg) divided by height (m2); gestational age at the time of informed consent; birth order; total energy intake; and the only other dietary pattern (quartiles) (8, 21). Although smoking during pregnancy is a likely confounder, variability across response categories was low (1.7% verified having smoked during pregnancy), making adjustment for this variable unnecessary. Models also did not include the GA (at delivery) because the GA may mediate associations between prenatal dietary patterns and infant birth weight and may induce bias if included (8, 42). Additionally, because the intercorrelations among birth outcomes violate the independence assumption associated with common multiple-comparison adjustment methods, to relax this assumption, a common false discovery rate approach was used that “adjusts” observed Ptrend values using a 2-stage procedure (43). To examine variations in these associations by newborn sex and maternal diabetes status, appropriate interaction terms between prenatal dietary patterns (continuously, to preserve power) and these modifiers were additionally included in separate models.
Sensitivity analyses
Although physical activity and total household income are potential confounders of relationships among dietary patterns and birth outcomes, the distribution of these variables was generally similar among the highest and lowest dietary pattern quartiles, which would disqualify physical activity and household income as confounders (44). Nevertheless, in a sensitivity analysis, the presence of confounding was examined by comparing findings among models including and excluding these covariates. Findings from infant birth weight and GA models including and excluding macrosomic newborns (>4500 g) were also compared to ascertain moderate positive differences in these outcomes by prenatal dietary patterns.
All analyses were performed in Stata version 16.1 (Stata Corp), and P values < 0.05 from bivariate associations and interaction terms and Ptrend values < 0.05 from multivariable associations between prenatal dietary patterns and multiple birth outcomes were considered statistically significant.
Results
Among 465 women with at least 1 energy-plausible 24-hour dietary recall in the third trimester of pregnancy, PFA identified 2 factors that cumulatively explained 69% of the total dietary intake variation (Table 1). Because findings from PFA among women with at least 1 (n = 465) compared with 2 or more (n = 375) 24-hour dietary recalls and between Hispanic/Latina women only (n = 377) compared with all participants (n = 465) were fairly similar (see Supplemental Tables 2 and 3), findings from the sample including all 465 women with 1 or more 24-hour dietary recalls are reported. Two prenatal dietary patterns were characterized based on the largest positive and negative food-group loadings (Supplemental Table 4): 1) a dietary pattern of solid fats, refined grains, and cheese (SRC); and 2) a dietary pattern of vegetable, oils, and fruit (VOF). The SRC was characterized by high positive loadings on solid fats, refined grains, cheese, added sugar, processed meats, oils, tomatoes, meat, and fruit juice. Meanwhile, the VOF was characterized by high positive loadings on mostly nonstarchy vegetables, including dark green, red and orange, and other vegetables; oils; whole fruits; nuts and seeds; other starchy vegetables; tomatoes; yogurt; whole grains; eggs; soy protein; and seafood.
TABLE 1.
Prenatal dietary patterns during the third trimester of pregnancy, derived using principal factor analysis in MADRES (n = 465)1
| Factor 1 | Factor 2 | |
|---|---|---|
| Food groups (n = 25)2 | SRC | VOF |
| Milk | 0.17 | 0.13 |
| Yogurt | −0.06 | 0.28 |
| Cheese | 0.52 | 0.13 |
| Citrus, melons, berries | −0.04 | 0.37 |
| Other fruits | −0.09 | 0.34 |
| Fruit juices | 0.20 | 0.12 |
| Dark green vegetables | −0.07 | 0.46 |
| Tomatoes | 0.24 | 0.28 |
| Other red and orange vegetables | −0.08 | 0.37 |
| Other vegetables | 0.16 | 0.55 |
| White potatoes | 0.15 | 0.15 |
| Other starchy vegetables | −0.13 | 0.30 |
| Legumes | 0.02 | 0.17 |
| Seafood | 0.03 | 0.22 |
| Whole grains | −0.09 | 0.28 |
| Refined grains | 0.63 | −0.01 |
| Meat | 0.20 | 0.15 |
| Processed meats | 0.28 | 0.02 |
| Poultry | 0.05 | 0.18 |
| Eggs | 0.13 | 0.25 |
| Soy protein | 0.05 | 0.25 |
| Nuts and seeds | 0.03 | 0.31 |
| Oils | 0.26 | 0.39 |
| Solid fats | 0.72 | −0.01 |
| Added sugar | 0.43 | 0.05 |
| Variance explained (%) | 34.6 | 34.5 |
Abbreviations: MADRES, Maternal and Developmental Risks from Environmental and Social Stressors Study; SRC, dietary pattern of solid fat, refined grain, and cheese; VOF, dietary pattern of vegetables, oils, and fruit.
Factors and food group factor loadings were orthogonally (varimax) rotated and derived using log-transformed total daily food group intakes among participants with 1 or more 24-hour dietary recalls. High factor loadings in absolute (>0.20) are only shown for simplicity. The dietary assessment was performed over the phone by study staff using the National Cancer Institute's Automated Self-Administered 24-Hour Dietary Assessment Tool (29, 30). The food groups were constructed using the MyPyramid Equivalents Database by the USDA (31).
Table 2 shows relevant sample characteristics comparing those women most adherent to least adherent (highest compared with lowest quartiles) to each prenatal dietary pattern. The women most adherent to the SRC were statistically significantly more likely to be younger (27.7 ± 0.52 compared with 30.3 ± 0.58; P = 0.001); hold less than a HS education (24.1 compared with 37.6; P = 0.025); be US-born Hispanic/Latina (44.0 compared with 27.4, P = 0.008); have a lower prepregnancy BMI value (27.6 ± 0.53 compared with 29.9 ± 0.67; P = 0.008); have a greater proportion of their total energy intake come from added sugars (12.2 ± 0.47 compared with 9.11 ± 0.59; P < 0.001), total fat (37.4 ± 0.46 compared with 29.9 ± 0.61; P < 0.001), and saturated fat (12.9 ± 0.31 compared with 8.88 ± 0.24; P < 0.001); and have greater intakes of pregnancy-relevant micronutrients (all P values < 0.001), with the exception of vitamin D (P = 0.078). By contrast, the women most adherent (compared with least adherent) to the VOF were statistically significantly more likely to have greater newborn birth weight z-scores (0.09 ± 0.08 compared with −0.15 ± 0.09; P = 0.037) and generally demonstrated greater GA z-scores (0.15 ± 0.08 compared with −0.10 ± 0.11; P = 0.058) and lower proportions of premature births (5.2 compared with 12.0; P = 0.063). These women were also statistically significantly more likely to be older (30.9 ± 0.56 compared with 27.2 ± 0.54; P < 0.001), hold at least a HS education or greater [HS degree or equivalent: 26.7 compared with 27.4 (P = 0.020); more than HS: 52.6 compared with 38.5, (P = 0.029)], be foreign-born Hispanic/Latina (52.6 compared with 29.1; P < 0.001), have GDM (12.9 compared with 5.1; P = 0.037), have a greater proportion of their total energy intake come from dietary fiber (25.4 ± 0.85 compared with 14.8 ± 0.57; P = 0.010) and a lower proportion come from added sugars (8.80 ± 0.38 compared with 11.0 ± 0.60; P = 0.002), and have greater intakes of all pregnancy-relevant micronutrients (folate, choline, calcium, vitamin D, vitamin B12, iron, selenium, and zinc; all P values < 0.005).
TABLE 2.
Sample characteristics comparing the highest to lowest quartiles of maternal dietary patterns in late pregnancy in MADRES (n = 465)1
| Characteristics | SRC | VOF | ||||
|---|---|---|---|---|---|---|
| Quartile 1 | Quartile 4 | P | Quartile 1 | Quartile 4 | P | |
| Birth outcomes | ||||||
| Birth weight,2z-score | −0.03 ± 0.10 | −0.11 ± 0.09 | 0.539 | −0.15 ± 0.09 | 0.09 ± 0.08 | 0.037 |
| GA,2z-score | −0.05 ± 0.09 | −0.01 ± 0.09 | 0.736 | −0.10 ± 0.11 | 0.15 ± 0.08 | 0.058 |
| Premature birth (<37 weeks of GA) | 9 (7.7) | 11 (9.5) | 0.626 | 14 (12) | 6 (5.2) | 0.063 |
| SGA3 | 15 (12.8) | 8 (6.9) | 0.317 | 13 (11.1) | 7 (6.0) | 0.128 |
| LGA3 | 12 (10.3) | 10 (8.6) | 0.669 | 8 (6.8) | 12 (10.3) | 0.244 |
| Sociodemographics | ||||||
| Age, years | 30.3 ± 0.58 | 27.7 ± 0.52 | 0.001 | 27.2 ± 0.54 | 30.9 ± 0.56 | <0.001 |
| Education | ||||||
| Less than HS | 44 (37.6) | 28 (24.1) | 0.025 | 32 (27.4) | 31 (31.9) | 0.914 |
| HS diploma or equivalent | 32 (35.0) | 37 (44.0) | 0.447 | 40 (27.4) | 24 (26.7) | 0.020 |
| More than HS | 41 (34.2) | 51 (20.7) | 0.163 | 45 (38.5) | 61 (52.6) | 0.029 |
| Total household income | ||||||
| <$15,000 | 26 (22.2) | 19 (16.4) | 0.258 | 29 (24.8) | 18 (15.5) | 0.076 |
| $15,000–$29,999 | 27 (23.1) | 29 (25.0) | 0.731 | 34 (29.1) | 28 (24.1) | 0.395 |
| >$30,000 | 21 (18.0) | 36 (31.0) | 0.019 | 13 (11.1) | 42 (36.2) | <0.001 |
| Do not know | 43 (36.8) | 32 (27.6) | 0.133 | 41 (35.0) | 28 (24.1) | 0.067 |
| Hispanic/Latina ethnicity or nativity | ||||||
| Non-Hispanic and non-Latina | 20 (17.1) | 35 (30.2) | 0.018 | 30 (25.6) | 25 (21.6) | 0.462 |
| US-born Hispanic/Latina | 32 (27.4) | 51 (44.0) | 0.008 | 53 (45.3) | 30 (25.9) | 0.002 |
| Foreign-born Hispanic/Latina | 65 (55.6) | 30 (25.9) | <0.001 | 34 (29.1) | 61 (52.6) | <0.001 |
| Newborn sex, male | 60 (51.3) | 59 (50.9) | 0.949 | 61 (52.1) | 50 (43.1) | 0.166 |
| Reproductive health | ||||||
| Diabetes status | ||||||
| No diabetes | 93 (79.5) | 104 (89.7) | 0.030 | 106 (90.6) | 91 (78.5) | 0.010 |
| Gestational diabetes | 10 (8.6) | 10 (8.6) | 0.984 | 6 (5.1) | 15 (12.9) | 0.037 |
| Preexisting diabetes | 14 (12.0) | 2 (1.7) | 0.002 | 5 (4.3) | 10 (8.6) | 0.176 |
| Birth order | 2.33 ± 0.11 | 2.12 ± 0.12 | 0.192 | 2.19 ± 0.12 | 2.19 ± 0.11 | 0.992 |
| Prepregnancy BMI | 29.9 ± 0.67 | 27.6 ± 0.53 | 0.008 | 29.5 ± 0.70 | 28.4 ± 0.59 | 0.209 |
| Macronutrients4 | ||||||
| Total energy intake, kcal/d | 1417 ± 39.3 | 2538 ± 46.2 | <0.001 | 1748 ± 51.3 | 2155 ± 53.2 | <0.001 |
| Carbohydrates, % total energy | 53.0 ± 0.85 | 48.5 ± 0.50 | <0.001 | 50.6 ± 0.84 | 50.0 ± 0.70 | 0.574 |
| Added sugars, % total energy | 9.11 ± 0.59 | 12.2 ± 0.47 | <0.001 | 11.0 ± 0.60 | 8.80 ± 0.38 | 0.002 |
| Protein, % total energy | 18.7 ± 0.51 | 15.1 ± 0.27 | <0.001 | 16.5 ± 0.45 | 17.7 ± 0.41 | 0.055 |
| Total fat, % total energy | 29.9 ± 0.61 | 37.4 ± 0.46 | <0.001 | 33.9 ± 0.66 | 34.2 ± 0.58 | 0.770 |
| Saturated fat, % total energy | 8.88 ± 0.24 | 12.9 ± 0.31 | <0.001 | 11.8 ± 0.40 | 10.6 ± 0.25 | 0.010 |
| Dietary fiber, g/1000 kcal | 16.9 ± 0.77 | 21.2 ± 0.83 | <0.001 | 14.8 ± 0.57 | 25.4 ± 0.85 | <0.001 |
| Micronutrients4 | ||||||
| Folate (DFE), μg/d | 467 ± 22.7 | 649 ± 23.5 | <0.001 | 507 ± 27.1 | 621 ± 23.9 | 0.002 |
| Choline, mg/d | 280 ± 12.1 | 371 ± 12.8 | <0.001 | 270 ± 11.3 | 391 ± 12.3 | <0.001 |
| Calcium, mg/d | 823 ± 43.0 | 1329 ± 40.4 | <0.001 | 924 ± 45.7 | 1229 ± 35.8 | <0.001 |
| Vitamin D, μg/d | 4.90 ± 0.44 | 5.88 ± 0.34 | 0.078 | 4.37 ± 0.29 | 6.30 ± 0.48 | 0.001 |
| Vitamin B12, μg/d | 4.22 ± 0.23 | 5.65 ± 0.27 | <0.001 | 4.24 ± 0.25 | 5.28 ± 0.24 | 0.003 |
| Iron, mg/d | 13.2 ± 0.52 | 18.8 ± 0.64 | <0.001 | 14.6 ± 0.70 | 17.6 ± 0.62 | <0.001 |
| Selenium, μg/d | 87.2 ± 2.93 | 133 ± 4.23 | <0.001 | 99.8 ± 3.29 | 125 ± 4.32 | 0.001 |
| Zinc, mg/d | 9.26 ± 0.41 | 13.3 ± 0.43 | <0.001 | 9.83 ± 0.46 | 12.6 ± 0.39 | <0.001 |
Values are means ± SDs or n (%). P values were calculated with an ANOVA for continuous variables and Pearson chi-squared tests for categorical variables. Abbreviations: DFE, dietary folate equivalents; GA, gestational age at birth; HS, high school; LGA, large for gestational age; MADRES, Maternal and Developmental Risks from Environmental and Social Stressors Study; SGA, small for gestational age; SRC, dietary pattern of solid fat, refined grain, and cheese; VOF, dietary pattern of vegetables, oils, and fruit.
Z-scores were calculated by standardizing birth weight and gestational age at birth by newborn sex.
Being SGA was defined as having a newborn sex-standardized birth weight <10th percentile and being LGA was defined as having a newborn sex-standardized birth weight >90th percentile (28).
Table 3 presents multivariable associations of prenatal dietary patterns during late pregnancy and continuous and dichotomous birth outcomes. After adjusting for maternal age, education, prepregnancy BMI, gestational age at consent, birth order, and total energy intake, women in the highest quartile of the prenatal VOF had statistically significantly greater infant birth weights (β = 0.40 z-score, 95% CIs: 0.10, 0.70; adjusted Ptrend = 0.011) and GAs (β = 0.32 z-score, 95% CIs: 0.03, 0.61; adjusted Ptrend = 0.036) and lower odds of having a premature birth (OR = 0. 31, 95% CIs: 0.10, 0.95; adjusted Ptrend = 0.049) compared to those in the lowest quartile. Additionally, comparing the highest to lowest quartiles, the prenatal SRC and VOF were both statistically significantly associated with lower odds of having an infant that was SGA [OR = 0. 27 (95% CI: 0.07, 0.99; adjusted Ptrend = 0.046) and OR = 0.18 (95% CI: 0.06, 0.58; adjusted Ptrend = 0.028), respectively]. Findings for infant birth weight and GA in grams and weeks, respectively, that included and excluded newborn sex as a covariate were similar (see Supplemental Table 5). Additionally, findings from models including continuous dietary patterns (scores) were consistent with those using dietary pattern quartiles (see Supplemental Table 6). Lastly, findings from models including and excluding physical activity and total household income and those from models including and excluding macrosomic infants were similar (Supplemental Tables 7 and 8).
TABLE 3.
Multivariable associations of prenatal dietary patterns during the third trimester of pregnancy and birth outcomes in MADRES (n = 465)1
| Prenatal | Continuous | Dichotomous | |||
|---|---|---|---|---|---|
| Birth weight2 | Gestational age2 | Premature,3 8.0% | SGA,3 9.0% | LGA,3 9.7% | |
| Dietary patterns | β (95% CIs)4 | β (95% CIs)4 | OR (95% CIs)4 | OR (95% CIs)4 | OR (95% CIs)4 |
| SRC | |||||
| Quartile 1 | Referent | Referent | Referent | Referent | Referent |
| Quartile 2 | 0.10 (−0.20, 0.40) | 0.09 (−0.18, 0.36) | 0.93 (0.33, 2.63) | 0.54 (0.22, 1.33) | 1.23 (0.49, 3.09) |
| Quartile 3 | 0.40 (0.10, 0.70) | 0.19 (−0.11, 0.49) | 0.73 (0.24, 2.23) | 0.23 (0.08, 0.72) | 1.46 (0.53, 4.02) |
| Quartile 4 | 0.20 (−0.10, 0.60) | 0.14 (−0.23, 0.51) | 0.82 (0.21, 3.15) | 0.27 (0.07, 0.99) | 1.52 (0.39, 5.84) |
| Ptrend | 0.045 | 0.323 | 0.673 | 0.023 | 0.448 |
| Adj. Ptrend5 | 0.056 | 0.138 | 0.253 | 0.046 | 0.176 |
| VOF | |||||
| Quartile 1 | Referent | Referent | Referent | Referent | Referent |
| Quartile 2 | 0.20 (−0.10, 0.40) | 0.01 (−0.25, 0.28) | 0.57 (0.22, 1.43) | 0.53 (0.22, 1.30) | 1.36 (0.51, 3.61) |
| Quartile 3 | 0.30 (0.00, 0.60) | 0.25 (−0.02, 0.52) | 0.53 (0.21, 1.34) | 0.71 (0.30, 1.64) | 1.93 (0.74, 4.99) |
| Quartile 4 | 0.40 (0.10, 0.70) | 0.32 (0.03, 0.61) | 0.31 (0.10, 0.95) | 0.18 (0.06, 0.58) | 2.46 (0.89, 6.79) |
| Ptrend | 0.001 | 0.013 | 0.033 | 0.006 | 0.063 |
| Adj. Ptrend5 | 0.011 | 0.036 | 0.049 | 0.028 | 0.062 |
Abbreviations: HS, high school; LGA, large for gestational age; MADRES, Maternal and Developmental Risks from Environmental and Social Stressors Study; SGA, small for gestational age; SRC, dietary pattern of solid fat, refined grain, and cheese; VOF, dietary pattern of vegetables, oils, and fruit.
Z-scores were calculated by standardizing birth weight and gestational age at birth by newborn sex.
A premature birth was defined as a birth occurring before the start of the 37th week of pregnancy; being SGA was defined as having a newborn sex-standardized birth weight <10th percentile; and being LGA was defined as having a newborn sex-standardized birth weight >90th percentile (28).
Estimates are mean differences (β; 95% CIs) and ORs (95% CIs) of continuous and dichotomous birth outcomes, respectively, by quartiles of each prenatal dietary pattern during the third trimester of pregnancy, adjusting for maternal age (years), maternal education (less than HS, HS diploma or equivalent, more than HS), prepregnancy BMI (continuous), birth order (number), and mean total energy intake (kcals/d). The Ptrend values were calculated by modeling the midpoint value of each quartile of each derived dietary pattern as a continuous measure.
Adjusted Ptrend values based on a 2-stage false discovery rate procedure (43).
For ease of interpretation, Figure 1 depicts findings from multivariable associations between the SRC (scores) during late pregnancy and infant birth weight, stratified by maternal diabetes status (Pinteraction = 0.040). A 1-SD score increase in the prenatal SRC was statistically significantly associated with a lower infant birth weight (β = −0.20 z-score; 95% CI: −0.39, −0.02; P = 0.030) only among women with GDM. Interaction terms for remaining birth outcomes and with newborn sex were nonsignificant (all P values > 0.05).
FIGURE 1.
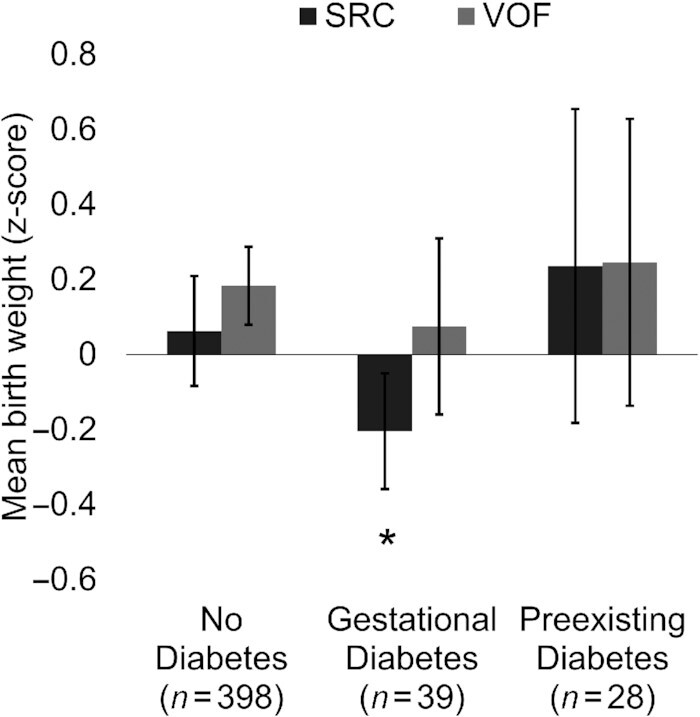
Adjusted mean differences in birth weight (z-score) per 1-SD score increases in prenatal dietary patterns during the third trimester of pregnancy, stratified by maternal diabetes status in MADRES (n = 465). Estimates are mean differences (95% CIs) in newborn sex-standardized birth weights (z-score) per 1-SD score increases in prenatal dietary patterns from multivariable linear regression, stratified by maternal diabetes status, adjusting for maternal age (years), maternal education (less than HS, HS degree or equivalent, more than HS), gestational age at consent (weeks), prepregnancy BMI (continuous), birth order (number), and total energy intake (kcals/d). VOF, Pinteraction = 0.731; SRC, Pinteraction = 0.040. Abbreviations: HS, high school; MADRES, Maternal and Developmental Risks from Environmental and Social Stressors; SRC, dietary pattern of solid fat, refined grain, and cheese; VOF, dietary pattern of vegetables, oils, and fruit.
Discussion
In a US pregnancy cohort of predominantly low-income Hispanic/Latina women in urban Los Angeles, CA, 2 prenatal dietary patterns were identified: 1) the SRC, characterized by higher intakes of mostly solid fats, refined grains, cheese, added sugar, and processed meats; and 2) the VOF, characterized by higher intakes of mostly nonstarchy vegetables, oils, whole fruits, yogurt, and whole grains. Greater adherence to the VOF in late pregnancy was statistically significantly associated with several birth outcomes, including positive infant birth weight differences and lower risks of having a premature birth and having an infant that was SGA. In contrast, greater adherence to the SRC in late pregnancy was statistically significantly associated with a lower infant birth weight only among women with GDM.
The dietary patterns that emerged were generally inconsistent with those previously derived during the postpartum period, but these study differences further support the general irreproducibility of dietary patterns and their compositions between the prenatal and postpartum periods. Although the findings from the factor analysis were generally similar, in terms of dietary compositions, to previous work among US Hispanic/Latina women of Mexican origin (18), the number of derived dietary patterns vastly differed between studies, with previous work identifying a larger number of dietary patterns. Additionally, the dietary patterns from the present study explained almost 70% of the overall diet variance, compared with the 59% explained by the 7 identified in previous work. Differences between studies in the numbers of distinct dietary patterns and distributions of variance explained by the derived dietary patterns suggest US Hispanic/Latina pregnant women had greater dietary pattern diversity in the early 1980s compared with recent times. This diversity, however, may be a mere reflection of maternal eating patterns 5 years postpartum and not during the prenatal period, like the authors argue. In fact, a previous study found that although a dietary pattern characterized by intakes of sugar-sweetened beverages and sugar was found to be generally stable from preconception to ∼38 weeks of gestation, the intakes of the predominant foods constituting this dietary pattern began to change in the postpartum period (45). Together, these data reveal our study to be the first to truly characterize the overall diets among Hispanic/Latina women during pregnancy in the United States.
This study's findings for associations between a characteristically “healthy,” data-driven (VOF) dietary pattern during pregnancy and birth outcomes are generally consistent with previous findings evaluating theory-based (46, 47) and data-driven dietary patterns (12, 18). Indeed, the magnitude of the differences associated with infant birth weight (in grams; see Supplemental Table 5), having a premature birth, and having an infant that was SGA for the VOF in our study were generally stronger than those from previous work evaluating associations between data-driven dietary patterns (comparing highest to lowest adherence) and similar outcomes (8, 48), indicating our findings to be biologically meaningful. Despite the elevated risk for having an infant that was LGA among Hispanic/Latina pregnant women (49), dietary associations with these outcomes were not detected, possibly due to being underpowered. Additionally, although the diet quality of derived dietary patterns in the present study is unknown, the consistent and protective relationships of VOF for several birth outcomes and the similarities with previous work for characteristically similar dietary patterns suggest the VOF in this population to be “healthful.” Future work, however, is needed to verify whether and to what extent the SRC and VOF correlate with diet quality, using different dietary criteria (e.g., Dietary Approaches to Stop Hypertension, Healthy Eating Index), and how all of these different diets compare with respect to birth outcomes in this population.
This study's findings for interactions between dietary patterns and maternal diabetes status suggest the SRC during late pregnancy is associated with lower infant birth weights among women with GDM, independent of the prepregnancy BMI (Figure 1). Higher adherence to the SRC during pregnancy may compound the adverse metabolic effects of GDM, which is, in itself, a risk factor for preterm and spontaneous birth (50). A caveat, however, is that models in the present study were adjusted for GDM, a mediator and potential collider in the relationship between dietary patterns and birth outcomes. For instance, there are likely uncontrolled confounders that affect both GDM and birth outcomes in this study population. Controlling only for GDM and not these likely confounders creates a biased path from diet to birth outcomes via collider GDM data and unknown confounders (51). Therefore, future work is needed to verify these findings. Future work should also investigate dietary interactions with other important health-relevant factors (e.g., maternal stressors, sleep quality) (52–54) to further inform where dietary interventions and current recommendations could most benefit this high-risk population.
Healthy dietary patterns during pregnancy may favorably influence the infant birth size and lower risks of having a premature birth and having an infant that is SGA. Although it is not known which specific foods in an overall prenatal diet may be driving associations with birth outcomes, the synergism of the many dietary components (e.g., antioxidants, polyphenols) may curtail inflammatory pathways, which have been posited to increase the risk of hypertensive pregnancy disorders, fetal growth restriction, and preterm birth through premature rupture of the amniotic membranes (55, 56). By contrast, unhealthy dietary patterns similar in composition to the SRC have been shown to be associated with greater inflammation and higher risk of preterm birth (57, 58). Therefore, this study's findings—linking greater adherence to the prenatal SRC to a reduced risk of having an infant that is SGA—should be interpreted with caution, especially since findings for the VOF compared with the SRC were relatively more consistent and in similar directions with respect to several birth outcomes in the present study.
Relatedly, nonsignificant findings for the SRC and other birth outcomes were inconsistent with those from previous work for dietary patterns with similar compositions with respect to infant birth weight (12, 18) and preterm births (15, 17). The following is a potential explanation. Half of this study's sample included foreign-born mothers, who, in comparison to US-born mothers, tend to have better health profiles despite their lower socioeconomic status (59), a phenomenon known as the Hispanic paradox (60, 61). In fact, the dietary patterns in this study population track similarly. For example, foreign-born Hispanic/Latina women were more likely to be most adherent to the VOF and less adherent to the SRC. That said, other important mechanisms may be at work here. For instance, evidence in recent years has shown that immigrant enclaves, or communities with greater neighborhood exposure to foreign-born individuals, are a potential explanation for this paradox (62, 63), since these communities may confer protection (e.g., cultural orientation, social and family support) against unhealthy behaviors during pregnancy (62).
This study expands on evidence in the recently published reviews by Chia et al. (8) and Raghavan et al. (21) by being among the first to contribute findings from a predominantly low-income Hispanic/Latina population, a highly underrepresented group in the literature. This study also builds on previous retrospective work among Hispanic/Latina pregnant women of Mexican origin (18) by being among the first to prospectively examine links between diet during pregnancy and birth outcomes. Additionally, this study's findings are among the first to characterize the dietary behaviors of Hispanic/Latina pregnant women, the most represented racial and ethnic group in MADRES. An additional strength of this study is the use of 24-hour recalls, which have been previously shown to explain relatively greater proportions of the variance in resulting dietary patterns, in comparison to FFQs, using exploratory factor analysis (64). Additionally, FFQs relative to 24-hour recalls have been shown to be associated with relatively more systematic errors in estimates of intake (65). This study also provides evidence supporting the possible mediation of associations between dietary patterns and infant birth weight by GA, which could possibly and partly explain the many null findings observed in the literature for dietary pattern associations with infant birth weight (8).
This study also included several limitations. For instance, due to the observational design of the study, causality cannot be inferred due to confounding from measured (residual) or unknown confounders. Furthermore, the findings were unable to account for changes in dietary patterns during pregnancy, which could influence birth outcomes, but previous work suggests that dietary patterns in early pregnancy tend to persist for the remainder of pregnancy (45). Additionally, Hispanics and Latinos do not constitute a monolithic group, as evidenced by documented heterogeneity in dietary, genetic, and health risk factors in this population (32, 66, 67). Despite this study population including pregnant Hispanic/Latina women with origins in Central America, heritage-specific dietary pattern analyses were not able to be performed due to power concerns. Therefore, future studies unpacking heterogeneity in dietary and other health-relevant risk factors among Hispanic/Latina pregnant women are warranted to better understand health disparities within this diverse US population. Relatedly, the present study may have been inadequately powered to detect dietary pattern interactions with newborn sex and maternal diabetes status, particularly for dichotomous, rare birth outcomes. Therefore, we consider these findings exploratory and encourage future work to verify our findings.
Taken together, these findings suggest a dietary pattern generally characterized by higher intakes of mostly nonstarchy vegetables, oils, and whole fruits during late pregnancy may improve birth outcomes among low-income Hispanic/Latina pregnant women in the United States. Because dietary patterns derived using factor analysis do not provide straightforward guidance on how to modify one's diet, more research is needed to better understand which exact foods in the compositions of prenatal dietary patterns may be driving dietary associations with better pregnancy outcomes. Future work that focuses on the intakes of specific foods of these derived dietary patterns and evaluates their associations with birth outcomes could help pinpoint important parts of the diet for interventions. Given the alarming trends in adverse birth outcomes by ethnic background in the United States, findings specific to racial and ethnic groups (3) may be critical in stymying the widening health disparity gap.
Supplementary Material
Acknowledgements
The authors’ responsibilities were as follows—LEM: reviewed the literature, designed the research, analyzed and interpreted the data, and wrote the manuscript; TMB, SFF, and CVB: contributed to the study design, contributed to the data interpretation, and critically revised and edited the manuscript; CMT-C, GFD, RH, SPE, MJ, TY, BHG, and DL: assisted in the data interpretation and reviewed and edited the manuscript; and all authors: agree to be accountable for all aspects of the work and read and approved the final manuscript.
Notes
This work was supported by the Maternal and Developmental Risks from Environmental and Social Stressors (MADRES) Center (P50ES026086, 83615801-0, P50MD01570), which is funded by the National Institute of Environmental Health Sciences, the National Institute for Minority Health and Health Disparities, and the Environmental Protection Agency; the Southern California Environmental Health Sciences Center (P30ES007048), which is funded by the National Institute of Environmental Health Sciences; the Life Course Approach to Developmental Repercussions of Environmental Agents on Metabolic and Respiratory Health (LA DREAMERs; UH3OD023287); and an Environmental Influences on Child Health Outcomes (ECHO) Diversity Supplement to LEM (UH3OD023287-06S1), funded by the NIH Office of the Director, ECHO Program.
Author disclosures: The authors report no conflicts of interest.
The funding agencies had no role in the design of the study; the collection, analysis, or interpretation of data; or the writing of the manuscript.
Supplemental Figures 1 and 2 and Supplemental Tables 1–8 are available from the “Supplementary data” link in the online posting of the article and from the same link in the online table of contents at https://academic.oup.com/jn/.
Abbreviations used: ASA24, Automated Self-Administered 24-Hour Dietary Assessment Tool; EMR, electronic medical record; GA, gestational age at birth; GDM, gestational diabetes mellitus; HS, high school; LBW, low infant birth weight; LGA, large for gestational age; MADRES, Maternal and Developmental Risks from Environmental and Social Stressors; PFA, principal factor analysis; Q, quartile; SGA, small for gestational age; SRC, dietary pattern of solid fat, refined grain, and cheese; VOF, dietary pattern of vegetables, oils, and fruit.
Contributor Information
Luis E Maldonado, Department of Population & Public Health Sciences, Keck School of Medicine, University of Southern California, Los Angeles, CA, USA.
Shohreh F Farzan, Department of Population & Public Health Sciences, Keck School of Medicine, University of Southern California, Los Angeles, CA, USA.
Claudia M Toledo-Corral, Department of Population & Public Health Sciences, Keck School of Medicine, University of Southern California, Los Angeles, CA, USA; Department of Health Sciences, California State University, Northridge, Northridge, CA, USA.
Genevieve F Dunton, Department of Population & Public Health Sciences, Keck School of Medicine, University of Southern California, Los Angeles, CA, USA; Department of Psychology, University of Southern California, Los Angeles, CA, USA.
Rima Habre, Department of Population & Public Health Sciences, Keck School of Medicine, University of Southern California, Los Angeles, CA, USA.
Sandrah P Eckel, Department of Population & Public Health Sciences, Keck School of Medicine, University of Southern California, Los Angeles, CA, USA.
Mark Johnson, Department of Population & Public Health Sciences, Keck School of Medicine, University of Southern California, Los Angeles, CA, USA.
Tingyu Yang, Department of Population & Public Health Sciences, Keck School of Medicine, University of Southern California, Los Angeles, CA, USA.
Brendan H Grubbs, Department of Obstetrics and Gynecology, Keck School of Medicine, Los Angeles, CA, USA.
Deborah Lerner, Eisner Health, Los Angeles, CA, USA.
Thomas Chavez, Department of Population & Public Health Sciences, Keck School of Medicine, University of Southern California, Los Angeles, CA, USA.
Carrie V Breton, Department of Population & Public Health Sciences, Keck School of Medicine, University of Southern California, Los Angeles, CA, USA.
Theresa M Bastain, Department of Population & Public Health Sciences, Keck School of Medicine, University of Southern California, Los Angeles, CA, USA.
Data Availability
Data described in the manuscript, code book, and analytic code will be made available upon reasonable request pending IRB review and approval.
References
- 1. Ely DM, Driscoll AK. Infant mortality in the United States, 2018: data from the period linked birth/infant death file. Natl Vital Stat Rep. 2020;69:1–18. [PubMed] [Google Scholar]
- 2. Lee AC, Katz J, Blencowe H, Cousens S, Kozuki N, Vogel JPet al. National and regional estimates of term and preterm babies born small for gestational age in 138 low-income and middle-income countries in 2010. Lancet Glob Health. 2013;1(1):e26–36. [DOI] [PMC free article] [PubMed] [Google Scholar]
- 3. Pollock EA, Gennuso KP, Givens ML, Kindig D. Trends in infants born at low birthweight and disparities by maternal race and education from 2003 to 2018 in the United States. BMC Public Health. 2021;21(1):1117. [DOI] [PMC free article] [PubMed] [Google Scholar]
- 4. Barth WH Jr, Jackson R. Macrosomia: ACOG Practice Bulletin, Number 216. Obstet Gynecol. 2020;135(1):e18–e35. [DOI] [PubMed] [Google Scholar]
- 5. Oken E, Gillman MW. Fetal origins of obesity. Obes Res. 2003;11(4):496–506. [DOI] [PubMed] [Google Scholar]
- 6. Spiegel E, Shoham-Vardi I, Sergienko R, Landau D, Sheiner E. The association between birth weight at term and long-term endocrine morbidity of the offspring. J Matern Fetal Neonatal Med. 2019;32:2657–61. [DOI] [PubMed] [Google Scholar]
- 7. Blumenshine P, Egerter S, Barclay CJ, Cubbin C, Braveman PA. Socioeconomic disparities in adverse birth outcomes: a systematic review. Am J Prev Med. 2010;39(3):263–72. [DOI] [PubMed] [Google Scholar]
- 8. Chia A-R, Chen L-W, Lai JS, Wong CH, Neelakantan N, van Dam RMet al. Maternal dietary patterns and birth outcomes: a systematic review and meta-analysis. Adv Nutr. 2019;10(4):685–95. [DOI] [PMC free article] [PubMed] [Google Scholar]
- 9. Hu FB. Dietary pattern analysis: a new direction in nutritional epidemiology. Curr Opin Lipidol. 2002;13(1):3–9. [DOI] [PubMed] [Google Scholar]
- 10. Krebs-Smith SM, Pannucci TE, Subar AF, Kirkpatrick SI, Lerman JL, Tooze JAet al. Update of the Healthy Eating Index: HEI-2015. J Acad Nutr Diet. 2018;118(9):1591–602. [DOI] [PMC free article] [PubMed] [Google Scholar]
- 11. Coelho NdLP, Cunha DB, Esteves APP, Lacerda EM, Theme Filha MM. Dietary patterns in pregnancy and birth weight. Rev Saude Publica. 2015;49:62. [DOI] [PMC free article] [PubMed] [Google Scholar]
- 12. Northstone K, Ness A, Emmett P, Rogers I. Adjusting for energy intake in dietary pattern investigations using principal components analysis. Eur J Clin Nutr. 2008;62(7):931–8. [DOI] [PMC free article] [PubMed] [Google Scholar]
- 13. Chia A-R, De Seymour JV, Colega M, Chen L-W, Chan Y-H, Aris IMet al. A vegetable, fruit, and white rice dietary pattern during pregnancy is associated with a lower risk of preterm birth and larger birth size in a multiethnic Asian cohort: the Growing Up in Singapore Towards Healthy Outcomes (GUSTO) cohort study. Am J Clin Nutr. 2016;104(5):1416–23. [DOI] [PubMed] [Google Scholar]
- 14. Englund-Ögge L, Brantsæter AL, Sengpiel V, Haugen M, Birgisdottir BE, Myhre Ret al. Maternal dietary patterns and preterm delivery: results from large prospective cohort study. BMJ. 2014;348:g1446. [DOI] [PMC free article] [PubMed] [Google Scholar]
- 15. Rasmussen MA, Maslova E, Halldorsson TI, Olsen SF. Characterization of dietary patterns in the Danish national birth cohort in relation to preterm birth. PLoS One. 2014;9(4):e93644. [DOI] [PMC free article] [PubMed] [Google Scholar]
- 16. Lu M-S, Chen Q-Z, He J-R, Wei X-L, Lu J-H, Li S-Het al. Maternal dietary patterns and fetal growth: a large prospective cohort study in China. Nutrients. 2016;8(5):257. [DOI] [PMC free article] [PubMed] [Google Scholar]
- 17. Martin CL, Sotres-Alvarez D, Siega-Riz AM. Maternal dietary patterns during the second trimester are associated with preterm birth. J Nutr. 2015;145(8):1857–64. [DOI] [PMC free article] [PubMed] [Google Scholar]
- 18. Wolff CB, Wolff HK. Maternal eating patterns and birth weight of Mexican American infants. Nutr Health. 1995;10(2):121–34. [DOI] [PubMed] [Google Scholar]
- 19. Yisahak SF, Mumford SL, Grewal J, Li M, Zhang C, Grantz KLet al. Maternal diet patterns during early pregnancy in relation to neonatal outcomes. Am J Clin Nutr. 2021;114(1):358–67. [DOI] [PMC free article] [PubMed] [Google Scholar]
- 20. Maldonado LE, Albrecht SS. Does the immigrant advantage in overweight/obesity persist over time in Mexican American youth? NHANES 1988–1994 to 2005–2014. Obesity (Silver Spring). 2018;26(6):1057–62. [DOI] [PMC free article] [PubMed] [Google Scholar]
- 21. Raghavan R, Dreibelbis C, Kingshipp BL, Wong YP, Abrams B, Gernand ADet al. Dietary patterns before and during pregnancy and birth outcomes: a systematic review. Am J Clin Nutr. 2019;109(Suppl 1):729S–56S. [DOI] [PubMed] [Google Scholar]
- 22. Hromi-Fiedler A, Bermúdez-Millán A, Segura-Pérez S, Pérez-Escamilla R. Nutrient and food intakes differ among Latina subgroups during pregnancy. Public Health Nutr. 2012;15(2):341–51. [DOI] [PMC free article] [PubMed] [Google Scholar]
- 23. Di Renzo GC, Rosati A, Sarti RD, Cruciani L, Cutuli AM. Does fetal sex affect pregnancy outcome?. Gender Med. 2007;4(1):19–30. [DOI] [PubMed] [Google Scholar]
- 24. Homko CJ, Sivan E, Nyirjesy P, Reece EA. The interrelationship between ethnicity and gestational diabetes in fetal macrosomia. Diabetes Care. 1995;18(11):1442–5. [DOI] [PubMed] [Google Scholar]
- 25. Badon SE, Miller RS, Qiu C, Sorensen TK, Williams MA, Enquobahrie DA. Maternal healthy lifestyle during early pregnancy and offspring birthweight: differences by offspring sex. J Matern Fetal Neonatal Med. 2018;31:1111–7. [DOI] [PMC free article] [PubMed] [Google Scholar]
- 26. Bastain TM, Chavez T, Habre R, Girguis MS, Grubbs B, Toledo-Corral Cet al. Study design, protocol and profile of the Maternal and Developmental Risks From Environmental and Social Stressors (MADRES) pregnancy cohort: a prospective cohort study in predominantly low-income Hispanic women in urban Los Angeles. BMC Pregnancy Childbirth. 2019;19(1):189. [DOI] [PMC free article] [PubMed] [Google Scholar]
- 27. Committee opinion no 700: methods for estimating the due date. Obstet Gynecol. 2017;129(5):e150–4. [DOI] [PubMed] [Google Scholar]
- 28. Lee AC, Kozuki N, Cousens S, Stevens GA, Blencowe H, Silveira MFet al. Estimates of burden and consequences of infants born small for gestational age in low and middle income countries with INTERGROWTH-21st standard: analysis of CHERG datasets. BMJ. 2017;358:j3677. [DOI] [PMC free article] [PubMed] [Google Scholar]
- 29. Subar AF, Kirkpatrick SI, Mittl B, Zimmerman TP, Thompson FE, Bingley Cet al. The automated self-administered 24-hour dietary recall (ASA24): a resource for researchers, clinicians, and educators from the National Cancer Institute. J Acad Nutr Diet. 2012;112(8):1134–7. [DOI] [PMC free article] [PubMed] [Google Scholar]
- 30. Kirkpatrick SI, Subar AF, Douglass D, Zimmerman TP, Thompson FE, Kahle LLet al. Performance of the automated self-administered 24-hour recall relative to a measure of true intakes and to an interviewer-administered 24-h recall. Am J Clin Nutr. 2014;100(1):233–40. [DOI] [PMC free article] [PubMed] [Google Scholar]
- 31. Bowman SA, Friday JE, Moshfegh AJ. MyPyramid Equivalents Database, 2.0 for USDA survey foods, 2003–2004: documentation and user guide. Beltsville (MD): USDA; 2008. [Google Scholar]
- 32. Maldonado LE, Adair LS, Sotres-Alvarez D, Mattei J, Mossavar-Rahmani Y, Perreira KMet al. Dietary patterns and years living in the United States by Hispanic/Latino heritage in the Hispanic Community Health Study/Study of Latinos (HCHS/SOL). J Nutr. 2021;151(9):2749–59. [DOI] [PMC free article] [PubMed] [Google Scholar]
- 33. Starling AP, Sauder KA, Kaar JL, Shapiro AL, Siega-Riz AM, Dabelea D. Maternal dietary patterns during pregnancy are associated with newborn body composition. J Nutr. 2017;147(7):1334–9. [DOI] [PMC free article] [PubMed] [Google Scholar]
- 34. Chasan-Taber L, Schmidt MD, Roberts DE, Hosmer D, Markenson G, Freedson PS. Development and validation of a pregnancy physical activity questionnaire. Med Sci Sports Exerc. 2004;36:1750–60. [DOI] [PubMed] [Google Scholar]
- 35. Farzan SF, Gossai A, Chen Y, Chasan-Taber L, Baker E, Karagas M. Maternal arsenic exposure and gestational diabetes and glucose intolerance in the New Hampshire birth cohort study. Environ Health. 2016;15(1):106. [DOI] [PMC free article] [PubMed] [Google Scholar]
- 36. StataCorp . Stata statistical software: release 16. College Station (TX): StataCorp;2019. [Google Scholar]
- 37. ADA . 2. Classification and diagnosis of diabetes: standards of medical care in diabetes—2018. Diabetes Care. 2018;41(Suppl 1):S13–27. [DOI] [PubMed] [Google Scholar]
- 38. Norusis MJ. Advanced statistics guide: SPSSX. Chicago (IL): SPSS Inc; 1985. [Google Scholar]
- 39. Newby P, Tucker KL. Empirically derived eating patterns using factor or cluster analysis: a review. Nutr Rev. 2004;62(5):177–203. [DOI] [PubMed] [Google Scholar]
- 40. Ma Y, Olendzki BC, Pagoto SL, Hurley TG, Magner RP, Ockene ISet al. Number of 24-hour diet recalls needed to estimate energy intake. Ann Epidemiol. 2009;19(8):553–9. [DOI] [PMC free article] [PubMed] [Google Scholar]
- 41. Rifas-Shiman SL, Rich-Edwards JW, Kleinman KP, Oken E, Gillman MW. Dietary quality during pregnancy varies by maternal characteristics in Project Viva: a US cohort. J Am Diet Assoc. 2009;109(6):1004–11. [DOI] [PMC free article] [PubMed] [Google Scholar]
- 42. Ananth CV, Schisterman EF. Confounding, causality, and confusion: the role of intermediate variables in interpreting observational studies in obstetrics. Am J Obstet Gynecol. 2017;217(2):167–75. [DOI] [PMC free article] [PubMed] [Google Scholar]
- 43. Anderson ML. Multiple inference and gender differences in the effects of early intervention: a reevaluation of the Abecedarian, Perry Preschool, and Early Training projects. J Am Statist Assoc. 2008;103(484):1481–95. [Google Scholar]
- 44. Greenland S, Pearl J, Robins JM. Confounding and collapsibility in causal inference. Stat Sci. 1999;14(1):29–46. [Google Scholar]
- 45. Cuco G, Fernandez-Ballart J, Sala J, Viladrich C, Iranzo R, Vila Jet al. Dietary patterns and associated lifestyles in preconception, pregnancy and postpartum. Eur J Clin Nutr. 2006;60(3):364–71. [DOI] [PubMed] [Google Scholar]
- 46. Timmermans S, Steegers-Theunissen RP, Vujkovic M, den Breeijen H, Russcher H, Lindemans Jet al. The Mediterranean diet and fetal size parameters: the Generation R Study. Br J Nutr. 2012;108(8):1399–409. [DOI] [PubMed] [Google Scholar]
- 47. Rodríguez-Bernal CL, Rebagliato M, Iniguez C, Vioque J, Navarrete-Munoz EM, Murcia Met al. Diet quality in early pregnancy and its effects on fetal growth outcomes: the Infancia y Medio Ambiente (Childhood and Environment) Mother and Child cohort study in Spain. Am J Clin Nutr. 2010;91(6):1659–66. [DOI] [PubMed] [Google Scholar]
- 48. Thompson JM, Wall C, Becroft DM, Robinson E, Wild CJ, Mitchell EA. Maternal dietary patterns in pregnancy and the association with small-for-gestational-age infants. Br J Nutr. 2010;103(11):1665–73. [DOI] [PubMed] [Google Scholar]
- 49. Bowers K, Laughon S, Kiely M, Brite J, Chen Z, Zhang C. Gestational diabetes, pre-pregnancy obesity and pregnancy weight gain in relation to excess fetal growth: variations by race/ethnicity. Diabetologia. 2013;56(6):1263–71. [DOI] [PMC free article] [PubMed] [Google Scholar]
- 50. Metzger BE, Contreras M, Sacks D, Watson W, Dooley S, Foderaro Met al. Hyperglycemia and adverse pregnancy outcomes. N Engl J Med. 2008;358:1991–2002. [DOI] [PubMed] [Google Scholar]
- 51. Neophytou AM, Kioumourtzoglou M-A, Goin DE, Darwin KC, Casey JA. Educational note: addressing special cases of bias that frequently occur in perinatal epidemiology. Int J Epidemiol. 2021;50(1):337–45. [DOI] [PMC free article] [PubMed] [Google Scholar]
- 52. Cano-Sancho G, Casas M. Interactions between environmental pollutants and dietary nutrients: current evidence and implications in epidemiological research. J Epidemiol Community Health. 2021;75:108–13. [DOI] [PubMed] [Google Scholar]
- 53. Robinson AM, Benzies KM, Cairns SL, Fung T, Tough SC. Who is distressed? A comparison of psychosocial stress in pregnancy across seven ethnicities. BMC Pregnancy Childbirth. 2016;16(1):215. [DOI] [PMC free article] [PubMed] [Google Scholar]
- 54. Rolfo A, Nuzzo AM, De Amicis R, Moretti L, Bertoli S, Leone A. Fetal-maternal exposure to endocrine disruptors: correlation with diet intake and pregnancy outcomes. Nutrients. 2020;12(6):1744. [DOI] [PMC free article] [PubMed] [Google Scholar]
- 55. Ødegård RA, Vatten LJ, Nilsen ST, Salvesen KÅ, Austgulen R. Preeclampsia and fetal growth. Obstet Gynecol. 2000;96:950–5. [PubMed] [Google Scholar]
- 56. Casanueva E, Ripoll C, Tolentino M, Morales RM, Pfeffer F, Vilchis Pet al. Vitamin C supplementation to prevent premature rupture of the chorioamniotic membranes: a randomized trial. Am J Clin Nutr. 2005;81(4):859–63. [DOI] [PubMed] [Google Scholar]
- 57. Ley SH, Sun Q, Willett WC, Eliassen AH, Wu K, Pan Aet al. Associations between red meat intake and biomarkers of inflammation and glucose metabolism in women. Am J Clin Nutr. 2014;99(2):352–60. [DOI] [PMC free article] [PubMed] [Google Scholar]
- 58. Englund-Ögge L, Brantsæter AL, Haugen M, Sengpiel V, Khatibi A, Myhre Ret al. Association between intake of artificially sweetened and sugar-sweetened beverages and preterm delivery: a large prospective cohort study. Am J Clin Nutr. 2012;96(3):552–9. [DOI] [PMC free article] [PubMed] [Google Scholar]
- 59. Flores ME, Simonsen SE, Manuck TA, Dyer JM, Turok DK. The “Latina epidemiologic paradox”: contrasting patterns of adverse birth outcomes in US-born and foreign-born Latinas. Womens Health Issues. 2012;22(5):e501–7. [DOI] [PubMed] [Google Scholar]
- 60. Wingate MS, Alexander GR. The healthy migrant theory: variations in pregnancy outcomes among US-born migrants. Soc Sci Med. 2006;62:491–8. [DOI] [PubMed] [Google Scholar]
- 61. Hessol NA, Fuentes-Afflick E. The impact of migration on pregnancy outcomes among Mexican-origin women. J Immigr Minor Health. 2014;16(3):377–84. [DOI] [PubMed] [Google Scholar]
- 62. Osypuk TL, Bates LM, Acevedo-Garcia D. Another Mexican birthweight paradox? The role of residential enclaves and neighborhood poverty in the birthweight of Mexican-origin infants. Soc Sci Med. 2010;70:550–60. [DOI] [PMC free article] [PubMed] [Google Scholar]
- 63. Shaw RJ, Pickett KE. The health benefits of Hispanic communities for non-Hispanic mothers and infants: another Hispanic paradox. Am J Public Health. 2013;103(6):1052–7. [DOI] [PMC free article] [PubMed] [Google Scholar]
- 64. Khani BR, Ye W, Terry P, Wolk A. Reproducibility and validity of major dietary patterns among Swedish women assessed with a food-frequency questionnaire. J Nutr. 2004;134(6):1541–5. [DOI] [PubMed] [Google Scholar]
- 65. National Cancer Institute . Dietary Assessment Primer [Internet]. Bethesda (MD): NIH, National Cancer Institute. Available from: https://dietassessmentprimer.cancer.gov/. [Google Scholar]
- 66. Daviglus ML, Talavera GA, Avilés-Santa ML, Allison M, Cai J, Criqui MHet al. Prevalence of major cardiovascular risk factors and cardiovascular diseases among Hispanic/Latino individuals of diverse backgrounds in the United States. JAMA. 2012;308(17):1775–84. [DOI] [PMC free article] [PubMed] [Google Scholar]
- 67. López L, Golden SH. A new era in understanding diabetes disparities among US Latinos—all are not equal. Diabetes Care. 2014;37(8):2081–3. [DOI] [PMC free article] [PubMed] [Google Scholar]
Associated Data
This section collects any data citations, data availability statements, or supplementary materials included in this article.
Supplementary Materials
Data Availability Statement
Data described in the manuscript, code book, and analytic code will be made available upon reasonable request pending IRB review and approval.