Fig. 2.
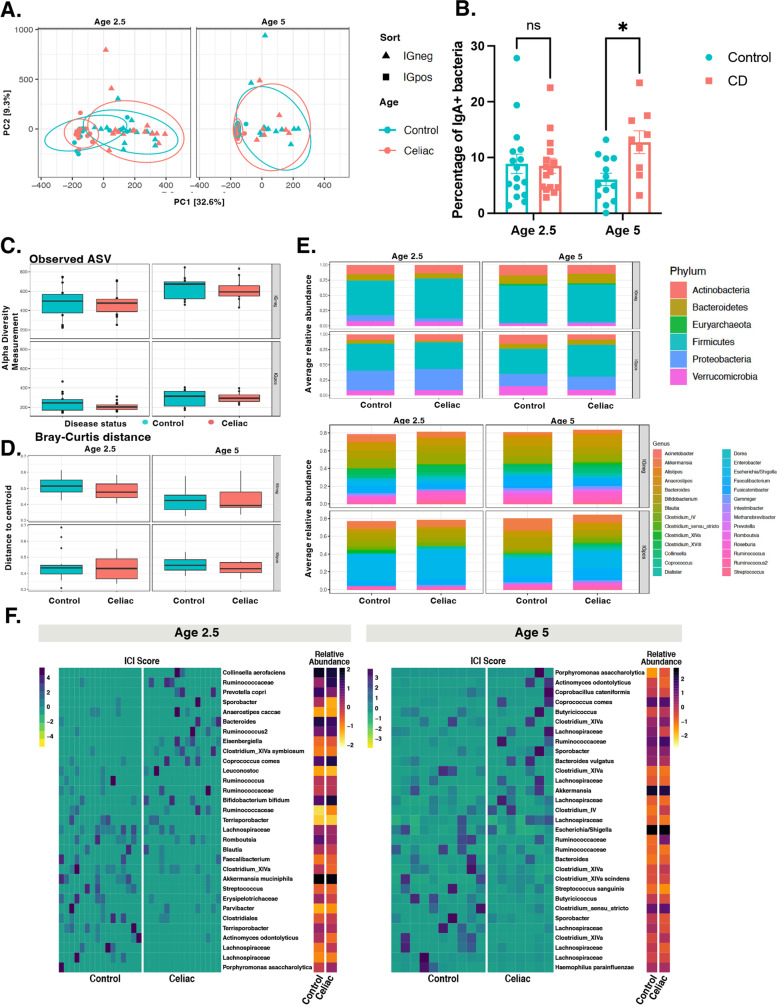
Gut microbiota of children developing CD have more IgA+ bacteria than controls at age 5. A Principal component analysis (PCA) of sample similarity/dissimilarity between IgA+ and IgA− microbiota in control (green), CD progressors (red) at age 2.5 (left), or age 5 (right). B Flow cytometry results for IgA + bacteria in fecal samples comparing CD progressors and healthy controls at ages 2.5 and 5. Indicated are mean ± SEM. Data were expressed as means±SEM. *p<0.05, **p<0.01, ***p<0.001. Statistical analysis was performed by using two-way ANOVA. C Box plots showing the comparison between CD progressors and healthy controls: the alpha diversity measured by observed for IgA+/IgA− microbiota at ages 2.5 (left panel) and 5 years old (right panel). Statistical analysis was performed using ANOVA. D Box plots showing the comparison between CD progressors and healthy controls: the beta diversity measured by Bray–Curtis dissimilarity for IgA+/IgA− microbiota at ages 2.5 (left panel) and 5 years old (right panel). Statistical analysis was performed using PERMANOVA. E Average relative abundance of IgA+/IgA− bacterial phylum (upper panel) or genera (lower panel) of greater than 1% abundance (proportion) between the gut microbiota of CD progressors and healthy controls at ages 2.5 (left panel) and 5 years old (right panel). Taxa average relative abundance>1%. Statistical analysis was performed using two-tailed t tests with Benjamini and Hochberg method to control the false discovery rate (FDR). F Heatmap of normalized IgA coating index (ICI) scores and relative abundance in 31 taxa for age 2.5 (left) and age 5 (right) in healthy and celiac disease progressors. Taxa with ICI values lower than 1 were discarded, except where ICI values for a particular taxon were (ICIControl <1 and ICICeliac > 1) or (ICIControl >1 and ICICeliac <1)

