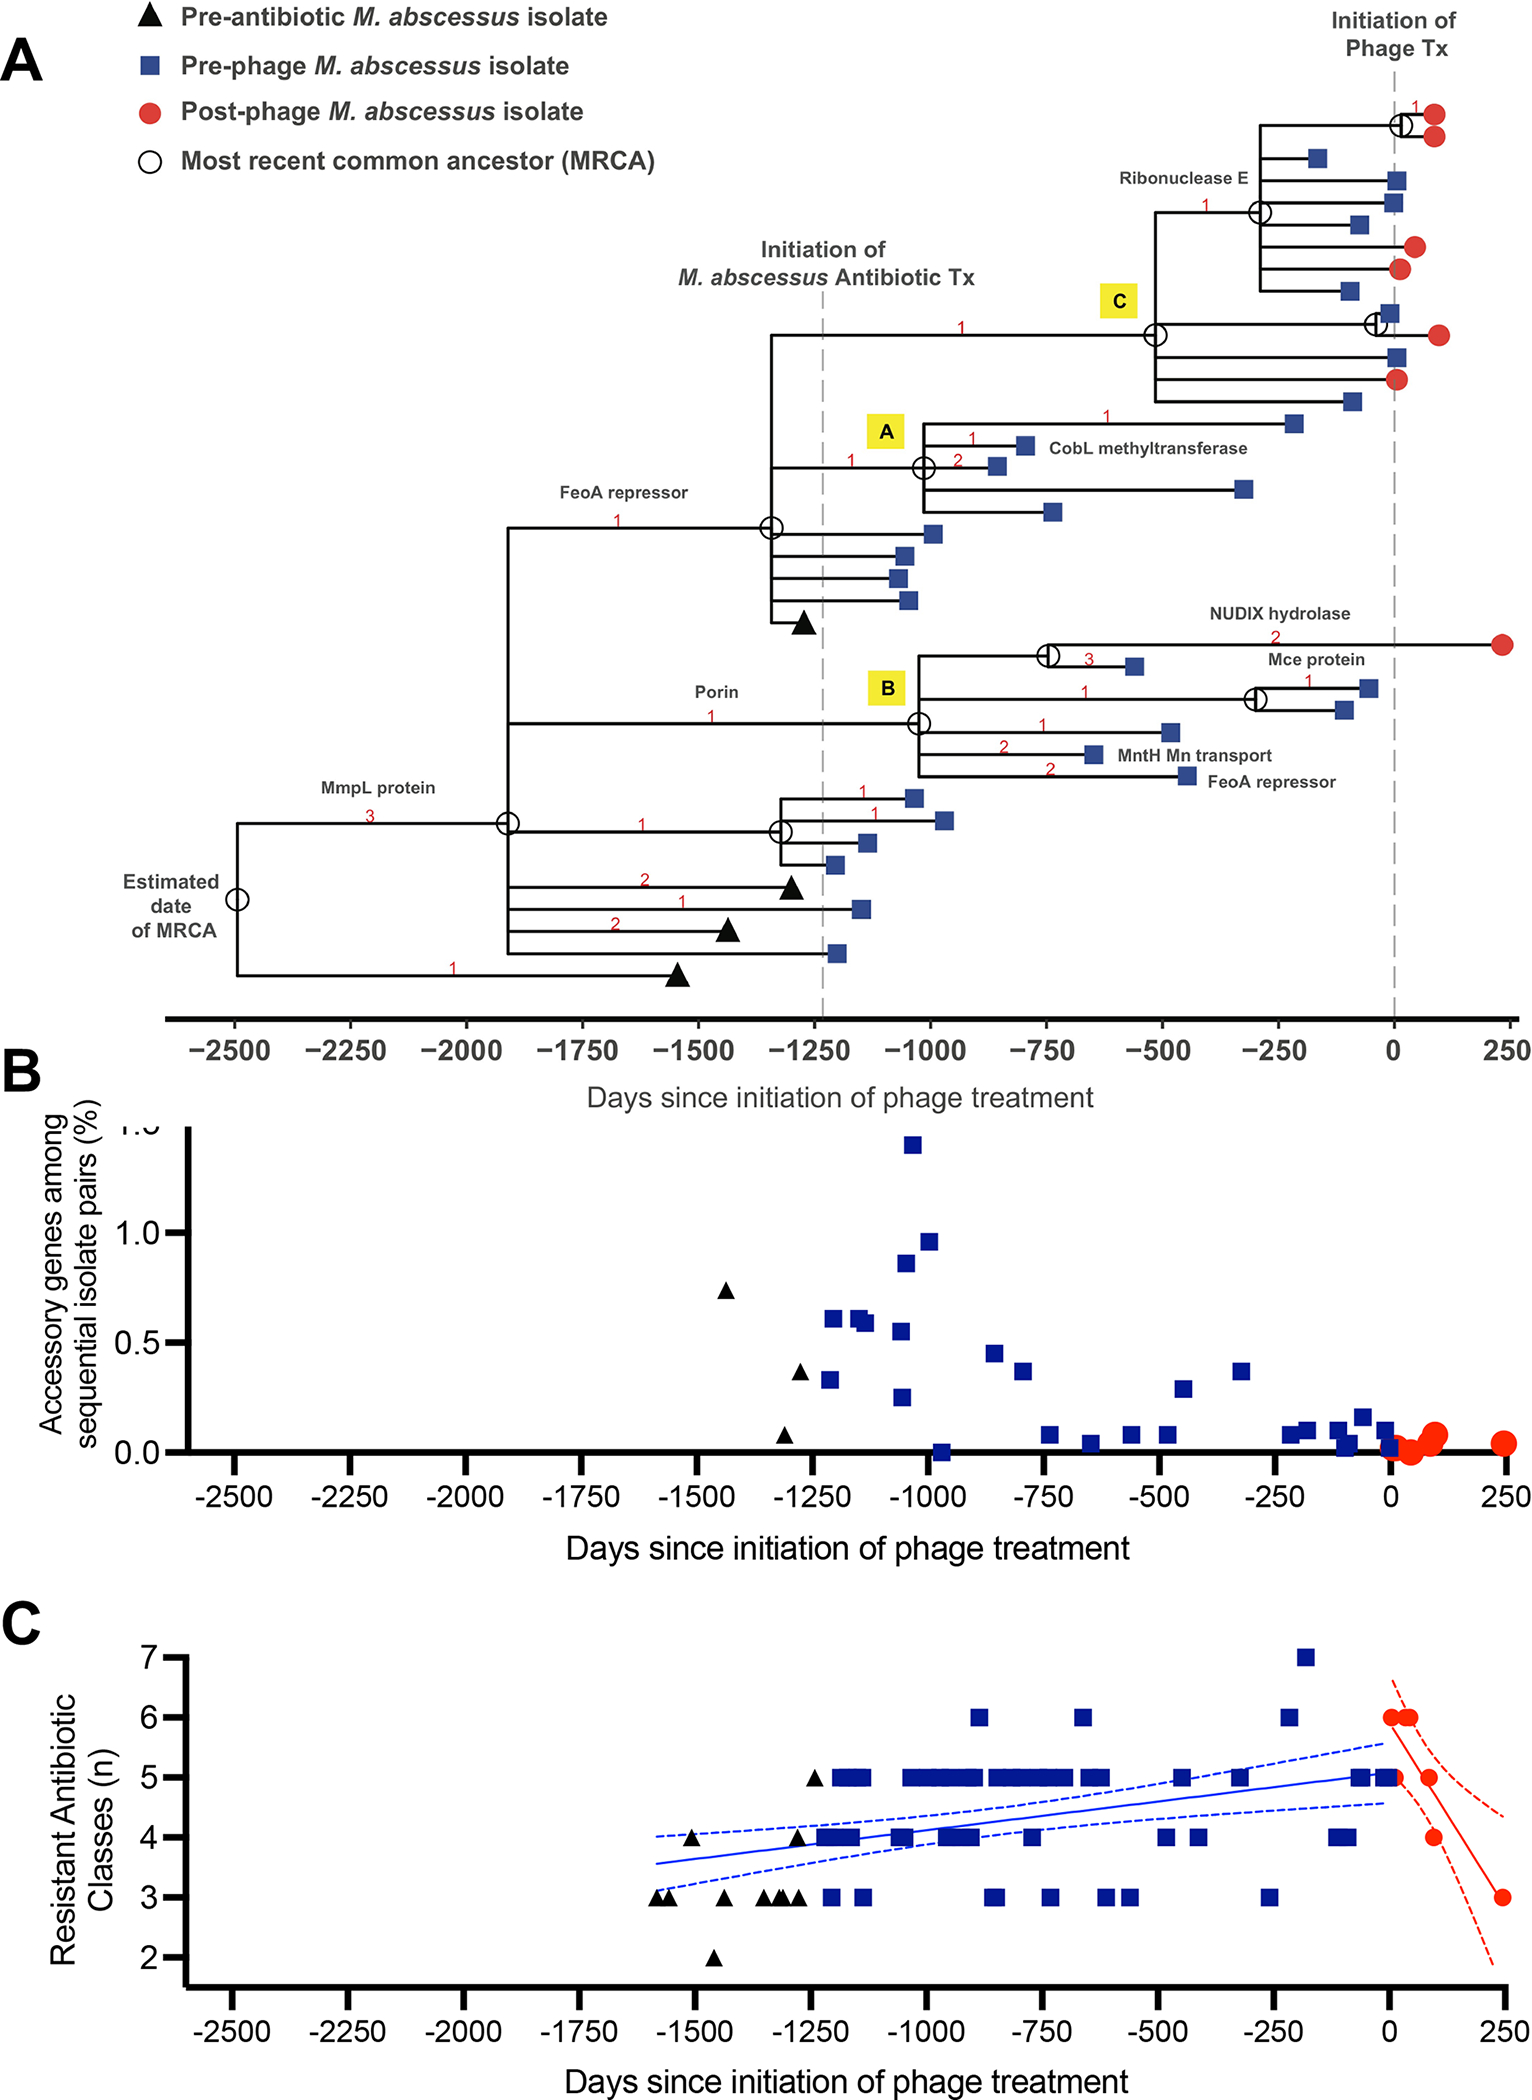
Figure 5. Genetic Diversity and Antibiotic Sensitivity of M. abscessus Isolates Following Phage Therapy.

(A) Genetic lineage map of M. abscessus isolates (n=40) over the course of infection and treatment. A time scaled phylogeny was created based on genome wide SNP data using BEAST v1.10.4. The x-axis represents days since the initiation of phage treatment. Isolates are color-coded symbols on branch tips, and the most recent common ancestors (MRCA) are labeled as open circles on nodes. Red numbers indicate the number of nonsynonymous mutations that occurred on each evolutionary branch. Protein annotations for selected mutations are labeled on branches.
(B) Gene content comparisons of sequential M. abscessus isolates to assess genomic variation over time. For each pair of sequential isolates (x-axis), pan genome analysis was performed to identify accessory genes unique to only one sample. The y-axis (% accessory genes) is defined as the total # of accessory genes/ sum of all genes from both isolates in the pair. Isolate pairs post-phage were significantly less diverse than isolates pre-phage (p=0.0055 by Wilcoxon 2-sample test). Black triangles represent isolate pairs prior to initiation of M. abscessus antibiotic treatment, blue squares following start of antibiotics, and red circles following initiation of phage therapy. The decrease in accessory genes over time suggests a reduction in genetic diversity and selection for a homogeneous population.
(C) Antibiotic resistance of M. abscessus isolates does not increase following phage therapy. Number of resistant antibiotic classes were plotted versus days pre- and post-phage initiation. Black triangles represent isolates prior to initiation of M. abscessus antibiotic treatment, blue squares represent values following start of antibiotics, and red circles following initiation of phage therapy. Simple linear regression demonstrated a significant increase in slope of number of resistant classes over time prior to phage (blue line ± 95%CI, p=0.0007). Following initiation of phage, the slope was significantly negative (red line ± 95%CI, p=0.009).
