

Abstract
Cognitive behavior therapy (CBT) is by far the most examined type of psychological treatment for depression and is recommended in most treatment guidelines. However, no recent meta‐analysis has integrated the results of randomized trials examining its effects, and its efficacy in comparison with other psychotherapies, pharmacotherapies and combined treatment for depression remains uncertain. We searched PubMed, PsycINFO, Embase and the Cochrane Library to identify studies on CBT, and separated included trials into several subsets to conduct random‐effects meta‐analyses. We included 409 trials (518 comparisons) with 52,702 patients, thus conducting the largest meta‐analysis ever of a specific type of psychotherapy for a mental disorder. The quality of the trials was found to have increased significantly over time (with increasing numbers of trials with low risk of bias, less waitlist control groups, and larger sample sizes). CBT had moderate to large effects compared to control conditions such as care as usual and waitlist (g=0.79; 95% CI: 0.70‐0.89), which remained similar in sensitivity analyses and were still significant at 6‐12 month follow‐up. There was no reduction of the effect size of CBT according to the publication year (<2001 vs. 2001‐2010 vs. >2011). CBT was significantly more effective than other psychotherapies, but the difference was small (g=0.06; 95% CI: 0‐0.12) and became non‐significant in most sensitivity analyses. The effects of CBT did not differ significantly from those of pharmacotherapies at the short term, but were significantly larger at 6‐12 month follow‐up (g=0.34; 95% CI: 0.09‐0.58), although the number of trials was small, and the difference was not significant in all sensitivity analyses. Combined treatment was more effective than pharmacotherapies alone at the short (g=0.51; 95% CI: 0.19‐0.84) and long term (g=0.32; 95% CI: 0.09‐0.55), but it was not more effective than CBT alone at either time point. CBT was also effective as unguided self‐help intervention (g=0.45; 95% CI: 0.31‐0.60), in institutional settings (g=0.65; 95% CI: 0.21‐1.08), and in children and adolescents (g=0.41; 95% CI: 0.25‐0.57). We can conclude that the efficacy of CBT in depression is documented across different formats, ages, target groups, and settings. However, the superiority of CBT over other psychotherapies for depression does not emerge clearly from this meta‐analysis. CBT appears to be as effective as pharmacotherapies at the short term, but more effective at the longer term.
Keywords: Depression, cognitive behavior therapy, psychotherapies, Internet‐based interventions, meta‐analysis, antidepressants, combined treatment
Depression is a highly prevalent mental disorder, with about 280 million people worldwide suffering from it1. The disorder results in considerable loss of quality of life in patients and their families 2 , and is associated with increased physical morbidity and premature mortality 3 , a considerable disease burden at the population level 1 , and enormous economic costs 4 . Several evidence‐based interventions are available for the treatment of depression, including pharmacotherapies 5 and psychotherapies 6 .
Cognitive behavior therapy (CBT) is by far the most examined type of psychological treatment for depression and is recommended in most treatment guidelines. Several hundreds of randomized controlled trials have tested the effects of CBT6, 7. Previous meta‐analyses have found that CBT is significantly more effective in the treatment of depression than various control conditions6, 7, 8, whereas its effectiveness in comparison with other psychotherapies, pharmacotherapies and combined treatment at the short and longer term, as well as its impact on specific populations of patients and in different formats, remain uncertain 9 .
The last comprehensive meta‐analysis of CBT for depression was published in 2013 8 , while the number of trials has increased exponentially over the years, and many new trials have been published since then. Furthermore, that meta‐analysis did not include trials in children/adolescents and inpatients, as well as comparisons with pharmacotherapies and combined treatments, with other psychotherapies, and with unguided digital interventions. More recent meta‐analyses have focused on psychological interventions in general, including CBT6, 7, but they have not examined specific characteristics of the participants, the treatment and the study as predictors of outcome.
We decided, therefore, to conduct a new, comprehensive meta‐analysis of randomized trials examining the short‐ and long‐term effects of CBT in depression across all treatment formats (i.e., individual, group, unguided and guided self‐help), all ages (including children and adolescents), delivered in any setting (including outpatients and inpatients), and compared against control conditions (e.g., waitlist, care as usual) as well as other active treatments (i.e., other psychotherapies, antidepressant medications, and combined treatment).
METHODS
Identification and selection of trials
This study is part of a larger meta‐analytic project on psychological treatments for depression 10 . The protocol for the current meta‐analysis has been published in the Open Science Framework (http://osf.io/a6p3w).
The trials included in this study were identified through a database which is continuously updated, currently including studies from 1966 to January 1, 2022. For this database, we searched PubMed, PsycINFO, Embase and the Cochrane Library, by combining index and free terms indicative of depression and psychotherapies, with filters for randomized controlled trials. The full search strings can be found in the supplementary information. Furthermore, we checked references of earlier meta‐analyses on psychological treatments for depression.
Two independent researchers screened all records, and all papers that could meet inclusion criteria according to one of them were retrieved as full text. The two independent researchers also decided to include or exclude a study in the database, and disagreements were resolved through discussion.
For the current study, we selected randomized controlled trials in which CBT for people with depression was compared with control conditions (care as usual, waitlist, others), other psychotherapies, pharmacotherapies, or combined treatment.
A broad definition of CBT was used: a treatment in which the therapist focuses on the impact of present dysfunctional thoughts on a patient's current behavior and future functioning, and which is aimed at evaluating, challenging and modifying a patient's dysfunctional beliefs (cognitive restructuring). Cognitive restructuring could be combined with other mood management skills, such as behavioral activation, problem‐solving, social skills training, or mindfulness. This definition was derived from an extensive study in which different types of psychotherapies were examined by multiple researchers, resulting in a consensus on the definition of each therapy 11 .
Depression could be defined as meeting the criteria for a depressive disorder according to a diagnostic interview or as a score above the cut‐off on a self‐report depression measure. We included trials in which CBT was administered in any format (individual, group, telephone, guided or unguided self‐help). We also included trials of outpatients as well as inpatients, and in any age group.
We separated the included studies into several subsets, so that the comparisons from these studies could be pooled in a meta‐analysis. In the largest subset, CBT was compared with control conditions. In this subset, we included CBT that was applied individually, in groups, as guided self‐help, or in a mixed format, because previous research has shown that these formats have comparable effects 12 . Studies of unguided self‐help CBT were included in a separate subset. We also created a separate subset for CBT in inpatients, because these patients differ from outpatients, and the control conditions vary considerably from outpatient settings 13 . A separate subset was also built for studies comparing CBT with pharmacotherapies, CBT with combined treatment, and pharmacotherapies with combined treatment. We created a separate subset for depression in children and adolescents, because therapies usually are less effective in this group.
Quality assessment and data extraction
We assessed the validity of included studies using four criteria of the Risk of Bias (RoB) assessment tool, version 1, developed by the Cochrane Collaboration14, 15. The RoB tool assesses possible sources of bias in randomized trials, including the adequate generation of allocation sequence; the concealment of allocation to conditions; the prevention of knowledge of the allocated intervention (masking of assessors); and dealing with incomplete outcome data (this was assessed as positive when intention‐to‐treat analyses were conducted, meaning that all randomized patients were included in the analyses). Two independent researchers evaluated the validity of the included studies, and disagreements were solved through discussion.
We also coded participant characteristics (diagnostic method, recruitment method, target group, mean age, proportion of women, inpatient or outpatient); characteristics of CBT (treatment format, number of sessions), as well as general characteristics of the studies (type of comparison group, publication year, country where the study was conducted). In the studies in which CBT was compared with other therapies, we also categorized the other therapies according to the definitions provided elsewhere 7 . In studies with pharmacotherapies, we also categorized the type of antidepressant: selective serotonin reuptake inhibitor (SSRI), tricyclic antidepressant (TCA), other.
Outcome measures
For each comparison between a psychological treatment and a control condition, the effect size indicating the difference between the two groups at post‐test was calculated (Hedges’ g) 16 . Effect sizes were calculated by subtracting (at post‐test) the average score of the psychotherapy group from the average score of the control group and dividing the result by the pooled standard deviation. Because some studies were expected to have relatively small sample sizes, we corrected the effect size for small sample bias.
When the means and standard deviations were not reported in a study, we used change scores. If these were not reported, we converted binary outcomes to Hedges’ g. If these were also not reported, we used other statistics (e.g., p value, t value) to calculate the effect size.
Meta‐analyses
To make a historical overview of trials on CBT over time, we conducted bivariable linear regression analyses examining if the characteristics of the trials have changed over time. We limited these analyses to the subset comparing CBT with control conditions, because this was the largest and most homogeneous subset.
The meta‐analyses were conducted using the metapsyTools package in R (version 4.1.1) and Rstudio (version 1.1.463 for Mac) 17 . The metapsyTools package was specifically developed for the meta‐analytic project of which this study is part. This package imports the functionality of the meta 18 , metafor 19 , and dmetar 20 packages.
We calculated the pooled effect sizes in several different ways, as implemented in the metapsyTools package, so that we could explore if different pooling methods resulted in different outcomes. In our main model, all effect size data available for a comparison in a specific study were aggregated within that comparison first. These aggregated effects were then pooled across studies and comparisons. An intra‐study correlation coefficient of ρ=0.5 was assumed to aggregate effects within comparisons.
We conducted several other analyses to examine whether these main outcomes were robust. First, we estimated the pooled effect using a three‐level correlated and hierarchical effects (CHE) model 21 . We assumed an intra‐study correlation of ρ=0.5 for this model. Second, we pooled effects while excluding outliers, using the “non‐overlapping confidence intervals” approach, in which a study is defined as an outlier when the 95% confidence interval (CI) of the effect size does not overlap with the 95% CI of the pooled effect size 20 . Third, we pooled effects while excluding influential cases, defined by the diagnostics proposed by Viechtbauer and Cheung 22 . Fourth, we calculated the effect when the smallest or largest effect in each study was considered. Fifth, we estimated the pooled effect using only studies with a low risk of bias. We also used three different methods to assess and adjust for potential publication bias20, 23: Duval and Tweedie's trim and fill procedure 24 , Rücker's “limit meta‐analysis method” 25 , and the selection model26, 27.
A random‐effects model was assumed for all analyses. Between‐study heterogeneity variance (components) was estimated using restricted maximum likelihood. For models not fitted using robust variance estimation, we applied the Knapp‐Hartung method to obtain robust CIs and significance tests of the overall effect 28 .
As a test of homogeneity of effect sizes, we calculated the I2‐statistic and its 95% CI, which is an indicator of heterogeneity in percentages. A value of 0% indicates no observed heterogeneity, and larger values indicate increasing heterogeneity, with 25% as low, 50% as moderate, and 75% as high heterogeneity 29 . For the three‐level model, we calculated a multilevel extension of I2, which describes the amount of total variability attributable to heterogeneity within studies (level 2) and heterogeneity between studies (level 3)20, 30. Because I2 cannot be interpreted as an absolute measure of the between‐study heterogeneity, we also added the prediction interval (PI) to the main analyses, which indicates the range in which the true effect size of 95% of all populations will fall31, 32.
We also estimated the number‐needed‐to‐treat (NNT) for depression using the formulae provided by Furukawa 33 (assuming the control group's event rate at a conservative 17%) 34 .
For the main comparison (CBT versus control conditions), we also extracted the rate of response (i.e., a 50% reduction of depressive symptoms compared to baseline). If the response rate was not reported, we estimated it using a method based on the baseline means, the post‐test means, the post‐test standard deviations and the number of subjects 35 . For studies using the Hamilton Rating Scale for Depression (HAM‐D), we also calculated the rate of remission, defined as a score of ≤7 on the 17‐item version of that scale 36 . We also calculated the relative risk (RR) for response and remission of CBT compared with the control groups, as well as the NNT (as 1 divided by the risk difference).
In each subset, we conducted a series of subgroup analyses, examining the effects of the interventions according to major characteristics of the participants, interventions and studies. We avoided subgroups of less than five studies, merging them with other subgroups. Because the subset comparing CBT with control conditions was very large, we also conducted a multivariable meta‐regression analysis in which all characteristics were included.
RESULTS
Selection and inclusion of studies
After examining a total of 30,889 records (21,563 after removal of duplicates), we retrieved 3,584 full‐text papers for further consideration. A total of 409 trials met the inclusion criteria for this meta‐analysis (see Figure 1). Selected characteristics of included studies and comparisons are presented in the supplementary information.
Figure 1.
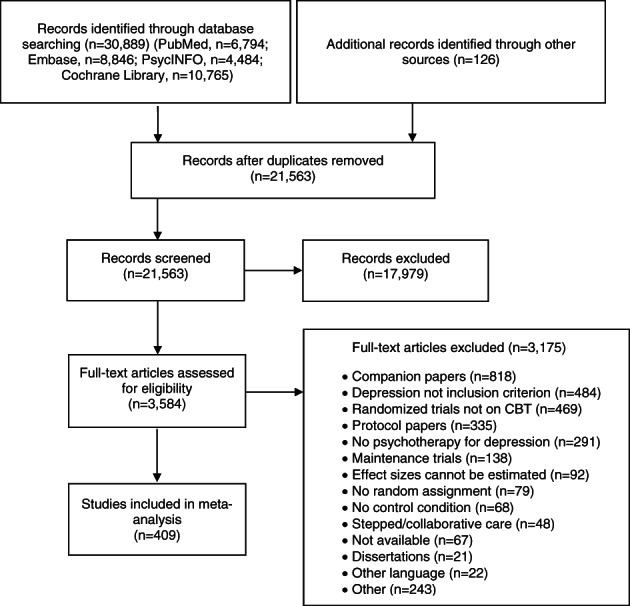
PRISMA flow chart, CBT – cognitive behavior therapy
Characteristics of included studies
The 409 studies (518 comparisons between CBT and a control condition) included 52,702 patients (27,000 in CBT and 25,702 in control groups). Aggregated characteristics of the studies and comparisons are provided in Table 1.
Table 1.
Aggregated characteristics of included studies and comparisons
| Included studies (n=409) | ||
| Recruitment, n (%) | Community | 181 (44.3) |
| Clinical | 106 (25.9) | |
| Other | 122 (29.6) | |
| Target group, n (%) | Children | 12 (2.9) |
| Adolescents | 25 (6.1) | |
| Adults | 160 (39.1) | |
| Elderly | 26 (6.4) | |
| General medical | 70 (17.1) | |
| Perinatal | 41 (10.0) | |
| Other | 75 (18.3) | |
| Age, years (mean±SD) | 40.1±15.0 | |
| Gender (% female) | 69.0 | |
| Diagnosis, n (%) | Meeting criteria for depressive disorder | 226 (55.3) |
| Score above cut‐off on self‐report depression measure | 162 (39.3) | |
| Other | 21 (5.1) | |
| Country, n (%) | US | 141 (34.5) |
| UK | 44 (10.8) | |
| Other European countries | 97 (23.7) | |
| Australia | 33 (8.1) | |
| Canada | 25 (6.1) | |
| East Asia | 30 (7.3) | |
| Other | 39 (9.5) | |
| Year of publication, n (%) | <1980 | 4 (1.0) |
| 1981‐1990 | 32 (7.8) | |
| 1991‐2000 | 41 (10.0) | |
| 2001‐2010 | 83 (20.3) | |
| 2011‐2020 | 219 (53.5) | |
| 2021 | 30 (7.3) | |
| Overall risk of bias (RoB), n (%) | 0 (high) | 20 (4.9) |
| 1 | 85 (20.8) | |
| 2 | 73 (17.8) | |
| 3 | 100 (24.4) | |
| 4 (low) | 131 (32.0) | |
| RoB: Adequate sequence generation, n (%) | 224 (54.8) | |
| RoB: Adequate allocation concealment, n (%) | 201 (49.1) | |
| RoB: Adequate masking of assessors, n (%) | 101 (24.7) | |
| RoB: Intention‐to‐treat analyses, n (%) | 262 (64.1) | |
| Included comparisons (n=518) | ||
| Format, n (%) | Individual | 206 (39.8) |
| Group | 141 (27.2) | |
| Guided self‐help | 84 (16.2) | |
| Unguided self‐help | 39 (7.5) | |
| Other/mixed | 48 (9.3) | |
| Number of sessions, n (%) | <8 | 120 (23.2) |
| 8‐12 | 141 (27.2) | |
| >12 | 211 (40.7) | |
| Not reported/relevant | 46 (8.9) | |
Most studies recruited participants through the community (n=181, 44.3%) or clinical referrals (n=106, 25.9%). In most studies, the target group was represented by adults in general (n=160, 39.1%); 70 studies aimed at patients with general medical disorders (17.1%), 41 studies at perinatal depression (10.0%), and 27 studies at children or adolescents (9.0%).
In the majority of studies (n=226, 55.3%), depression was defined as meeting the criteria for a depressive disorder according to a diagnostic interview, while in 162 studies (39.3%) it was defined as a score above the cut‐off on a self‐report depression measure. The mean age of participants in the studies was 40.1±14.98 years; the average proportion of women was 69%. Most studies were conducted in the US (n=141, 34.5%) or in the UK or other European countries (n=141, 34.5%). Most studies (n=249, 60.8%) were published since 2011.
Among the 518 comparisons, the majority tested an individual CBT format (n=206, 39.8%), while 141 examined a group format (27.2%), 84 a guided self‐help format (16.2%), and 39 an unguided self‐help format (7.5%). In 211 comparisons (40.7%), CBT was administered in more than 12 sessions.
Of the 409 studies, 224 (54.8%) reported an adequate generation of allocation sequence, 201 (49.1%) an adequate concealment of allocation to conditions, and 101 (24.7%) an adequate prevention of knowledge of the allocated intervention (masking of assessors); 262 (64.1%) conducted intention‐to‐treat analyses. Risk of bias was low across all four domains in 131 studies (32.0%), for two or three domains in 173 studies (42.2%), and for no or one domain in 105 studies (25.7%).
Historical overview
The historical overview was limited to the subset comparing CBT with control conditions (241 studies with 271 comparisons, including 12,907 patients in CBT arms and 12,199 in control conditions). The cumulative number of studies over time is shown in Figure 2.
Figure 2.

Randomized trials comparing cognitive behavior therapy (CBT) with control conditions: cumulation over time
The bivariable linear regression analyses found that the number of trials examining depressed patients with general medical disorders and women with perinatal depression increased significantly over time (p=0.007 and p=0.012, respectively). The use of waitlist as the control condition decreased significantly over time (p=0.001), while the number of studies with low risk of bias increased significantly (p<0.001), as well as the number of trials in non‐Western countries (p=0.005). The number of participants in each comparison also increased significantly (p<0.001), while the number of sessions of CBT decreased significantly over time (p=0.03). All the other characteristics of CBT trials did not change over time (see also supplementary information).
CBT versus control conditions
The main effect size indicating the overall difference between CBT and control conditions after treatment was g=0.79 (95% CI: 0.70‐0.89), corresponding to an NNT of 3.8 (see Table 2). Heterogeneity was very high (I2=85; 95% CI: 83‐86), and the prediction interval ranged from –0.45 to 2.04.
Table 2.
Cognitive behavior therapy (CBT) vs. control conditions: main analyses
| n | g (95% CI) | I2 (95% CI) | PI | NNT | |
|---|---|---|---|---|---|
| Post‐test | |||||
| All comparisons | 271 | 0.79 (0.70‐0.89) | 85 (83‐86) | –0.45 to 2.04 | 3.8 |
| Outliers removed | 194 | 0.70 (0.65‐0.74) | 26 (11‐39) | 0.49 to 0.90 | 4.4 |
| Only low risk of bias | 90 | 0.60 (0.49‐0.71) | 77 (72‐81) | –0.22 to 1.42 | 5.2 |
| Three‐level model | 460 | 0.81 (0.72‐0.90) | 90 (‐) | –0.56 to 2.17 | 3.7 |
| Publication bias correction | 349 | 0.47 (0.35‐0.59) | 90 (89‐91) | –1.52 to 2.46 | 7.0 |
| 6‐9 month follow‐up | |||||
| All comparisons | 78 | 0.74 (0.36‐1.11) | 91 (89‐92) | –1.90 to 3.37 | 4.1 |
| Outliers removed | 65 | 0.42 (0.33‐0.50) | 63 (51‐72) | –0.10 to 0.93 | 8.0 |
| Only low risk of bias | 29 | 0.91 (0.46‐1.36) | 94 (92‐95) | –1.46 to 3.28 | 3.2 |
| Three‐level model | 119 | 0.74 (0.40‐1.08) | 98 (‐) | –2.17 to 3.65 | 4.1 |
| Publication bias correction | 93 | 0.30 (–0.23 to 0.83) | 94 (93‐95) | –4.31 to 4.91 | 11.4 |
| 10‐12 month follow‐up | |||||
| All comparisons | 22 | 0.49 (0.01‐0.98) | 91 (88‐93) | –1.68 to 2.67 | 6.5 |
| Outliers removed | 20 | 0.22 (0.10‐0.35) | 74 (59‐83) | –0.25 to 0.70 | 16.0 |
| Only low risk of bias | 4 | 0.28 (–0.25 to 0.82) | 87 (68‐94) | –1.29 to 1.86 | 12.3 |
| Three‐level model | 30 | 0.50 (0.03‐0.96) | 97 (‐) | –1.65 to 2.64 | 6.5 |
| Publication bias correction | 22 | 0.49 (0.01‐0.98) | 91 (88‐93) | –1.68 to 2.67 | 6.5 |
| 13‐24 month follow‐up | |||||
| All comparisons | 8 | 0.22 (–0.12 to 0.56) | 86 (75‐93) | –0.77 to 1.21 | 16.2 |
| Outliers removed | 7 | 0.09 (–0.10 to 0.27) | 11 (0‐74) | –0.24 to 0.42 | 42.9 |
| Only low risk of bias | 3 | –0.01 (–0.17 to 0.16) | 0 (0‐90) | –1.20 to 1.18 | 416.3 |
| Three‐level model | 13 | 0.22 (–0.14 to 0.59) | 80 (‐) | –0.68 to 1.13 | 16.0 |
| Publication bias correction | 11 | 0.44 (0.09‐0.80) | 89 (83‐93) | –0.71 to 1.60 | 7.4 |
PI – prediction interval, NNT – number needed to treat. The reported publication bias correction is that using the trim and fill procedure.
The sensitivity analyses supported the main findings (see Table 2 and supplementary information). Heterogeneity was considerably lower after excluding outliers (I2=26; 95% CI: 11‐39), but the number of outliers that had to be removed was large (n=77). The effect size was smaller for studies with low risk of bias (g=0.60; 95% CI: 0.49‐0.71) and after adjusting for publication bias (g=0.47, 95% CI: 0.35‐0.59 using the trim and fill procedure).
The subgroup analyses indicated that the effect size in studies with low risk of bias was significantly lower than in other studies (p<0.001), and that the effect size differed across countries (higher in non‐Western countries; p=0.003) and treatment formats (higher for group formats; p=0.02). There was no reduction of the effect size of CBT according to the publication year (<2001 vs. 2001‐2010 vs. >2011) (p=0.43). We entered all variables in a multivariable meta‐regression analysis and found that, after adjustment for all variables, only the use of a waitlist control condition (p=0.02) and whether the trial was conducted in an “other” country (not the US, Europe, East Asia, Canada or Australia; p=0.001) had a significant impact on the effect size (see supplementary information).
CBT was still effective at 6 to 9 month follow‐up (g=0.74, 95% CI: 0.36‐1.11) and at 10 to 12 month follow‐up (g=0.49, 95% CI: 0.01‐0.98), and this was confirmed in most sensitivity analyses (see Table 2 and supplementary information). Heterogeneity was high in most analyses. At 13 to 24 month follow‐up, the main effect size was no longer significant (g=0.22, 95% CI: –0.12 to 0.56), although this may be related to the small number of studies (n=8).
The response rate was 0.42 (95% CI: 0.39‐0.45) in CBT and 0.19 (95% CI: 0.18‐0.21) in the control conditions, which resulted in a RR of 2.13 (95% CI: 1.96‐2.32) and a NNT of 4.7 (95% CI: 4.0‐5.5) in favor of CBT (see Table 3). Most sensitivity analyses indicated similar outcomes, except that there was significant publication bias, and the RR was lower in studies with low risk of bias. The response rates differed significantly across control conditions, with the lowest rate for waitlist (see Table 3 and supplementary information).
Table 3.
Cognitive behavior therapy (CBT) vs. control conditions: response and remission rates, relative risk (RR) and number‐needed‐to‐treat (NNT)
| n | Rate (95% CI) | I2 (95% CI) | RR (95% CI) | I2 (95% CI) | NNT (95% CI) | |
|---|---|---|---|---|---|---|
| Response | ||||||
| All CBT conditions | 238 | 0.42 (0.39‐0.45) | 82 (79‐84) | 2.13 (1.96‐2.32) | 47 (38‐54) | 4.7 (4.0‐5.5) |
| Reported | 10 | 0.42 (0.28‐0.59) | 91 (85‐94) | 2.32 (1.43‐3.77) | 46 (0‐74) | 4.0 (1.9‐12.2) |
| Estimated | 228 | 0.42 (0.39‐0.45) | 81 (79‐83) | 2.13 (1.95‐2.32) | 47 (38‐54) | 4.7 (4.0‐5.5) |
| Outliers excluded | 162 | 0.42 (0.40‐0.43) | 31 (16‐43) | 2.25 (2.07‐2.44) | 10 (0‐25) | 4.2 (3.7‐4.9) |
| Publication bias correction | 259 | 0.39 (0.36‐0.42) | 84 (82‐85) | 1.66 (1.48‐1.85) | 59 (54‐64) | 8.0 (6.2‐11.0) |
| Low risk of bias | 78 | 0.39 (0.35‐0.44) | 86 (83‐88) | 1.84 (1.64‐2.07) | 40 (21‐54) | 6.3 (4.9‐8.2) |
| All control groups | 238 | 0.19 (0.18‐0.21) | 67 (63‐72) | |||
| Reported | 10 | 0.17 (0.10‐0.25) | 73 (48‐86) | |||
| Estimated | 228 | 0.19 (0.18‐0.21) | 67 (62‐71) | |||
| Outliers excluded | 192 | 0.19 (0.18‐0.20) | 14 (0‐29) | |||
| Publication bias correction | 310 | 0.24 (0.22‐0.26) | 72 (68‐75) | |||
| Low risk of bias | 78 | 0.21 (0.18‐0.24) | 73 (66‐78) | |||
| Type: Waitlist* | 110 | 0.17 (0.15‐0.19) | 50 (38‐60) | |||
| Type: Care as usual | 104 | 0.21 (0.18‐0.24) | 75 (70‐79) | |||
| Type: Other control | 24 | 0.23 (0.19‐0.26) | 60 (37‐74) | |||
| Remission | ||||||
| All CBT conditions | 69 | 0.36 (0.31‐0.42) | 80 (75‐84) | 2.45 (2.06‐2.92) | 26 (0‐45) | 3.6 (2.7‐5.0) |
| Reported** | 10 | 0.49 (0.38‐0.60) | 73 (48‐86) | 2.36 (1.71‐3.25) | 18 (0‐59) | 3.9 (2.3‐7.4) |
| Estimated | 59 | 0.34 (0.29‐0.40) | 80 (75‐85) | 2.47 (2.01‐3.03) | 26 (0‐47) | 3.6 (2.6‐5.2) |
| Outliers excluded | 49 | 0.36 (0.33‐0.39) | 48 (27‐63) | 2.47 (2.08‐2.93) | 10 (0‐34) | 3.6 (2.7‐4.9) |
| Publication bias correction | 80 | 0.43 (0.37‐0.50) | 83 (80‐86) | 1.83 (1.44‐2.31) | 41 (24‐54) | 6.3 (4.0‐12.0) |
| Low risk of bias | 14 | 0.33 (0.22‐0.47) | 87 (80‐92) | 2.17 (1.57‐2.99) | 30 (0‐63) | 4.5 (2.6‐9.2) |
| All control groups | 69 | 0.15 (0.12‐0.18) | 70 (61‐76) | |||
| Reported | 10 | 0.19 (0.13‐0.29) | 66 (34‐83) | |||
| Estimated | 59 | 0.14 (0.10‐0.18) | 71 (62‐77) | |||
| Outliers excluded | 56 | 0.14 (0.12‐0.16) | 29 (1‐49) | |||
| Publication bias correction | 98 | 0.24 (0.19‐0.31) | 75 (70‐80) | |||
| Low risk of bias | 14 | 0.18 (0.13‐0.24) | 67 (41‐81) | |||
| Type: Waitlist | 34 | 0.12 (0.08‐0.17) | 59 (40‐72) | |||
| Type: Care as usual | 27 | 0.15 (0.10‐0.21) | 76 (65‐83) | |||
| Type: Other control | 8 | 0.21 (0.15‐0.29) | 71 (40‐86) |
difference among types of control conditions, p=0.006,
difference between reported and estimated remission rates, p=0.02
The remission rate was 0.36 (95% CI: 0.31‐0.42) for CBT and 0.15 (0.12‐0.18) for control conditions, which resulted in a RR of 2.45 (95% CI: 2.06‐2.92), and a NNT of 3.6 (95% CI: 2.7‐5.0). This rate remained very similar in the sensitivity analyses, although it was somewhat lower (but still significant) after adjustment for publication bias. These findings should be considered with caution, because the difference between reported and estimated remission rates was significant (p=0.02) (see Table 3 and supplementary information).
CBT versus other psychotherapies
CBT was compared with other psychotherapies in 87 studies (82 comparisons; 6,480 participants, including 3,148 in CBT and 3,332 in the other therapies). The main analyses indicated a very small, but significant effect of CBT over other therapies (g=0.06; 95% CI: 0‐0.12; NNT=63), with low heterogeneity (I2=31; 95% CI: 10‐47) (see Table 4).
Table 4.
Cognitive behavior therapy (CBT) vs. other active treatments
| n | g (95% CI) | I2 (95% CI) | NNT | |
|---|---|---|---|---|
| CBT vs. other psychotherapies | ||||
| All studies | 87 | 0.06 (0‐0.12) | 31 (10‐47) | 63 |
| Outliers removed | 81 | 0.04 (–0.01 to 0.09) | 1 (0‐27) | 93.9 |
| Only low risk of bias | 24 | 0.02 (–0.05 to 0.09) | 0 (0‐45) | 200.4 |
| Publication bias correction | 92 | 0.04 (–0.03 to 0.11) | 44 (28‐56) | 93.4 |
| Long‐term effect (at 6‐9 months) | 18 | –0.03 (–0.14 to 0.07) | 0 (0‐50) | 117.2 |
| Long‐term effect (at 9‐12 months) | 14 | –0.09 (–0.19 to 0.01) | 12 (0‐50) | 47.7 |
| Compared to supportive therapy | 22 | 0.12 (–0.07 to 0.31) | 54 (26‐72) | 31.2 |
| Compared to interpersonal therapy | 9 | 0.00 (–0.12 to 0.12) | 0 (0‐65) | 18.0 |
| Compared to psychodynamic therapy | 7 | 0.21 (–0.10 to 0.52) | 47 (0‐78) | 17.1 |
| Compared to behavioral activation | 10 | 0.02 (–0.17 to 0.20) | 28 (0‐66) | 196.6 |
| Compared to 3rd wave therapies | 2 | –0.05 (–1.21 to 1.11) | 0 (‐) | 81.0 |
| Compared to problem‐solving therapy | 2 | 0.12 (–0.21 to 0.44) | 0 (‐) | 31.2 |
| Compared to other psychotherapies | 35 | 0.05 (–0.04 to 0.14) | 23 (0‐49) | 77.2 |
| CBT vs. pharmacotherapies | ||||
| All studies | 38 | 0.08 (–0.07 to 0.24) | 66 (52‐76) | 46.1 |
| Outliers removed | 32 | –0.03 (–0.13 to 0.07) | 34 (0‐57) | 135.0 |
| Only low risk of bias | 8 | –0.06 (–0.38 to 0.27) | 66 (29‐84) | 70.6 |
| Publication bias correction | 44 | –0.05 (–0.25 to 0.15) | 76 (68‐82) | 81.7 |
| Long‐term effect (at 6‐12 months) | 12 | 0.34 (0.09‐0.58) | 53 (10‐76) | 10.2 |
| Combined treatment vs. pharmacotherapy alone | ||||
| All studies | 18 | 0.51 (0.19‐0.84) | 71 (53‐82) | 6.3 |
| Outliers removed | 16 | 0.41 (0.23‐0.60) | 49 (8‐71) | 8.1 |
| Only low risk of bias | 5 | 0.27 (–0.42 to 0.96) | 77 (43‐90) | 13.1 |
| Publication bias correction | 21 | 0.34 (–0.08 to 0.76) | 79 (68‐86) | 10.1 |
| Long‐term effect (at 6‐12 months) | 6 | 0.32 (0.09‐0.55) | 29 (0‐71) | 10.6 |
| Combined treatment vs. CBT alone | ||||
| All studies | 15 | 0.19 (–0.11 to 0.50) | 68 (45‐81) | 22.4 |
| Outliers removed | 13 | 0.19 (–0.01 to 0.39) | 18 (0‐56) | 22.8 |
| Only low risk of bias | 2 | –0.24 (–12.73 to 12.25) | 94 (82‐98) | 14.7 |
| Publication bias correction | 18 | 0.37 (0.03‐0.72) | 77 (63‐85) | 12.8 |
| Long‐term effect (at 6‐12 months) | 5 | 0.11 (–0.38 to 0.60) | 25 (0‐70) | 34.8 |
NNT – number needed to treat. The reported publication bias correction is that using the trim and fill procedure.
When limiting the studies to those with low risk of bias, or excluding outliers, or after adjustment for publication bias, the difference between CBT and other psychotherapies was no longer significant. In the subgroup analyses in which we examined the different psychotherapies that were compared with CBT, we found no indication that one of these therapies was more or less effective than CBT (see Table 4 and supplementary information).
The number of studies reporting longer‐term outcomes was small, and no significant differences between CBT and other psychotherapies were found at 6‐9 months, 9‐12 months, or 13‐24 months (see Table 4 and supplementary information).
CBT versus pharmacotherapies and combined treatment
CBT was compared with pharmacotherapies in 38 studies (38 comparisons; 2,979 participants, including 1,459 in CBT groups and 1,520 in pharmacotherapy groups). No significant difference was found between CBT and pharmacotherapies (g=0.08; 95% CI: –0.07 to 0.24). The same was observed in sensitivity analyses, although one of the analyses examining publication bias indicated a small, but significant effect in favor of pharmacotherapies. None of the subgroup analyses pointed at a significant difference between subgroups of studies (see Table 4 and supplementary information).
At 6 to 12 month follow‐up, CBT was more effective than pharmacotherapies (g=0.34; 95% CI: 0.09‐0.58; NNT=10.2). This was confirmed in most sensitivity analyses, although the number of studies with low risk of bias was small and the effect size no longer significant. In two of the three analyses adjusting for publication bias, this finding was also not significant anymore (see Table 4 and supplementary information).
Combined treatment was compared with pharmacotherapy alone in 18 studies (18 comparisons; 1,658 participants, including 827 in the combined and 831 in the pharmacotherapy conditions). Combined treatment was more effective than pharmacotherapy (g=0.51; 95% CI: 0.19‐0.84) and that was confirmed in most sensitivity analyses, although the number of trials with low risk of bias was small. After adjustment for publication bias, the effects were no longer significant. No significant differences were found in subgroup analyses (see Table 4 and supplementary information).
Combined treatment was not significantly more effective than CBT alone (g=0.19; 95% CI: –0.11 to 0.50) in the 15 relevant studies (14 comparisons; 644 participants, including 325 in the combined and 319 in the CBT only conditions). Only one of three analyses in which we adjusted for publication bias resulted in a significant effect size in favor of combined treatment. Because of the limited number of trials, we could only conduct a limited number of subgroup analyses, and none of them resulted in significant differences between subgroups (see Table 4 and supplementary information).
At 6 to 12 month follow‐up, combined treatment was more effective than pharmacotherapy alone (g=0.32, 95% CI: 0.09‐0.55), but this finding was not confirmed in all sensitivity analyses. Combined treatment was not more effective than CBT alone (g=0.11; 95% CI: –0.38 to 0.60) (see Table 4 and supplementary information).
Other comparisons
Unguided self‐help CBT (Internet‐based or not) had a small to moderate effect on depression (g=0.45; 95% CI: 0.31‐0.60), based on 36 studies (39 comparisons; 11,720 participants, including 6,206 in the CBT and 5,514 in the control conditions). The effects of unguided CBT were significant in all sensitivity analyses, although they were somewhat smaller in two of three analyses adjusting for publication bias. Subgroup analyses indicated that waitlist‐controlled trials resulted in larger effect sizes (p=0.03), and studies in Europe resulted in smaller effects (p=0.01). We also found that studies conducted after 2011 had significantly larger effects than earlier studies (p=0.01), suggesting that the effects may have improved over time (see Table 5 and supplementary information).
Table 5.
Other comparisons between cognitive behavior therapy (CBT) and control conditions
| n | g (95% CI) | I2 (95% CI) | NNT | |
|---|---|---|---|---|
| Unguided self‐help CBT | ||||
| All comparisons | 39 | 0.45 (0.31‐0.60) | 78 (71‐84) | 7.2 |
| Outliers removed | 34 | 0.43 (0.34‐0.52) | 51 (28‐67) | 7.7 |
| Only low risk of bias | 18 | 0.40 (0.27‐0.52) | 59 (32‐76) | 8.4 |
| Publication bias correction | 53 | 0.25 (0.07‐0.43) | 84 (80‐88) | 14.2 |
| CBT in institutional settings | ||||
| All comparisons | 11 | 0.65 (0.21‐1.08) | 70 (45‐84) | 4.8 |
| Outliers removed | 10 | 0.49 (0.15‐0.83) | 52 (2‐77) | 6.6 |
| Publication bias correction | 13 | 0.41 (–0.14 to 0.96) | 81 (68‐88) | 8.2 |
| CBT in children and adolescents | ||||
| All comparisons | 39 | 0.41 (0.25‐0.57) | 78 (70‐84) | 8.1 |
| Outliers removed | 32 | 0.33 (0.23‐0.43) | 24 (0‐51) | 10.3 |
| Only low risk of bias | 8 | 0.17 (–0.10 to 0.45) | 78 (57‐89) | 21 |
| Publication bias correction | 55 | 0.10 (–0.09 to 0.30) | 86 (82‐899 | 36.8 |
NNT – number needed to treat. The reported publication bias correction is that using the trim and fill procedure.
We could compare CBT in institutional settings to control conditions in 10 studies (11 comparisons; 448 participants, including 275 in CBT and 173 in the control conditions). Five studies (six comparisons) were conducted in psychiatric inpatient settings, four in nursing homes, and one in another institutional setting. None of the trials was rated as at low risk of bias. We found a moderate to large effect (g=0.65; 95% CI: 0.21‐1.08) with high heterogeneity, which remained significant in most sensitivity analyses, but was no longer significant in two of the three analyses adjusting for publication bias (see Table 5 and supplementary information). Because of the small number of trials and the low quality, we did not conduct subgroup analyses.
In children and adolescents, CBT was compared to control conditions in 37 studies (39 comparisons; 3,667 participants, including 1,859 in CBT and 1,808 in control groups). We found a moderate effect (g=0.41; 95% CI: 0.25‐0.57; NNT=8.1), with high heterogeneity (I2=78; 95% CI: 70‐84). The effect size remained similar across most sensitivity analyses. The number of studies with low risk of bias was low and the effect size was no longer significant in this subset. One of the effect sizes adjusted for publication bias was also not significant (see Table 5 and supplementary information). In the subgroup analyses, we found that waitlist control groups resulted in significantly larger effect sizes than other control conditions (p=0.01), and studies with low risk of bias resulted in significantly lower effect sizes than other studies (p=0.04).
DISCUSSION
This is the largest meta‐analysis ever of a specific type of psychotherapy for a mental disorder, including 409 RCTs (518 comparisons) with 52,702 patients. CBT was found to be effective in depression when compared to control conditions such as usual care and waitlist, with a moderate to large effect size (g=0.79). This effect was robust in several sensitivity analyses, although it was somewhat smaller for studies with low risk of bias (g=0.60) and after adjustment for publication bias (g=0.47). CBT was still significantly effective at 6‐9 month (g=0.74) and 10‐12 month (g=0.49) follow‐up, and this was confirmed in most sensitivity analyses.
A total of 42% of patients receiving CBT responded to treatment, while the response rate was only 19% in control groups, with a NNT of 4.7 in favor of CBT. The remission rate was 36% in patients receiving CBT, compared to 15% in control conditions, with a NNT of 3.6.
Comparative trials suggest that CBT is significantly more effective than other psychotherapies, but the difference is small (g=0.06) and does not remain significant in most sensitivity analyses. The effects of CBT are comparable to those of pharmacotherapies at the short term, but CBT is significantly more effective at 6 to 12 months (g=0.34). Combined treatment is significantly more effective than pharmacotherapy alone, at the short (g=0.51) and the longer term (g=0.32), but combined treatment is not more effective than CBT alone at either time point.
Most trials examine CBT in an individual, group or guided self‐help format, and we previously showed that there are no significant differences between these formats 12 . In the current meta‐analysis, we could also include a set of trials of unguided self‐help CBT, and found that this was also effective, with a small to moderate effect size (g=0.45). CBT was also found to be effective in inpatient settings (g=0.65), as well as in children and adolescents (g=0.41).
Research on CBT has evolved over time. The quality of studies has improved, which can be seen from the increasing number of trials with low risk of bias, the decrease in the use of waitlist control groups, and the increase in sample sizes of included studies. The number of treatment sessions has significantly decreased over the years. In a meta‐regression analysis, we could not confirm that the effect size of CBT has decreased over time, as was suggested in an earlier study 37 .
The findings of this study should be considered in the light of some limitations. First, heterogeneity was high in many analyses, and subgroup and meta‐regression analyses could not identify all sources of this heterogeneity, suggesting that there are differences between trials that cannot be explained by the extracted characteristics. Second, risk of bias was high in many of the included trials, and the effect sizes of the trials with low risk of bias were significantly lower in some of the analyses. Fortunately, the number of studies was so large that we could examine outcomes in subsets of trials with low risk of bias. Finally, we found indications of publication bias in many analyses, although several findings remained robust after correcting for this bias.
We can conclude that CBT is effective in the treatment of depression with a moderate to large effect size, and that its effect is still significant up to 12 months. The superiority of CBT over other psychotherapies does not emerge clearly from this meta‐analysis. CBT appears to be as effective as pharmacotherapies at the short term, but more effective at the longer term. Combined treatment appears to be superior to pharmacotherapy alone but not to CBT alone. The efficacy of CBT in depression is documented across different delivery formats, ages, target groups, and settings.
ACKNOWLEDGEMENTS
Supplementary information on this study is available at http://osf.io/a6p3w.
REFERENCES
- 1. World Health Organization . World mental health report: transforming mental health for all. Geneva: World Health Organization, 2022. [Google Scholar]
- 2. Herrman H, Patel V, Kieling C et al. Time for united action on depression: a Lancet‐World Psychiatric Association Commission. Lancet 2022;399:957‐1022. [DOI] [PubMed] [Google Scholar]
- 3. Cuijpers P, Vogelzangs N, Twisk J et al. Comprehensive meta‐analysis of excess mortality in depression in the general community versus patients with specific illnesses. Am J Psychiatry 2014;171:453‐62. [DOI] [PubMed] [Google Scholar]
- 4. Chisholm D, Sweeny K, Sheehan P et al. Scaling‐up treatment of depression and anxiety: a global return on investment analysis. Lancet Psychiatry 2016;3:415‐24. [DOI] [PubMed] [Google Scholar]
- 5. Cipriani A, Furukawa TA, Salanti G et al. Comparative efficacy and acceptability of 21 antidepressant drugs for the acute treatment of adults with major depressive disorder: a systematic review and network meta‐analysis. Lancet 2018;391:1357‐66. [DOI] [PMC free article] [PubMed] [Google Scholar]
- 6. Cuijpers P, Quero S, Noma H et al. Psychotherapies for depression: a network meta‐analysis covering efficacy, acceptability and long‐term outcomes of all main treatment types. World Psychiatry 2021;20:283‐93. [DOI] [PMC free article] [PubMed] [Google Scholar]
- 7. Cuijpers P, Karyotaki E, de Wit L et al. The effects of fifteen evidence‐supported therapies for adult depression: a meta‐analytic review. Psychother Res 2020;30:279‐93. [DOI] [PubMed] [Google Scholar]
- 8. Cuijpers P, Berking M, Andersson G et al. A meta‐analysis of cognitive behavior therapy for adult depression, alone and in comparison to other treatments. Can J Psychiatry 2013;58:376‐85. [DOI] [PubMed] [Google Scholar]
- 9. Cuijpers P, Noma H, Karyotaki E et al. A network meta‐analysis of the effects of psychotherapies, pharmacotherapies and their combination in the treatment of adult depression. World Psychiatry 2020;19:92‐107. [DOI] [PMC free article] [PubMed] [Google Scholar]
- 10. Cuijpers P, Karyotaki E. A meta‐analytic database of randomised trials on psychotherapies for depression. 10.17605/OSF.IO/825C6. [DOI]
- 11. Cuijpers P, van Straten A, Andersson G et al. Psychotherapy for depression in adults: a meta‐analysis of comparative outcome studies. J Consult Clin Psychol 2008;76:909‐22. [DOI] [PubMed] [Google Scholar]
- 12. Cuijpers P, Noma H, Karyotaki E et al. Effectiveness and acceptability of cognitive behavior therapy delivery formats in adults with depression: a network meta‐analysis. JAMA Psychiatry 2019;76:700‐7. [DOI] [PMC free article] [PubMed] [Google Scholar]
- 13. Cuijpers P, Ciharova M, Miguel C et al. Psychological treatment of depression in institutional settings: a meta‐analytic review. J Affect Disord 2021;286:340‐50. [DOI] [PubMed] [Google Scholar]
- 14. Higgins JPT, Altman DG, Gøtzsche PC et al. The Cochrane Collaboration's tool for assessing risk of bias in randomised trials. BMJ 2011;343:d5928. [DOI] [PMC free article] [PubMed] [Google Scholar]
- 15. Sterne JAC, Savovic J, Page MJ et al. RoB 2: a revised tool for assessing risk of bias in randomised trials. BMJ 2019;366:l4898. [DOI] [PubMed] [Google Scholar]
- 16. Hedges LV, Olkin I. Statistical methods for meta‐analysis. San Diego: Academic Press, 1985. [Google Scholar]
- 17. Harrer M, Kuper P, Cuijpers P. metapsyTools: several R helper functions for the “metapsy” database. R package version 0.3.2, 2022. https://tools.metapsy.org.
- 18. Balduzzi S, Rücker G, Schwarzer G. How to perform a meta‐analysis with r: a practical tutorial. Evid Based Ment Health 2019;22:153‐60. [DOI] [PMC free article] [PubMed] [Google Scholar]
- 19. Viechtbauer W. Conducting meta‐analyses in r with the metafor package. J Statist Softw 2010;36:1‐48. [Google Scholar]
- 20. Harrer M, Cuijpers P, Furukawa T et al. dmetar: companion R package for the guide ‘doing meta‐analysis in R’. R package version 0.0.9000. http://dmetar.protectlab.org.
- 21. Pustejovsky JE, Tipton E. Meta‐analysis with robust variance estimation: expanding the range of working models. Prev Sci 2022;23:425‐38. [DOI] [PubMed] [Google Scholar]
- 22. Viechtbauer W, Cheung MWL. Outlier and influence diagnostics for meta‐analysis. Res Synth Meth 2010;1:112‐25. [DOI] [PubMed] [Google Scholar]
- 23. Maier M, VanderWeele TJ, Mathur MB. Using selection models to assess sensitivity to publication bias: a tutorial and call for more routine use. Campbell Syst Rev 2022;18:e1256. [DOI] [PMC free article] [PubMed] [Google Scholar]
- 24. Duval S, Tweedie R. Trim and fill: a simple funnel‐plot‐based method of testing and adjusting for publication bias in meta‐analysis. Biometrics 2000;56:455‐63. [DOI] [PubMed] [Google Scholar]
- 25. Rücker G, Schwarzer G, Carpenter JR et al. Treatment‐effect estimates adjusted for small‐study effects via a limit meta‐analysis. Biostatistics 2011;12:122‐42. [DOI] [PubMed] [Google Scholar]
- 26. McShane BB, Böckenholt U, Hansen KT. Adjusting for publication bias in meta‐analysis: an evaluation of selection methods and some cautionary notes. Perspect Psychol Sci 2016;11:730‐49. [DOI] [PubMed] [Google Scholar]
- 27. Carter EC, Schönbrodt FD, Gervais WM et al. Correcting for bias in psychology: a comparison of meta‐analytic methods. Adv Meth Pract Psychol Sci 2019;2:115‐44. [Google Scholar]
- 28. IntHout J, Ioannidis JP, Borm GF. The Hartung‐Knapp‐Sidik‐Jonkman method for random effects meta‐analysis is straightforward and considerably outperforms the standard DerSimonian‐Laird method. BMC Med Res Methodol 2014;14:25. [DOI] [PMC free article] [PubMed] [Google Scholar]
- 29. Higgins JPT, Thompson SG, Deeks J et al. Measuring inconsistency in meta‐analyses. BMJ 2003; 327:557‐60. [DOI] [PMC free article] [PubMed] [Google Scholar]
- 30. Cheung MWL. Modeling dependent effect sizes with three‐level meta‐analyses: a structural equation modeling approach. Psychol Methods 2014;19:211‐29. [DOI] [PubMed] [Google Scholar]
- 31. Borenstein M, Hedges LV, Higgins JPT et al. Introduction to meta‐analysis. Chichester: Wiley, 2009. [Google Scholar]
- 32. Borenstein M, Higgins JPT, Hedges LV et al. Basics of meta‐analysis: I2 is not an absolute measure of heterogeneity. Res Syn Meth 2017;8:5‐18. [DOI] [PubMed] [Google Scholar]
- 33. Furukawa TA. From effect size into number needed to treat. Lancet 1999;353:1680. [DOI] [PubMed] [Google Scholar]
- 34. Cuijpers P, Karyotaki E, Ciharova M et al. The effects of psychotherapies for depression on response, remission, reliable change, and deterioration: a meta‐analysis. Acta Psychiatr Scand 2021;144:288‐99. [DOI] [PMC free article] [PubMed] [Google Scholar]
- 35. Furukawa TA, Cipriani A, Barbui C et al. Imputing response rates from means and standard deviations in metaanalyses. Int Clin Psychopharmacol 2005;20:49‐52. [DOI] [PubMed] [Google Scholar]
- 36. Frank E, Prien RF, Jarrett RB et al. Conceptualization and rationale for consensus definitions of terms in major depressive disorder: remission, recovery, relapse, and recurrence. Arch Gen Psychiatry 1991;48:851‐5. [DOI] [PubMed] [Google Scholar]
- 37. Johnsen TJ, Friborg O. The effects of cognitive behavioral therapy as an anti‐depressive treatment is falling: a meta‐analysis. Psychol Bull 2015;141:747‐68. [DOI] [PubMed] [Google Scholar]