Abstract
The stochastic activity of neurons is caused by various sources of correlated fluctuations and can be described in terms of simplified, yet biophysically grounded, integrate-and-fire models. One paradigmatic model is the quadratic integrate-and-fire model and its equivalent phase description by the theta neuron. Here we study the theta neuron model driven by a correlated Ornstein-Uhlenbeck noise and by periodic stimuli. We apply the matrix-continued-fraction method to the associated Fokker-Planck equation to develop an efficient numerical scheme to determine the stationary firing rate as well as the stimulus-induced modulation of the instantaneous firing rate. For the stationary case, we identify the conditions under which the firing rate decreases or increases by the effect of the colored noise and compare our results to existing analytical approximations for limit cases. For an additional periodic signal we demonstrate how the linear and nonlinear response terms can be computed and report resonant behavior for some of them. We extend the method to the case of two periodic signals, generally with incommensurable frequencies, and present a particular case for which a strong mixed response to both signals is observed, i.e. where the response to the sum of signals differs significantly from the sum of responses to the single signals. We provide Python code for our computational method: https://github.com/jannikfranzen/theta_neuron.
Keywords: Neuron model, Spike train variability, Neural signal transmission, Stochastic neuron model
Introduction
Neural spiking is a random process due to the presence of multiple sources of noise. This includes the quasi-random input received by a neuron which is embedded in a recurrent network (network noise), the unreliability of the synapses (synaptic noise), and the stochastic opening and closing of ion channels (channel noise) (Gabbiani & Cox, 2017; Koch, 1999). This stochasticity and the resulting response variability is a central feature of neural spiking (Holden, 1976; Tuckwell, 1989). Therefore, studies in computational neuroscience have to account for this stochasticity as it has important implication for the signal transmission properties.
Computational studies of stochastic neuron models often assume that the driving fluctuations are temporally uncorrelated. This white-noise assumption implies that the correlation time of the input fluctuations is much smaller than the time scale of the membrane potential . Put differently, the input noise is regarded as fast compared to every other process present in the neural system. This assumption grants a far-reaching mathematical tractability of the problem (Abbott & van Vreeswijk, 1993; Brunel, 2000; Burkitt, 2006; Holden, 1976; Lindner & Schimansky-Geier, 2001; Ricciardi, 1977; Richardson, 2004; Tuckwell, 1989) but is violated in a number of interesting cases. First, fluctuations that arise in a recurrent network often exhibit reduced power at low frequencies (green noise) (Bair et al., 1994; Câteau & Reyes, 2006; Pena et al., 2018; Vellmer & Lindner, 2019). Second, fluctuations in oscillatory systems, e.g. caused by the electroreceptor of the paddlefish, can be band-pass filtered (Bauermeister et al., 2013; Neiman & Russell, 2001). Finally and most prominently, fluctuations that emerge due to synaptic filtering of postsynaptic potentials (Brunel & Sergi, 1998; Lindner, 2004; Lindner & Longtin, 2006 Moreno-Bote & Parga, 2010; Rudolph & Destexhe, 2005) or due to slow ion channel kinetics (Fisch et al., 2012; Schwalger et al., 2010), have reduced power at high frequencies (red noise).
There are two important types of neuron models with distinct responses characteristics: Integrators (type I neurons) and resonators (type II neurons) (Izhikevich, 2007). The canonical model for a type I neuron is the quadratic integrate-and-fire model or, mathematically equivalent, in terms of a phase variable, the theta neuron. Here we study the response characteristics of the theta neuron, driven by a low-pass filtered noise, the Ornstein-Uhlenbeck (OU) process. This model has been studied analytically by Brunel and Latham (2003) for the limits of very short and very long correlation times. Furthermore, Naundorf et al. (2005a, b) solved the associated Fokker-Planck equation for the voltage and the noise variable for selected parameter sets in order to obtain the stationary firing rate and the firing rate’s linear response to a weak periodic stimulus.
Here, we put forward semi-analytical results for the stationary firing rate by means of the matrix-continued-fraction (MCF) method for arbitrary ratios of the two relevant time scales . We present exhaustive parameter scans of the stationary firing rate with respect to variations of the bifurcation parameter and the correlation time. Furthermore, our method also allows to calculate how a, not necessarily weak, periodic signal in the presence of a correlated background noise is encoded in the firing-rate of the model neuron. Because recently, non-weak signals, for which the linear response does not provide a good approximation to the firing rate, have attracted attention (Novikov & Gutkin, 2020; Ostojic & Brunel, 2011; Voronenko & Lindner, 2017, 2018), we also develop semi-analytical tools for the linear as well as the non-linear response of the firing rate to one or two periodic signals. To the best of our knowledge, this is the first application of the MCF method in computational neuroscience.
This paper is organized as follows. In Sect. 2 we introduce the model system and the associated Fokker-Planck equation. In Sect. 3 we compute the stationary firing rate of a theta neuron subject to correlated noise by means of the MCF method. Section 4 generalizes the ideas of the MCF method to the case where the model is driven by the OU noise and an additional periodic signal. Finally, in Sect. 4.3 we compute the firing rate response to two periodic signals. We conclude with a short summary of our results.
Model
The quadratic integrate-and-fire (QIF) model uses the normal form of a saddle-node on invariant circle (SNIC) bifurcation (Izhikevich, 2007) with a time-dependent input :
| 1 |
In order to make the connection to physical time units transparent, we have kept on the l.h.s. a time constant, which is of the order of the membrane time 1, typically 10ms. In the following however for the ease of notation we use a nondimensional time , i.e. we measure time as well as any other time constants, e.g. the correlation time below, in multiples of the membrane time constant. Similarly, all frequencies and firing rates are given in multiples of the inverse membrane time constant (additional rescalings are considered below, see e.g. Eqs. (7) and (10)).
In the new nondimensional time the QIF model takes the usual form:
| 2 |
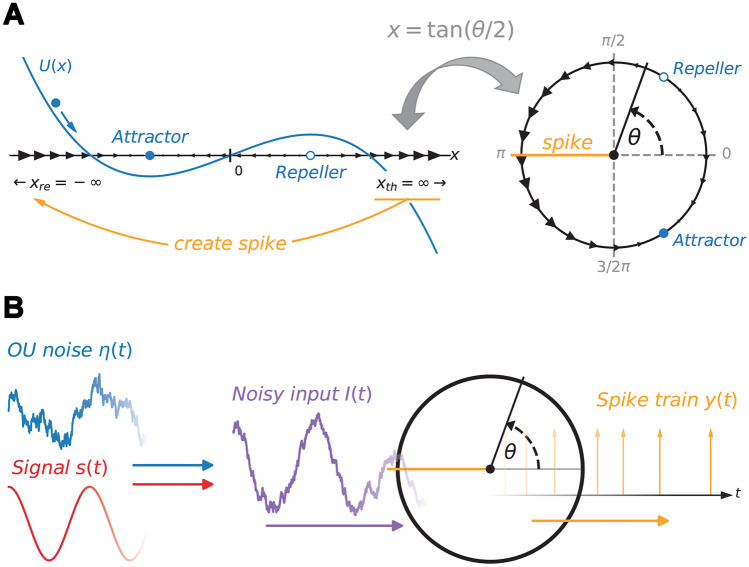
If the variable x(t) reaches the threshold , a spike is created at time and x(t) is immediately reset to . If the input is assumed to be constant it can serve as a bifurcation parameter and allows the model to switch between the excitable () and mean-driven regime (). The model for is illustrated in Fig. 1A, including the stable and unstable fixed point at as well as the reset. The QIF model can be transformed into the theta neuron by the transformation (cf., Fig. 1A):
| 3 |
Fig. 1.
Type-I neuron model. A Representation of the deterministic QIF and the equivalent theta neuron model. The blue line shows the QIF models potential in the excitable regime (). Upon reaching the threshold a spike is created and x is reset to . For the equivalent theta neuron model, obtained by the transformation , a spike is created whenever passes , no additional reset rule is needed. B Illustration of a theta neuron subject to a temporally correlated OU noise (blue) as well as a periodic signal (red) and the resulting spike train with stochastic spike times (orange)
The advantage of such a phase description is, that the threshold and reset lie at finite values. We will use this phase description of a canonical Type I neuron in the remainder of this paper.
We assume that the input I(t) consists of three parts:
| 4 |
| 5 |
a constant mean input , a temporally correlated noise and a periodic signal s(t) (see Fig. 1B). Note that the temporal average of the input is only affected by because the temporal averages are set to and without loss of generality. The correlated noise is given by an Ornstein-Uhlenbeck process with auto-correlation function and correlation time ; it can be generated by an extra stochastic differential equation, a trick from statistical physics known as Markovian embedding of a colored noise (see e.g. Dygas et al., 1986; Guardia et al., 1984; Langer, 1969; Mori, 1965; Siegle et al., 2010, and the review by Hänggi & Jung, 1995). We remind the reader that the correlation time is given in terms of the membrane time constant, i.e. is actually the ratio between the true correlation time (given for instance in ms) and the membrane time . In the limit the noise becomes uncorrelated, i.e. white. However, if the variance is held constant, as in Eq. (5), the effect of the noise on the neuron vanishes together with the correlation time. A non-trivial white-noise limit can be more properly described in terms of the noise intensity ; if D is held constant, the noise still affects the dynamics for vanishing correlation times. For such a constant intensity scaling the effect of the noise vanishes as .
For the system shows spontaneous spiking (not related to any signal). In this case the parameter space is three-dimensional, i.e. all statistics depend only on . This dependence however can be reduced to just two independent parameters () defined by
| 6 |
This transformation also affects the phase and time in Eq. (3) and consequently rescales the firing rate
| 7 |
Under an additional periodic driving the signal will be rescaled as well: with
| 8 |
For several periodic signals the respective amplitudes and frequencies will be rescaled in the same manner.
For the constant intensity scaling we use a similar transformation and set :
| 9 |
again, the state variables are affected by this scaling as well: and . The firing rates in the scaled and unscaled parameter space are related by
| 10 |
We make use of these scalings in the discussion of the results. For the ease of notation, we omit the hat and tilde over the parameters.
The Fokker-Planck equation
The stochastic system of interest can be written by two Langevin equations
| 11 |
| 12 |
where . The relation to the governing equation for the probability density function (PDF) is the well known Fokker-Planck equation (FPE) (Risken, 1984). The PDF denotes the probability to find the phase and noise at time t around certain values. In the neural context the PDF can be related to the instantaneous firing rate r(t) (see for instance Brunel & Sergi, 1998; Naundorf et al., 2005a, b, and Moreno-Bote & Parga, 2010) as we recall in the following. The FPE is given by:
| 13 |
| 14 |
The two dimensional partial differential equation is completed by two natural boundary conditions
| 15 |
a periodic boundary condition
| 16 |
and the normalization condition
| 17 |
There is a corresponding continuity equation that relates the temporal derivative of the PDF to the spatial derivative of the probability current:
| 18 |
where and are the probability currents in the and direction, respectively:
| 19 |
| 20 |
An important insight is that the probability current in the phase direction at the threshold is directly related to the instantaneous firing rate r(t):
| 21 |
In the last equality we have used that the dynamics of the theta neuron becomes independent of the input at the threshold; specifically, we have .
The solution of the two-dimensional Fokker-Planck equation and the boundary conditions listed above is a difficult problem, even in the simplest case of the (time-independent) stationary solution in the absence of a periodic stimulus. Different authors have proposed approximate solutions in limit cases, e.g. for the case of very slow or very fast Ornstein-Uhlenbeck noise (Brunel & Latham, 2003), for weak noise in the mean-driven regime (Galán, 2009; Zhou et al., 2013), or, in the case of a periodic modulation of the firing rate, for very low or very high stimulus frequencies (Fourcaud-Trocmé et al., 2003). A numerical method to solve the two-dimensional Fokker-Planck equation in terms of an eigenfunction expansion was presented by Naundorf et al. (2005a, b); similar approaches have been pursued to describe two one-dimensional white-noise driven neuron models either coupled directly (Ly & Ermentrout, 2009) or subject to a shared input noise (Deniz & Rotter, 2017). Eigenfunction expansions have also been used to describe the activity in neural populations and neural networks, see e.g. Knight (2000) and Doiron et al. (2006). Turning back to the problem of single-neuron models, beyond the theta neuron, different approximations to the multi-dimensional Fokker-Planck equation for neuron models with Ornstein-Uhlenbeck noise have been suggested for the perfect integrate-and-fire model (Fourcaud & Brunel, 2002; Lindner, 2004; Schwalger et al., 2010, 2015) and for the leaky integrate-and-fire model (Alijani & Richardson, 2011; Brunel & Sergi, 1998; Brunel et al., 2001; Moreno et al., 2002; Moreno-Bote & Parga, 2004, 2006, 2010; Schuecker et al., 2015; Schwalger & Schimansky-Geier, 2008). We note that with respect to the driving noise, the related simpler case of an exponentially correlated two-state (dichotomous) noise permits the exact analytical solution for a few statistical measures such as the firing rate and stationary voltage distribution (Droste & Lindner, 2014; Müller-Hansen et al., 2015), the power spectrum and linear response function (Droste & Lindner, 2017), and the serial correlation coefficient of the interspike intervals (Lindner, 2004; Müller-Hansen et al., 2015).
Stationary firing rate
If we consider a system that is subject to a temporally correlated noise but no external signal () then the probability density asymptotically approaches a stationary distribution which is what we consider now. The FPE for this stationary distribution reads
| 22 |
with the stationary Fokker-Planck operator . Once the stationary probability density is known it can be used to obtain the stationary firing rate . Alternatively to Eq. (21) one can calculate the firing rate by
| 23 |
where denotes the component of the probability current in the direction of the phase for . To see how to arrive at this equation, we take the stationary case of Eq. (18) and integrate it over all values of . The integral term vanishes because of the natural boundary conditions and it follows that . Consequently the integrated current does not depend on and is everywhere equal to the firing rate. An additional integration over , yielding the factor , leads to Eq. (23).
The MCF method
In the previous section it was shown that the stationary probability density is interesting on its own because it is directly related to the stationary firing rate. Here we outline the core ideas and assumptions that are necessary to compute the stationary PDF by means of the matrix-continued-fraction method, which has been put forward by Risken (1984).
As a first step, the stationary probability density is expanded with respect to the phase and noise by two sets of eigenfunctions, namely the complex exponential functions and Hermite functions (see Bartussek, 1997 for a similar choice):
| 24 |
Note, that because is real. Thus, we must only determine the expansion coefficients for . Both sets satisfy the periodic and natural boundary conditions in and , respectively. A first application of this result is the determination of the marginal probability density by
| 25 |
which is illustrated for different values of and in Fig. 2. The stationary firing rate is conveniently expressed by only two of the coefficients,
| 26 |
Fig. 2.
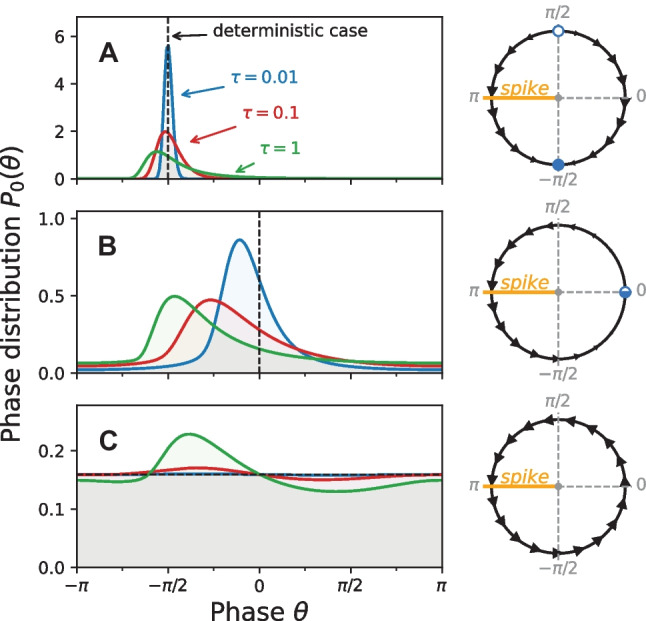
Stationary phase distribution of the theta neuron in the excitable regime (, A), at the bifurcation point (, B) and in the mean-driven regime (, C). Dynamics of the corresponding deterministic systems are shown at the right. For the phase distributions the variance of the OU noise is held constant at while the correlation time varies as shown in A. For the effect of the noise vanishes, i.e. the model becomes deterministic. The distributions have been calculated using the MCF method. Parameters MCF method:
This expression can be derived by inserting the expansion into Eq. (23) and using the properties of the coefficients and eigenfunctions, in particular (80) and (81) of the Hermite functions.
The coefficients can be determined by a substitution of the expansion Eq. (24) into the stationary FPE (22) which yields the tridiagonal recurrence relation, see Appendix A:
| 27 |
with the coefficient vectors and . The matrix is given by
| 28 |
where is the identity matrix and , are defined by
| 29 |
| 30 |
Solving Eq. (27) for is difficult because the matrices are infinite and the equation constitutes a relation between three unknown. As a first step to find the coefficients, one can truncate the expansion in Eq. 24 to obtain finite matrices. In practice, we assume that all Hermite functions and Fourier modes become negligible for large p or n, so that the corresponding coefficients vanish2 for or . To solve the second problem (of having three unknowns), we define transition matrices by
| 31 |
which upon insertion into Eq. (27) yield:
| 32 |
For any coefficient vectors this equation is satisfied provided the term in square brackets vanishes. The relation between the two unknown transition matrices can be expressed by:
| 33 |
and leads by recursive insertion to an infinite matrix continued fraction
| 34 |
where denotes the inverse of a matrix. This fraction is truncated after . The matrix determines the following coefficients via Eq. (31):
| 35 |
which are needed for the computation of the firing rate according to Eq. (26).
Constant variance scaling
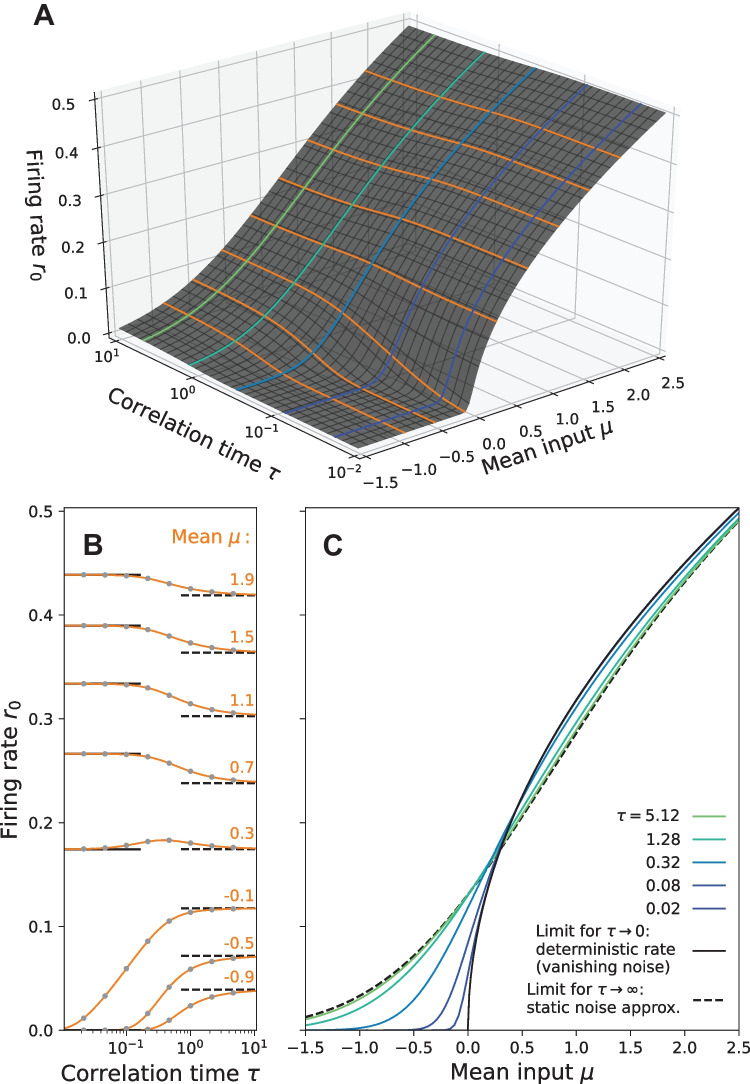
The MCF method provides a fast computational method to determine the stationary firing rate in a large part of the parameter space. Together with different analytical approximations it is possible to cover the complete dependence of on the parameters , and . In the following figures, we additionally verify the MCF results by comparison to numerical simulations of Eq. (11) using a Euler-Maruyama scheme with time step for trials of length . For more details see the repository. In Fig. 3 we use the constant variance scaling (see Sect. 2) with . A different choice for would result in a rescaling of the axes according to Eq. (6). As depicted in Fig. 3B, for short as well as large correlation times, the firing rate approaches limit values indicated by the horizontal lines. For , the effect of the correlated noise vanishes so that the short time limit is equal to the deterministic firing rate
| 36 |
where is the Heaviside function. In the case , the noise causes a slow modulation of the firing rate; computing the long-correlation-time limit then corresponds to averaging the deterministic firing rate over the distribution of the noise (quasi-static noise approximation, see Moreno-Bote & Parga, 2010)
| 37 |
Fig. 3.
Stationary firing rate in the constant variance scaling () for different values of and . Contour lines from A are shown again in B and C. Interestingly, the firing rate of the theta neuron can increase, decrease and even exhibit non-monotonic behavior with respect to the correlation time of the OU noise as shown in B. Calculations by the MCF Method are confirmed by stochastic simulations (gray dots). Parameters MCF method:
We recall that for a QIF model driven by white noise the firing rate is always larger than the deterministic rate (Lindner et al., 2003). In contrast, a colored noise may decrease the firing rate (Brunel & Latham, 2003; Galán, 2009) as shown in Fig. 3. For large correlation times, the decrease in the firing rate is a direct consequence of the concave curvature of the deterministic firing rate at large as illustrated in Fig. 4. This can be understood as follows. If we take the linear approximation of the deterministic rate around the operation point then, not surprisingly, with a symmetric input distribution of the noise, the averaging yields the deterministic firing rate at the operation point:
| 38 |
Fig. 4.
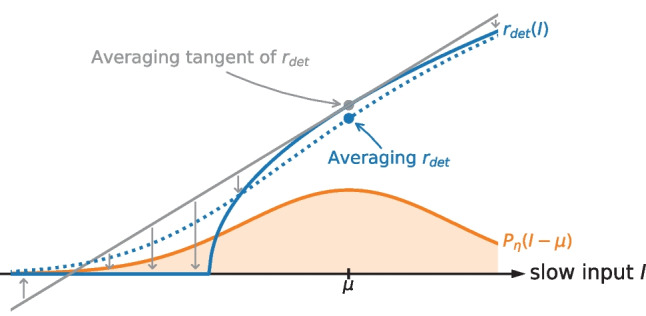
Mechanism for the firing rate reduction. The decrease of the firing rate due to strongly correlated noise in the mean-driven regime is a consequence of the concave curvature of the deterministic firing rate . For large the firing rate can be approximated by averaging the deterministic firing rate over the noise distribution according to Eq. (37), this yields the blue point on the dashed line
In the relevant range the underlined term is larger than the function in Eq. (37) as it can be seen from Fig. 4. Consequently, the resulting integral in Eq. (38) (i.e. the deterministic firing rate) is larger than the actual firing rate in the long-correlation-time limit, Eq. (37). This is the mechanism by which a colored noise can reduce the firing rate in the mean-driven regime.
For weak noise in the mean-driven regime () this drop in the firing rate can be calculated analytically as done by Galán (2009). The formula requires the phase response curve (PRC) of the theta neuron, which is well known (Ermentrout, 1996), resulting in the following compact expression for the firing rate:
| 39 |
(please note the transition from cyclic frequencies used in Galán, 2009 to firing rates). The formula predicts clearly a reduction of the firing rate by colored noise; specifically, decreases monotonically with increasing correlation times. It should be noted, however, that in the strongly mean-driven regime, in which this theory is valid, the changes in the firing rate are very small (see Fig. 5A, B). If the driving is less strong and deviations of the firing rate from are more pronounced, the theory according to Eq. (39) no longer provides a good approximation, (see Fig. 5C).
Fig. 5.
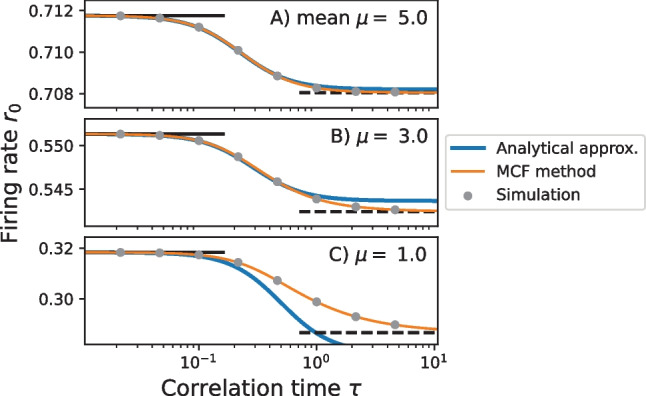
Decrease of the firing rate with respect to the correlation time at fixed variance . Analytical approximations according to Eq. (39) (blue line) are compared to the firing rate obtained by the MCF method (orange line) and again verified by stochastic simulations (gray dots). Parameters MCF method:
Is at least the qualitative prediction of an overall rate reduction due to correlated noise correct? To answer this question, we plot in Fig. 6 the difference between the firing rate and the deterministic limit for a broad of correlation times and inputs . This difference can be both positive and negative. Trivially, in the excitable regime () the firing rate in the presence can only be larger than the vanishing deterministic rate (here ). In the mean-driven regime the changes can be both positive (for sufficiently small ) and negative (for larger ); the exact line of separation is displayed by a solid line in Fig. 6.
Fig. 6.
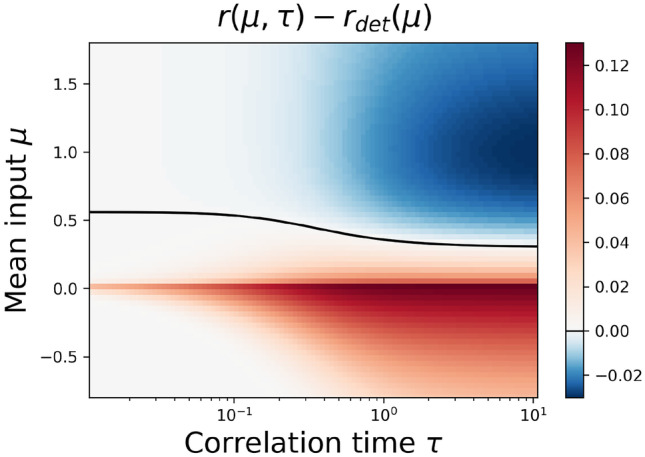
Comparison between the firing rate and the deterministic rate. Difference between and the deterministic firing rate for . As expected, in the excitable regime () the firing rate of the stochastic system is increased compared to the deterministic rate. For the mean-driven regime () the firing rate can be both increase or decreased depending on the particular value of both and . Parameters MCF method:
Constant intensity scaling
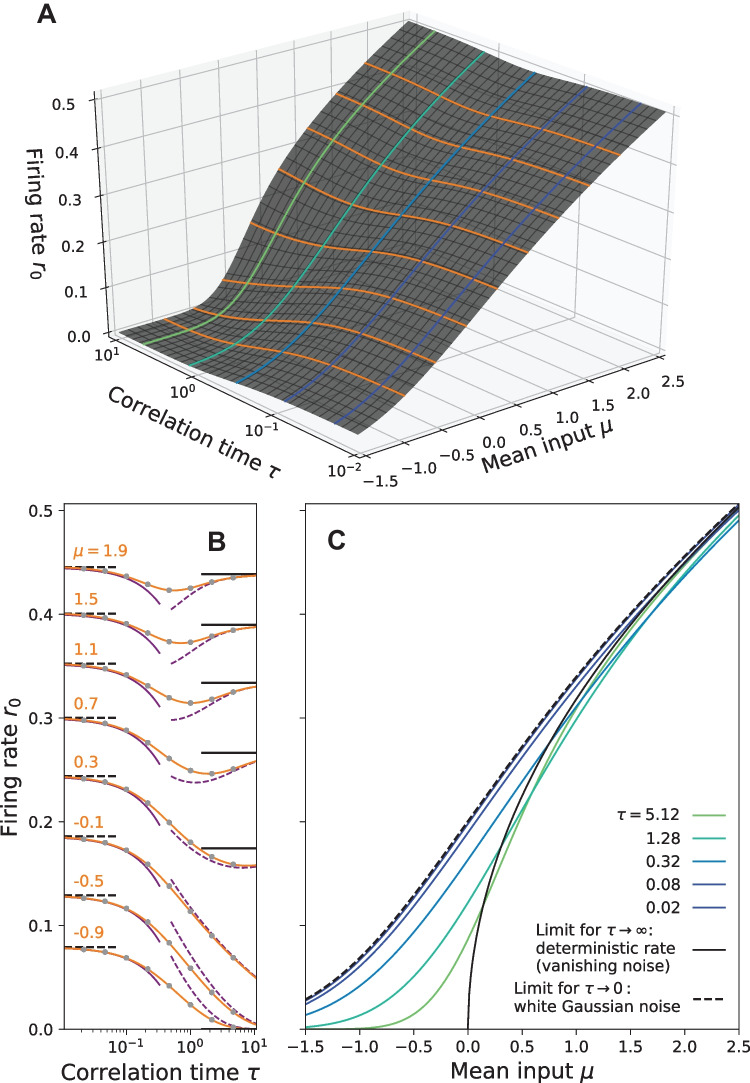
Instead of a constant variance, we can also keep the noise intensity fixed (). The corresponding stationary firing rate as a function of and is shown in Fig. 7A. One advantage of the constant-intensity scaling is that it permits a non-trivial white noise limit (), displayed in Fig. 7B, C by the dashed lines (Brunel & Latham, 2003). In the opposite limit of a long correlation time the noise variance vanishes, which implies that approaches the deterministic rate.
Fig. 7.
Stationary firing rate in the constant intensity scaling () for different values of and . Contour lines from A are shown again in B and C. Interestingly, the firing rate is always smaller than the corresponding white noise limit (dashed line) and can show non-monotonic behavior with a minimum depending on and , see B. Here, known analytical approximations by Fourcaud-Trocmé et al. (2003) (solid purple lines) and Moreno-Bote and Parga (2010) (dashed purple lines) are compared to calculations by the MCF Method (orange lines). Parameters MCF method:
Remarkably, for a sufficiently strong mean input current , the rate attains a minimum at intermediate correlation times. Considering the long as well as the short correlation-time approximation by Moreno-Bote and Parga (2010) (see our Eq. (37)) and Brunel and Latham (2003) (see Eq. (3.19) therein), respectively, this behavior can be expected. Generally, we find that the firing rate for any is smaller than the white-noise limit.
Response to periodic stimulus
In the previous section we have considered a theta neuron with an input current I(t) that consisted of a constant input and a colored noise . We now turn to a more general case that involves an additional periodic signal
| 40 |
as illustrated in Fig. 8A and demonstrate how the MCF method can be used to compute the response of the firing rate.
Fig. 8.
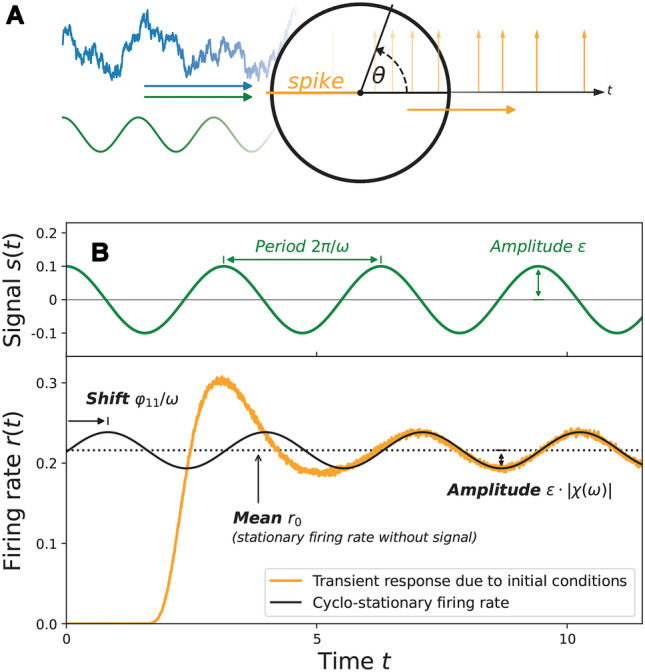
Cyclo-stationary firing rate. A Illustration of a theta neuron model subject to a temporally correlated OU noise and a periodic signal. B The firing rate (orange line; simulation) approaches a cyclo-stationary state (black line; MCF method) due to the periodicity of the signal (green line). In the linear regime the firing rate is well approximated by . Parameters: , , , , and . The cyclo-stationary firing rate was calculated by the MCF method with . Simulation parameters: In this figure, the number of realizations was up-scaled to for visual purposes. For all realizations, the initial values are and
We consider the time-dependent signal s(t) as a perturbation with amplitude . The respective FPE can be expressed by the stationary Fokker-Planck operator as defined in the last section and an additional term that represents the effect of the periodic signal:
| 41 |
with . As a result of the periodic forcing, we can no longer expect that the probability density converges to a stationary distribution; instead the probability density approaches a so called cyclo-stationary state with period :
| 42 |
Since this distribution fully determines the asymptotic firing rate, this implies for the latter .
To determine the cyclo-stationary PDF we again use a twofold expansion, first a Fourier expansion that reflects the periodic nature of the signal and second a Taylor expansion with respect to the small amplitude of the periodic signal :
| 43 |
Note that because is real. The expansion Eq. (43) can be substituted into Eq. (41) to obtain a system of coupled differential equations that are no longer time dependent and can be solved iteratively with respect to :
| 44 |
with . The normalization of the probability density provides additional conditions for these functions:
| 45 |
Here is the Kronecker delta. Clearly, is the stationary probability density. This system of coupled differential equations Eq. (44) can be solved iteratively (). Notice that whenever is governed by a homogeneous differential equation, i.e. , the trivial solution does satisfy Eq. (45) and is thus a solution (except for ). Therefore, for we find that all coefficients except vanish. For we find two non-vanishing coefficients, namely and . Generally, all coefficients for and vanish (see Fig. 16). The remaining inhomogeneous differential equations can be solved by means of the MCF method (see Appendix B).
Fig. 16.
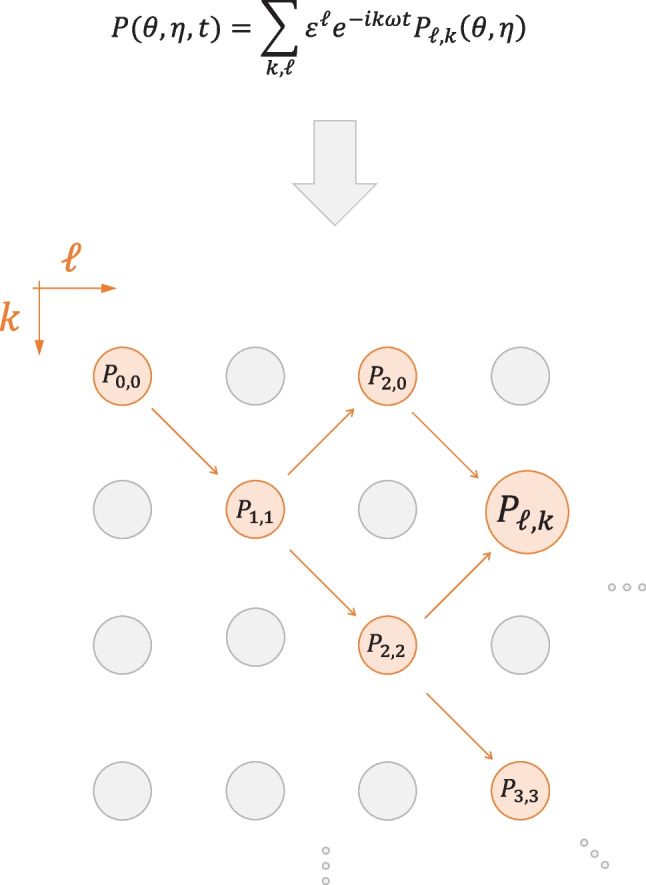
Expansion of the PDF and coupling hierarchy. If the theta neuron is subject to a periodic signal the cyclo-stationary PDF can be expanded according to Eq. (94). Inserting this ansatz into the FPE leads to a system of time-independent recursively coupled differential equations (93). The coupling hierarchy is shown here. The stationary PDF determines which in turn determines and and so on. Gray dots represent terms that vanish as explained in Sect. 4
The cyclo-stationary firing rate can now be expressed in terms of the functions using Eq. (21), exploiting the symmetry and :
| 46 |
with:
| 47 |
where arg() is the complex argument. We recover our well known stationary firing rate for , i.e. . Note that some of the terms in Eq. (46) vanish because of the underlying symmetry of the governing equations Eq. (44).
Linear response
For small the linear term in the expansion, i.e. the linear response , already provides a good approximation of the asymptotic firing rate r(t):
| 48 |
Note that all other terms vanish. The function is also commonly known as the absolute value of the susceptibility that quantifies the amplitude response of the firing rate. The phase shift with respect to the signal is described by . An exemplary signal s(t) together with the linear response, given in terms of the amplitude and phase shift, is shown in Fig. 8. For the chosen small signal amplitude , the linear theory indeed captures very well the cyclo-stationary part of the firing rate. There is also a transient response due to the chosen initial condition of the ensemble, here we however focus solely on the cyclo-stationary response.
Before we discuss the rate modulation with respect to different parameters, we compare our numerical results against known approximations (Fourcaud-Trocmé et al., 2003) (see Fig. 9). First we verify the low frequency limit . In this case the signal s(t) is slow and can be considered as a quasi-constant input. Expanding the firing rate with respect to the signal amplitude yields:
| 49 |
Fig. 9.
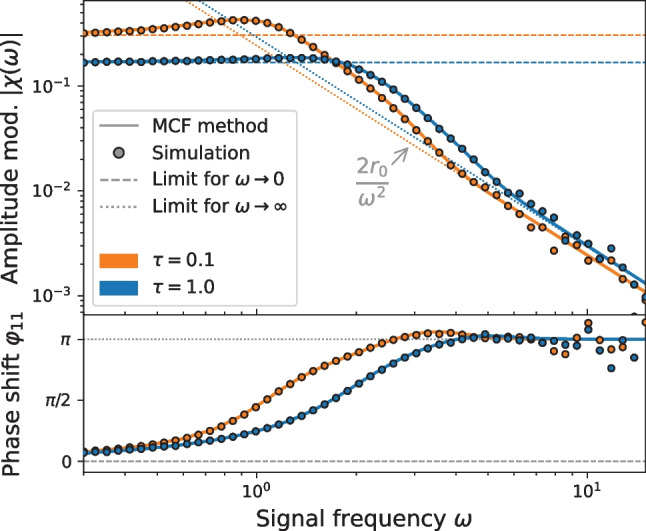
Susceptibility and phase shift. The absolute value of the susceptibility and phase shift are computed by the MCF method for two different correlation times . The results are confirmed by stochastic simulations and compared to known limit cases for and according Eqs. (50) and (51), respectively. Parameters: , . Parameters MCF method: . Simulation parameters: , and
A comparison with Eq. (48) allows to identify the low frequency limit of the susceptibility and phase shift:
| 50 |
As we can compute the firing rate for different values of (see Sect. 3), the derivative above can be calculated numerically.
Second, in the opposite limit of large frequencies , the theta neuron acts as a low-pass filter (Fourcaud-Trocmé et al., 2003):
| 51 |
Hence, the susceptibility becomes very small in the high-frequency limit which is also noticeable by the pronounced random deviations of our simulation results in this specific limit. Both limit cases are well captured by our method for two values of the correlation time () in the mean driven regime. We see that here the main effect of increasing the correlation time is to diminish the resonance of the response: For the susceptibility peaks around (note, that for small : ); this peak is gone for because the effect of the noise, keeping its variance constant, increases with . All these features are in detail confirmed by the results of stochastic simulations (symbols in Fig. 9).
The general dependence of the susceptibility, focusing on its magnitude only, is inspected in Fig. 10 for the constant variance and in Fig. 11 for the constant intensity scaling. Qualitative different behavior of can be observed between the mean-driven and excitable regime . In the mean-driven regime the theta neuron exhibits a strong resonance near that increases with decreasing effect of the noise, i.e. in the constant variance scaling the resonance becomes stronger as (see Fig. 10 top) while for the constant intensity scaling the resonance increases as , (see Fig. 11 top).
Fig. 10.
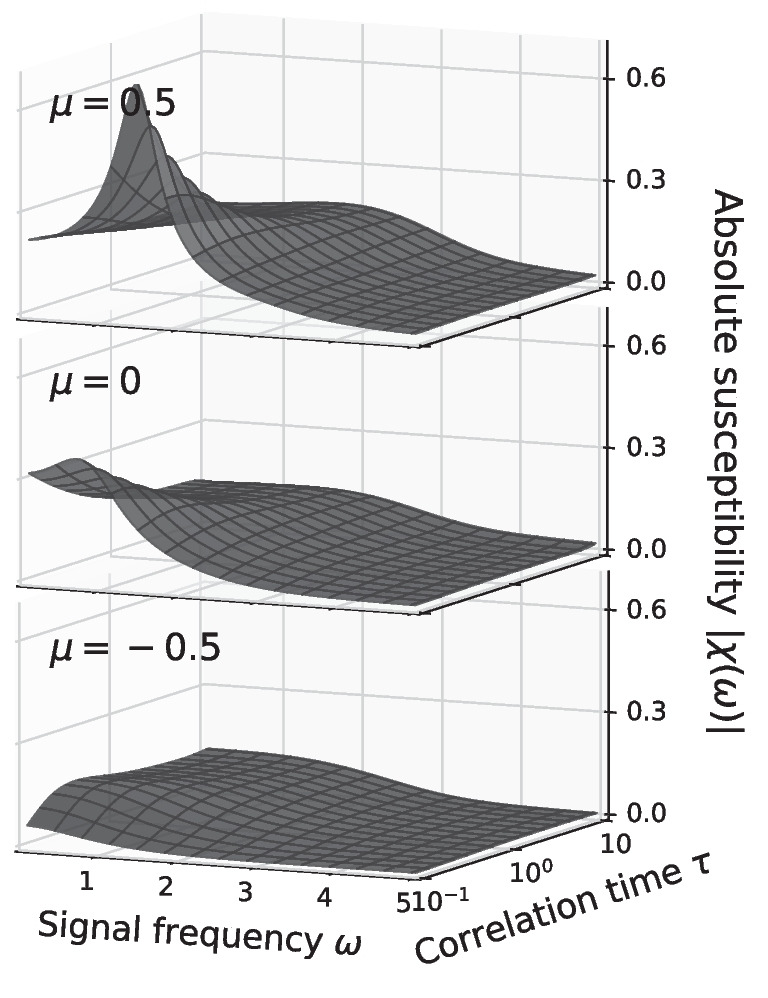
Amplitude modulation in the constant variance scaling with computed by the MCF method with . For a discussion see the main text
Fig. 11.
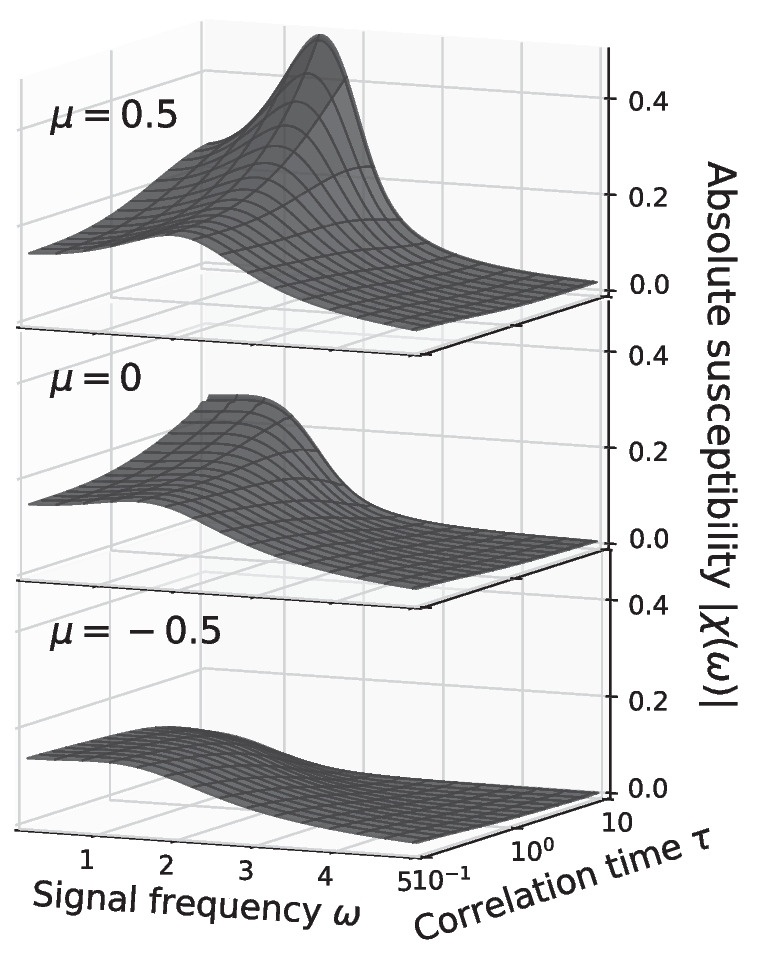
Amplitude modulation in the constant intensity scaling with computed by the MCF method with . For a discussion see the main text
In the excitable regime resonances are weak or absent. First of all, the baseline firing rate of the neuron vanishes as the effect of the noise decreases (cf. Figs. 3A and 7A) and so does the susceptibility (see Figs. 10 and 11 bottom). Secondly, the theta neuron becomes a low-pass filter where decreases with increasing regardless of the correlation time .
Right at the bifurcation point there are still no pronounced resonances with respect to . However, the dependence of the linear response on the correlation time is somewhat different to the excitable regime: the susceptibility increases if the effect of the noise becomes very weak, i.e. for the constant variance scaling (see Fig. 10 middle) and for the constant intensity scaling (see Fig. 11 middle).
Nonlinear response
For larger signal amplitudes nonlinear response functions have to be considered:
| 52 |
Here we have included all terms up to the 3rd order in (cf. Eq. (46)). The nonlinear response features higher Fourier modes and a correction of the time-averaged firing rate. The response functions and their respective argument of course depend on the model parameters , and as well as the signal frequency .
For a neuron in the mean-driven regime the frequency dependence for three selected response functions is shown in Fig. 12B. In contrast to the linear response the functions and display additional resonances for instance at . This behavior is not specific to the theta neuron, for instance such resonances can be observed for the LIF neuron as well (Voronenko & Lindner, 2017). These additional resonances give rise to strong nonlinear effects even if the signal is weak, see Fig. 12A. In the particular case shown in Fig. 12 the signal frequency was chosen to match the resonance frequency of the second-order response so that the linear response alone no longer provides a good approximation to the firing rate r(t). Instead the second-order response must be included, illustrating the importance of the nonlinear theory even for comparatively weak signals.
Fig. 12.
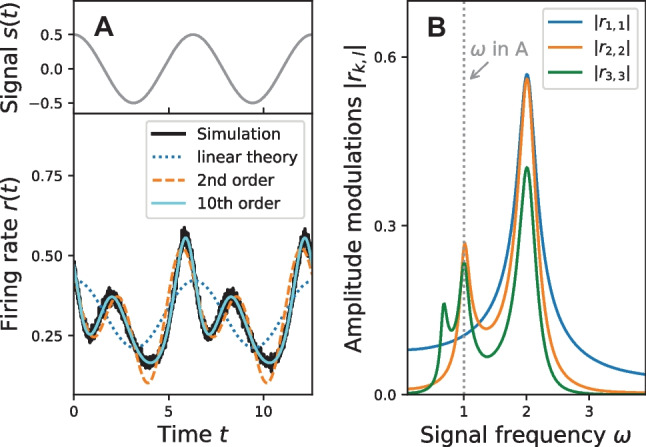
Nonlinear response. A Periodic signal and firing rate response of the theta neuron model. Here, the linear theory (dotted line) fails to accurately describe the firing rate (solid black line). This is mainly because the signal frequency is chosen to match half the deterministic firing frequency where the nonlinear response functions and are close to their local maximum, see B. However, already the second-order response (dashed orange line) provides a good approximation to the actual firing rate and is improved further if higher-order terms are considered (cyan line). All responses are calculated by the MCF method with . Parameters: , , , and
By means of the MCF method it is possible to achieve a near perfect fit of the actual firing rate by including many correction terms; see Fig. 12A where we have included all terms up to the 10th order. However, note that the computational cost of each further correcting term increases roughly linearly with the order of the signal amplitude.
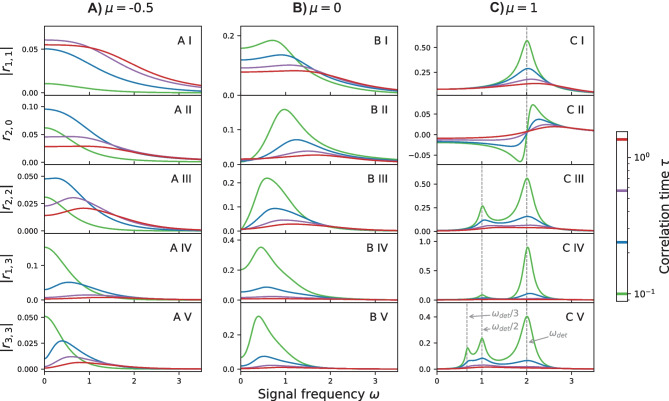
We now discuss the amplitude response functions to the third order in for varying values of the mean input and correlation time (cf. Fig. 13). The linear response , already discussed in the preceding section and shown here for completeness (Fig. 13A I, B I, C I), displays in the mean-driven regime (), and to a lesser degree also at the bifurcation point (), a well known resonance peak near the firing frequency ; it acts as a low-pass filter in the excitable regime (). Increasing the correlation time and thereby the effect of the noise diminishes this resonance.
Fig. 13.
Firing rate response functions in the excitable regime (A), at the bifurcation point (B) and in the mean-driven regime (C) for a fixed variance and various values of . For a discussion see the main text. Parameters MCF Method:
The first nonlinear term describes the effect of the periodic signal on the time-averaged firing rate; we discuss this term first for the mean-driven regime (Fig. 13C II). Similar to the findings for a stochastic LIF model (Voronenko & Lindner, 2017, Fig. 3B) at low noise we find that a resonant driving at a frequency corresponding to the firing rate does not evoke any change of the time-averaged firing rate while a frequency slightly below or above this frequency evokes a reduction or increase of the rate, respectively. If we deviate too strongly from however the effect of the signal on the time-averaged rate becomes very small. Increasing the correlation time increases the effect of the noise and smears out these nonlinear resonances.
The effect of the periodic signal on the time-averaged firing rate in the excitable regime and at the bifurcation point is quite different (Fig. 13A II, B II). Here the rate is always increased by the periodic signal, similar to what was found already for an excitable LIF model (Voronenko & Lindner, 2017, Fig. 3A). Furthermore, at the bifurcation point and at low noise intensities (green curve in B II) there is a pronounced maximum as a function of frequency attained at a frequency higher than .
Generally, in the higher-order response functions, we observe a number of peaks versus frequency (see e.g. Fig. 13A–C V). The resonances in the mean-driven regime (C V) and at low noise (green curve) are found near , and . Note again, that in this regime the deterministic frequency of the oscillator and the stationary firing frequency are close. In the excitable regime both the linear and nonlinear response functions also exhibit for most driving frequencies a nonmonotonic behavior with respect to the correlation time, i.e. with respect to the strength of the noise.
Response to two periodic signals
So far we have discussed the theta neuron’s linear and nonlinear firing rate response to a single periodic signal. In this section we derive a scheme that allows to calculate the response if the model neuron receives two periodic signals:
| 53 |
Calculating the firing rate in this case will not only help to understand how a theta neuron responds to two periodic signals but can also be used to calculate the 2nd order response to arbitrary signals (Voronenko & Lindner, 2017).
As a starting point we formulate the corresponding FPE:
| 54 |
This equation still agrees with Eq. (41) except for s(t) which contains two periodic signals. Again we are interested in the PDF for which all initial condition have been forgotten and the time dependence of is only due to the time dependence of the signal s(t). Note that since the sum of two periodic signals is not necessarily periodic, the functions and r(t) are not periodic either. In fact, s(t) is only periodic if the ratio of the two frequencies is a rational number, i.e. . We chose a Fourier representation with respect to , and expand with respect to the small amplitudes , :
| 55 |
For notational convenience we have omitted the arguments of the coefficients .
Because is a real valued function, the coefficients obey
| 56 |
As for the case of a single periodic signal, inserting Eq. (55) into Eq. (54) gives a system of time-independent coupled differential equations:
| 57 |
with and for or . The normalization of the probability density provides again the additional conditions:
| 58 |
The differential equations (57) are analogous to Eq. (44) and can be solved by means of the MCF method (see Appendix C). In the following we explicitly provide the hierarchy of coupled differential equations up to the second order of , i.e. for . The zeroth-order term describes the unperturbed system. As we have already argued for the case of a single periodic signal the function , governed by
| 59 |
is the only non-vanshing zeroth-order term because for every other value of the trivial solution does satisfies Eq. (58). Therefore is the stationary probability density from Sect. 3. The stationary PDF in turn determines the two non-vanishing linear () correction terms:
| 60 |
| 61 |
Finally, the linear terms determine the second order terms ():
| 62 |
| 63 |
| 64 |
| 65 |
| 66 |
| 67 |
As for the case of a single periodic signal, the rate response r(t) can be expressed in terms of the functions using Eqs. (21) and (56):
| 68 |
with
| 69 |
| 70 |
The response of the firing rate up to the second order in the amplitudes reads:
| 71 |
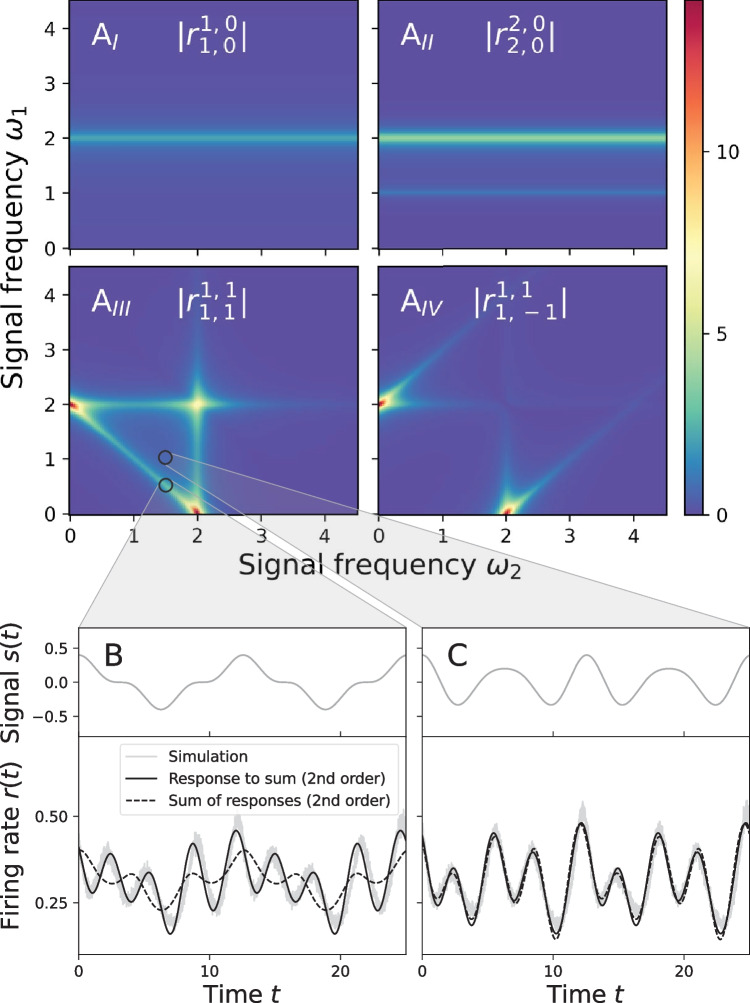
The first five lines represent the first and second order responses of the firing rate for a theta neuron that receives a single periodic signal, either or . For instance, (the linear response amplitude to ) and (the response amplitude at the second harmonic of ) do not depend on the frequency of the second signal as it can be seen in Fig. 14A and A. The response functions for a single periodic signal have already been discussed in the previous sections. The last two terms, proportional to , are of particular interest here, because they arise only due to the interaction of two periodic signals. The corresponding response amplitudes and are shown in Fig. 14A and A. In accordance with previous observations for the leaky integrate-and-fire model with white noise and a periodic driving (Voronenko & Lindner, 2017) we find two distinct cases in the mean-driven regime. First, if neither the sum nor the difference is close to the firing frequency then the response to the sum of two signals is well described by the sum of responses to the separate signals. A particular set of frequencies and for which this is the case is shown in Fig. 14C where the second order response to the sum of two signals (black solid line) agrees very well with the sum of the second order responses to one signal at a time (dashed line). Second, if or the firing rate is significantly affected by the interaction of both signals (see Fig. 14A and A). An example of the firing rate as a function of time where these interaction terms are crucial is shown in Fig. 14B. Here the aforementioned response to the sum of two signals and sum of responses to one signal at a time disagree significantly.
Fig. 14.
Nonlinear response to two periodic signals. A-A) Amplitudes of the response functions (cf. Eq. (71)). Note that the response functions and that are not shown here are identical to the response functions that are shown in A and A if the frequencies and are interchanged (both account for a single signal). The response functions and , that describe the interaction effect of both signals on the firing rate, exhibit additional resonances near and . B and C show the firing rate in response to two periodic signals where the sum of the frequencies does and does not match the aforementioned condition , respectively. If the condition is matched the sum of responses to each individual signal does not provide a good approximation to the actual firing rate but the full response to the sum of signals has to be calculated (see B). Parameters: , , , , with frequencies , in B and , in C. Parameters MCF Method:
Summary and outlook
In this paper we have studied the firing rate of the canonical type-I neuron model, the theta neuron, subject to a temporally correlated Ornstein-Uhlenbeck noise and additional periodic signals. We have solved the associated multi-dimensional Fokker-Planck-equation numerically by means of the matrix-continued-fraction (MCF) method, put forward by Risken (1984). For our problem the MCF method provided reliable solutions for a wide range of parameters; the main restriction is that the correlation time cannot be to large and additionally in the excitable regime the noise intensity (as also known from other application of the method, see Lindner & Sokolov, 2016 for a recent example) cannot be to small. To the best of our knowledge this is the first application of this method in computational neuroscience, advancing the results by Naundorf et al. (2005a, b) on the same model.
When the neuron receives no additional periodic signal, i.e. when the model is driven solely by the correlated noise, our method allows a quick and accurate computation of the stationary firing rate. We investigated the rate for a large part of the parameter space, confirmed the MCF results by comparison with stochastic simulations and discussed the agreement with known analytical approximations (Fourcaud-Trocmé et al., 2003; Galán, 2009; Moreno-Bote & Parga, 2010). We found that, in contrast to the white noise case (Lindner et al., 2003), correlated noise can both increase and decrease the stationary firing rate of a type-I neuron and we identified the conditions under which one or the other behavior can be observed.
In the presence of a single additional periodic signal both the probability density function and the firing rate approach a cyclo-stationary solution, which can be found by extending the MCF method to the time-dependent Fokker-Planck-equation. The corresponding rate modulation is for a weak signal given by the linear response function, the well known susceptibility, which has been addressed before numerically (Naundorf et al., 2005a, b) and analytically in limit cases (Fourcaud-Trocmé et al., 2003). Here we went beyond the linear response and computed also the higher-order response to a single periodic stimulus. Similar to what was found for a periodically driven leaky integrate-and-fire model with white background noise (Voronenko & Lindner, 2017), we identified driving frequencies at which the higher harmonics can be stronger than the firing rate modulation with the fundamental frequency. For a variety of nonlinear response functions, we observed resonant behavior.
Finally, we generalized the numerical approach to the case of two periodic signals and studied the nonlinear response up to second order. We found that for certain frequency combinations the mixed response to the two signals can lead to a drastically different rate modulation than predicted by pure linear response theory; this is similar to what was observed in a leaky integrate-and-fire neuron with white background noise (Voronenko & Lindner, 2017).
Our method could be extended to neuron models that include more complicated correlated noise, for instance, a harmonic noise (Schimansky-Geier & Zülicke, 1990) that can mimic special sources of intrinsic fluctuations (Engel et al., 2009). Another problem that could be addressed by this method is the computation of the spike-train power spectrum in the stationary state. Furthermore the linear and nonlinear response to the modulation of other parameters, e.g. the noise intensity (Boucsein et al., 2009; Lindner & Schimansky-Geier, 2001; Silberberg et al., 2004; Tchumatchenko et al., 2011), could be of interest and be computed with the methods outlined in this paper.
A. Stationary case - derivation of the tridiagonal recurrence relation
Here we demonstrate how the problem of solving the FPE (22) for the stationary PDF , can be translated into an equivalent problem of solving a tridiagonal recurrence relation for the expansion coefficients . These coefficients can then be found by means of the matrix-continued-fraction method as it was demonstrated in Sect. 3.1.
First, we recall the stationary FPE
| 72 |
| 73 |
| 74 |
and the expansion of the PDF by two sets of orthonormal eigenfunctions and
| 75 |
The Fourier modes and Hermite functions satisfy the periodic boundary condition in and natural boundary conditions in , respectively. Using the orthonormality
| 76 |
of these functions one can show that the normalization condition of the PDF determines :
| 77 |
Before addressing the full problem of finding the recursive relation for the coefficients , we first calculate using the expansion (75):
| 78 |
Remember that the Hermite functions can expressed by the Hermite polynomials as follows:
| 79 |
Where is an arbitrary scaling factor. Making use of the two properties
| 80 |
| 81 |
of the Hermite functions we can derive a handy expression for by choosing :
| 82 |
Hence, is a eigenfunction of the operator . Combining Eq. (82), the expansion (75) and the FPE (72) yields
| 83 |
We split the sum into three parts, perform an index shift and use Eq. (80) to obtain
| 84 |
Furthermore, we introduce the orthonormal operators
| 85 |
so that and . Multiplying Eq. (84) from the left by allows to get rid of the sum over n and to find the following recursive relation.
| 86 |
The sum can be interpreted as a product of matrices and vectors. We introduce the coefficient vector
| 87 |
and the symmetric matrices
| 88 |
| 89 |
which allows for an elegant reformulation of Eq. (86) by the tridiagonal recurrence relation
| 90 |
Note, that for we can readily infer the remaining elements of (remember that )
| 91 |
Equation (90) can by simplified by multiplication with from the left to obtain the expression used in Sect. 3.1:
| 92 |
This is the tridiagonal recurrence relation which we have solved in the main part by the MCF method (illustrated in Fig. 15).
Fig. 15.
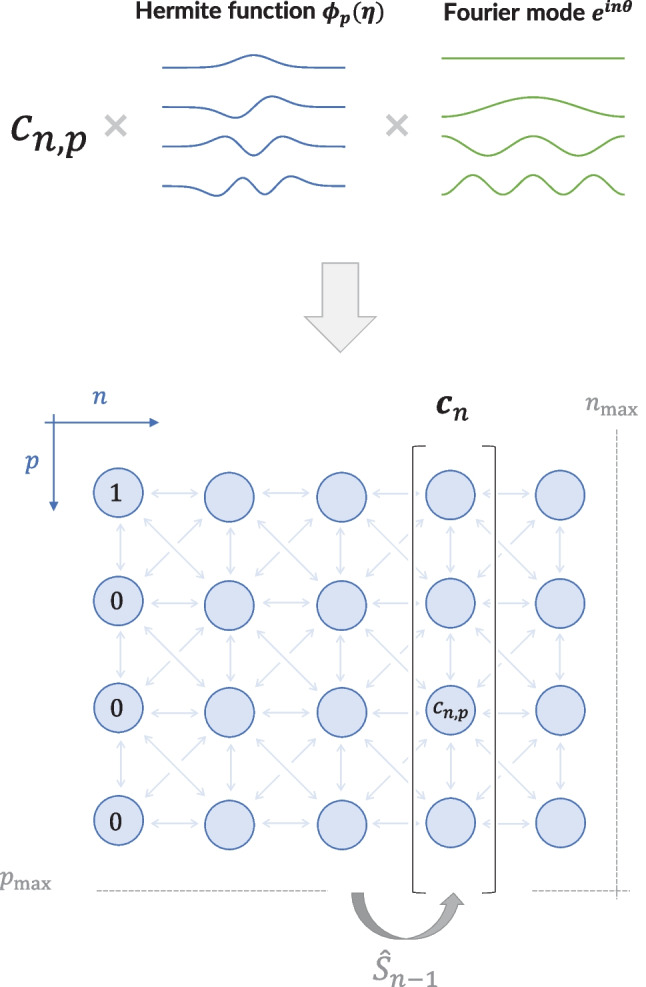
Illustration of the MCF method. Expanding the probability density using eigenfunctions according to Eq. (75) and insertion into the FPE (72) leads to a relation for the expansion coefficients where only nearest neighbors interact (including diagonals). The coefficients can then be computed by truncating the system and introducing transition matrices that can be obtained from a matrix continued fraction, see Sect. 3.1
B. Cyclo-stationary case - MCF method
In this section we expand the MCF method to the case of an additional periodic signal and calculate the cyclo-stationary firing rate r(t). In Sect. 4 we have already shown that the time-dependent FPE for this problem, i.e. Eq. (41), can be transformed into a set of time-independent differential equations that are recursively related (cf. Eq. (44)):
| 93 |
with . This hierarchy of coupled differential equations can be solved iteratively starting at the stationary PDF . The dependence is illustrated in Fig. 16 where many terms vanish (grey circles) due to the normalization condition of the PDF as explained in Sect. 4. In order to solve the corresponding differential equation for each we chose the same ansatz as in the previous section:
| 94 |
By substituting this ansatz into Eq. (47) a relation between the expansion coefficients and response functions (which determine the full firing rate r(t) via Eq. (46)) can be derived:
| 95 |
To find , we again transform the differential equations (93) into coefficient equations by means of the expansion (94) (see derivation of the tridiagonal recurrence relation in the previous section) and obtain
| 96 |
For notational convenience we introduced the coefficient vectors
| 97 |
and droped the superscripts . Further we denote the sum of the previously computed coefficient vectors by .
As in the previous section Eq. (96) is multiplied by from the left to obtain a more compact expression
| 98 |
with
| 99 |
| 100 |
In order to solve the 2-dimensional coefficient equation (98) we must assume that all Hermite functions and Fourier modes become negligible for large p or n, so that the corresponding coefficients vanish: for or . Specifically, we have checked how key statistics as for instance the firing rate depend on p and n and observed saturation for sufficiently large p and n; we then take these as maximal values.
The normalization condition of the PDF is determines the coefficient :
| 101 |
The remaining elements of vanish. This can be seen from Eq. (96) that simplifies considerably for
| 102 |
The involved matrix is diagonal with non-vanishing elements for . This implies that Eq. (102) can only be fulfilled if . The resulting coefficient vector
| 103 |
serves as the initial condition in the following. All other coefficient vectors can be derived iteratively:
| 104 |
| 105 |
Here we have introduced the transition matrices and as done in the case of no periodic signal and the additional vectors and , which take the inhomogeneity in Eq. (98) into account (Risken, 1984). The ansatz Eq. (104) is substituted into Eq. (98), which yields
| 106 |
This equation is satisfied when both expressions in the square brackets vanish. This allows to derive two recursive relation. First, from the left hand side
| 107 |
and second, from the right hand side
| 108 |
Analogous expressions can be derived for and . Because all coefficient vectors are assumed to vanish for it follows that
| 109 |
| 110 |
This defines the initial condition that is needed to determine the remaining transition matrices and vectors for :
| 111 |
| 112 |
and for
| 113 |
| 114 |
To summarize, the rate response functions and hence the full firing rate can be calculated following an iterative scheme illustrated in Fig. 16. Starting point is the zeroth order term in the signal amplitude (), where is known. For each iteration step, i.e. , the following series of steps is executed.
Compute the sum of the previously computed coefficient vectors and the matrices involved in the computations of according to Eq. (99).
Compute all transition matrices and vectors (and , ) iteratively starting at (and ) using Eqs. (111)–(114).
Find all coefficient vectors iteratively according to Eqs. (104) and (105) using the initial condition Eqs. (103) for and the transition matrices and vectors from the previous step.
Substitute the coefficients into Eq. (95) and determine the response functions .
C. MCF method: response to two periodic signals
In Sect. 4.3 we were interested in the nonlinear response r(t) of the noisy theta neuron subject to two periodic signals. To this end, we need to compute the response functions that are related to the expansion functions by Eq. (69). The latter in turn obey the following differential equation.
| 115 |
This system of coupled differential equations can be solved iteratively as described in Sect. 4.3. We wish to find the function given that the functions on the right-hand side of Eq. (115) are already computed. For each the differential equation has in principle the same structure as Eq. (93) from the previous section. Hence, it can be solved using the same numerical scheme based on the MCF method, using Eqs. (94)–(114), except for a change in the notation that reflects the expansion with respect to two signals:
Further two differences are:
Replace by which effects the computation of according to Eq. (99).
- The function is determined by four previously computed expansion functions , , and . This affects the computation of as follows:
116
Note that the known initial coefficient vector in Eq. (103) is still , when computing the stationary firing rate and else.
The hierarchy of coupled differential equations is indeed different to the previous section and is provided up to the 2nd order in the signal amplitude in Sect. 4.3.
Funding
Open Access funding enabled and organized by Projekt DEAL. This work was supported by Deutsche Forschungsgemeinschaft: LI-1046/4-1 and LI-1046/6-1.
Declarations
Competing interests
The authors have no competing interests to declare that are relevant to the content of this article.
Conflict of interest
The authors declare no conflict of interest.
Footnotes
One way to derive the QIF model is to consider the limit of a large slope factor in the exponential integrate-and-fire model which itself results from a simplification of a conductance-based model (Fourcaud-Trocmé et al., 2003). By choosing the new variable and expanding the exponential function up to the second order for , one finds , where is the membrane-time constant. For simplicity we neglected the prefactor in Eq. (1).
How fast the MCF method converges with the number of Hermite functions and Fourier modes considered depends on the system parameters as demonstrated in the repository. More precisely, for a fixed or we observed that the MCF method fails for large correlation times and additionally in the excitable regime for small noise intensities. However, for these particular limit cases analytical approximations already exist (see Sects. 3.2 and 3.3). Choosing a , we can even capture these limit cases sufficiently well (see Fig. 3).
Publisher's Note
Springer Nature remains neutral with regard to jurisdictional claims in published maps and institutional affiliations.
Contributor Information
Jannik Franzen, Email: franzen@physik.hu-berlin.de.
Lukas Ramlow, Email: lukas.ramlow@bccn-berlin.de.
Benjamin Lindner, Email: benjamin.lindner@physik.hu-berlin.de.
References
- Abbott L, van Vreeswijk C. Asynchronous states in networks of pulse-coupled oscillators. Physical Review E. 1993;48:1483. doi: 10.1103/PhysRevE.48.1483. [DOI] [PubMed] [Google Scholar]
- Alijani AK, Richardson MJE. Rate response of neurons subject to fast or frozen noise: From stochastic and homogeneous to deterministic and heterogeneous populations. Physical Review E. 2011;84:011919. doi: 10.1103/PhysRevE.84.011919. [DOI] [PubMed] [Google Scholar]
- Bair W, Koch C, Newsome W, Britten K. Power spectrum analysis of bursting cells in area MT in the behaving monkey. The Journal of Neuroscience. 1994;14:2870. doi: 10.1523/JNEUROSCI.14-05-02870.1994. [DOI] [PMC free article] [PubMed] [Google Scholar]
- Bartussek R. Ratchets driven by colored Gaussian noise. In: Schimansky-Geier L, Pöschel T, editors. Stochastic Dynamics, page 69. Berlin, London, New York: Springer; 1997. [Google Scholar]
- Bauermeister C, Schwalger T, Russell D, Neiman AB, Lindner B. Characteristic effects of stochastic oscillatory forcing on neural firing: Analytical theory and comparison to paddlefish electroreceptor data. PLoS Computational Biology. 2013;9:e1003170. doi: 10.1371/journal.pcbi.1003170. [DOI] [PMC free article] [PubMed] [Google Scholar]
- Boucsein C, Tetzlaff T, Meier R, Aertsen A, Naundorf B. Dynamical response properties of neocortical neuron ensembles: Multiplicative versus additive noise. The Journal of Neuroscience. 2009;29:1006. doi: 10.1523/JNEUROSCI.3424-08.2009. [DOI] [PMC free article] [PubMed] [Google Scholar]
- Brunel N. Dynamics of sparsely connected networks of excitatory and inhibitory spiking neurons. Journal of Computational Neuroscience. 2000;8:183. doi: 10.1023/A:1008925309027. [DOI] [PubMed] [Google Scholar]
- Brunel N, Latham PE. Firing rate of the noisy quadratic integrate-and-fire neuron. Neural Computation. 2003;15:2281. doi: 10.1162/089976603322362365. [DOI] [PubMed] [Google Scholar]
- Brunel N, Sergi S. Firing frequency of leaky integrate-and-fire neurons with synaptic current dynamics. Journal of Theoretical Biology. 1998;195:87. doi: 10.1006/jtbi.1998.0782. [DOI] [PubMed] [Google Scholar]
- Brunel N, Chance FS, Fourcaud N, Abbott LF. Effects of synaptic noise and filtering on the frequency response of spiking neurons. Physical Review Letters. 2001;86:2186. doi: 10.1103/PhysRevLett.86.2186. [DOI] [PubMed] [Google Scholar]
- Burkitt, A. N. (2006). A review of the integrate-and-fire neuron model: I. Homogeneous synaptic input. Biological Cybernetics, 95, 1. [DOI] [PubMed]
- Câteau H, Reyes AD. Relation between single neuron and population spiking statistics and effects on network activity. Physical Review Letters. 2006;96:058101. doi: 10.1103/PhysRevLett.96.058101. [DOI] [PubMed] [Google Scholar]
- Deniz T, Rotter S. Solving the two-dimensional Fokker-Planck equation for strongly correlated neurons. Physical Review E. 2017;95:012412. doi: 10.1103/PhysRevE.95.012412. [DOI] [PubMed] [Google Scholar]
- Doiron B, Rinzel J, Reyes A. Stochastic synchronization in finite size spiking networks. Physical Review E. 2006;74:030903. doi: 10.1103/PhysRevE.74.030903. [DOI] [PubMed] [Google Scholar]
- Droste F, Lindner B. Integrate-and-fire neurons driven by asymmetric dichotomous noise. Biological Cybernetics. 2014;108:825. doi: 10.1007/s00422-014-0621-7. [DOI] [PubMed] [Google Scholar]
- Droste F, Lindner B. Exact results for power spectrum and susceptibility of a leaky integrate-and-fire neuron with two-state noise. Physical Review E. 2017;95:012411. doi: 10.1103/PhysRevE.95.012411. [DOI] [PubMed] [Google Scholar]
- Dygas MM, Matkowsky BJ, Schuss Z. A singular perturbation approach to non-markovian escape rate problems. SIAM Journal on Applied Mathematics. 1986;46:265. doi: 10.1137/0146019. [DOI] [Google Scholar]
- Engel TA, Helbig B, Russell DF, Schimansky-Geier L, Neiman AB. Coherent stochastic oscillations enhance signal detection in spiking neurons. Physical Review E. 2009;80:021919. doi: 10.1103/PhysRevE.80.021919. [DOI] [PMC free article] [PubMed] [Google Scholar]
- Ermentrout B. Type I membranes, phase resetting curves, and synchrony. Neural Computation. 1996;8:979. doi: 10.1162/neco.1996.8.5.979. [DOI] [PubMed] [Google Scholar]
- Fisch K, Schwalger T, Lindner B, Herz A, Benda J. Channel noise from both slow adaptation currents and fast currents is required to explain spike-response variability in a sensory neuron. The Journal of Neuroscience. 2012;32:17332. doi: 10.1523/JNEUROSCI.6231-11.2012. [DOI] [PMC free article] [PubMed] [Google Scholar]
- Fourcaud N, Brunel N. Dynamics of the firing probability of noisy integrate-and-fire neurons. Neural Computation. 2002;14:2057. doi: 10.1162/089976602320264015. [DOI] [PubMed] [Google Scholar]
- Fourcaud-Trocmé N, Hansel D, van Vreeswijk C, Brunel N. How spike generation mechanisms determine the neuronal response to fluctuating inputs. The Journal of Neuroscience. 2003;23:11628. doi: 10.1523/JNEUROSCI.23-37-11628.2003. [DOI] [PMC free article] [PubMed] [Google Scholar]
- Gabbiani, F., & Cox, S. J. (2017). Mathematics for neuroscientists. Academic Press.
- Galán RF. Analytical calculation of the frequency shift in phase oscillators driven by colored noise: Implications for electrical engineering and neuroscience. Physical Review E. 2009;80(3):036113. doi: 10.1103/PhysRevE.80.036113. [DOI] [PubMed] [Google Scholar]
- Guardia, E., Marchesoni, F., & San Miguel, M. (1984). Escape times in systems with memory effects. Physics Letters A, 100, 15.
- Hänggi P, Jung P. Colored noise in dynamical-systems. Advances in Chemical Physics. 1995;89:239. [Google Scholar]
- Holden AV. Models of the stochastic activity of neurones. Berlin: Springer-Verlag; 1976. [Google Scholar]
- Izhikevich EM. Dynamical systems in neuroscience: the geometry of excitability and bursting. Cambridge, London: The MIT Press; 2007. [Google Scholar]
- Knight BW. Dynamics of encoding in neuron populations: Some general mathematical features. Neural Computation. 2000;12:473. doi: 10.1162/089976600300015673. [DOI] [PubMed] [Google Scholar]
- Koch C. Biophysics of computation - information processing in single neurons. New York, Oxford: Oxford University Press; 1999. [Google Scholar]
- Langer JS. Statistical theory of the decay of metastable states. Annals of Physics. 1969;54:258. doi: 10.1016/0003-4916(69)90153-5. [DOI] [Google Scholar]
- Lindner B. Interspike interval statistics of neurons driven by colored noise. Physical Review E. 2004;69:022901. doi: 10.1103/PhysRevE.69.022901. [DOI] [PubMed] [Google Scholar]
- Lindner, B., & Longtin, A. (2006). Comment on characterization of subthreshold voltage fluctuations in neuronal membranes by M. Rudolph and A. Destexhe. Neural Computation, 18, 1896. [DOI] [PubMed]
- Lindner B, Schimansky-Geier L. Transmission of noise coded versus additive signals through a neuronal ensemble. Physical Review Letters. 2001;86:2934. doi: 10.1103/PhysRevLett.86.2934. [DOI] [PubMed] [Google Scholar]
- Lindner B, Sokolov IM. Giant diffusion of underdamped particles in a biased periodic potential. Physical Review E. 2016;93:042106. doi: 10.1103/PhysRevE.93.042106. [DOI] [PubMed] [Google Scholar]
- Lindner B, Longtin A, Bulsara A. Analytic expressions for rate and CV of a type I neuron driven by white Gaussian noise. Neural Computation. 2003;15:1761. doi: 10.1162/08997660360675035. [DOI] [PubMed] [Google Scholar]
- Ly C, Ermentrout B. Synchronization dynamics of two coupled neural oscillators receiving shared and unshared noisy stimuli. Journal of Computational Neuroscience. 2009;26(3):425–443. doi: 10.1007/s10827-008-0120-8. [DOI] [PubMed] [Google Scholar]
- Moreno R, de la Rocha J, Renart A, Parga N. Response of spiking neurons to correlated inputs. Physical Review Letters. 2002;89:288101. doi: 10.1103/PhysRevLett.89.288101. [DOI] [PubMed] [Google Scholar]
- Moreno-Bote R, Parga N. Role of synaptic filtering on the firing response of simple model neurons. Physical Review Letters. 2004;92:028102. doi: 10.1103/PhysRevLett.92.028102. [DOI] [PubMed] [Google Scholar]
- Moreno-Bote R, Parga N. Auto- and crosscorrelograms for the spike response of leaky integrate-and-fire neurons with slow synapses. Physical Review Letters. 2006;96:028101. doi: 10.1103/PhysRevLett.96.028101. [DOI] [PubMed] [Google Scholar]
- Moreno-Bote R, Parga N. Response of integrate-and-fire neurons to noisy inputs filtered by synapses with arbitrary timescales: Firing rate and correlations. Neural Computation. 2010;22:1528. doi: 10.1162/neco.2010.06-09-1036. [DOI] [PubMed] [Google Scholar]
- Mori H. A continued-fraction representation of time-correlation functions. Progress in Theoretical Physics. 1965;34:399. doi: 10.1143/PTP.34.399. [DOI] [Google Scholar]
- Müller-Hansen F, Droste F, Lindner B. Statistics of a neuron model driven by asymmetric colored noise. Physical Review E. 2015;91:022718. doi: 10.1103/PhysRevE.91.022718. [DOI] [PubMed] [Google Scholar]
- Naundorf B, Geisel T, Wolf F. Action potential onset dynamics and the response speed of neuronal populations. Journal of Computational Neuroscience. 2005;18:297. doi: 10.1007/s10827-005-0329-8. [DOI] [PubMed] [Google Scholar]
- Naundorf B, Geisel T, Wolf F. Dynamical response properties of a canonical model for type-I membranes. Neurocomputing. 2005;65:421. doi: 10.1016/j.neucom.2004.10.040. [DOI] [Google Scholar]
- Neiman A, Russell DF. Stochastic biperiodic oscillations in the electroreceptors of paddlefish. Physical Review Letters. 2001;86:3443. doi: 10.1103/PhysRevLett.86.3443. [DOI] [PubMed] [Google Scholar]
- Novikov N, Gutkin B. Role of synaptic nonlinearity in persistent firing rate shifts caused by external periodic forcing. Physical Review E. 2020;101(5):052408. doi: 10.1103/PhysRevE.101.052408. [DOI] [PubMed] [Google Scholar]
- Ostojic S, Brunel N. From spiking neuron models to linear-nonlinear models. PLoS Computation Biology. 2011;7:e1001056. doi: 10.1371/journal.pcbi.1001056. [DOI] [PMC free article] [PubMed] [Google Scholar]
- Pena, R. F., Vellmer, S., Bernardi, D., Roque, A. C., & Lindner, B. (2018). Self-consistent scheme for spike-train power spectra in heterogeneous sparse networks. Frontiers in Computational Neuroscience, 12(9). [DOI] [PMC free article] [PubMed]
- Ricciardi LM. Diffusion processes and related topics on biology. Berlin: Springer-Verlag; 1977. [Google Scholar]
- Richardson MJE. Effects of synaptic conductance on the voltage distribution and firing rate of spiking neurons. Physical Review E. 2004;69:051918. doi: 10.1103/PhysRevE.69.051918. [DOI] [PubMed] [Google Scholar]
- Risken H. The Fokker-Planck Equation. Berlin: Springer; 1984. [Google Scholar]
- Rudolph M, Destexhe A. An extended analytical expression for the membrane potential distribution of conductance-based synaptic noise (Note on characterization of subthreshold voltage fluctuations in neuronal membranes) Neural Computation. 2005;18:2917. doi: 10.1162/neco.2006.18.12.2917. [DOI] [Google Scholar]
- Schimansky-Geier L, Zülicke C. Harmonic noise: Effect on bistable systems. Zeitschrift für Physik B Condensed Matter. 1990;79:451. doi: 10.1007/BF01437657. [DOI] [Google Scholar]
- Schuecker J, Diesmann M, Helias M. Modulated escape from a metastable state driven by colored noise. Physical Review E. 2015;92:052119. doi: 10.1103/PhysRevE.92.052119. [DOI] [PubMed] [Google Scholar]
- Schwalger T, Schimansky-Geier L. Interspike interval statistics of a leaky integrate-and-fire neuron driven by Gaussian noise with large correlation times. Physical Review E. 2008;77:031914. doi: 10.1103/PhysRevE.77.031914. [DOI] [PubMed] [Google Scholar]
- Schwalger T, Fisch K, Benda J, Lindner B. How noisy adaptation of neurons shapes interspike interval histograms and correlations. PLoS Computational Biology. 2010;6:e1001026. doi: 10.1371/journal.pcbi.1001026. [DOI] [PMC free article] [PubMed] [Google Scholar]
- Schwalger T, Droste F, Lindner B. Statistical structure of neural spiking under non-poissonian or other non-white stimulation. Journal of Computational Neuroscience. 2015;39:29. doi: 10.1007/s10827-015-0560-x. [DOI] [PubMed] [Google Scholar]
- Siegle P, Goychuk I, Talkner P, Hänggi P. Markovian embedding of non-markovian superdiffusion. Physical Review E. 2010;81:011136. doi: 10.1103/PhysRevE.81.011136. [DOI] [PubMed] [Google Scholar]
- Silberberg G, Bethge M, Markram H, Pawelzik K, Tsodyks M. Dynamics of population rate codes in ensembles of neocortical neurons. Journal of Neurophysiology. 2004;91:704. doi: 10.1152/jn.00415.2003. [DOI] [PubMed] [Google Scholar]
- Tchumatchenko T, Malyshev A, Wolf F, Volgushev M. Ultrafast population encoding by cortical neurons. The Journal of Neuroscience. 2011;31:12171. doi: 10.1523/JNEUROSCI.2182-11.2011. [DOI] [PMC free article] [PubMed] [Google Scholar]
- Tuckwell HC. Stochastic processes in the neuroscience. Philadelphia, Pennsylvania: SIAM; 1989. [Google Scholar]
- Vellmer S, Lindner B. Theory of spike-train power spectra for multidimensional integrate-and-fire neurons. Physical Review Research. 2019;1(2):023024. doi: 10.1103/PhysRevResearch.1.023024. [DOI] [Google Scholar]
- Voronenko S, Lindner B. Nonlinear response of noisy neurons. New Journal of Physics. 2017;19:033038. doi: 10.1088/1367-2630/aa5b81. [DOI] [Google Scholar]
- Voronenko S, Lindner B. Improved lower bound for the mutual information between signal and neural spike count. Biological Cybernetics. 2018;112:523. doi: 10.1007/s00422-018-0779-5. [DOI] [PubMed] [Google Scholar]
- Zhou P, Burton SD, Urban N, Ermentrout GB. Impact of neuronal heterogeneity on correlated colored-noise-induced synchronization. Frontiers in Computational Neuroscience. 2013;7:113. doi: 10.3389/fncom.2013.00113. [DOI] [PMC free article] [PubMed] [Google Scholar]


