

Abstract
Objective:
To compare pH of human milk types (mother’s own milk (MOM), pasteurized donor human milk (PDHM), fortified MOM, and fortified PDHM) fed to preterm infants.
Study design:
This observational study consisted of 63 mother-infant dyads <34 weeks gestation. Human milk samples (n=245), along with maternal factors, were collected for pH analysis. pH of MOM was analyzed over the course of lactation accounting for fortification status, postpartum day, and storage conditions.
Results:
Mean pH of MOM was slightly acidic at 6.60±0.28, which was significantly higher (p<0.05) than other milk types. pH of MOM varied by fortification, postpartum day, and maternal vegetable/fiber intake. There was a significant interaction between fortification status and postpartum day; pH of MOM decreased over time, while pH of fortified MOM increased over time.
Conclusion:
pH of human milk varied by type. pH of MOM was significantly associated with fortification status, postpartum day, and maternal vegetable/fiber intake.
Introduction
Mother’s own milk (MOM) is a complex biofluid that is critical to growth, development, and immune health during early life. In addition to being recognized as the optimal source of infant nutrition by the American Academy of Pediatrics (AAP), MOM contains many nonnutritive, biologically active components which influence the infant’s immune system and provide protection against necrotizing enterocolitis (NEC) and sepsis (1–5). The nutritional and bioactive composition of MOM is dynamic and can be influenced by the length of gestation, stage of lactation, time of day, phase of feeding, and specific maternal factors such as diet and body mass index (BMI) (6–12). When MOM is unavailable, the AAP recommends using pasteurized donor human milk (PDHM) for preterm infants, although many of its macronutrients and bioactive factors are diminished by the overall process of preparation (e.g., Holder pasteurization, pooling, freeze-thaw cycles) (1,13,14). While receiving MOM and PDHM is a routine medical intervention for preterm infants, little is known about the pH of human milk. This gap in knowledge is relevant because the pH of human milk may contribute to metabolic acidosis and similar to the role of intestinal pH, may influence how the gut microbiome is established during early life (15,16) (Supplemental Figure 1).
On average, preterm MOM consists of 2.1 g/dL protein, 4.5 g/dL lipids, and 7.5 g/dL carbohydrates (mainly lactose); the remainder is water with trace amounts of micronutrients and bioactive factors (8). The concentration of lipids and lactose increases over the course of lactation, while the amount of protein decreases over time (6). Although term MOM is ideal in meeting the needs of the majority of healthy, term-born infants, the nutritional profile of preterm MOM has been shown to fall short of the metabolic, growth, and development needs of preterm infants during the acute care hospitalization. Thus, the AAP recommends that human milk (MOM and PDHM) be fortified with protein and micronutrients to ensure optimal nutrient intake for infants <1500 grams. Nutritional fortification has been shown to improve growth outcomes of the preterm infant, but the influence of fortification on milk biology and chemical properties (e.g., pH) requires further investigation (1,17).
The pH has been reported in some commercially available nutritional fortifiers. For example, the Enfamil Human Milk Fortifier Acidified Liquid is labeled as “acidified” with a pH of 4.3 and known to lower milk pH to ~ 4.7 (18). However, most fortifiers claim to be “non-acidified,” yet lack published pH data (19). Additionally, very little is known about the influence of fortifiers on the pH of human milk (MOM or PDHM); therefore, there are no published guidelines or recommendations on the pH of feedings for preterm infants. The pH of fortifiers may influence the overall milk biology, as well as infant intestinal and health outcomes, not unlike recent findings that suggest associations between intestinal pH, intestinal microbiome, and infant health outcomes (16). This may be particularly relevant to preterm infants, who are prone to suboptimal growth and development, as well as NEC and sepsis.
The aims of this study were threefold: 1) to compare the pH of human milk as a function of type and nutritional fortification (MOM, PDHM, fortified MOM, and fortified PDHM); 2) to analyze the association between the pH of MOM, maternal factors, and dietary intake; 3) to assess the pH of MOM over the postpartum period, accounting for the influence of nutritional fortification, maternal factors, and/or maternal dietary intake.
Methods
Study Design and Population
We conducted a retrospective observational study of infants admitted to a level III NICU in Boston, MA between 10/2018 and 12/2019. This study was approved by the Mass General Brigham Human Research Committee as part of an existing research specimen and data repository focused on preterm infant gut health (protocol # 2016P001020) for which parents provided written informed consent. The repository’s inclusion criteria are live-born infants born prior to 34 weeks of gestation; exclusion criteria are diagnoses associated with mortality or anticipated transfer to an outside facility within 48 hours of birth. Our study population was drawn from a cohort selected for a larger study exploring relationships between the human milk microbiome, intestinal inflammation and microbiome, and health outcomes in preterm infants. Due to the observational nature of our study, a power analysis was not performed. We selected all subjects who met the following inclusion criteria at the time the dataset was frozen: NICU length of stay >14 days and availability of at least two blood, urine, fecal, and enteral feeding samples collected during the hospitalization. In our analysis, we excluded all twin “Bs” because the collected milk samples were identical for both twins. We also excluded MOM/fortified MOM samples that had undergone a freeze-thaw cycle prior to collection, had exceeded the expiration date (i.e., refrigerated at 4°C for >4 days prior to collection), or were missing the postpartum date of expression. The final study cohort included 63 mother-infant dyads as “total subjects” with 245 human milk samples including MOM, PDHM, fortified MOM, and fortified PDHM. In our subset analysis focused solely on MOM/fortified MOM samples, we excluded 8 mother-infant dyads with PDHM/fortified PDHM samples, for a cohort of 55 “MOM subjects” (Supplemental Figure 2).
Human Milk Collection
Aliquots (5–10 ml) of human milk samples (MOM, PDHM, fortified MOM, and fortified PDHM) were aseptically collected using a syringe. The original container was gently swirled to homogenize samples before collection. MOM samples (n=76) represent unfortified milk that was pumped or hand expressed within 96 hours of collection and stored at 4°C as part of standard clinical practice (Supplemental Figure 3). PDHM samples (n=6) represent pooled, unfortified pasteurized donor human milk obtained from Mothers’ Milk Bank Northeast (Newton Upper Falls, MA) that was thawed within 48 hours of collection and stored at 4°C as part of standard clinical practice. A portion of MOM and PDHM samples had been fortified by bedside nurses with commercially available nutritional fortifiers, including bovine milk-derived Similac Human Milk Fortifier Concentrated Liquid (HMF) (Abbott, Abbott Park, IL) and Liquid Protein Fortifier (PF) (Abbott, Abbott Park, IL), as well as medium chain triglycerides (MCT oil) sourced from coconut/palm oil (Nestle HealthScience, Bridgewater, NJ), using standard fortification procedures defined within the clinical policies and procedures of our NICU. These fortified MOM samples (n=142) and fortified PDHM samples (n=21), as well as the MOM and PDHM, were sub-aliquoted into smaller volumes and frozen at −80°C within 4 hours of collection.
Human Milk pH Measurement
pH measurements were conducted as part of our bacterial DNA extraction protocol developed for a larger study focused on the human milk microbiome. Aliquots (2 ml) of MOM, PDHM, fortified MOM, and fortified PDHM were thawed overnight at 4°C, then centrifuged at 15,000 x g at room temperature. A sterile, cotton-tipped swab was used to remove the top fat layer to prevent it from coating and/or clogging the pH electrode, which have been described as the most common reasons for poor electrode performance in foods (20). Following fat removal, “skimmed” supernatant was transferred into a new microcentrifuge tube. The tube was submerged in a water bath at 37°C to simulate a routine NICU nursing practice of warming feedings prior to administration. The pH of the supernatant was measured using a digital pH-meter (HI5221, Hanna Instruments, Smithfield, RI) equipped with an extended-length glass electrode with a micro bulb (HI1093B, Hanna Instruments, Smithfield, RI) and automatic temperature compensation. The pH meter was calibrated daily with pH 4.0 and 7.0 buffers. Replicate pH measurements were not obtained due to the overall workflow of the specimen processing protocol and regular calibration checks. For reference, the pH of two nutritional fortifier types used in our NICU (HMF and PF) were measured from three different batches. The pH of MCT oil alone was not measured, since pure oil is a non-aqueous liquid.
Clinical Data Collection
Maternal and infant demographic and clinical data were collected from electronic medical records (EMR; Epic Systems, Inc. Madison, WI). Maternal variables included race, ethnicity, postpartum day (PPD) and postmenstrual age (PMA) at the time of MOM expression, MOM storage duration in the refrigerator at 4°C and freezer at −80°C, age and body mass index (BMI) at the time of delivery, parity, multiple gestation, mode of delivery, preeclampsia/eclampsia, chronic hypertension, diabetes (gestational or type 2), and dietary intake. Infant variables included gestational age (GA) at delivery, birth weight, and sex.
Maternal Dietary Intake Assessment
To determine maternal dietary intake during pregnancy, a subset of mothers was given the Dietary Screener Questionnaire (DSQ) within two weeks following birth and asked to recall their diet during the month leading up to birth. The DSQ, a 26-item dietary assessment instrument, was developed by the Risk Factor Monitoring and Methods Branch of the National Cancer Institute (NCI), National Institutes of Health and validated by the National Health and Nutrition Examination Survey (NHANES) 2009–2010. DSQ data were scored and converted into estimated daily intake values according to the NCI’s algorithm (21). Participants’ estimated intake values for fruits and vegetables (cup equivalents), dairy (cup equivalents), added sugars (teaspoon equivalents), whole grains (ounce equivalents), fiber (g), and calcium (mg) were compared with the recommended values for the sex-age specific (female, 19–30 or 31–50 years old) and trimester specific (2nd or 3rd) groups outlined in the Dietary Guidelines for Americans, 2020–2025 (DGA, 2020–2025), published by the U.S. Department of Agriculture and U.S. Department of Health and Human Services. Of note, the DSQ was administered to participants prior to the release of the new DGA in December 2020.
Statistical Analysis
Normality of the variables was assessed using a Shapiro-Wilk test. Results are reported as means (standard deviation (SD)) for normally distributed continuous variables, medians (interquartile ranges [IQR]) for skewed continuous variables, and absolute numbers (percentages) for categorical variables. To estimate the differences in the pH among human milk types and to assess the relationship between the pH of MOM and continuous maternal factors/dietary intake, as well as storage conditions, we fit a linear mixed model indicating subject ID as a random effect to account for repeated measures within mothers; results are presented as both unstandardized and standardized beta coefficients. A Wald Chi-Squared test was used to evaluate differences in the pH of MOM by categorical variables (i.e., race and ethnicity).
Effects of time (PPD) on the pH of MOM and fortified MOM samples were then modeled by fitting a linear mixed model controlling for storage conditions and indicating subject ID as a random effect to account for repeated measures within mothers; results are presented as unstandardized beta coefficients in pH units for ease of clinical interpretation. The interaction between fortification status and PPD was assessed. A sensitivity analysis was run with and without potential confounders (i.e., vegetable and fiber intake). An additional sensitivity analysis was done to assess for the potential influence of between-subject variability in the MOM and fortified MOM groups by testing the model in a subset of mothers with both MOM and fortified MOM samples in the dataset (i.e., mothers with only one sample type were excluded).
Descriptive statistical analyses and linear mixed-effects models with similar variances were performed using Stata® version 17 SE (College Station, TX; Stata), while linear mixed-effects models with unequal variances were performed using R Version 4.1.0 (Vienna, Austria) to control for heteroscedasticity in the data (estimates of variance are reported in Supplemental Table 1). As such, all models meet the assumptions of regression analysis. The threshold for statistical significance was defined as p<0.05.
Results
Study Population and Human Milk Sample Characteristics
The overall study population was divided into two cohorts: “total subjects” (n=63) and “MOM subjects” (n=55) (Supplemental Figure 2). Demographic and clinical characteristics are reported in Table 1. On average, 1.4 MOM samples (range 0–6) and 2.6 fortified MOM samples (range 0–7) were collected per mother, and 1.2 PDHM samples (range 0–2) and 1.5 fortified PDHM samples (range 0–3) were collected per infant.
Table 1. Demographic and Clinical Characteristics of Mother-Infant Dyads.
Continuous variables are described by medians [IQR] and categorical variables are described by absolute numbers (percentages).
| Total Subjects n=63 mother-infant dyads a |
MOM Subjects n=55 mother-infant dyads a |
|
|---|---|---|
| Median [IQR] or n (%) | Median [IQR] or n (%) | |
| Maternal Characteristics | ||
| Race | ||
| White | 30 (47.6%) | 27 (49.0%) |
| Black or African American | 12 (19.0%) | 11 (20.0%) |
| Asian | 6 (9.5%) | 5 (9.0%) |
| Other | 11 (17.5%) | 8 (14.5%) |
| Unknown or Not Reported | 4 (6.3%) | 4 (7.2%) |
| Ethnicity | ||
| Not Hispanic or Latino | 51 (81.0%) | 46 (83.6%) |
| Hispanic or Latino | 10 (15.9%) | 7 (12.7%) |
| Unknown or Not Reported | 2 (3.2%) | 2 (3.6%) |
| Age at Delivery (years) | 32.5 [29.4, 36.2] | 32.4 [29.4, 36.2] |
| BMI at Delivery | 30.0 [25.9, 33.9] | 29.6 [25.7, 33.5] |
| Primigravida | 30 (47.6%) | 25 (45.5%) |
| Singleton Birth | 50 (79.4%) | 45 (81.8%) |
| Cesarean Delivery | 47 (74.6%) | 40 (72.7%) |
| Maternal Comorbidities | ||
| Preeclampsia/Eclampsia | 12 (19.0%) | 11 (20.0%) |
| Chronic Hypertension | 6 (9.5%) | 5 (9.1%) |
| Diabetes (GDM or Type 2) | 11 (17.5%) | 9 (16.4%) |
| Completed DSQ | 31 (49.2%) | 27 (49.1%) |
| Daily Nutritional Goals (2nd - 3rd Trimester) b | ||
| Dairy (3 cup eq) | 1.6 [1.2, 1.7] | 1.5 [1.2, 1.7] |
| Fruits (2 cup eq) | 1.0 [0.9,1.5] | 1.0 [0.8, 1.5] |
| Vegetables (3 – 3.5 cup eq) | 1.4 [1.3, 1.7] | 1.4 [1.3, 1.7] |
| Added Sugar (< 13.10 – 15.48 tsp eq) c | 17.7 [15.1, 19.6] | 17.7 [14.7, 19.4] |
| Whole Grains (3.5 – 4.5 oz eq) d | 0.7 [0.5, 0.9] | 0.7 [0.5, 0.9] |
| Fiber (31 – 36 g) | 18.1 [15.2, 20.9] | 18. 1 [15.2, 21.5] |
| Calcium (1000 mg) | 896.3 [844.5,1050.7] | 867.4 [843.4, 952.6] |
| Infant Characteristics e | ||
| GA at Delivery (weeks) | 29.29 [27.71, 31.29] | 29.71 [27.71, 31.43] |
| Birth Weight (grams) | 1340 [1030, 1490] | 1360 [1030, 1616] |
| Sex (male) | 35 (55.6%) | 32 (58.2%) |
“Total Subjects” cohort includes mother-infant dyads (n=63) with human milk samples including mother’s own milk (MOM), pasteurized donor human milk (PDHM), fortified MOM, and fortified PDHM. “MOM Subjects” cohort includes mother-infant dyads (n=55) with only MOM and/or fortified MOM samples.
Only a subset of mothers completed the DSQ. The daily nutritional goals (shown in parenthesis) are based on the DGA for women who are pregnant and follow a 2,200 – 2,600 calorie diet according to their sex-age group (female, 19–30 or 31–50 years) and trimester (2nd or 3rd).
The DGA classifies recommended added sugars intake as less than 10% of calories per day, which were converted to teaspoons (tsp) equivalents (eq) using the USDA conversion factors: 1 g = 4 cal, 1 tsp = 4.2 g.
As defined by the USDA, a one ounce equivalent (oz eq) of 100% whole grains has 16 grams of whole grains.
For a pregnancy with multiples, only one of the twins (twin “A”) was included in the analysis.
Abbreviations: IQR – interquartile range shown as 1st and 3rd quartiles, BMI – body mass index, GA – gestational age, DSQ – dietary screener questionnaire from the National Health and Nutrition Examination Survey (NHANES) 2009–2010, DGA – Dietary Guidelines for Americans, 2020–2025 from the U.S. Department of Agriculture (USDA) and U.S. Department of Health and Human Services.
For MOM/fortified MOM, the mean PPD at the time of expression was 38.4±27.4 days (range 3–142), the mean PMA at the time of expression was 34.1±3.5 weeks (range 25.7–42.6), the mean length of refrigerator storage was 2.0±0.97 days (range 0–4), and the mean length of freezer storage was 18.5±4.3 months (range 9.2–30.5). For PDHM/fortified PDHM, the exact length of refrigerator storage was not assessed but did not exceed two days according to standard clinical practice and the mean length of freezer storage was 16.2±4.1 months (range 10.0–26.3) (Supplemental Figure 3).
pH of Human Milk by Type and Fortification Status
The mean pH of MOM was slightly acidic at 6.60±0.28, which was significantly higher than the mean pH of PDHM (6.44±0.043, p=0.026), fortified MOM (6.19±0.21, p<0.001), and fortified PDHM (6.27±0.084, p<0.001) (Figure 1). The pH of MOM had a high degree of variability ranging from 6.09–7.29 (5.81–6.73 when fortified), while the pH of PDHM had less variability ranging from 6.38–6.51 (6.16–6.55 when fortified).
Figure 1. The pH of Human Milk by Type and Fortification Status.
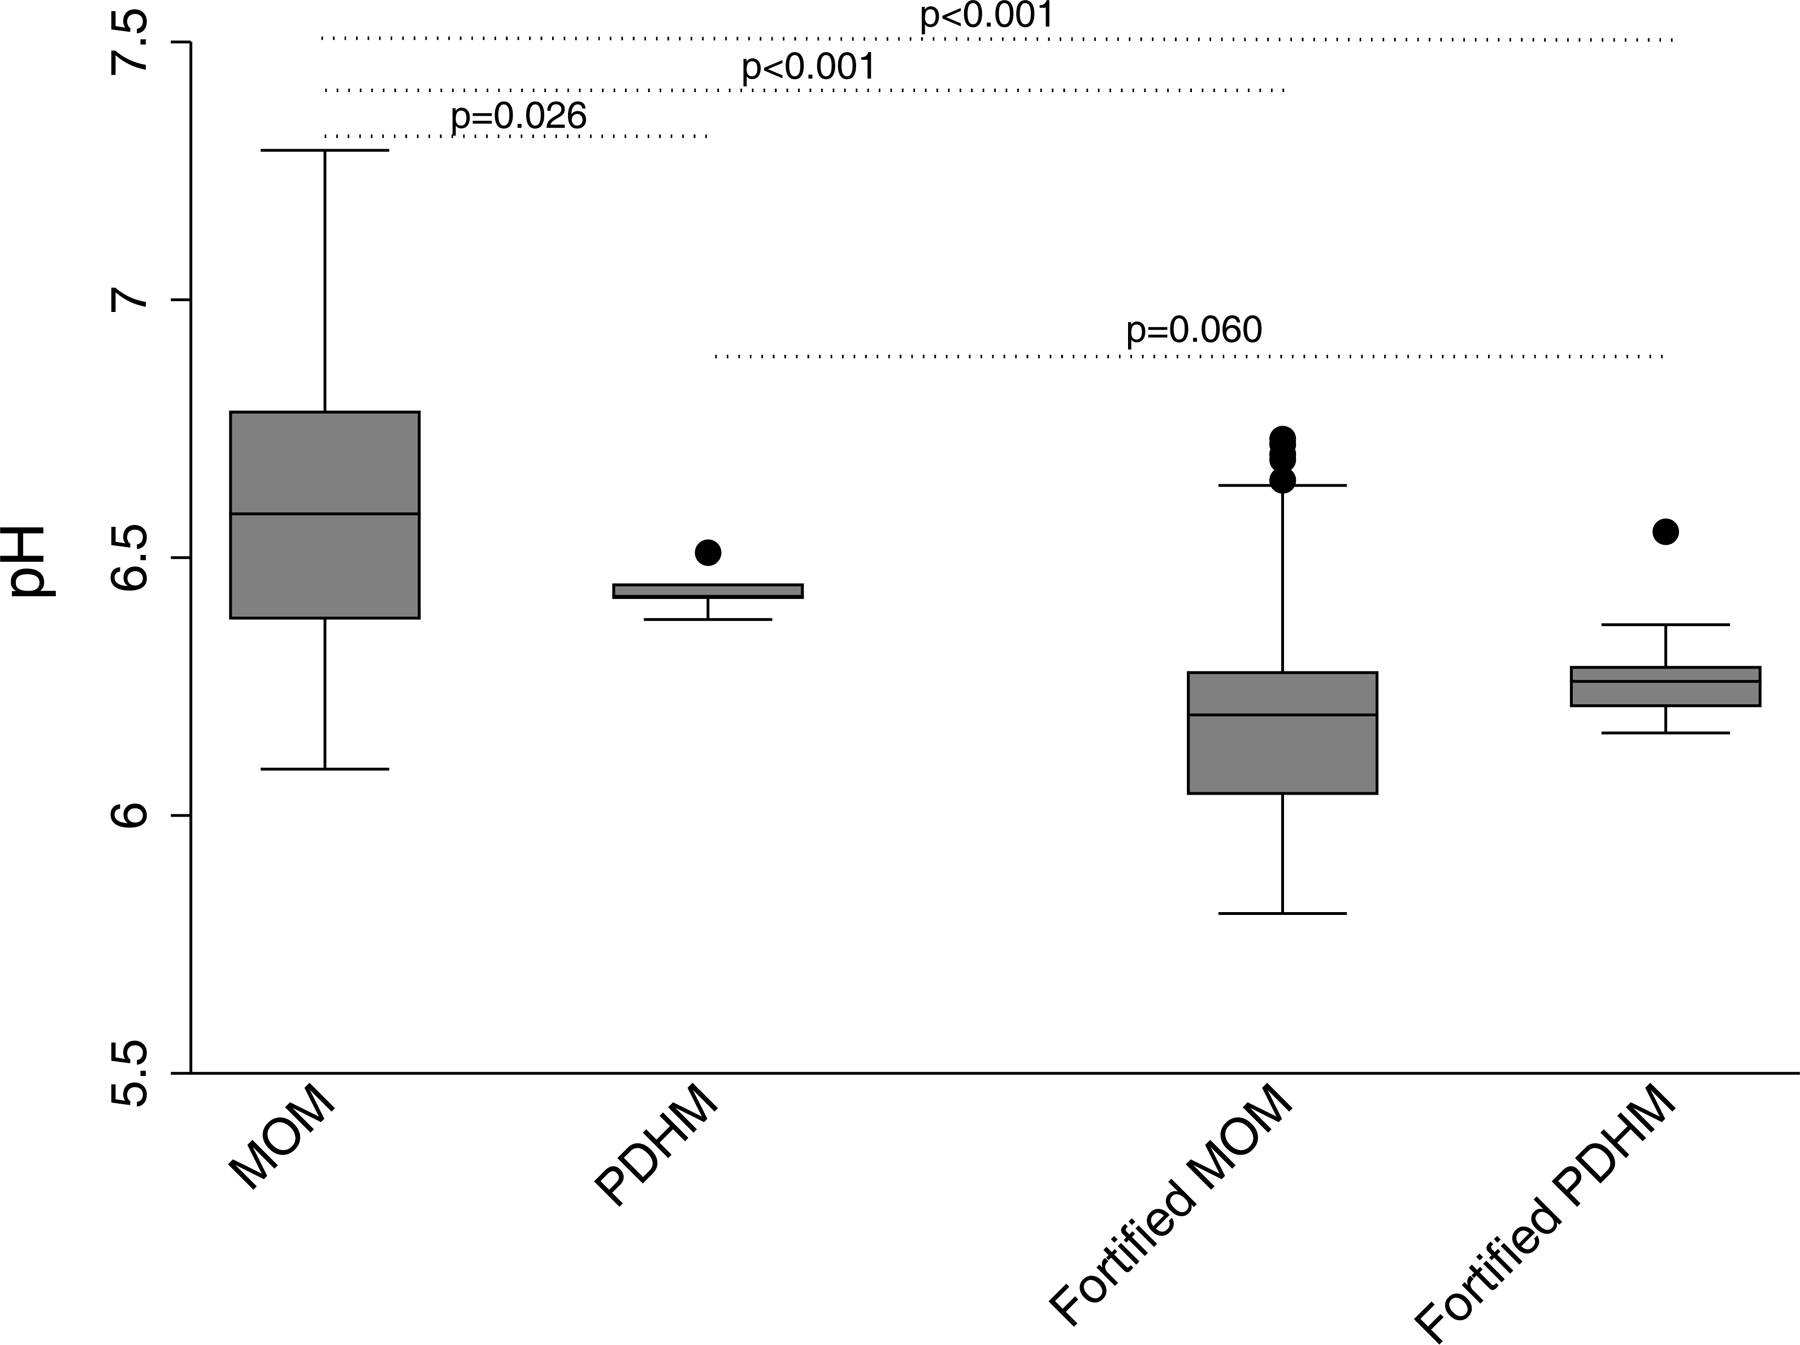
The mean pH of MOM samples (n=76), was significantly higher (p<0.05 in all comparisons) than the mean pH of PDHM (n=6), fortified MOM (n=142), and fortified PDHM (n=21).
Abbreviations: MOM – mother’s own milk, PDHM – pasteurized donor human milk.
Both types of fortifiers used in our NICU were found to be acidic, with HMF having a mean pH of 5.84±0.068 (range 5.79–5.94) and PF having a mean pH of 5.87±0.014 (range 5.84–5.92). On average, the addition of fortifiers acidified both MOM and PDHM samples. When comparing human milk by fortification status, the mean pH of fortified MOM was significantly lower (p<0.001) than MOM (mean difference 0.40). Similarly, the mean pH of fortified PDHM trended lower than PDHM (mean difference 0.17), albeit this was only approaching significance after controlling for heteroscedasticity (p=0.060).
Association Between pH of MOM, Maternal Factors, Dietary Intake, and Storage Conditions
To reduce the confounding effect of fortification, fortified MOM samples were excluded and only MOM samples were used in this portion of the analysis. The pH of MOM was inversely associated with PPD (standardized β [95% CI] = −0.26 [−0.47, −0.050], p=0.015) and PMA (standardized β [95% CI] = −0.27 [−0.48, −0.059], p=0.012) (Table 2). The pH of MOM did not differ significantly by maternal age, BMI at delivery, GA at delivery, mode of delivery, multiple gestation, parity, or select comorbidities including preeclampsia/eclampsia, chronic hypertension, and diabetes (Table 2). Additionally, the pH of MOM did not vary significantly by race (p=0.50) or ethnicity (p=0.67) as derived by a Wald Chi-Squared test. Lastly, the pH of MOM was inversely associated with refrigerator storage time (standardized β [95% CI] = −0.42 [−0.63, −0.21], p<0.001), but did not vary significantly by freezer storage time (standardized β [95% CI] = −0.17, [−0.42, 0.078], p=0.18).
Table 2.
The Association Between the pH of MOM, Maternal Factors, Dietary Intake, and Storage Conditions.
| Standardized | Unstandardized | ||||
|---|---|---|---|---|---|
| β | 95% CI | β | 95% CI | p b | |
| Maternal Factors a | |||||
| PPD (days) | −0.26 | −0.47, −0.050 | − 0.0026 | − 0.0048, − 0.00050 | 0.015 * |
| PMA (weeks) | −0.27 | −0.48, −0.059 | − 0.020 | − 0.036, − 0.0045 | 0.012 * |
| GA at Delivery (weeks) | 0.018 | −0.23, 0.27 | 0.0020 | − 0.026, 0.030 | 0.89 |
| Age at Delivery (years) | −0.11 | −0.37, 0.16 | − 0.0050 | − 0.018, 0.0075 | 0.43 |
| BMI at Delivery | 0.15 | −0.10, 0.41 | 0.0069 | − 0.0046, 0.018 | 0.24 |
| Mode of Delivery | −0.35 | −0.97, 0.26 | − 0.099 | − 0.27, 0.072 | 0.26 |
| Multiple Gestation | −0.80 | −1.67, 0.058 | − 0.22 | − 0.46, 0.016 | 0.067 |
| Parity | −0.066 | −0.60, 0.46 | − 0.018 | − 0.17, 0.13 | 0.81 |
| Preeclampsia/Eclampsia | 0.065 | −0.61, 0.74 | 0.018 | − 0.17, 0.21 | 0.85 |
| Chronic Hypertension | −0.37 | −1.1, 0.35 | − 0.10 | − 0.30, 0.096 | 0.31 |
| Diabetes (GDM or Type 2) | 0.41 | −0.41, 1.2 | 0.11 | − 0.11, 0.35 | 0.33 |
| Dietary Intake c | |||||
| Dairy (cup eq) | 0.19 | −0.11, 0.49 | 0.080 | − 0.046, 0.21 | 0.21 |
| Fruits (cup eq) | 0.14 | −0.18, 0.46 | 0.088 | − 0.11, 0.29 | 0.38 |
| Vegetables (cup eq) | −0.45 | −0.71, −0.20 | − 0.40 | − 0.62, − 0.18 | <0.001 * |
| Added Sugar (tsp eq) | 0.11 | −0.22, 0.44 | 0.00 | − 0.020, 0.041 | 0.51 |
| Whole Grains (oz eq) | −0.10 | −0.48, 0.27 | − 0.083 | − 0.37, 0.21 | 0.58 |
| Fiber (g) | −0.42 | −0.70, −0.14 | − 0.027 | − 0.045, − 0.0092 | 0.003 * |
| Calcium (mg) | −0.032 | −0.93, 0.33 | − 0.000044 | − 0.00055, 0.00046 | 0.86 |
| Storage Conditions d | |||||
| Refrigerator (days) | −0.42 | −0.63, −0.21 | −0.11 | −0.16, −0.055 | <0.001 * |
| Freezer (months) | −0.17 | −0.42, 0.078 | −0.012 | −0.028, 0.0053 | 0.18 |
p<0.05
Based on n=34 mothers (n=76 MOM samples).
p-value is the same for both standardized and unstandardized β coefficients.
Based on n=15 mothers (n=44 MOM samples) as only a subset of mothers completed the dietary screener questionnaire.
Abbreviations: MOM – mother’s own milk, PPD – postpartum day at the time of expression, PMA – postmenstrual age at the time of expression, GA – gestational age, BMI – body mass index.
In the subset of mothers (n=15) who completed the DSQ, the pH of MOM was inversely associated with vegetable intake (standardized β [95% CI] = −0.45 [−0.71, −0.20], p<0.001) and fiber intake (standardized β [95% CI] = −0.42 [−0.70, −0.14], p=0.003) during the last month of gestation (Table 2). Pearson correlation results indicated that vegetable and fiber intake were significantly correlated with each other (rho=0.80, p<0.001). There were no significant associations between the pH of MOM and dairy, fruit, added sugar, whole grains, or calcium intake (Table 2).
pH of MOM and Fortified MOM Over Postpartum Period
As stated, both PPD and PMA were found to be associated with the pH of MOM. Since no other maternal factors were associated with the pH of MOM, and the pH of MOM was significantly different from the pH of fortified MOM, the final linear mixed model included PPD, fortification status, and the interaction between PPD and fortification status as the independent variables. The model also included refrigerator storage time as a covariate and the subject ID as a random effect. Freezer storage time was also considered as a covariate, however, it was not found to be a significant predictor of the pH and was excluded from the model. We found a statistically significant interaction between PPD and fortification status (β [95% CI] = 0.005 [0.003, 0.007], p<0.001), showing that the change in the pH over time differed depending on the fortification status. Specifically, the pH of MOM was higher compared to fortified MOM in the early postpartum period and gradually decreased over time (β [95% CI] = −0.003 [−0.004, −0.0007], p=0.008), whereas the pH of fortified MOM exhibited an opposite trend and gradually increased over time (β [95% CI] = 0.003 [0.001, 0.004], p<0.001) (Figure 2). The difference between the pH of MOM and fortified MOM attenuated over time.
Figure 2. The Effect of PPD on the pH of MOM and Fortified MOM.
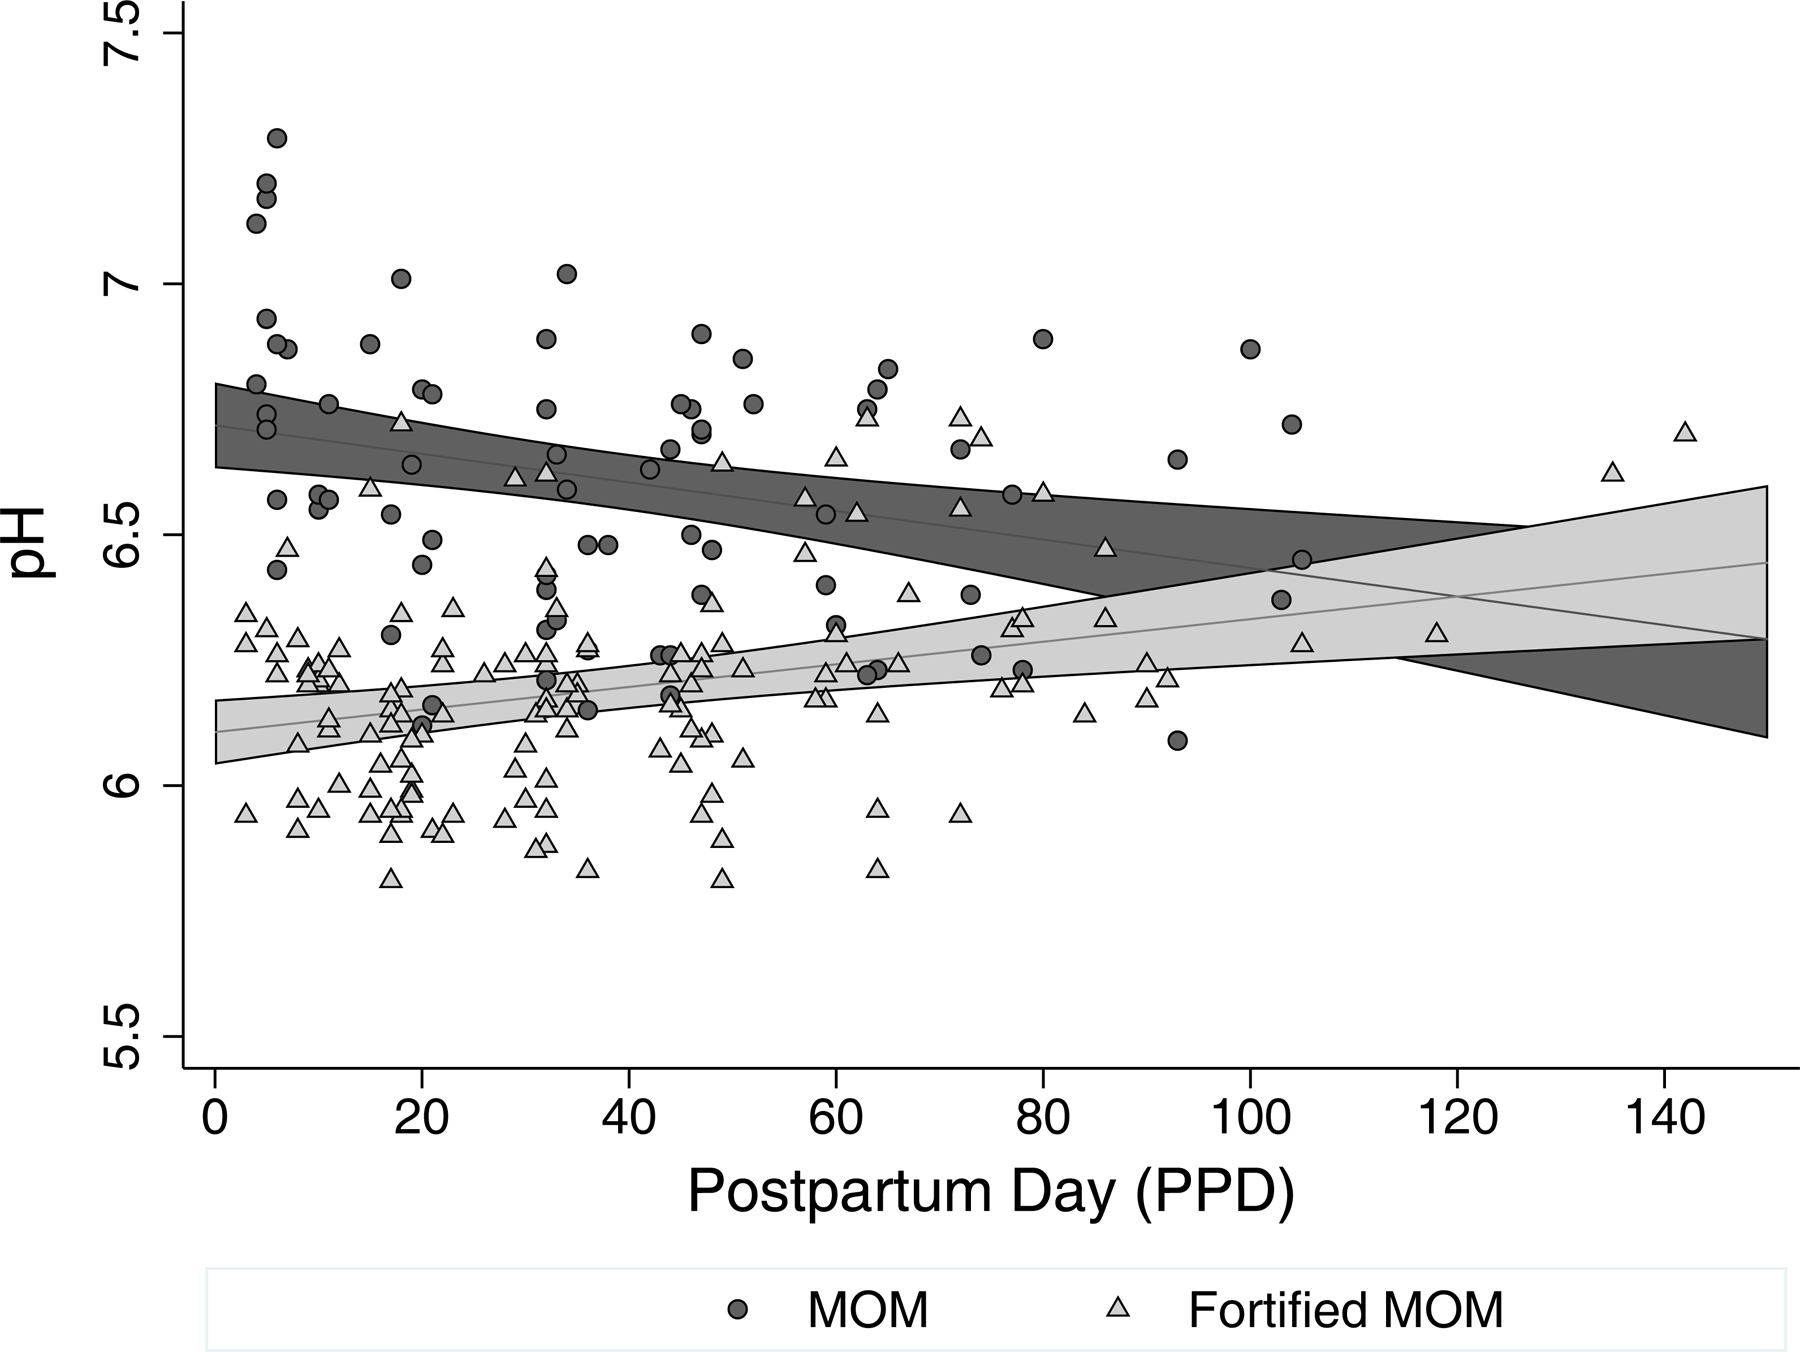
Changes in the pH of MOM and fortified MOM over the postpartum period shown as a scatter plot overlaid by a linear prediction with 95% CI margins from a linear mixed model. Based on n=55 mothers (n=76 MOM samples and n=142 fortified MOM samples).
Abbreviations: MOM – mother’s own milk, PPD – postpartum day at the time of expression.
The sensitivity analysis in the subset of mothers who completed the DSQ showed no significant change in the effect size when including or excluding vegetable and fiber intake as confounders (Supplemental Table 2). The separate sensitivity analysis done in the subset of mothers with both types of samples (MOM and fortified MOM), to control for the potential influence of between-subject variability in the groups, did not significantly alter the subset model compared to the full model (Supplemental Table 3).
Discussion
The results of our study suggest the pH of human milk varies by type and fortification status. Additionally, we demonstrate an association between the pH of MOM, the time since birth (PPD and PMA), and vegetable and fiber intake. Our results also suggest a decreasing trend in the pH of MOM over PPD and an increasing trend in the pH of fortified MOM over PPD. Our findings add to limited, but growing, literature on human milk pH, and set the stage for future research that may lead to a better understanding of the role human milk pH plays in gut health, growth, and developmental outcomes, especially among preterm infants.
pH of Human Milk Varies by Type and Fortification Status
The range of pH among human milk samples spanned from slightly acidic to slightly alkaline, suggesting the possibility that it may not be as tightly regulated as the pH of other human biological systems (Figure 1). Although the mean pH of MOM was slightly acidic at 6.60±0.28 (range 6.09–7.29 ), it was comparable to other studies (range 6.35–6.81) conducted exclusively among mothers who delivered preterm (22–25). In studies that did not specify whether their participants had a term or preterm delivery, a higher average pH of MOM (range 7.04–7.60) was reported, possibly owing to differences in the composition of term MOM and/or differences in storage conditions.(26–28). In line with studies by Slutzah et al. and Ogundele, we observed an inverse relationship between the pH of MOM and refrigerator storage time (27, 29). However, it should be noted that Slutzah et al. and Ogundele treated refrigerator storage time as an experimentally-controlled variable with the goal of understanding how the pH of MOM changes over the course of refrigerator storage from when it was initially expressed. In contrast, in our study, the duration of refrigerator storage followed standard clinical practices with the goal of capturing the pH of MOM at the time it is actually fed to the infant. Additionally, studies by Ogundele and Ahrabi et al. suggest the pH of MOM decreases over the course of freezer storage (12 weeks and 9 months, respectively), however, the temperature in both studies was higher at −20°C compared to our temperature at −80°C, which is generally considered more optimal for long-term storage of biospecimens (27,30,31). Nonetheless, we acknowledge the possibility that the initial pH of our MOM samples (i.e., prior to being stored in the refrigerator/freezer) may have been slightly higher compared to the pH values we observed following storage in the refrigerator/freezer. However, we believe it is less likely that the overall variability in the pH of MOM could be attributed to storage conditions alone and more likely that the pH of human milk is influenced by additional clinical factors. We also acknowledge that there is some evidence to suggest that fat removal may slightly influence the pH of MOM (27). However, in our study, all samples were subjected to this procedure and thus, any potential influence of fat on the pH measurement would be uniform across all samples. Further understanding of whether the pH of MOM at the time of feedings has clinical relevance (i.e., influence on preterm infant health outcomes) needs to be explored in future work. In addition, given the observed association between the pH of MOM and the duration of refrigerator storage in clinical practice, there may be an opportunity to modify clinical guidelines (i.e., decrease the length of refrigeration) in ways that may optimize the pH of MOM and thereby, promote favorable health outcomes among preterm infants.
When comparing the pH of human milk as a function of type, the mean pH of PDHM (6.44±0.043) was significantly lower than the mean pH of MOM (6.60±0.28), possibly owing to differences in how PDHM is processed and stored compared to MOM. There are a limited number of studies analyzing the pH of PDHM with mixed results. In contrast to the slightly alkaline pH of PDHM reported by Vasquez-Roman et al. (7.30±0.18), the mean pH of our PDHM samples was slightly acidic, which is consistent with the findings by Donovan et al. and Slutzah et al. (6.56±0.27 and 6.3±0.1, respectively) (23,29,32). Additionally, Vasquez-Roman et al. reported a gradual increase in the pH of refrigerated PDHM over the course of 14 days, while Slutzah et al. and Tobio-Gimeno et al. reported that the pH of PDHM remained stable during the 96-hour refrigerator storage (29,32,33). Our PDHM samples were refrigerated for no more than two days as part of standard clinical practice, which likely minimized the potential influence, if any, of refrigeration on the pH of PDHM. Since the average length of freezer storage was comparable between PDHM and MOM (16.2±4.1 months and 18.5±4.3 months, respectively) and there are no studies that we are aware of that assess the influence of freezer storage time on the pH of PDHM, this variable generated no further exploration in the analysis. The narrower pH range of PDHM (6.38–6.51) compared to MOM (6.09–7.29) that we found could be explained by the fact that PDHM consists of pooled milk from multiple donors. The pooling process may mask the influence of any extreme pH values that individual PDHM samples might have contributed, thereby attenuating potential variability in the pH measurement. In addition, PDHM has been subjected to both home and milk bank storage prior to administration in the clinical environment, which may alter the pH to a more uniform value across PDHM samples. It should be noted that we collected a modest number of PDHM samples in our study because we did not conduct a longitudinal analysis with these samples, and also because the NICU clinical workflow and protocols leave a very short time window for PDHM to be collected prior to fortification. Future research should use a larger sample size and explore factors unique to PDHM that may influence its composition and chemical properties (e.g., pH)
When comparing human milk by fortification status, fortified MOM was significantly (p<0.001) more acidic than MOM (pH of 6.19 vs. 6.60, respectively). Given that fortifiers were found to be acidic on their own, in spite of not being designated by the manufacturer as acidified fortifiers, we hypothesize that they do in fact act as acidifying agents when added to human milk. We also observed a similar trend in acidification in fortified PDHM relative to PDHM (pH of 6.27 vs. 6.44, respectively), although it should be noted this finding was only approaching significance (p=0.060), possibly due to our modest number of PDHM samples. While the differences in the mean pH between MOM and fortified MOM, and PDHM and fortified PDHM might seem small (0.40 and 0.17, respectively), this change is on a logarithmic scale. A study by Donovan et al. reported a similar decrease in the pH of human milk following the addition of HMF, specifically the pH of preterm MOM decreased from 6.81±0.30 to 6.28±0.15 and the pH of preterm PDHM decreased from 6.42±0.17 to 6.34±0.18 (23). Overall, our findings highlight the need for greater clarity on the pH of nutritional fortifiers and their classification and labeling with respect to being acidic.
pH of MOM is Associated with PPD and PMA but not with Other Maternal Factors
Although select maternal factors (e.g., preterm delivery, BMI, parity, diet) have been shown to influence the composition of human milk, we found no association between the pH of MOM and maternal age, BMI at delivery, GA at delivery, parity, race/ethnicity, mode of delivery, multiple gestation, preeclampsia/eclampsia, chronic hypertension, or diabetes (9,34–38). However, interestingly, we observed that the pH of MOM was negatively associated with PPD and PMA. Since PMA is calculated as a sum of GA at delivery and PPD, and yet GA at delivery was not significantly associated with the pH of MOM, our findings suggest that the number of days since birth and the commencement of lactogenesis (represented by PPD) is the single best predictor of the pH of MOM. We hypothesize that the regulatory mechanism governing the pH of MOM is independent of the length of gestation and, rather, may be triggered by labor and birth. Additionally, it is possible that certain maternal factors immediately preceding or during labor and birth may also play a role in influence the pH of MOM and thus, additional intrapartum variables (e.g., chorioamnionitis, placental abruption, duration of latency period after rupture of membranes, interventions and medications during labor) should be collected and analyzed in future studies.
pH of MOM is Associated with Dietary Intake of Vegetables and Fiber
In the subset of mothers who completed the DSQ, the pH of MOM was found to be inversely associated with vegetable and fiber intake in the last month of the pregnancy. There was no significant association between the pH of MOM and other dietary factors (dairy, fruit, added sugar, whole grains, or calcium). The collinearity we found among dietary variables is common; future research may incorporate a more robust assessment of the diet that includes macro- and micro-nutrients (e.g., Food Frequency Questionnaire, 24-hour Dietary Recall) (39).
Evidence suggests that dietary components may have a pH-altering potential that influences the acid–base balance of the body, resulting in complications such as diet-induced metabolic acidosis (40). In particular, vegetables and fiber are thought to be alkaline-producing foods; however, our findings suggest that a higher intake of vegetables and fiber is associated with a more acidic pH of MOM. Thus, while diet may modulate the pH of MOM, its mechanism could differ from that governing systemic pH.
pH of MOM Decreases Over PPD, while pH of Fortified MOM Increases Over PPD
Our linear mixed model suggests a significant change in the pH of MOM over the postpartum course of lactation, with a significant interaction between PPD and fortification status while controlling for refrigerator storage time. Freezer storage time was also considered as a covariate but was ultimately excluded from the model as it did not change the effect size. The pH of MOM gradually decreased over PPD, revealing the natural tendency of MOM to become more acidic over the postpartum period. We hypothesize that there are three main factors responsible for this trend. First, lipid concentration has been shown to increase over lactation. This may result in higher rates of lipolysis and, consequently, higher concentrations of free fatty acids (FFAs) available to increase the hydrogen ion concentration in MOM later in lactation (6). Second, lactose concentration has been shown to increase over lactation, which likely creates a favorable environment for lactic acid bacteria to proliferate and convert more lactose to lactic acid, thereby contributing to the acidification of MOM over lactation (6). Third, protein, a major constituent governing the buffering capacity of milk, is known to decline over lactation, which may result in a decreased buffering capacity of MOM and, subsequently, more susceptibility to acidification later in lactation (6,41). Taken together, these intrinsic changes in the composition of MOM may influence the pH over the postpartum period.
In contrast to the trend observed in the pH of MOM, the pH of fortified MOM gradually increased over PPD, which is counterintuitive in light of the acidic nature of the nutritional fortifiers. We hypothesize that the exogenous acidity introduced by HMF and PF is counteracted by the biochemical interaction between these fortifiers and human milk. Using the same three factors discussed above, we propose that the following interactions between the fortifiers and MOM play a role in the overall pH of fortified MOM. First, acidification of human milk with citric acid has been shown to decrease the activity of lipase (22). We suspect that a similar decrease in lipase activity could result from the addition of acidic HMF and PF, especially, since the amount of PF added to MOM is increased over the postnatal period to support the growing needs of preterm infants. Consequently, despite an intrinsically higher concentration of lipids over lactation, there may be a decrease in the lipase activity due to the presence of fortifiers, resulting in a lower concentration of FFAs in the fortified MOM over lactation. Second, despite an intrinsic increase in the amount of lactose, the addition of fortifiers may create a milk environment with less favorable conditions for lactic acid bacteria, resulting in a lower concentration of lactic acid in the fortified MOM over PPD. Third, greater amounts of fortifiers, which are high in protein, are being added to fortified MOM over the postnatal period to provide adequate nutrition to preterm infants. Additional protein may counteract the intrinsic decline in protein in MOM over lactation, thereby increasing the buffering capacity of fortified MOM and making it less susceptible to acidification over PPD. Taken together, it is possible that the interaction between the fortifiers and the intrinsic components of MOM over the postpartum period results in a net shift in the pH towards less acidic values. While the influence of fortification on pH seems to decrease over time, the acidification of MOM early in the postnatal period may have significant consequences for the preterm infant.
Two separate sensitivity analyses were performed in a subset of study participants: the first controlled for dietary factors (by including fiber and vegetable intake as confounders) and the second reduced between-subject variability (by excluding mothers with only MOM and only fortified MOM samples). However, neither analyses produced a change in the effect size, indicating that our initial model is robust.
Strengths, Limitations, and Future Work
Our study was observational and exploratory in nature, generating hypotheses for future research that involves larger sample sizes, pairwise comparisons pre- and post-fortification, replicate pH measurements, and additional clinical data from the mother-infant dyads. Our data suggest that the pH of human milk fed to preterm infants differs by type and, most notably, that the pH of MOM is associated with fortification status, postpartum day, and maternal vegetable/fiber intake. We are not aware of any studies to date that have empirically measured the pH of human milk while accounting for similar clinical variables. We acknowledge that some of our null findings should be treated with caution as our modest sample size reduced statistical power.
Several studies have explored infant outcomes based on nutritional exposure to fortifiers labeled as “acidified.” These studies have shown that infants fed human milk with an acidified fortifier have a higher incidence of metabolic acidosis, feeding intolerance, NEC, and poorer weight gain, which underscores the importance of studying the pH of human milk and its role in the health of preterm infant (42–46) (Supplemental Figure 1).
We hypothesize that the pH of human milk (MOM and PDHM) may be a modifiable factor, influencing milk biology and, in turn, infant health outcomes. Additional research is needed to assess this relationship and to potentially establish a favorable pH range of human milk that may promote optimal infant intestinal biology (e.g., microbiome) and lower the risk of a negative clinical sequelae among preterm infants, notably gastrointestinal disorders (e.g., NEC). Furthermore, the role of pH should be considered with respect to the composition and function of bioactive factors (e.g., immunoglobulins, growth factors, oligosaccharides, and bacteria) found in the milk (47). If the pH is shown to influence them, then the pH-modifying additives such as nutritional fortifiers could have significant immunological implications for preterm infants. The development of novel nutritional interventions aimed at modulating the pH of human milk, optimizing its immunological profile, and improving selected infant health outcomes represents an important area of future research in perinatal and neonatal research.
Supplementary Material
Acknowledgements:
The authors would like to acknowledge Tina Steele for assisting with subject recruitment and Emily Woods for assisting with sample processing.
Funding:
This work was supported by the NIH grant R21NR017256 (Gregory).
Footnotes
Conflict of Interest: KEG is a consultant for Astarte Medical. No other authors declare any competing interests in conducting or reporting this work.
Ethics Approval: The study protocol and all study procedures, including written informed consent, were reviewed and approved by the Mass General Brigham Human Research Committee (protocol # 2016P001020). This study was performed in accordance with the Declaration of Helsinki.
Availability of Data and Materials: All data were collected with permission to make publicly available. The authors will share de-identified data upon request without any restrictions.
Supplementary information is available at JPER’s website.
References
- 1.American Academy of Pediatrics. Section on Breastfeeding. Breastfeeding and the use of human milk. Pediatrics 2012;129(3):e827–41. [DOI] [PubMed] [Google Scholar]
- 2.Ip S, Chung M, Raman G, Chew P, Magula N, DeVine D, et al. Breastfeeding and maternal and infant health outcomes in developed countries. Evid Rep Technol Assess (Full Rep) 2007. Apr;(153). [PMC free article] [PubMed] [Google Scholar]
- 3.Sullivan S, Schanler RJ, Kim JH, Patel AL, Trawöger R, Kiechl-Kohlendorfer U, et al. An exclusively human milk-based diet is associated with a lower rate of necrotizing enterocolitis than a diet of human milk and bovine milk-based products. J Pediatr 2010. Apr;156(4). [DOI] [PubMed] [Google Scholar]
- 4.Furman L, Taylor G, Minich N, Hack M. The effect of maternal milk on neonatal morbidity of very low-birth-weight infants. Arch Pediatr Adolesc Med 2003. Jan;157(1). [DOI] [PubMed] [Google Scholar]
- 5.Schanler RJ, Shulman RJ, Lau C. Feeding strategies for premature infants: beneficial outcomes of feeding fortified human milk versus preterm formula. Pediatrics 1999. Jun;103(6 Pt 1). [DOI] [PubMed] [Google Scholar]
- 6.Gidrewicz DA, Fenton TR. A systematic review and meta-analysis of the nutrient content of preterm and term breast milk. BMC Pediatr 2014. Aug 30;14. [DOI] [PMC free article] [PubMed] [Google Scholar]
- 7.Castellote C, Casillas R, Ramírez-Santana C, Pérez-Cano FJ, Castell M, Moretones MG, et al. Premature delivery influences the immunological composition of colostrum and transitional and mature human milk. J Nutr 2011. Jun;141(6). [DOI] [PubMed] [Google Scholar]
- 8.Steele CL, Collins EA. Infant and pediatric feedings: guidelines for preparation of human milk and formula in health care facilities. Academy of Nutrition and Dietetics; 2018. [Google Scholar]
- 9.Bravi F, Wiens F, Decarli A, Dal Pont A, Agostoni C, Ferraroni M. Impact of maternal nutrition on breast-milk composition: a systematic review. Am J Clin Nutr 2016. Sep;104(3). [DOI] [PubMed] [Google Scholar]
- 10.Michaelsen KF, Skafte L, Badsberg JH, Jørgensen M. Variation in macronutrients in human bank milk: influencing factors and implications for human milk banking. J Pediatr Gastroenterol Nutr 1990. Aug;11(2). [DOI] [PubMed] [Google Scholar]
- 11.Sims CR, Lipsmeyer ME, Turner DE, Andres A. Human milk composition differs by maternal BMI in the first 9 months postpartum. Am J Clin Nutr 2020;112(3). [DOI] [PMC free article] [PubMed] [Google Scholar]
- 12.Daniel AI, Shama S, Ismail S, Bourdon C, Kiss A, Mwangome M, et al. Maternal BMI is positively associated with human milk fat: a systematic review and meta-regression analysis. Am J Clin Nutr 2021;113(4). [DOI] [PMC free article] [PubMed] [Google Scholar]
- 13.Perrin MT, Belfort MB, Hagadorn JI, McGrath JM, Taylor SN, Tosi LM, et al. The nutritional composition and energy content of donor human milk: a systematic review. Adv Nutr 2020;11(4):960–70. [DOI] [PMC free article] [PubMed] [Google Scholar]
- 14.Hård A, Nilsson AK, Lund A, Hansen‐Pupp I, Smith LEH, Hellström A. Review shows that donor milk does not promote the growth and development of preterm infants as well as maternal milk. Acta Paediatr 2019;108(6):998–1007. [DOI] [PMC free article] [PubMed] [Google Scholar]
- 15.Cordova EG, Soldateli B, Rosner B, Drouin K, Davitt E, Pepin HL, et al. Growth and Clinical Outcomes of Very Low‐Birth‐Weight Infants Receiving Acidified vs Nonacidified Liquid Human Milk Fortifiers. Nutr Clin Pract 2020; [DOI] [PubMed] [Google Scholar]
- 16.Duar RM, Kyle D, Casaburi G. Colonization resistance in the infant gut: the role of B. infantis in reducing pH and preventing pathogen growth. High-throughput 2020;9(2):7. [DOI] [PMC free article] [PubMed] [Google Scholar]
- 17.Brown JVE, Lin L, Embleton ND, Harding JE, McGuire W. Multi‐nutrient fortification of human milk for preterm infants. Cochrane Database Syst Rev 2020;(6). [DOI] [PMC free article] [PubMed] [Google Scholar]
- 18.Mead Johnson Nutrition. Enfamil Human Milk Fortifier Acidified Liquid [Internet] [cited 2021. Oct 22]. Available from: https://www.hcp.meadjohnson.com/s/product/a4R4J000000PpR7UAK/enfamil-human-milk-fortifier-acidified-liquid [Google Scholar]
- 19.Abbott Nutrition. Similac Human Milk Fortifier Concentrated Liquid [Internet] [cited 2021. Oct 22]. Available from: https://abbottnutrition.com/similac-human-milk-fortifier-concentrated-liquid [Google Scholar]
- 20.Hanna Instuments. Resources: Measuring pH in Acidified Foods [Internet] [cited 2022. Apr 19]. Available from: https://www.hannainst.com/resource-page [Google Scholar]
- 21.Thompson FE, Midthune D, Kahle L, Dodd KW. Development and evaluation of the National Cancer Institute’s Dietary Screener Questionnaire scoring algorithms. J Nutr 2017;147(6):1226–33. [DOI] [PMC free article] [PubMed] [Google Scholar]
- 22.Erickson T, Gill G, Chan GM. The effects of acidification on human milk’s cellular and nutritional content. J Perinatol 2013. May;33(5). [DOI] [PubMed] [Google Scholar]
- 23.Donovan R, Kelly SG, Prazad P, Talaty PN, Lefaiver C, Hastings ML, et al. The effects of human milk fortification on nutrients and milk properties. J Perinatol 2017;37(1). [DOI] [PubMed] [Google Scholar]
- 24.Codipilly CN, Koppel A, Ranasinghe O, Roffe S, Ahn S, Navarathna M, et al. Effects of human milk fortifier properties on intrinsic probiotic bacteria. J Perinat Med 2020. Feb 25;48(2). [DOI] [PubMed] [Google Scholar]
- 25.Demers-Mathieu V, Qu Y, Underwood MA, Borghese R, Dallas DC. Premature Infants have Lower Gastric Digestion Capacity for Human Milk Proteins than Term Infants. J Pediatr Gastroenterol Nutr 2018. May;66(5). [DOI] [PMC free article] [PubMed] [Google Scholar]
- 26.Morriss FH, Brewer ED, Spedale SB, Riddle L, Temple DM, Caprioli RM, et al. Relationship of human milk pH during course of lactation to concentrations of citrate and fatty acids. Pediatrics 1986. Sep;78(3). [PubMed] [Google Scholar]
- 27.Ogundele MO. Effects of storage on the physicochemical and antibacterial properties of human milk. Br J Biomed Sci 2002;59(4). [DOI] [PubMed] [Google Scholar]
- 28.Harrison VC, Peat G. Significance of milk pH in newborn infants. Br Med J 1972. Dec 2;4(5839). [DOI] [PMC free article] [PubMed] [Google Scholar]
- 29.Slutzah M, Codipilly CN, Potak D, Clark RM, Schanler RJ. Refrigerator storage of expressed human milk in the neonatal intensive care unit. J Pediatr 2010. Jan;156(1). [DOI] [PubMed] [Google Scholar]
- 30.Ahrabi AF, Handa D, Codipilly CN, Shah S, Williams JE, McGuire MA, et al. Effects of Extended Freezer Storage on the Integrity of Human Milk. J Pediatr 2016. Oct;177:140–3. [DOI] [PubMed] [Google Scholar]
- 31.Coppola L, Cianflone A, Grimaldi AM, Incoronato M, Bevilacqua P, Messina F, et al. Biobanking in health care: evolution and future directions. J Transl Med 2019. May;17(1):172. [DOI] [PMC free article] [PubMed] [Google Scholar]
- 32.Vázquez-Román S, Escuder-Vieco D, Martín-Pelegrina MD, Muñoz-Amat B, Fernández-Álvarez L, Brañas-García P, et al. Short communication: Effect of refrigerated storage on the pH and bacterial content of pasteurized human donor milk. J Dairy Sci 2018. Dec;101(12). [DOI] [PubMed] [Google Scholar]
- 33.Tobío-Gimeno A, Escuder-Vieco D, Flores-Antón B, Vázquez-Román S, Pallás-Alonso CR. Changes in Pasteurized Donor Human Milk during Refrigeration. Vol. 32, Journal of human lactation : official journal of International Lactation Consultant Association United States; 2016. p. 763. [DOI] [PubMed] [Google Scholar]
- 34.Bauer J, Gerss J. Longitudinal analysis of macronutrients and minerals in human milk produced by mothers of preterm infants. Clin Nutr 2011. Apr;30(2). [DOI] [PubMed] [Google Scholar]
- 35.Bachour P, Yafawi R, Jaber F, Choueiri E, Abdel-Razzak Z. Effects of smoking, mother’s age, body mass index, and parity number on lipid, protein, and secretory immunoglobulin A concentrations of human milk. Breastfeed Med 2012. Jun;7(3). [DOI] [PubMed] [Google Scholar]
- 36.Burianova I, Bronsky J, Pavlikova M, Janota J, Maly J. Maternal body mass index, parity and smoking are associated with human milk macronutrient content after preterm delivery. Early Hum Dev 2019;137. [DOI] [PubMed] [Google Scholar]
- 37.Cortes-Macías E, Selma-Royo M, García-Mantrana I, Calatayud M, González S, Martínez-Costa C, et al. Maternal Diet Shapes the Breast Milk Microbiota Composition and Diversity: Impact of Mode of Delivery and Antibiotic Exposure. J Nutr 2021;151(2). [DOI] [PMC free article] [PubMed] [Google Scholar]
- 38.Seferovic MD, Mohammad M, Pace RM, Engevik M, Versalovic J, Bode L, et al. Maternal diet alters human milk oligosaccharide composition with implications for the milk metagenome. Sci Rep 2020;10(1). [DOI] [PMC free article] [PubMed] [Google Scholar]
- 39.Maki KC, Slavin JL, Rains TM, Kris-Etherton PM. Limitations of observational evidence: implications for evidence-based dietary recommendations. Adv Nutr 2014. Jan 1;5(1). [DOI] [PMC free article] [PubMed] [Google Scholar]
- 40.Pizzorno J, Frassetto LA, Katzinger J. Diet-induced acidosis: is it real and clinically relevant? Br J Nutr 2010. Apr;103(8). [DOI] [PubMed] [Google Scholar]
- 41.Salaün F, Mietton B, Gaucheron F. Buffering capacity of dairy products. Int Dairy J 2005;15(2):95–109. [Google Scholar]
- 42.Cibulskis CC, Armbrecht ES. Association of metabolic acidosis with bovine milk-based human milk fortifiers. J Perinatol 2015. Feb;35(2). [DOI] [PubMed] [Google Scholar]
- 43.Thoene M, Hanson C, Lyden E, Dugick L, Ruybal L, Anderson-Berry A. Comparison of the effect of two human milk fortifiers on clinical outcomes in premature infants. Nutrients 2014. Jan 3;6(1). [DOI] [PMC free article] [PubMed] [Google Scholar]
- 44.Kumar N, Monga R, Sampath V, Ehrhart B. Prospective Comparison of Enfamil and Similac Liquid Human Milk Fortifier on Clinical Outcomes in Premature Infants. Am J Perinatol 2017;34(14). [DOI] [PubMed] [Google Scholar]
- 45.Lainwala S, Kosyakova N, Spizzoucco AM, Herson V, Brownell EA. Clinical and nutritional outcomes of two liquid human milk fortifiers for premature infants. J Neonatal Perinatal Med 2017;10(4). [DOI] [PubMed] [Google Scholar]
- 46.Darrow CJ, Bai-Tong SS, Kang EM, Thompson CL, Walsh MC. Use of acidified versus non-acidified liquid human milk fortifier in very low birth weight infants: A retrospective comparison of clinical outcomes. J Neonatal Perinatal Med 2020;13(1). [DOI] [PubMed] [Google Scholar]
- 47.Thai JD, Gregory KE. Bioactive Factors in Human Breast Milk Attenuate Intestinal Inflammation during Early Life. Nutrients 2020. Feb 23;12(2). [DOI] [PMC free article] [PubMed] [Google Scholar]
Associated Data
This section collects any data citations, data availability statements, or supplementary materials included in this article.