

Abstract
Pathogenic variants on the X-chromosome can have more severe consequences for hemizygous males, while heterozygote females can avoid severe consequences due to diploidy and the capacity for nonrandom expression. Thus, when an allele is more common in females this could indicate that it increases the probability of early death in the male hemizygous state, which can be considered a measure of pathogenicity. Importantly, large-scale genomic data now makes it possible to compare allele proportions between the sexes. To discover pathogenic variants on the X-chromosome, we analyzed exome data from 125,748 ancestrally diverse participants in the Genome Aggregation Database (gnomAD). After filtering out duplicates and extremely rare variants, 44,606 of the original 348,221 remained for analysis. We divided the proportion of variant alleles in females by the proportion in males for all variant sites, and then placed each variant into one of three a priori categories: 1) Reference (Primarily synonymous and intronic), 2) Unlikely-to-be-Tolerated (Primarily missense), and 3) Least-likely-to-be-tolerated (Primarily frameshift). To assess the impact of ploidy, we compared the distribution of these ratios between pseudoautosomal and non-pseudoautosomal regions. In the non-pseudoautosomal regions, mean female-to-male ratios were lowest among Reference (2.40), greater for Unlikely-to-be-Tolerated (2.77) and highest for Least-likely-to-be-tolerated (3.28) variants. Corresponding ratios were lower in the pseudoautosomal regions (1.52, 1.57, and 1.68, respectively), with the most extreme ratio being just below 11. Because pathogenic effects in the pseudoautosomal regions should not drive ratio increases, this maximum ratio provides an upper-bound for baseline noise. In the non-pseudoautosomal regions, 319 variants had a ratio over 11. In sum, we identified a measure with a data-set specific threshold for identifying pathogenicity in non-pseudoautosomal X-chromosome variants: the female-to-male allele proportion ratio.
Keywords: X linked disease, Variant pathogenicity, Pseudo autosomal region, Hemizygosity
Introduction
For some time now it has been recognized that deleterious genetic variants on the X-chromosome can have more severe pathological consequences for males (Migeon, 2020). In fact, long before we could directly detect genetic variation with molecular assays, clinicians observed and described sex-specific X-linked inheritance patterns (Dobyns et al., 2004). In general, these conditions were recognized because females are less likely to be symptomatic than males (Dobyns et al., 2004). This pattern emerges because females have a biological advantage: a second X-chromosome and the capacity to preferentially silence one of them through X-inactivation (Migeon, 2007). This process can mitigate the impact of a deleterious genetic variant on the X-chromosome, and although females can still experience some consequences due to the incomplete or skewed nature of X-inactivation or somatic mosaicism (Dobyns et al., 2004), hemizygosity may generate distinct selection pressures in the two sexes. These differences present an untapped source of evidence for predicting variant pathogenicity.
X-chromosome variants that have severe pathologic consequences in males, such as those that are embryonic lethal or they increase the probability of early death, are rarely observed in males, but they may be considerably more common in females. Correspondingly, when the frequency of an X-chromosome variant is much lower among males, it is reasonable to suspect that it is pathogenic. This logic is not complex, but until recently we have not had the genomic data to test this hypothesis or leverage it for pathogenicity inference. Here we use the Genome Aggregation Database (gnomAD), to document the impact of this presumption using genomic data for the first time. We chose gnomAD because it has a very large number of participants and variants measured, as well as a relatively diverse set of ancestries (Konrad Karczewski & Laurent Francioli, 2017). Specifically, we hypothesize that non-pseudoautosomal (Non-PAR) X-chromosome alleles that are less frequent in males will be pathogenic. Thus, this approach may help us to address a structural weakness in X chromosome research, and it may later help us to learn about diseases that display sexual dimorphism (Migeon, 2007).
Material and Methods
Data Source
The data was downloaded from the Genome Aggregation Database (gnomAD) https://gnomad.broadinstitute.org/ on June 17, 2020 (File: V2 - GRCh37/hg19 reference sequence Gnomad.exomes.r2.1.1.sites.X.vcf.bg). The original database is an aggregate convenience sample collected from 141,456 participants in primarily case control studies (Karczewski et al., 2020). There were 64,754 females and 76,702 males. The downloaded file contained Exome data from 125,748 participants with diverse ancestry: European, Asian, South Asian, African, Ashkenazi Jewish, and Admixed American. Full quality control and analytic details are available elsewhere (Karczewski et al., 2020), but in brief, samples were excluded for ambiguous sex, sex aneuploidy, evidence of high contamination, low call rates (<0.895) and low coverage (mean chromosome 20 coverage less than 15) (Karczewski et al., 2020). The exome file contained 403,970 X-chromosome variants, and 348,221 of these passed the initial gnomAD quality control. In some cases, a single locus was listed more than once. We called these duplicates and we deleted both as we needed to assess unambiguous variant frequencies. After removing 52,583 duplicates, there were 295,638 sites for analysis. Many of the variants were too rare to provide interpretable information with respect to a sex ratio, thus we removed sites where the minor allele count was less than 5 in females. This left us with 44,606 sites for analyses.
Categorization of Variants
Some genetic variants are expected to create little or no change in protein expression level, structure, or function, and thus are theoretically less likely to be highly pathogenic. Although, some synonymous changes have been shown to be non-neutral with respect to selection and therefore functional at some level (Chamary et al., 2006; Zeng & Bromberg, 2019), these variants are theoretically less likely to confer deleterious effects. We considered these and several other variant types to have a relatively low likelihood of pathogenicity and used these as the composite reference group for our analyses. The annotations for determining variant type were obtained directly from the downloaded gnomAD files. The Reference group contained: 3_prime_UTR_variant, 5_prime_UTR_variant, downstream_gene_variant, intergenic_variant, intron_variant, intron_variant&non_coding_transcript_variant, and synonymous_variant, upstream_gene_variant , and the majority were intronic and synonymous variants (as listed in Table S1). While there can be some debate about which variants are least likely to produce a pathogenic effect, we developed consensus that these 8 categories were most likely to be relatively neutral (not lethal prior to adulthood) and hence in more equal proportions in males versus females. We expect that variants in the Reference group on the X chromosome would be expected to have the most similar allele proportions in males and females. We placed other categories of variants into two additional groups: Unlikely-to-be-tolerated and Least-likely-to-be-tolerated. (Table S1). A small number of variants were labelled as Unclear, because we had no a priori ideas about the probability of pathogenicity in variants with these labels. In short, we used a group of primarily synonymous and intronic variants as our baseline for tolerability (negative controls) in our first analysis. Our hypothesis in this first analysis is that the allele proportion ratio will be higher in the Unlikely-to-be-Tolerated (Primarily missense) and Least-likely-to-be-tolerated (Primarily frameshift) categories than this referent group.
In addition to variant type, variant location was leveraged to establish another baseline: the range of ratios that can occur when pathogenicity is unlikely to affect the ratio. Variants in the pseudoautosomal regions (PARs) function like autosomal variants, and thus these variant proportions should be more similar in males and females than variants in hemizygous locations. In short, when these variants are pathogenic, their frequency should not be lower in males. Therefore, the highest ratio observed in the PAR variants estimates the scope of the background noise in ratio variation. Any ratio in the Non-PAR variants that is larger than the highest ratio observed in the PAR variants would be demonstrating a ratio elevation that is distinguishable from background noise. In sum, we hypothesize that the female-to-male allele proportion ratio will be lowest for Reference variants, and highest for Least-likely-to-be-tolerated variants. Furthermore, we expect the highest ratio observed in the PAR variants will provide an empirical threshold for pathogenicity among the Non-PAR variants. Non-PAR variants with female to male allele proportion ratios above this empirical threshold would provide evidence of severe early life pathogenicity.
Analysis
To test these hypotheses, we divided the allele proportion in females by the allele proportion in males to generate a ratio for each of the 44,606 variants. To avoid dividing by zero, 1 was added to the numerator and denominator of each proportion before creating the ratio.
R: allele proportion ratio
Vf: the minor allele count in females
Af: the total allele count in females
Vm: the minor allele count in males
Am: the total allele count in males
We log2 transformed these ratios prior to running statistical tests as they were positively skewed. We then conducted Unequal Variance (Welch-Satterthwaite) t-tests to determine if the ratios differed between the variant categories. We compared the ratios among Reference variants to the ratios among Unlikely-to-be-tolerated variants and Least-likely-to-be-tolerated variants. We conducted these tests in three groups of variants: 1) all variants, 2) Non-PAR variants only, and 3) PAR variants only. We also graphed all ratios by their location on the X-chromosome and highlighted the distribution of ratios within the PAR regions: PAR1, PAR2, and the X-transposed region (XTR). Note that the XTR is a large PAR that is thought to recombine infrequently (Cotter et al., 2016). Because the biology defines an empirical threshold, the highest observed ratio in the PAR regions, traditional statistical tests will be of limited use because they ignore this empirical internal standard. Stated differently, unless a high percentage of observed variants are pathogenic, they may not generate significant shifts in measures of central tendency (mean ratios). However, if even a small percentage of the observed variants are pathogenic, they would be expected to increase the spread (standard deviation) of the ratios in the Non-PAR regions. To assess if this expected pattern was present, we conducted an F-test for equality of variances between PAR and Non-PAR variants. Finally, we assessed how PAR to Non-PAR differences changed with minor allele frequency. Specifically, we used F-tests and Unequal Variance (Welch-Satterthwaite) t-tests to evaluate if the PAR to Non-PAR differences were similar in four strata defined by minor allele frequency (Table S2; Modified MAF <0.1%, 0.1%-<1%, 1%-<5%, ≥5%).
Finally, we investigated our high ratio variants with two databases to assess external corroborating evidence of pathogenicity. Online Mendelian Inheritance in Man (McKusick-Nathans Institute of Genetic Medicine, 2022) compiles published data on genes that have high penetrance variants. These genes have variants that were linked to disease primarily in small clinical or pedigree studies. We checked to see how many of the genes identified in our high ratio variants had OMIM based evidence that the gene was linked to any disease. We also accessed ClinVar that focuses on site specific evidence of pathogenicity observed primarily in large association studies (Landrum et al., 2018). ClinVar relies on genomic data owners to submit these crude pathogenicity assessments, but often the supporting evidence is sparse or not provided. However, this is the most holistic database of site-specific pathogenicity assessments, and thus we checked to see if any of our identified variants had evidence of pathogenicity listed in a ClinVar entry. As a last step we used the SCREEN function in the ENCODE database (Moore et al., 2020) to evaluate if any of our identified high ratio variants were within putative cis regulatory elements.
Results
We identified 44,606 X-chromosome variants in the gnomAD database with a minor allele count of at least 5 in females, and 2070 of these variants were in the pseudoautosomal regions (PAR). The boundaries of these regions are not thought to be rigid (Cotter et al., 2016), but we utilized the most up to date boundary estimates available (Webster et al., 2019). Two of the 44,606 variants could not be classified, but the remainder were assigned a Reference, Unlikely-to-be-tolerated, or Least-likely-to-be-tolerated, classification based on their variant annotation (Table 1). Reference variants were considered to have a relatively low probability of being pathogenic. Unlikely-to-be-tolerated variants were considered intermediate, and Least-likely-to-be-tolerated variants were deemed to have the highest probability of being pathogenic. These a priori distinctions were based solely on the variant annotation (missense, synonymous, etc.).
Table 1.
Categorization of Variants: Probability of Pathogenicity Based on Variant Type
| Variant Type (Probability of pathogenicity based on annotation) | Number of Variants That Passed gnomAD Quality Control (n=348,221) | Number of Variants After Removing Duplicates and Rare Variants (n=44,606) |
|---|---|---|
| Reference (Primarily synonymous and intronic) | 205,042 | 28,309 |
| Unlikely to be Tolerated (Primarily missense) | 120,291 | 13,816 |
| Least likely to be Tolerated (Primarily frameshift and stop loss/gain) | 22,869 | 2,479 |
| Unclear (Variant annotation with unclear implications) | 19 | 2 |
For all variants, we divided the allele proportion in females by the allele proportion in males, and we observed that the mean female-to-male ratio increased when moving from Reference, to Unlikely-to-be-Tolerated, to Least-likely-to-be-tolerated (Table 2). This pattern was prominent in the Non-PAR variants but almost imperceptible in the PAR variants, where the mean ratios were smaller in all categories. In the Non-PAR regions, the mean ratio in the Least-likely-to-be-tolerated category (3.28) was significantly higher than that of the reference category (3.28 vs 2.40; p=0.019). In the PAR regions there was no difference in these mean ratios (1.52 vs. 1.67; p=0.433).
Table 2.
Female to male allele proportion ratio for variants on the X-chromosome
| Variants with a female minor allele count of at least 5 | ||||||||
|---|---|---|---|---|---|---|---|---|
| N | Mean | Median | SD | Min | Max | p-value for difference in variance a after log2 transformation | p-value for difference in mean b after log2 transformation | |
| All Variants | 44,606 | 2.52 | 1.22 | 43.36 | 0.05 | 6,937.54 | NA | NA |
| Unclear-Tolerability | 2 | 2.22 | 2.22 | 1.81 | 0.93 | 3.50 | NA | NA |
| Reference | 28,309 | 2.35 | 1.22 | 24.79 | 0.05 | 2,186.60 | reference | reference |
| Unlikely-to-be-Tolerated | 13,816 | 2.72 | 1.20 | 68.35 | 0.05 | 6,937.54 | <0.001 | 0.184 |
| Least-likely-to-be-tolerated | 2,479 | 3.20 | 1.23 | 27.83 | 0.16 | 1,246.70 | <0.001 | 0.014 |
| Variants with a female minor allele count of at least 5 in the Non-PAR | ||||||||
| N | Mean | Median | SD | Min | Max | p-value for difference in variance a after log2 transformation | p-value for difference in mean after log2 transformation b | |
| All Variants | 42,536 | 2.56 | 1.21 | 44.40 | 0.05 | 6,937.54 | NA | NA |
| Unclear-Tolerability | 2 | 2.22 | 2.22 | 1.81 | 0.93 | 3.50 | NA | NA |
| Reference | 26,928 | 2.40 | 1.22 | 25.41 | 0.05 | 2,186.60 | reference | reference |
| Unlikely-to-be-Tolerated | 13,249 | 2.77 | 1.20 | 69.80 | 0.05 | 6,937.54 | <0.001 | 0.171 |
| Least-likely-to-be-tolerated | 2,357 | 3.28 | 1.23 | 28.54 | 0.17 | 1,246.70 | <0.001 | 0.019 |
| Variants with a female minor allele count of at least 5 in the PAR | ||||||||
| N | Mean | Median | SD | Min | Max | p-value for difference in variance after log2 transformation a | p-value for difference in mean after log2 transformation b | |
| All Variants | 2,070 | 1.54 | 1.30 | 1.04 | 0.10 | 10.60 | NA | NA |
| Unclear-Tolerability | NA | NA | NA | NA | NA | NA | NA | NA |
| Reference | 1,381 | 1.52 | 1.30 | 0.98 | 0.12 | 10.60 | reference | reference |
| Unlikely-to-be-Tolerated | 567 | 1.57 | 1.30 | 1.15 | 0.10 | 8.46 | 0.199 | 0.845 |
| Least-likely-to-be-tolerated | 122 | 1.67 | 1.29 | 1.24 | 0.16 | 7.21 | 0.039 | 0.433 |
F-test for equality of variances
Unequal Variance (Welch-Satterthwaite) t-tests
When we graphed the female to male ratios for all the variants across X-chromosome locations (Figure 1 and 2) we observed many high ratio variants, but none of these fell within the PARs. All the ratios in PAR1, PAR2, and the XTR were less than 11. Among all Non-PAR variants, 0.8% (319/42536) had ratios above 11. Among the Least-likely-to-be-tolerated Non-PAR variants, 1.9% were above 11 (45/2357). This percentage was lower for Non-PAR Reference (0.8%; 211/26928) and Non-PAR Unlikely-to-be-Tolerated variants (0.5%; 63/13249). Furthermore, the mean and the standard deviation of the ratios in the Non-PAR were significantly higher than that of the PAR (Table 3). This was also true within each of the 3 variant categories (Reference, Unlikely-to-be-tolerated, and Least-likely-to-be-tolerated; Table 3). When we stratified by allele frequency, we observed that the means and standard deviations increased with allele frequency in the Non-PAR, but not in the PAR (Table S2). The standard deviations of the ratios were higher in the Non-PAR for all allele frequency categories, and the means were higher in the Non-PAR for all allele frequency categories except MAF<0.1% (Table S2; Figure 2). Overall, we observed 319 variants in 152 genes, that had ratios above 11. When we interrogated these 152 genes in OMIM (McKusick-Nathans Institute of Genetic Medicine, 2022) we found that 59% had evidence in their OMIM entry linking them to a disease; while 41% had either no entry or a short entry that did not implicate the gene in a specific disease state (Table S3). Of the 319 variants only 26 (8%) had ClinVar entries. Two of these 26 were listed as having “Uncertain Significance” and the remainder (24) were listed as “Benign”, “Benign/Likely Benign” or “Likely Benign” (Table S5). After we removed coding variants (frameshift, missense, and stop-gained) from our 319 hits, SCREEN ENCODE searches revealed that 33 of these 259 variants (13%) were listed as being within candidate cis-regulatory regions (Table S5).
Figure 1. Female to male allele proportion ratios.
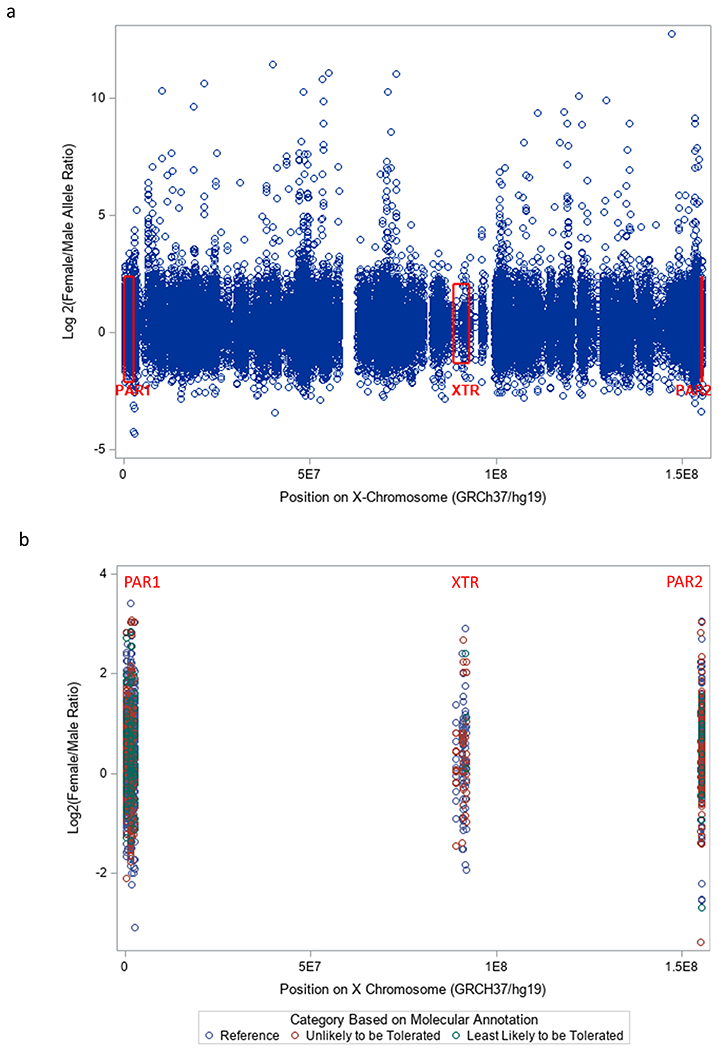
a. Female to male allele proportion ratios across the X-chromosome. Ratios are presented on the log2 scale because the ratios had a very wide distribution and many were over 100. The red boxes represent the range of the ratios within the pseudoautosomal regions.
b. Female to male allele proportion ratios in the pseudoautosomal regions of the X-chromosome. No ratios over 11 were observed in these regions.
Figure 2.

Distribution of the allele proportion ratios in Non-PAR and PAR regions
Table 3.
Female to male allele proportion ratio for variants on the X-chromosome stratified by variant type and location
| N | Mean | Median | SD | Min | Max | p-value for difference in variance b | p-value for difference in mean a | |
|---|---|---|---|---|---|---|---|---|
| All Variants | ||||||||
| PAR | 2070 | 1.54 | 1.30 | 1.04 | 0.10 | 10.59 | <0.001 | <0.001 |
| Non-PAR | 42,536 | 2.56 | 1.21 | 44.40 | 0.05 | 6,937.54 | ||
| Variants by Type c | ||||||||
| Reference Variants | ||||||||
| PAR | 1381 | 1.52 | 1.30 | 0.98 | 0.12 | 10.59 | <0.001 | <0.001 |
| Non-PAR | 26,928 | 2.40 | 1.22 | 25.41 | 0.05 | 2,186.60 | ||
| Unlikely-to-be-tolerated Variants | ||||||||
| PAR | 567 | 1.57 | 1.30 | 1.15 | 0.10 | 8.46 | <0.001 | 0.048 |
| Non-PAR | 13,249 | 2.77 | 1.19 | 69.80 | 0.05 | 6,937.54 | ||
| Least-likely-to-be-tolerated Variants | ||||||||
| PAR | 122 | 1.67 | 1.29 | 1.24 | 0.16 | 7.21 | <0.001 | 0.007 |
| Non-PAR | 2,357 | 3.28 | 1.23 | 28.54 | 0.17 | 1,246.70 | ||
F-test for equality of variances
Unequal Variance (Welch-Satterthwaite) t-tests
2 variants were untyped
Discussion
Highly pathogenic variants in the non-pseudoautosomal regions of the X-chromosome should be more frequent in females, and we used this logic to hypothesize that the female to male allele proportion ratios observed in adults could be a proxy for variant pathogenicity. We observed that the female to male ratio was higher in the two categories that were deemed more likely to generate pathology based on their biological characteristics. In short, the ratio was low for synonymous variants and high for frameshift mutations. Having said this, we also observed wide variation in the ratios from every category, and the differences between the categories were, in general, not statistically significant. When we graphed these ratios across X-chromosome locations, we observed many high ratio variants, but none of the variants in the pseudoautosomal regions were higher than 11.
The first half of our findings indicate that variant annotation categories can provide a useful taxonomy for the molecular anatomy of genetic variants, but they are not necessarily strong predictors of pathogenicity. In many respects this is an expected result, because the mean pathogenicity of intronic and synonymous variants may be low, but some can be quite deleterious (Chamary et al., 2006; Gelfman et al., 2017; Zeng & Bromberg, 2019). As our categories of tolerability are admittedly subjective, we performed a sensitivity analysis moving missense mutations from the “Unlikely-to-be-Tolerated” to the “Least-likely-to-be-tolerated“ category (Table S6). Even though the vast majority of original unlikely-to-be-tolerated category consists of missense mutations, the re-analysis does not change the qualitative nature of the results, or our conclusion that the a priori categories are only moderately predictive.
The more intriguing of our findings is the comparison of the PAR and Non-PAR regions; we hypothesized that we would find high ratios in the Non-PAR regions only, because these are the regions in which pathogenicity unmasked by hemizygosity can selectively lower the variant frequency (and allele proportion) in males. This is exactly what we observed, and it aligns with emerging evidence from the 1000 Genomes Project indicating that significant sex-differences in Minor Allele Frequency are more common in Non-PAR variants then they are in PAR1 and PAR2 (Wang et al., 2021). Furthermore, because pathogenicity unmasked by hemizygosity cannot raise the ratios of variants in the PAR, the distribution of ratios in this region should provide an estimate for the background noise of ratio variation. Because all the ratios in the PARs are below 11, we propose that ratios above 11 in the Non-PAR regions provide preliminary evidence of pathogenicity unmasked by hemizygosity. This assertion is corroborated by the findings in Table S2: 59% of the 152 genes implicated in our analysis have OMIM entries linking them to disease. Recent comprehensive assessments of the X-chromosome genes in OMIM found ~28% are currently linked to disease (Leitão et al., 2022) and thus we find evidence of enrichment (59%). Because OMIM reflects clinically validated genetic causes of disease it is incomplete, but it represents the current gold standard for determining pathogenicity. Pathogenicity predictions based on molecular taxonomy (i.e. nonsynonymous substitution rates (Ge et al., 2015), and promoter or exon conservation rates (Leitão et al., 2022) remain speculative. Further we would argue that our findings further support the conclusion that molecular characteristics are unlikely to provide precise information on pathogenicity. The remaining 41% of genes have short entries and may not yet be extensively studied. We would argue that this 41% of the genes, and their variants, deserve closer scrutiny and integration with GWAS of severe early-life diseases. Where our findings can corroborate GWAS-based hits, this will strengthen the diverse convergent evidence (Ciesielski et al., 2014) for the involvement of that variant in the pathophysiology.
We note that OMIM entries are gene based and not variant based. To deal with this, we also examined all 319 variants with a ratio greater than 11 in ClinVar (Landrum et al., 2018). Of the 319 variants, only 26 were categorized in ClinVar and 24 of these 26 are listed as benign or likely benign. The other two variants are listed as “uncertain significance”. Overall, the ClinVar information is quite sparse but it is also quite problematic in the uncommon cases when a pathogenicity category is listed. As an example, if a variant has an allele frequency >1% and no claim or report of pathogenicity has been submitted, then it can be listed as benign. This is a serious problem if a variant can become quite common in females but be nonexistent in males due to embryonic lethality. This is quite relevant to our current study. The highest ratio in our findings is for chrX:147010263 in GRCh37/hg19 (rs201580891). When we explore this variant in Varsome (Kopanos et al., 2019) it is listed as Likely Benign in ClinVar, and there is a lot of existing data on this locus: 38,527 alleles were measured in males and 104,056 from females. Overall, 18,736 of the 142,583 total genotyped sites were the variant allele. However, out of 18,736 observations, none were found in males and there were no homozygote females. Of the 26 variants with a ClinVar listing, 25 had Varsome data and they all demonstrate a similar pattern: almost no variants in males and very few homozygous variant females (Table S7). This exposes a weakness in the ClinVar categorization that warrants more careful consideration (Shah et al., 2018).
While we argue that the observed maximal ratio in the PAR provides an empirically and presumably biologically based threshold for pathogenicity evidence in Non-PAR variants, we also observed statistically significant differences predicted by our hypothesis. In short, the standard deviation and mean of the ratios in the Non-PAR were higher than those of the PAR. When we stratified by allele frequency, we observed that the means and standard deviations increased with allele frequency in the Non-PAR only. Additionally, the standard deviation of the ratios was higher in the Non-PAR for all allele frequency categories, and the mean of the ratios was higher in the Non-PAR for all but the rarest variants (MAF<0.1%). Taken together these findings are consistent with our predictions: 1) some Non-PAR variants will have very high ratios, and 2) standard deviation increases will be more sensitive markers of this phenomenon than mean increases.
We fully acknowledge that PAR variants can be pathogenic, but pathogenicity should not elevate ratios, as both sexes have two copies of these regions. The autosomes also have 2 copies of each locus, but they are not subject to X-chromosome inactivation, and thus the range of their ratios is less useful as a benchmark. This is important because while X-chromosome inactivation is not a binary distinction that is consistent in all individuals and tissues (Balaton & Brown, 2016), very few genes on the X chromosome completely escape this phenomenon (Balaton et al., 2015) (~1.8% overall and ~1.3% in the genes identified here –Table S4) When you include the intermediate or indeterminate grades of escape from X-inactivation (escape + mostly escape + variable escape + mostly variable escape) there were 102 (8.9%) on the full list and 22 on our list (14.5%). In fact, a comprehensive loss of X-chromosome inactivation is embryonic lethal for females (Migeon et al., 2017), which further indicates that the maximum ratio for autosomal variants cannot serve as an optimal reference in this analysis. Having said this, we checked the maximum female-to-male allele proportion ratio for chromosome 21 and it was roughly in the same range as what we observed in the PAR. The maximum ratio on Chromosome 21 is 43, and all but two of the ratios are below 16. If we used 43 as our threshold we would have 125 variants of interest on the X-chromosome, rather than 319. We also note that the Chromosome 21 analysis has a mean female-to-male allele proportion ratio of 1.49 and while we do not know why this mean is not closer to 1, it is nearly identical to the mean ratio observed in the PAR of the X-chromosome (1.54). Overall, we cannot explain why the mean is not closer to one, but the mean is consistent even for this autosome. Another feature of the allele proportion ratio that will deserve attention in future research is the role of the overall MAC. A high ratio can only occur in the context of a high MAC in females, and in the high ratio range above 11, the allele proportion ratio is positively correlated with the MAC (Spearman Rank Correlation = 0.78, p < 0.0001). Thus, the allele proportion ratio may be a better indicator of in utero or early life lethality where the protection of heterozygosity with inactivation is optimal, and the MAC in females is high. The specific implications of this pattern warrant future inquiry.
Overall, we emphasize that 11 is not a universal threshold ratio. It is simply the maximum ratio that we observed in the PAR dataset. Similar tailored thresholds can be empirically determined in other datasets, even when there are unequal numbers of male and female participants. This provides a simple threshold for guiding future health research with non-pseudoautosomal variants on the X-chromosome. This guidance is sorely needed as standard GWAS protocols and logistics have reduced the frequency and efficacy of X-chromosome based association analyses (Anonymous, 2017; König et al., 2014; Wise et al., 2013). Overall, we view the ratio as useful for developing hypotheses regarding early life lethal or strong negatively selected variants on the X chromosome. In short, our method is useful for a class of severe phenotypes rather than a single phenotype. Additionally, we see that the ratio has great value in screening ClinVar entries for problematic pathogenicity assertions, which is a well-established need (Shah et al., 2018). As this area of inquiry expands it would be valuable to also explore the extremely low ratio variants as they may be indicative of sex-based antagonistic selection that raises adverse consequences for females via mechanisms that have nothing to do with hemizygosity.
Finally, we acknowledge that pathogenicity is a complex concept and it cannot be fully characterized on a single continuum. Stated differently, the pathogenicity of a genetic variant changes based on the context in which it is expressed and the outcome being measured. For example, pleiotropy is a nearly ubiquitous phenomenon (Chesmore et al., 2018), and the effect of a given variant may be pathogenic for one trait/disease and protective for another (Carter & Nguyen, 2011) (i.e. antagonistic pleiotropy). Our approach addresses this complexity by focusing on patterns that are driven by pathogenicity that causes death in early life. Even within this relatively homogeneous definition of pathogenicity there are several determining factors and interactions to consider. The early life fatality due to a given variant may vary with environmental exposures or other gene variants (epistasis or simply heterogeneity at the same locus). In this light, our analysis best reflects pathogenicity in the context of European ancestry and environments, as the majority of gnomAD participants were European (Konrad Karczewski & Laurent Francioli, 2017). However, the gnomAD database is still more diverse than most reported. Some “pathogenic” variants may exist in human populations (and the gnomAD data) because they are helpful in the context of the right environment, diet, endemic pathogen, microbiome, or ancestry. These are possibilities we could not consider in our analyses.
Overall, we observed a pattern that is consistent with our hypothesis. Pathogenic variants in the non-pseudoautosomal regions of the X chromosome can become much more common in females due to a sex specific selection pressure: pathogenicity unmasked by hemizygosity. Males with these pathogenic variants are less likely to survive and to have their variants sequenced. Importantly, we have also identified an empirical maximum for ratios that are not experiencing hemizygosity-driven increases: the maximum observed ratio among the PAR variants. There were no variants with ratios over 11 among the PAR variants in these data, and this indicates that Non-PAR variants with ratios over 11 provide putative evidence of pathogenicity. This approach can be leveraged to detect pathogenic variants in the Non-PAR of the X-chromosome, a relative blind-spot for traditional GWAS. Additionally, we found evidence that generic assumptions about the likely severity of synonymous vs. frameshift mutations may not be very useful, as there was great variability in the ratios for variants with similar molecular anatomy. Future research into the variants with exceptionally high ratios may reveal insights into the mechanisms that can make a specific synonymous variant harmful, and a specific stop codon helpful. All these individual distinctions will depend on the outcome of greatest interest (how pathogenicity is defined), and the contextual factors that modulate the physiologic consequences of the variant-mediated changes.
Supplementary Material
Funding.
This work was funded by EY011373 (SKI) and LM010098 (SMW) and made use of the High Performance Computing Resource in the Core Facility for Advanced Research Computing at Case Western Reserve University.
Footnotes
Competing Interests. There are no competing interests.
Conflict of Interest. On behalf of all authors, the corresponding author states that there is no conflict of interest.
Animal Research. Not applicable
Consent to Participate. Not applicable
Consent to Publish. Not applicable
Data Availability.
All data is publicly available at sites described in the manuscript.
References
- Anonymous. (2017). Accounting for sex in the genome. Nature Medicine, 23(11), 1243–1243. 10.1038/nm.4445 [DOI] [PubMed] [Google Scholar]
- Balaton BP, & Brown CJ (2016). Escape Artists of the X Chromosome. Trends in Genetics: TIG, 32(6), 348–359. 10.1016/j.tig.2016.03.007 [DOI] [PubMed] [Google Scholar]
- Balaton BP, Cotton AM, & Brown CJ (2015). Derivation of consensus inactivation status for X-linked genes from genome-wide studies. Biology of Sex Differences, 6, 35. 10.1186/s13293-015-0053-7 [DOI] [PMC free article] [PubMed] [Google Scholar]
- Carter AJR, & Nguyen AQ (2011). Antagonistic pleiotropy as a widespread mechanism for the maintenance of polymorphic disease alleles. BMC Medical Genetics, 12, 160. 10.1186/1471-2350-12-160 [DOI] [PMC free article] [PubMed] [Google Scholar]
- Chamary JV, Parmley JL, & Hurst LD (2006). Hearing silence: Non-neutral evolution at synonymous sites in mammals. Nature Reviews. Genetics, 7(2), 98–108. 10.1038/nrg1770 [DOI] [PubMed] [Google Scholar]
- Chesmore K, Bartlett J, & Williams SM (2018). The ubiquity of pleiotropy in human disease. Human Genetics, 137(1), 39–44. 10.1007/s00439-017-1854-z [DOI] [PubMed] [Google Scholar]
- Ciesielski TH, Pendergrass SA, White MJ, Kodaman N, Sobota RS, Huang M, Bartlett J, Li J, Pan Q, Gui J, Selleck SB, Amos CI, Ritchie MD, Moore JH, & Williams SM (2014). Diverse convergent evidence in the genetic analysis of complex disease: Coordinating omic, informatic, and experimental evidence to better identify and validate risk factors. BioData Min, 7, 10. 10.1186/1756-0381-7-10 [DOI] [PMC free article] [PubMed] [Google Scholar]
- Cotter DJ, Brotman SM, & Wilson Sayres MA (2016). Genetic Diversity on the Human X Chromosome Does Not Support a Strict Pseudoautosomal Boundary. Genetics, 203(1), 485–492. 10.1534/genetics.114.172692 [DOI] [PMC free article] [PubMed] [Google Scholar]
- Dobyns WB, Filauro A, Tomson BN, Chan AS, Ho AW, Ting NT, Oosterwijk JC, & Ober C (2004). Inheritance of most X-linked traits is not dominant or recessive, just X-linked. American Journal of Medical Genetics. Part A, 129A(2), 136–143. 10.1002/ajmg.a.30123 [DOI] [PubMed] [Google Scholar]
- Ge X, Kwok P-Y, & Shieh JTC (2015). Prioritizing genes for X-linked diseases using population exome data. Human Molecular Genetics, 24(3), 599–608. 10.1093/hmg/ddu473 [DOI] [PMC free article] [PubMed] [Google Scholar]
- Gelfman S, Wang Q, McSweeney KM, Ren Z, La Carpia F, Halvorsen M, Schoch K, Ratzon F, Heinzen EL, Boland MJ, Petrovski S, & Goldstein DB (2017). Annotating pathogenic non-coding variants in genic regions. Nature Communications, 8(1), 236. 10.1038/s41467-017-00141-2 [DOI] [PMC free article] [PubMed] [Google Scholar]
- Karczewski KJ, Francioli LC, Tiao G, Cummings BB, Alföldi J, Wang Q, Collins RL, Laricchia KM, Ganna A, Birnbaum DP, Gauthier LD, Brand H, Solomonson M, Watts NA, Rhodes D, Singer-Berk M, England EM, Seaby EG, Kosmicki JA, … MacArthur DG (2020). The mutational constraint spectrum quantified from variation in 141,456 humans. Nature, 581(7809), 434–443. 10.1038/s41586-020-2308-7 [DOI] [PMC free article] [PubMed] [Google Scholar]
- König IR, Loley C, Erdmann J, & Ziegler A (2014). How to include chromosome X in your genome-wide association study. Genetic Epidemiology, 38(2), 97–103. 10.1002/gepi.21782 [DOI] [PubMed] [Google Scholar]
- Karczewski Konrad & Francioli Laurent. (2017, February 27). The genome Aggregation Database (gnomAD). GnomAD News. https://gnomad.broadinstitute.org/news/2017-02-the-genome-aggregation-database/ [Google Scholar]
- Kopanos C, Tsiolkas V, Kouris A, Chapple CE, Albarca Aguilera M, Meyer R, & Massouras A (2019). VarSome: The human genomic variant search engine. Bioinformatics, 35(11), 1978–1980. 10.1093/bioinformatics/bty897 [DOI] [PMC free article] [PubMed] [Google Scholar]
- Landrum MJ, Lee JM, Benson M, Brown GR, Chao C, Chitipiralla S, Gu B, Hart J, Hoffman D, Jang W, Karapetyan K, Katz K, Liu C, Maddipatla Z, Malheiro A, McDaniel K, Ovetsky M, Riley G, Zhou G, … Maglott DR (2018). ClinVar: Improving access to variant interpretations and supporting evidence. Nucleic Acids Research, 46(D1), D1062–D1067. 10.1093/nar/gkx1153 [DOI] [PMC free article] [PubMed] [Google Scholar]
- Leitão E, Schröder C, Parenti I, Dalle C, Rastetter A, Kühnel T, Kuechler A, Kaya S, Gérard B, Schaefer E, Nava C, Drouot N, Engel C, Piard J, Duban-Bedu B, Villard L, Stegmann APA, Vanhoutte EK, Verdonshot JAJ, … Depienne C (2022). Systematic analysis and prediction of genes associated with disorders on chromosome X. MedRxiv, 2022.02.16.22270779. 10.1101/2022.02.16.22270779 [DOI] [PMC free article] [PubMed] [Google Scholar]
- McKusick-Nathans Institute of Genetic Medicine. (2022, March 8). OMIM -Online Mendelian Inheritance in Man—An Online Catalog of Human Genes and Genetic Disorders. https://www.omim.org/
- Migeon BR (2007). Why females are mosaics, X-chromosome inactivation, and sex differences in disease. Gender Medicine. Official Journal of the Partnership for Gender-Specific Medicine at Columbia University, 4(2), 97–105. 10.1016/s1550-8579(07)80024-6 [DOI] [PubMed] [Google Scholar]
- Migeon BR (2020). X-linked diseases: Susceptible females. Genetics in Medicine: Official Journal of the American College of Medical Genetics, 22(7), 1156–1174. 10.1038/s41436-020-0779-4 [DOI] [PMC free article] [PubMed] [Google Scholar]
- Migeon BR, Beer MA, & Bjornsson HT (2017). Embryonic loss of human females with partial trisomy 19 identifies region critical for the single active X. PloS One, 12(4), e0170403. 10.1371/journal.pone.0170403 [DOI] [PMC free article] [PubMed] [Google Scholar]
- Moore JE, Purcaro MJ, Pratt HE, Epstein CB, Shoresh N, Adrian J, Kawli T, Davis CA, Dobin A, Kaul R, Halow J, Van Nostrand EL, Freese P, Gorkin DU, Shen Y, He Y, Mackiewicz M, Pauli-Behn F, Williams BA, … Weng Z (2020). Expanded encyclopaedias of DNA elements in the human and mouse genomes. Nature, 583(7818), 699–710. 10.1038/s41586-020-2493-4 [DOI] [PMC free article] [PubMed] [Google Scholar]
- Shah N, Hou Y-CC, Yu H-C, Sainger R, Caskey CT, Venter JC, & Telenti A (2018). Identification of Misclassified ClinVar Variants via Disease Population Prevalence. American Journal of Human Genetics, 102(4), 609–619. 10.1016/j.ajhg.2018.02.019 [DOI] [PMC free article] [PubMed] [Google Scholar]
- Wang Z, Sun L, & Paterson AD (2021). Major sex differences in allele frequencies for X chromosome variants in the 1000 Genomes Project data. BioRxiv, 2021.10.27.466015. 10.1101/2021.10.27.466015 [DOI] [PMC free article] [PubMed] [Google Scholar]
- Webster TH, Couse M, Grande BM, Karlins E, Phung TN, Richmond PA, Whitford W, & Wilson MA (2019). Identifying, understanding, and correcting technical artifacts on the sex chromosomes in next-generation sequencing data. GigaScience, 8(7). 10.1093/gigascience/giz074 [DOI] [PMC free article] [PubMed] [Google Scholar]
- Wise AL, Gyi L, & Manolio TA (2013). eXclusion: Toward integrating the X chromosome in genome-wide association analyses. American Journal of Human Genetics, 92(5), 643–647. 10.1016/j.ajhg.2013.03.017 [DOI] [PMC free article] [PubMed] [Google Scholar]
- Zeng Z, & Bromberg Y (2019). Predicting Functional Effects of Synonymous Variants: A Systematic Review and Perspectives. Frontiers in Genetics, 10, 914. 10.3389/fgene.2019.00914 [DOI] [PMC free article] [PubMed] [Google Scholar]
Associated Data
This section collects any data citations, data availability statements, or supplementary materials included in this article.
Supplementary Materials
Data Availability Statement
All data is publicly available at sites described in the manuscript.