Abstract
Current knowledge of the disposition kinetics of endogenous metabolites is founded almost entirely on poorly-time-resolved experiments in which samples are removed from the body for later, bench-top analysis. Here, in contrast, we describe real-time, seconds-resolved measurements of plasma phenylalanine collected in-situ in the body via electrochemical aptamer-based (EAB) sensors, a platform technology that is independent of the reactivity of its targets and thus is generalizable to many. Specifically, using indwelling EAB sensors we have monitored plasma phenylalanine in live rats with few micromolar precision and 12 s temporal resolution, identifying a large-amplitude, few-seconds phase in the animals’ metabolic response that had not previously been reported. Using the hundreds of individual measurements that the approach provides from each animal, we also identify inter-subject variability, including statistically significant differences associated with feeding status. These results highlight the power of in vivo EAB measurements, an advance that could dramatically impact our understanding of physiology and provide a valuable new tool for the monitoring and treatment of metabolic disorders.
Keywords: Phenylketonuria, PKU, amino acids, metabolism, metabolomics, continuous monitoring, intravenous
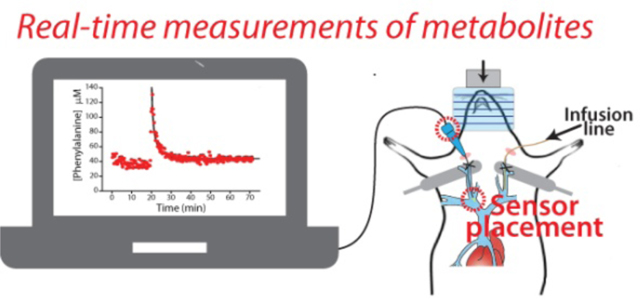
Graphical Abstract
The development of a platform technology supporting the seconds-resolved, real-time measurement of small molecules in the body would significantly advance our understanding of metabolism as well as our clinical ability to track it, and when necessary, intervene to alter it. As a research tool, for example, such a technology would vastly improve the precision with which we can measure metabolic fluxes and their regulation.1,2 By providing real-time information regarding therapeutic efficacy, such a technology could, by analogy to how the continuous glucose monitor has impacted the treatment of diabetes,3 revolutionize how we monitor and treat a wide range of inborn errors of metabolism.4–6 To date, however, all prior methods of measuring specific metabolites in situ the body, including current electrochemical approaches for the measurement of glucose, lactate, pyruvate and glutamate,7–11 are “one-offs.” That is, each relies critically on the availability of a highly-selective oxidase enzyme able to convert the target molecule into an electrochemically-detectable product (typically hydrogen peroxide), and thus this approach is not generalizable to the many important targets for which suitable enzymes are not available.
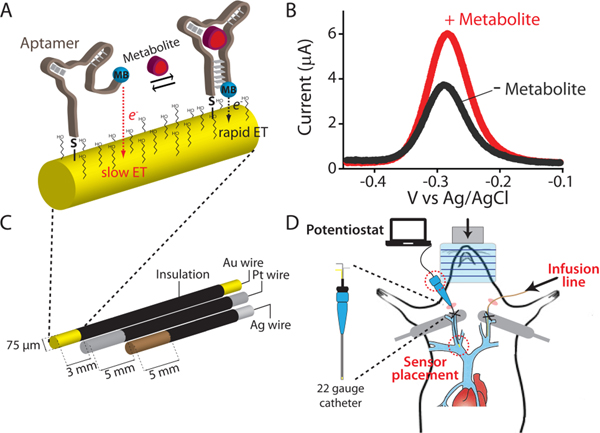
In response to the need for an in-vivo molecular measurement technology that, in contrast to prior approaches, is independent of the enzymatic reactivity of its targets we are developing electrochemical aptamer-based (EAB) sensors.12–17 This reagentless, reversible sensor architecture exploits an electrode-bound, redox-reporter-modified aptamer as its recogni-tion element (Figure 1A). The presence of the specific target induces a conformational change in the aptamer. This, in turn, produces an easily measurable electrochemical output that can be used to measure molecular concentrations with high frequency and in real time (Figure 1B). And because this binding-induced conformational change mechanism is analogous to the conformation-linked signaling employed by nature,18 EAB sensors are selective enough to work in situ in the living body. For example, using indwelling EAB sensors (Figure 1C, left) we have previously performed the real-time, seconds (and even sub-second) resolved measurement of multiple drugs in situ in the veins of live rats (Figure 1C, right).19–22 Expanding on this, here we describe the development and implementation of the first indwelling EAB sensor directed against an endogenous target, the aromatic amino acid phenylalanine. To the best of our knowledge, this is the first electrochemical sensor able to measure this or any metabolite in real time in the living body without relying on the target’s redox chemistry, spectroscopic properties, or enzymatic reactivity.
Figure 1.
(A) Electrochemical aptamer-based (EAB) sensors exploit the binding-induced folding of a redox-reporter-modified aptamer that is covalently attached to an interrogating electrode via a self-assembled monolayer. (B) Target binding alters the efficiency with which the redox reporter (here methylene blue) approaches the electrode, producing an electrochemical signal easily measured using square wave voltammetry. (C) We fabricate indwelling EAB sensors using a 75 μm-diameter, 3 mm-long goldwire working electrode bundled with same-diameter platinum counter and silver/silver-chloride reference electrodes. (D) The completed sensor is small enough to be emplaced in the external jugular vein of a rat via a 22-gauge guide catheter.
RESULTS AND DISCUSSION
EAB sensor development requires an aptamer that: (1) binds the desired target with relevant affinity and specificity and (2) undergoes the binding-induced conformational change required to generate an EAB signal (see e.g., refs 19,21,22). In this work we have employed a phenylalanine-binding aptamer recently reported by Cheung et al.,23 which is thought to transition from a partially unfolded conformation to a folded stemloop structure upon target binding. To adapt this aptamer into the EAB platform we modified its 3′ end with a methylene blue redox reporter and its 5’ end with a six-carbon thiol for attachment to an interrogating gold electrode.
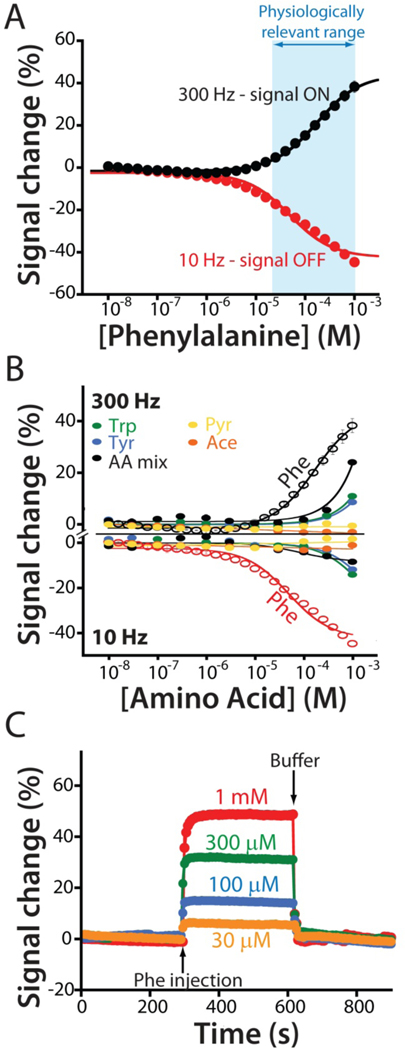
The resulting sensor supports the measurement of phenylalanine over the 30 μM to 1 mM physiologically relevant range seen across both healthy humans and those who suffer from phenylketonuria (PKU), an inborn metabolic disorder that leads to excessively high plasma phenylalanine levels24–26. Specifically, the sensor exhibits both “signal-on” (target binding increases signal) and “signal-off” (binding decreases signal) behavior at higher and lower square wave frequencies (Figures 2a and S1), respectively, with signal gain (relative change in signal upon the addition of saturating target) of +46 ± 1% at 300 Hz and −40 ± 1% at 10 Hz (the “error bars” we report for descriptions of sensor performance reflect standard deviations derived using at least three independently fabricated sensors).
Figure 2.
(A) The EAB sensor response to increasing concentrations of phenylalanine produces the expected Langmuir binding curve. As is common for sensors in this class, the device’s response is signal on at higher square wave frequencies and signal-off at lower frequencies. The physiologically relevant range of plasma phenylalanine levels in healthy individuals and individuals suffering from PKU is shown in blue.24–26 (B) To show that the sensor achieves clinically relevant specificity we challenged it with tryptophan (trp), tyrosine (tyr), a mixture of the amino acids glutamine, histidine, proline, arginine, and alanine (AA mix), and the phenylalanine metabolites phenylpyruvate (Pyr) and phenylacetate (Ace). Using the same frequencies as in (A), the sensor does not measurably respond to any of these at concentrations below 300 μM, a level far above those seen physiologically. (C) Finally, the sensor is rapid, responding in just a few seconds to the addition of physiologically relevant target concentrations.
The phenylalanine-detecting sensor achieves clinically relevant specificity and speed. For example, even at the upper ends of their physiologically-relevant concentration ranges the sensor does not detectably respond to the aromatic amino acids tryptophan or tyrosine, or the phenylalanine metabolites phenylpyruvate or phenylacetate (Figure 2B). The sensor is likewise quite rapid; at the few tens of micromolar phenylalanine concentrations seen in the body the sensor equilibrates to bidirectional concentration changes within the 5 s required to collect a single square wave voltammogram (Figure 2C). This is orders of magnitude faster than the time resolution typically associated with measurement approaches that require blood draws, and thus is far faster than any timescales previously reported for phenylalanine metabolism.26,27
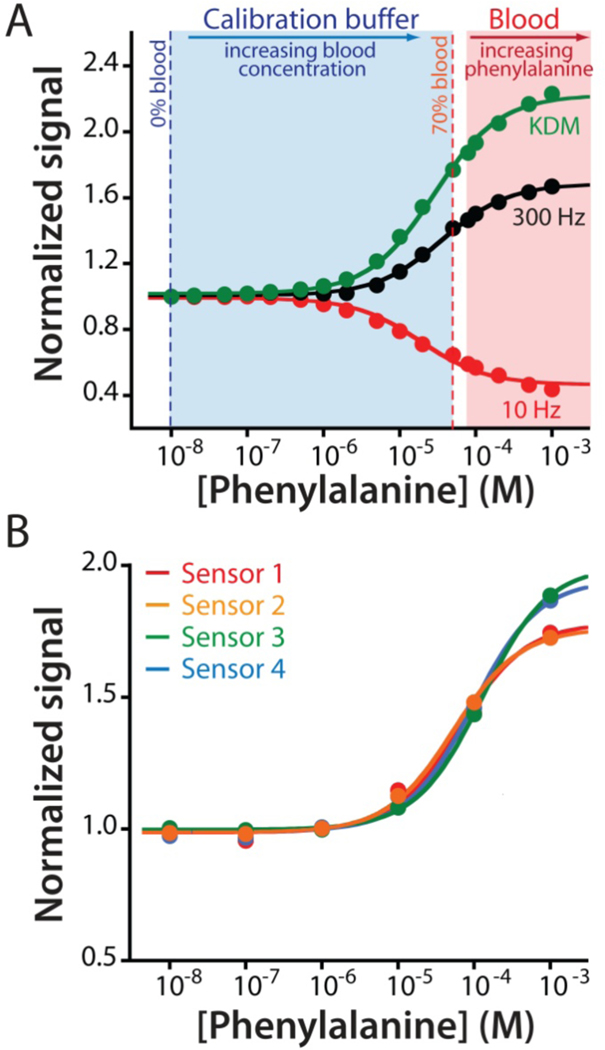
As is generally true for EAB sensors,19,21,22 the phenylalanine-detecting sensor is stable and accurate when deployed in undiluted whole blood. A complication in such deployment, however, is that endogenous plasma phenylalanine complicates calibration in this sample matrix. Specifically, because the endogenous concentration of the target (which are generally between 35 and 85 μM)26,27 falls within the sensor’s useful dynamic range a complete Langmuir calibration curve cannot be obtained using only blood (Figure S2), which was our prior approach to EAB calibration.19,21,22 To circumvent this, here we demonstrate the use of a simple, buffered calibration solution that mimics the pH, ionic strength, protein and sugar content of whole blood as a blood dilutant and proxy. That is, we determined the lower-concentration portion of the calibration curve by placing sensors in this buffer and then titrated in whole bovine blood of known (80 μM) phenylalanine concentration until we reached 70% (v/v) blood (corresponding to 56 μM phenylalanine). To determine the higher-concentration portion of the calibration curve we then transferred the sensor into undiluted whole blood (i.e., at 80 μM phenylalanine) and titrated additional phenylalanine until we reached a final concentration of 1 mM. Combining the two data sets we obtain the entire Langmuir isotherm for the sensor, producing affinity and signal gain similar those seen in buffered saline (Figures 3A; see also Figure S3). To determine the device-to-device reproducibility of this calibration approach we used it to calibrate four independently fabricated sensors, obtaining a standard deviation of 8 μM at a target concentration of 45 μM (Figure 3B).
Figure 3.
The adaptation of EAB sensors to the measurement of an endogenous component of blood required the development of a new calibration approach suitable for use with endogenous targets (i.e., for which target-free blood is not available). (A) For this we employed a calibration buffer comprised of Ringer’s solution and bovine serum albumin (35 mg/mL) that mimics the pH, ionic strength, protein, and sugar content of whole blood. We determined the lower portion of the calibration curve by titrating whole bovine blood of known phenylalanine concentration (80 μM) into this buffer to a final concentration of 70% blood (56 μM). To determine the upper portion of the curve we then moved the sensor into undiluted whole blood (at 80 μM phenylalanine) and adding exogenous phenylalanine until we reached a final concentration of 1 mM. Merging the data sets we can obtain the entire Langmuir isotherm, which produces dissociation constants and signal gains similar those seen in phosphate buffered saline (Figures 3A; see also Figure S3). (B) Using this approach to calibrate EAB sensors prior to deployment in vivo we observe good reproducibility between individually fabricated devices. The mean and standard deviation of the concentration estimates associated with a signal increase of 30% are 45.1 μM and 7.8 μM, respectively.
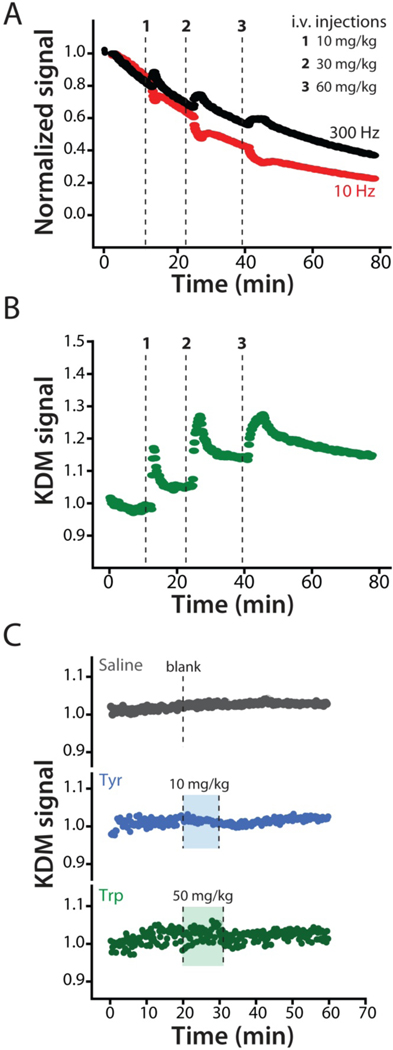
To adapt the phenylalanine-detecting sensor to placement in the living body we fabricated indwelling sensors using 75 μm diameter by 3 mm long gold wire electrodes. We matched these with equal diameter platinum counter and chloride-anodized silver reference electrodes (Figure 1C, left) and encased the bundle in a 22-gauge catheter in which slots were cut to provide blood access.28 The resulting devices are small enough to be inserted into the jugular veins of anesthetized Sprague-Dawley (Figure 1C, right). Because rats have four jugular veins (left and right interior and exterior pairs), such placements cause only minor changes to blood flow and likely no changes to molecular physiology. When so deployed, EAB sensors often they exhibit significant baseline drift (see e.g., refs19,21,22). This is due to the chemical degradation of the aptamer and the self-assembled alkanethiol monolayer over the course of electrochemical interrogation.31 To correct this, here we employed “Kinetic Differential Measurements” (KDM), an approach that exploits the fact that the signal-on and signal-off responses of EAB sensors drift in concert (Figure 4A; see also Figures 3A and S2), such that taking the difference between signals measured at 10 and 300 Hz removes this drift and allows for the accurate determination of target concentration.19,29 These differential measurements, which require performing two sequential square wave scans, can be collected every 12 s, providing effectively continuous, real-time information on plasma target levels.
Figure 4.
When placed in situ in the body EAB sensors drift.19,21,22 To correct this, we employed kinetic differential measurements (KDM).19,29 (A) Normalized signals collected at 300 Hz (black) and 10 Hz (red) square-wave frequencies drift in concert, such that taking their difference via KDM eliminates the drift. (B) Using KDM we can easily see the results of serial increasing intravenous injections of phenylalanine in an anesthetized rat. The 12 s time resolution achieved in these measurements is sufficient to monitor both the injection itself and the subsequent distribution of the metabolite within the body. This reflects a 30-fold improvement over the time resolution of the best prior studies of phenylalanine metabolism kinetics in either rats or humans.31,36,38–42 (C) As expected, the in-vivo sensor does not respond to intravenous injections of either a saline “blank” or the aromatic amino acids tyrosine or tryptophan at the indicated dosages.
Indwelling EAB sensors support multi-hour measurement of plasma phenylalanine levels. For example, following a series of increasing intravenous phenylalanine challenges we see concomitantly varying peaks in plasma concentration for which we collect hundreds of measurements during the “decay” phase (Figure 4B). As defined by the standard deviations seen for baseline measurements performed prior to dosing the precision of these in-vivo measurements is between 7 and 15 μM across multiple animals.
While these values include true measurement precision (which, as noted above, we estimate to be ~8 μM at these target concentrations), it also includes any physiologically driven fluctuations in phenylalanine levels that may have occurred during the measurements. The specificity of the in-vivo EAB sensor likewise remains excellent: control injections of either saline blanks or doses of the aromatic amino acids tyrosine or tryptophan produce no significant response (Figure 4C).
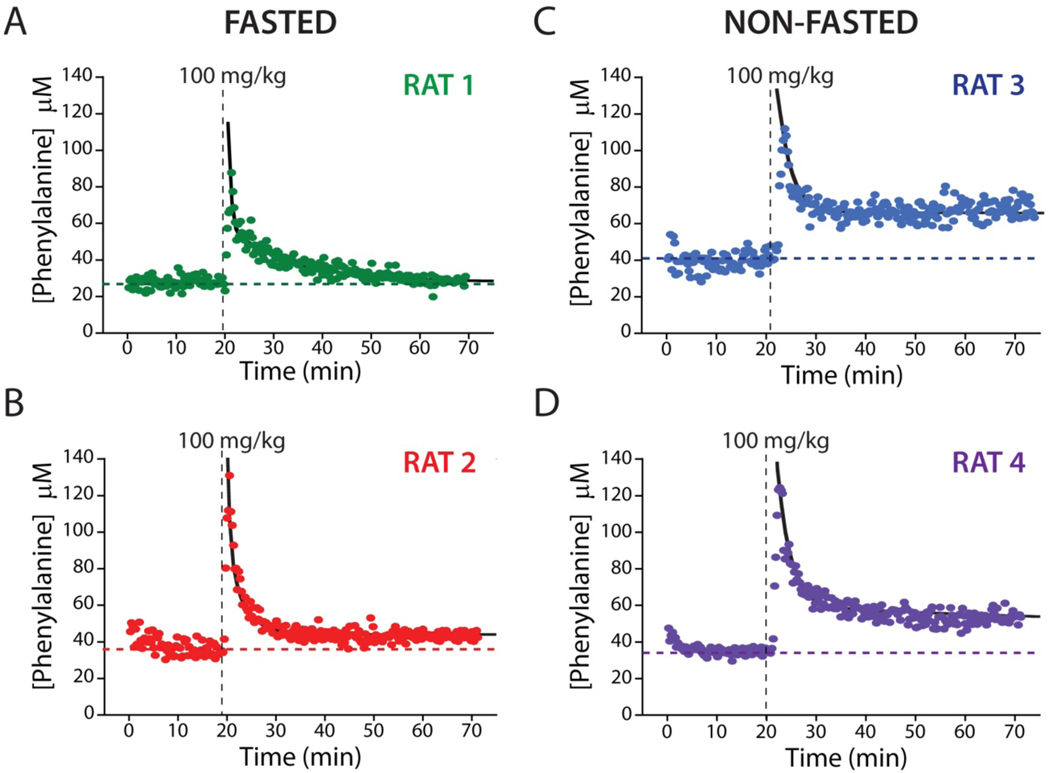
The few-seconds time resolution of the EAB sensor renders it a novel and powerful tool for the study the disposition kinetics of phenylalanine. To illustrate this, we first measured basal phenylalanine levels in two fasted rats (12 h) for 20 min (see Table 1), obtaining values of 27.9 ± 0.6 and 37.0 ± 1.4 μM (the confidence intervals we report for estimates of phenylalanine concentrations and their kinetic parameters are at the 95% confidence level), values consistent with the results of prior, much more poorly time resolved studies employing ex-vivo measurements23,30–33 (Figure S4). We next challenged the rats with 100 mg/kg intravenous boluses of phenylalanine over the course of ~1 min (Figure 5A-B). In response, peak plasma concentrations rapidly reached 87 μM and 131 μM in the two, which was followed by a monotonic return to within 20% of the pre-dosing baseline over the course of approximately 20 min (Table 1).
Table 1.
Kinetic Parameters Corresponding to a Single Intravenous Injection of Phenylalanine in Four Sprague-Dawley Rats
| Animal | Fasted | Pre-bolus baseline (μM)[a] | Post-bolus baseline (μM)[b] | A (μM)[b] | α half life (min)[b] | B (μM)[b] | β half life (min)[b] | R2 | CMAX (μM) |
|---|---|---|---|---|---|---|---|---|---|
| RAT 1 | Yes | 27.9±0.6 | 28.4±1.4 | 53±16 | 0.4±0.1 | 29 ±3 | 8.9±1.8 | 0.898 | 87 |
| RAT 2 | Yes | 37.0±1.4 | 43.3±0.6 | 68±13 | 0.5±0.2 | 43±13 | 2.7±0.6 | 0.944 | 131 |
| RAT 3 | No | 40.8±1.6 | 66.9±0.8 | 34±16 | 0.5±0.4 | 16.2±16.4 | 2.7±2.4 | 0.755 | 112 |
| RAT 4 | No | 34.5±0.9 | 52.5±1.3 | 63±11 | 1.1±0.4 | 26±11 | 6.6±3.0 | 0.916 | 124 |
| Ref. [21][c] | Yes | 72±22 | 109±13 | NA | NA | 72±34 | 14±15 | 0.831 | 154±32 |
The error bars reported here are 95% confidence intervals derived from standard deviations.
The error bars reported here are 95% confidence intervals based on estimated standard errors of the fits.
Values obtained using a single exponential fit.
Figure 5.
EAB sensors provide an unprecedentedly high-precision view into metabolism and inter-subject metabolic variability. Shown, for example, are plasma phenylalanine levels after a single, 100 mg/kg intravenous injections into four live rats, two of which were fasted for 12 h (A, B) and two of which had free access to food (C, D). These high-precision measurements reveal similar peak concentrations, distribution rates, and elimination rates for all four animals. For the two fasted animals, plasma phenylalanine levels returned to within 20% of the pre-dosing baseline over the course of approximately 20 min. In contrast to the situation with fasted animals, however, the plasma phenylalanine levels in these animals remain elevated by ~50% above pre-challenge baseline levels over the course of our experiments. The black lines represent the fit of each injection dataset to a two-compartment pharmacokinetic model (Eq. 1).
Although the kinetics of phenylalanine metabolism are modestly complex,34,35 they are often described using a simple two-compartment model:36,37
 |
in which k12 and k21 are the rate constants associated with the transport of phenylalanine into and out of tissue stores and kel is the rate constant for its metabolic degradation. In this model, the time-varying phenylalanine concentration given by the sum of two exponentials:
where A and B are the amplitudes of the two phases, α and β are the half-lives for phenylalanine distribution and elimination, respectively, and C is the basal plasma phenylalanine concentration reached after re-equilibration. Fitting our concentration-time profiles to this model, we find that α is 0.4±0.1 min and 0.5±0.2 min and β is 8.9±1.8 min and 2.7±0.6 min for the two fasted animals shown (Figure S5; see also Table 1).
The precision with which the large number of measurements we can collect over physiologically relevant timescales in a single animal provides an unprecedentedly high-precision window into phenylalanine metabolism. For example, the only prior time-resolved study of phenylalanine disposition kinetics in fasted rats we are aware of collected just 9 samples (for later, ex-vivo analysis) per animal over the course of 2.5 h and then averaged these over multiple animals (Figure S6).31 This was a direct consequence of the study’s reliance on blood-draw sampling: the limited blood volume of rats (from 8 to 24 ml)43 restricts the total number of measurements that can be made without unacceptable loss of blood.44 With so few measurements, this data set cannot meaningfully be fit to the expected two-exponential model (e.g., doing so produces estimates for four of the five parameters that, at the 95% confidence level, overlap with zero). If we instead fit this prior data to a single exponential, which captures only the slower of the two phases, we obtain a half-life of 14±15 min. While the data provided only poorly constrain this value, it is consistent with the slower-phase half-lives we have observed.
The poor fit of the limited prior rat data31 to the two-compartment (dual-exponential) model and its poor ability to constrain even a single-compartment (single-exponential) model stems from three issues that have systematically plagued all prior studies of amino acid disposition kinetics (see e.g., refs36,38–42 for studies of phenylalanine disposition kinetics in humans). The first is time resolution that is typically poor relative to the timescales of metabolite disposition. The earliest samples in the prior rat study,31 for example, were collected 6 min after the completion of infusion. This is an order of magnitude slower than the phenylalanine distribution phase we have identified here. A related issue is that, given the noise invariably present in such measurements, dozens or hundreds of measurements are required to constrain multi-exponential models with good statistical significance, and yet prior studies could collect only on the order of a half dozen measurements per subject.31,36,38,40 Finally, inter-subject differences in physiology likely also contribute to the inability of prior data sets to constrain a two-compartment model. For example, the one prior study of phenylalanine disposition kinetics in the rat31 pooled samples collected from multiple subjects, reducing the validity of disposition/metabolic models. Specifically, the differing half-lives of the same process in different individuals will confound efforts to delineate between the kinetics of two different processes in data that have been averaged over multiple animals.
The hundreds of metabolite level measurements that EAB sensors can provide each for individual animal also provides an unprecedented ability to observe physiological variability between individuals. To illustrate this, we performed phenylalanine challenge experiments on two rats that, in contrast to those employed in the above study, were not food restricted, likely causing their metabolic status to differ.46,46 Upon intravenous injection of a bolus 100 mg/kg of phenylalanine, the peak plasma concentrations, distribution half-lives and elimination half-lives we determined are similar to those we observed for fasted animals (Figure 5; see also Table 1). Given that short-term food restriction is not thought to alter the activity or level of phenylalanine hydroylase,47 this is perhaps to be expected. While plasma phenylalanine levels in fasted animals return to close to their pre-challenge baseline values, however, the post-challenge baseline levels seen in freely-fed animals remain elevated by ~50% over the course of our several-hour experiments (Figure 5; see also Table 1). And though it is premature to speculate deeply based on studies performed with just four animals, given the strong statistical significance we observe for these effects in each animal we suspect that this difference is real and arises due to physiological differences between the two sets of animals.
CONCLUSION
In what we believe is the first seconds-resolved measurements of any endogenous metabolite in vivo using an enzyme-free biosensor, we describe here the real-time monitoring of plasma phenylalanine levels in situ in the veins of live rats with few-micromolar concentration resolution and 12 s temporal resolution. This orders-of-magnitude improved time resolution enables the high-precision determination of physiological phases that are too rapid to capture using traditional approaches. It also produces sufficient numbers and quality of data to characterize the kinetics of individual animals with good statistical significance, thus providing an unprecedented tool with which to study inter-subject disposition kinetics variability.
EAB sensors could also prove valuable in support of personalized medicine. The real-time measurement of phenylalanine, for example, could impact the treatment of PKU, an important (frequency 1 in 10,000 live births in Europe and 1 in 15,000 in the US)25 inborn metabolic disorder of phenylalanine that is managed via personalized nutritional regimes aimed at maintaining phenylalanine levels above the minimum needed for healthy protein production but below threshold levels that lead to neurotoxicity and mental retardation. Specifically, as a first step EAB sensors would render it possible to estimate the phenylalanine disposition kinetics of individual patients conveniently and with precision. This, in turn, would improve clinical predictions of patient-specific bioavailability and clearance rates of free phenylalanine, improving both diagnosis and treatment.34,48,49 Looking further forward, the real-time plasma phenylalanine measurements provided by EAB could be used by patients to guide their phenylalanine intake.50 This might prove of especially significant value in the context of enzyme replacement therapy (Pegvaliase treatment), during which it is currently difficult to ensure that sufficient levels of this critical amino acid are maintained.5,6,25 Together, these opportunities suggest that EAB-based metabolic monitoring could significantly impact the quality of life of patients with this common inborn metabolic disorder.4–6
Looking beyond phenylalanine and PKU, EAB sensors can be adapted to new targets via the simple expedient of changing their aptamer receptor (see e.g., refs 12–17). Given this, we believe the approach may prove of value in the ultra-high-precision determination of disposition kinetics and the real-time monitoring of a wide range of clinically important metabolites that, currently, can only be measured using blood draws and laboratory analysis.
Supplementary Material
ACKNOWLEDGMENTS
This work was funded by the NIH (EB022015). The authors would also like to acknowledge their colleagues, Philippe Dauphin-Ducharme, Alex Downs, and Kyle Ploense for their help. We thank Prof. Milan Stojanovic for his suggestions and helpfull discussion of the manuscript. The experimental protocol employed was approved by the Institutional Animal Care and Use Committee (IACUC – protocol number 824) of the University of California Santa Barbara, and adhered to the guidelines given by the NIH Guide for Care and Use of Laboratory Animals (IUCAC, 2011).
Funding Sources
This work was funded by Grant EB022015 from the National Institutes of Health.
Footnotes
ASSOCIATED CONTENT
Supporting Information. Materials and instruments, EAB sensors fabrication, in vitro experiments and measurements, in vivo experiments and measurements, pharmacokinetic analysis, supplementary Schemes, Tables, and Figures are located in the supporting information (PDF). This material is available free of charge at http://pubs.acs.org.
One author (KWP) has a financial interest in and serves on the scientific advisory boards of two companies attempting to commercialize EAB sensors.
REFERENCES
- (1).Metallo CM; Vander Heiden MG Understanding metabolic regulation and its influence on cell physiology. Mol. Cell 2013, 49 (3), 388–398. [DOI] [PMC free article] [PubMed] [Google Scholar]
- (2).Wegner A; Meiser J; Weindl D; Hiller K. How metabolites modulate metabolic flux. Curr. Opin. Biotech 2015, 34, 16–22. [DOI] [PubMed] [Google Scholar]
- (3).Rodbard D. Continuous glucose monitoring: a review of successes, challenges, and opportunities. Diabetes Technol. Ther 2016, 18 (S2), S2–3. [DOI] [PMC free article] [PubMed] [Google Scholar]
- (4).Walter JH; White FJ; Hall SK; MacDonald A; Rylance G; Boneh A; Francis DE; Shortland GJ; Schmidt M; Vail A. How practical are recommendations for dietary control in phenylketonuria? Lancet 2002, 360 (9326), 55–57. [DOI] [PubMed] [Google Scholar]
- (5).Camp KM; Lloyd-Puryear MA; Huntington KL Nutritional treatment for inborn errors of metabolism: indications, regulations, and availability of medical foods and dietary supplements using phenylketonuria as an example. Mol. Genet. Metab 2012, 107 (1–2), 3–9. [DOI] [PMC free article] [PubMed] [Google Scholar]
- (6).Goldstein A; Vockley J. Clinical trials examining treatments for inborn errors of amino acid metabolism. Expert Opin. Orphan Drugs 2017, 5 (2), 153–164. [Google Scholar]
- (7).Wilson GS; Hu Y. Enzyme-based biosensors for in vivo measurements. Chem. Rev 2000, 100 (7), 2693–2704. [DOI] [PubMed] [Google Scholar]
- (8).Wilson GS; Gifford R. Biosensors for real-time in vivo measurements. Biosens. Bioelectron 2005, 20 (12), 2388–2403. [DOI] [PubMed] [Google Scholar]
- (9).Yoo EH; Lee SY Glucose biosensors: an overview of use in clinical practice. Sensors 2010, 10 (5), 4558–4576. [DOI] [PMC free article] [PubMed] [Google Scholar]
- (10).Rathee K; Dhull V; Dhull R; Singh S. Biosensors based on electrochemical lactate detection: a comprehensive review. Biochem. Biophys. Rep 2016, 5, 35–54. [DOI] [PMC free article] [PubMed] [Google Scholar]
- (11).Kucherenko IS; Topolnikova YV; Soldatkin OO Advances in the biosensors for lactate and pyruvate detection for medical applications: A review. TrAC-Trend. Anal. Chem 2019, 110, 160–172. [Google Scholar]
- (12).Xiao Y; Lubin AA; Heeger AJ; Plaxco KW Label‐free electronic detection of thrombin in blood serum by using an aptamer‐based sensor. Angew. Chem. Int. Ed 2005, 44 (34), 5456–5459. [DOI] [PubMed] [Google Scholar]
- (13).Xiao Y; Piorek BD; Plaxco KW A reagentless signal-on architecture for electronic, aptamer-based sensors via target-induced strand displacement. J. Am. Chem. Soc 2005, 127 (51), 17990–17991. [DOI] [PubMed] [Google Scholar]
- (14).Lai RY; Plaxco KW Aptamer-based electrochemical detection of picomolar platelet-derived growth factor directly in blood serum. Anal. Chem 2007, 79 (1), 229–233. [DOI] [PubMed] [Google Scholar]
- (15).Idili A; Gerson J; Parolo C; Kippin T; Plaxco KW An electrochemical aptamer-based sensor for the rapid and convenient measurement of l-tryptophan. Anal. Bioanal. Chem 2019, 411 (19), 4629–4635. [DOI] [PMC free article] [PubMed] [Google Scholar]
- (16).Idili A; Parolo C; Ortega G; Plaxco KW Calibration-free measurement of phenylalanine levels in the blood using an electrochemical aptamer-based sensor suitable for point-of-care applications. ACS Sens. 2019, 4 (12), 3227–3233. [DOI] [PMC free article] [PubMed] [Google Scholar]
- (17).Parolo C; Idili A; Ortega G; Csordas AT; Hsu A; Arroyo-Curras N; Yang Q; Ferguson BS; Wang J; Plaxco KW Real-time monitoring of a protein biomarker. ACS sensors. ACS Sens. 2020, 5 (7), 1877–1881. [DOI] [PMC free article] [PubMed] [Google Scholar]
- (18).Plaxco KW; Soh HT Switch-based biosensors: a new approach towards real-time, in vivo molecular detection. Trends Biotechnol. 2011, 29 (1), 1–5. [DOI] [PMC free article] [PubMed] [Google Scholar]
- (19).Arroyo-Currás N; Somerson J; Vieira PA; Ploense KL; Kippin T; Plaxco KW Real-time measurement of small molecules directly in awake, ambulatory animals. Proc. Nat. Acad. Sci 2017, 114 (4), 645–650. [DOI] [PMC free article] [PubMed] [Google Scholar]
- (20).Arroyo-Currás N; Dauphin-Ducharme P; Ortega G; Ploense KL; Kippin T; Plaxco KW Subsecond-resolved molecular measurements in the living body using chronoamperometrically interrogated aptamer-based sensors. ACS Sens. 2018, 3 (2), 360–366. [DOI] [PubMed] [Google Scholar]
- (21).Idili A; Arroyo-Currás N; Ploense KL; Csordas AT; Kuwahara M; Kippin T; Plaxco KW Seconds-resolved pharmacokinetic measurements of the chemotherapeutic irinotecan in situ in the living body. Chem. Sci 2019, 10 (35), 8164–8170. [DOI] [PMC free article] [PubMed] [Google Scholar]
- (22).Dauphin-Ducharme P; Yang K; Arroyo-Currás N; Ploense KL; Zhang Y; Gerson J; Kurnik M; Kippin T; Stojanovic MN; Plaxco KW Electrochemical aptamer-based sensors for improved therapeutic drug monitoring and high-precision, feedback-controlled drug delivery. ACS Sens. 2019, 4 (10), 2832–2837. [DOI] [PMC free article] [PubMed] [Google Scholar]
- (23).Cheung KM; Yang KA; Nakatsuka N; Zhao C; Ye M; Jung ME; Yang H; Weiss PS,; Stojanovic MN; Andrews AM Phenylalanine monitoring via aptamer-field-effect transistor sensors. ACS Sens. 2019, 4 (12), 3308–3317. [DOI] [PMC free article] [PubMed] [Google Scholar]
- (24).Waisbren SE; Noel K. ; Fahrbach K. ; Cella C. ; Frame D. ; Dorenbaum A. ; Levy H. Phenylalanine blood levels and clinical outcomes in phenylketonuria: a systematic literature review and metaanalysis. Mol. Genet. Meta 2007, 92 (1–2), 63–70. [DOI] [PubMed] [Google Scholar]
- (25).Blau N. ; Van Spronsen FJ ; Levy HL Phenylketonuria. Lancet 2010, 376 (9750), 1417–1427. [DOI] [PubMed] [Google Scholar]
- (26).Cleary M; Trefz F; Muntau AC; Feillet F; van Spronsen FJ; Burlina A; Bélanger-Quintanag A; Giżewskah M; Gasteygeri C; Bettioli E; Blau N; MacDonald A. Fluctuations in phenylalanine concentrations in phenylketonuria: a review of possible relationships with outcomes. Mol. Genet. Meta 2013, 110 (4), 418–423. [DOI] [PubMed] [Google Scholar]
- (27).Caballero B; Wurtaman RJ in Dietary Phenylalanine and Brain Function (Eds.), Birkhäuser Boston, 1988, pp. 3–12. [Google Scholar]
- (28).Dauphin-Ducharme P; Ploense KL; Arroyo-Currás N; Kippin T; Plaxco KW (2020) “Electrochemical aptamer-based sensors: a platform approach to high frequency molecular monitoring in situ in the living body.” Methods in Molecular Biology, Humana Press. In press. [DOI] [PubMed] [Google Scholar]
- (29).Ferguson BS; Hoggarth DA; Maliniak D; Ploense K; White RJ; Woodward N; Hsieh K; Bonham AJ; Eisenstein M; Kippin TE; Plaxco KW; Soh HT Real-time, aptamer-based tracking of circulating therapeutic agents in living animals. Sci. Transl. Med 2013, 5 (213), 213ra165. [DOI] [PMC free article] [PubMed] [Google Scholar]
- (30).Bourget L; Chang TM Phenylalanine ammonia-lyase immobilized in microcapsules for the depletion of phenylalanine in plasma in phenylketonuric rat model. Biochimica et Biophysica Acta (BBA)-General Subjects 1986, 883, 432–438. [DOI] [PubMed] [Google Scholar]
- (31).Tengamnuay P; Shao Z; Mitra AK Systematic absorption of L-and D-phenylalanine across the rat nasal mucosa. Life Sci. 1991, 48 (15), 1477–1481. [DOI] [PubMed] [Google Scholar]
- (32).Hjelle JJ; Dudley RE; Marietta MP; Sanders PG; Dickie B; Brisson J; Kotsonis FN Plasma concentrations and pharmacokinetics of phenylalanine in rats and mice administered aspartame. Pharmacology 1992, 44 (1), 48–60. [DOI] [PubMed] [Google Scholar]
- (33).Dunlop DS; Yang XR; Lajtha A. The effect of elevated plasma phenylalanine levels on protein synthesis rates in adult rat brain. Biochem.l J 1994, 302 (2), 601–610. [DOI] [PMC free article] [PubMed] [Google Scholar]
- (34).Kaufman S. A model of human phenylalanine metabolism in normal subjects and in phenylketonuric patients. Proc. Nat. Acad. Sci 1999, 96 (6), 3160–3164. [DOI] [PMC free article] [PubMed] [Google Scholar]
- (35).Taslimifar M; Buoso S; Verrey F; Kurtcuoglu V. Propagation of plasma L-phenylalanine concentration fluctuations to the neurovascular unit in phenylketonuria: An in silico study. Front. Physiol 2019, 10, 360. [DOI] [PMC free article] [PubMed] [Google Scholar]
- (36).Jagenburg R; Olsson R; Regårdh CG; Rodjer S. Kinetics of intravenous administered l-phenylalanine in patients with cirrhosis of the liver. Clin. Chim. Acta 1977, 78 (3), 453–463. [DOI] [PubMed] [Google Scholar]
- (37).Campistron G; Guiraud R; Cros J; Mosser J. Pharmacokinetics of arginine and aspartic acid administered simultaneously in the rat: I plasma kinetics. Eur. J. Drug Metab. Ph 1982, 7 (4), 307–313. [DOI] [PubMed] [Google Scholar]
- (38).Chami J; Reidenberg MM; Wellner D; David DS; Rubin AL; Stenzel KH Pharmacokinetics of essential amino acids in chronic dialysis patients. Am. J. Clin. Nutr 1978, 31 (9), 1652–59. [DOI] [PubMed] [Google Scholar]
- (39).Tessari P; Kiwanuka E; Vettore M; Barazzoni R; Zanetti M; Cecchet D; Orlando R. Phenylalanine and tyrosine kinetics in compensated liver cirrhosis: effects of meal ingestion. Am. J. Physiol. Gastrointest. Liver. Physiol 2008, 295 (3), G598–G604. [DOI] [PubMed] [Google Scholar]
- (40).Tugtekin I; Wachter U; Barth E; Weidenbach H; Wagner DA; Adler G; Georgieff M; Radermacher P; Vogt JA Phenylalanine kinetics in healthy volunteers and liver cirrhotics: implications for the phenylalanine breath test. Am. J. of Physio.l-Endoc. M 2002, 283 (6), E1223–E1231. [DOI] [PubMed] [Google Scholar]
- (41).Tessari P; Inchiostro S; Barazzoni R; Zanetti M; Orlando R; Biolo G; Sergi G; Pino A; Tiengo A. Fasting and postprandial phenylalanine and leucine kinetics in liver cirrhosis. Am. J. of Physio.l-Endoc. M 1994, 267 (1), E140–E149. [DOI] [PubMed] [Google Scholar]
- (42).Jagenburg R; Regårdh CG; Rödjer S. Influence or age and sex on the kinetics of intravenously administered L-phenylalanine. Clinical chemistry 1982, 28 (1), 204–206. [PubMed] [Google Scholar]
- (43).Lee HB; Blaufox MD Blood volume in the rat. J. Nucl. Med 1985, 26 (1), 72–76. [PubMed] [Google Scholar]
- (44).Committee on Care and Use of Laboratory Animals (2011) Guide for the Care and Use of Laboratory Animals (National Academies Press, Washington, DC: ), 8th Ed [Google Scholar]
- (45).Vaidyanath N; Birkhahn R; Border JR; Oswald G; Trietley G; Yuan TF; Moritz E; McMenamy RH Plasma concentrations and tissue uptake of free amino acids in dogs in sepsis and starvation: effects of glucose infusion—some effects of low alimentation. Metabolism. 1978, 27 (6), 641–655. [DOI] [PubMed] [Google Scholar]
- (46).Penicaud L; Le Magnen J. Recovery of body weight following starvation or food restriction in rats. Neurosci. Biobehav. Rev 1980, 4, 47–52. [DOI] [PubMed] [Google Scholar]
- (47).Castells S; Shirali S. Daily rhythmic changes in hepatic phenylalanine hydroxylase activity: role of dietary phenylalanine. Life Sci. 1971, 10 (4), 233–239. [DOI] [PubMed] [Google Scholar]
- (48).Bik-Multanowski M; Pietrzyk JJ Blood phenylalanine clearance and BH4-responsiveness in classic phenylketonuria. Mol. Genet. Metab 2011, 103 (4), 399–400. [DOI] [PubMed] [Google Scholar]
- (49).Lutz JD; Fujioka Y; Isoherranen N. Rationalization and prediction of in vivo metabolite exposures: the role of metabolite kinetics, clearance predictions and in vitro parameters. Expert Opin. Drug Metab. Toxicol 2010, 6 (9), 1095–1109. [DOI] [PMC free article] [PubMed] [Google Scholar]
- (50).Al Hafid N; Christodoulou J. Phenylketonuria: a review of current and future treatments. Transl. Pediatr 2015, 4 (4), 304–317. [DOI] [PMC free article] [PubMed] [Google Scholar]
Associated Data
This section collects any data citations, data availability statements, or supplementary materials included in this article.


