

Summary
Drug-induced liver injury (DILI) is the main cause of drug failure in clinical trials. The characterization of toxic compounds in terms of chemical structure is important because compounds can be metabolized to toxic substances in the liver. Traditional machine learning approaches have had limited success in predicting DILI, and emerging deep graph neural network (GNN) models are yet powerful enough to predict DILI. In this study, we developed a completely different approach, supervised subgraph mining (SSM), a strategy to mine explicit subgraph features by iteratively updating individual graph transitions to maximize DILI fidelity. Our method outperformed previous methods including state-of-the-art GNN tools in classifying DILI on two different datasets: DILIst and TDC-benchmark. We also combined the subgraph features by using SMARTS-based frequent structural pattern matching and associated them with drugs’ ATC code.
Subject areas: Drugs, Computational chemistry, Artificial intelligence
Graphical abstract
Highlights
-
•
Supervised subgraph mining (SSM) constructs subgraph-level features
-
•
Subgraph-level features over-represented in DILI-positive compounds
-
•
SSM outperformed existing methods in experiments with two benchmark data sets
-
•
ATC code-specific discriminative sets of multiple subgraph features are suggested
Drugs; Computational chemistry; Artificial intelligence.
Introduction
Drug-induced liver injury (DILI) has been the leading cause of drug withdrawal or the discontinuation of newly approved drugs from the market in the US since 1970.1,2 Only 4.7 of drug candidates progress from preclinical trials to the clinical stage due to safety concerns.1,2,3 Thus, DILI is a major hurdle in drug development. While direct DILI can be detected in preclinical/clinical studies in a dose-related manner, idiosyncratic DILI is detected only at an incidence rate of 0.1% or below during clinical studies.2,4,5,6 What makes DILI identification even more difficult in clinical trials is the low concordance between DILI outcomes in animal and human models, with 63% and 43% in non-rodents and rodents, respectively.2,7,8,9 Thus, a number of research projects have been launched to characterize DILI from multiple perspectives.
Evaluating DILI directly from small-molecule drugs in terms of clinical outcomes is very difficult, and it was necessary to design new approaches to fill in a large gap in how chemical structures translate to hepatotoxic risk in humans.10 Thus, additional biochemical experiments are performed to explore the mechanism of DILI using high-throughput screening or pharmacogenomics11,12 in projects designed to bridge the gap between structural information and the DILI outcome. Tox21 is a seminal project to broadly define the chemical toxicity of more than 10,000 chemical compounds.13,14 Tox21 includes 14 major projects designed to improve our understanding of how chemical drugs reflect biochemical mechanisms and affect downstream pathways, and Tox21 data have been used for further investigation. Wu et al.15 divided drug modes of action into 17 different assays to investigate whether a drug affects individual targets. This approach demonstrated how to integrate assay data into DILI prediction to improve our knowledge of the mechanistic details of DILI. Follow-up methods adopted a similar strategy by leveraging deep learning (DL) architecture16 or gene expression profiles17 to bridge the gap between chemical structure and DILI outcome using biological/biochemical measurements.
On the other hand, we also need to understand the toxicity of small-molecule drugs directly from the chemical structure perspective because projects such as Tox21 require careful experimental design and expert knowledge on how to integrate and interpret the vast amount of experimental data, which is expensive and time consuming. For more than 90% of orally administered drugs, the liver is the main site of structure-dependent metabolism. Thus, the detection of DILI at the compound structure level requires the identification of substructures of toxic drugs. A structural alert (SA) is a substructure of a compound that contributes to a specific chemical property and determines the metabolic process of a compound. Examples of SAs include functional groups such as aromatic amines, carboxylic acids, and benzene moieties. Some chemical moieties are reported to be related to chemical toxicity, such as arylacetic acid, 2-aminothiazole, furan, aniline, and iodobenzene.18,19,20 Although several SAs for DILI have been reported and reviewed, they have not yet been extensively utilized in machine learning (ML) models.20 In recent articles, SAs were compiled for target organs based on the assumption that hepatotoxicity stems from a specific structure in the compound.21,22,23
Research problem and motivation
Research problem
In this study, we aim to develop a prediction method for DILI using compound structure information only. In addition, we wish to discover potential SAs or substructures of drugs in terms of DILI. For this goal, the main challenge is obtaining sufficient data. Hepatotoxicity results are empirically obtained over a long period of time at the clinical or commercial stage. Thus, the amount of hepatotoxicity data is very small (only 1,279 drugs by the US FDA in Thakkar et al.24) In addition, computational methods need to identify relevant features for DILI prediction. However, structural features for DILI are not well known as of now. Thus, the prediction method needs to overcome these challenges, i.e., small amounts of data for training prediction methods and feature identification for DILI.
Limitations of existing DILI prediction methods
Traditional approaches to DILI prediction mostly rely on pre-computed molecular descriptors or fingerprints.25 These fingerprints are designed to describe general chemical compounds; thus, they are not tailored to predict DILI. Because of the weak expressiveness of fingerprints, neither shallow nor deep ML techniques performed well for DILI prediction (see Section: results and Vall et al.25).
Limitations of deep or graph learning methods
Compounds can be viewed as graphs where atoms are nodes and bonds are edges. Thus, emerging graph learning methods are well suited for this task. We tested state-of-the-art graph learning methods for use in DILI prediction: MolHGCN, GraphLOG, and benchmark Graph Isomorphism Network (GIN) approaches.26,27,28 MolHGCN alleviates oversmoothing and overfitting problems by flexible modeling of the complex relationships between the atoms in molecular structures as hypergraphs. GraphLOG is a pre-training method that uses self-supervised learning to simultaneously reflect the local information of the graph and the hierarchical and global information between the graphs. GIN is one of the most expressive graph neural network (GNN) architectures which is well suited for pre-training chemical graphs.28 These methods were comparable to the previous DILI prediction methods at maximum 0.672 in AUC (see Section: results). Thus, the current graph learning algorithms are not powerful enough to overcome the challenges of the limited data for training prediction methods and feature identification for DILI. In fact, this result is consistent with the findings in a recent study that graph learning methodologies are not powerful enough to address chemical graphs.29
Our subgraph mining approach
We propose a completely different approach, a supervised subgraph mining (SSM) framework (Figure 1) where subgraph features are learned by iteratively generating subgraphs for DILI prediction (Figure 2). Our method achieved improved performance up to 0.720 in AUC compared to the previous state-of-the-art ML methods including GNNs. In addition, our method is designed to produce subgraph patterns that are overrepresented in either DILI-positive or DILI-negative chemical drugs and thus can provide structural insights on drug design.
Figure 1.

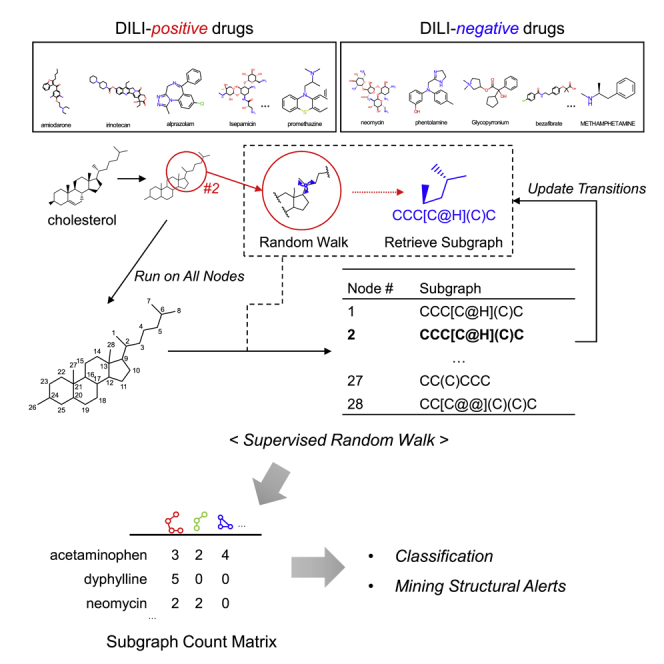
Overview of the proposed method
A set of drugs is transformed into graphs and transitions are prepared. SSM produces subgraphs in a supervised manner with optimization in terms of DILI labels. Doublet preference is used to supervise the whole process by redefining graph transitions. The final subgraph counts are then used for the classification of DILI. The proposed pipeline is evaluated on two independent DILI datasets: DILIst and TDC-benchmark (See Section: STAR Methods).
Figure 2.

Subgraph generation on chemical graphs is illustrated using cholesterol as an example
First, cholesterol compound is represented as a plain graph. For each node, transition probability is assigned and a random walker starts to traverse on the graph in a Markov chain. Subgraph is retrieved out of the visited nodes and edges. This process is run over all the nodes in the graph to generate the set of subgraphs. Then, unique subgraph counts are returned for cholesterol compound.
Subgraph generation is done by using the random walk (RW) approach, which has been successfully used in many fields of ML for graph learning.30,31,32,33 Basically, performing RW on a graph to generate subgraphs is highly dependent on the edge weights. To increase the discrimination power of RW, a supervised version of RW (supervised random walk; SRW) was introduced for link prediction34 and for identifying significant mutational clusters to classify cancer types.35 We extended SRW methods to handle a set of chemical drugs. The novelty of our approach is to iteratively update edge weights on a set of chemical graphs in a supervised way in the framework of generating, testing, and refining subgraphs.
Results
Performance was evaluated using two independent datasets: DILIst and TDC datasets (see Section: liver toxicity chemical data).
Liver toxicity chemical data
The DILI datasets used in this study are listed in Table 1. The datasets were retrieved from Thakkar et al. and24 Xu et al.37 and used as the same in this study including the data splits provided from the original literature—temporal split (before and after 1997) for DILIst and scaffold split for TDC. To consider a drug as a graph, a chemical drug was represented in SMILES and converted to rdkit mol and networkx graph objects by setting heavy atoms as nodes and bonds as undirected edges. When there were multiple graphs clustered with ionic bonds, the largest connected component (a structure composed of only covalent bonds) was selected as the compound graph. Salts and ions were removed using rdkit SaltRemover. Thus, the numbers in the datasets are different from the numbers in the references due to the applicability of our analysis framework.
Table 1.
DILI datasets used in this study
| Source | Label | Training | Validation | Test | Total |
|---|---|---|---|---|---|
| DILIst | Pa N |
455 293 |
148 98 |
603 391 |
|
| TDC | P N |
175 150 |
11 43 |
50 46 |
236 239 |
The two datasets are well balanced in DILI class labels with positive vs. negative ratios. The ratio values of DILIst dataset were 1.55:1 and 1.51:1 for training and validation datasets, respectively, while 1.17:1, 0.26:1, and 1.09:1 in TDC training, validation, and test datasets, respectively.
Performance evaluation for DILI classification
In the DILIst and TDC-benchmark datasets, SSM generated 10,459 and 9,683 subgraph features, respectively. Our model was compared to three types of existing works: previously reported DILI prediction tools, state-of-the-art DNN methods, and random forest (RF) on molecular fingerprints.
Comparison to previous DILI prediction tools
As shown in Table 2, SSM achieved the best DILI prediction performance at 0.691, 0.784, and 0.338 in AUC, F1-score, and MCC, respectively, outperforming ML methods on Mold2 descriptors as well as state-of-the-art GNN methods. For both AUC and F1-score, SSM-RF outperformed with significant margins of 0.032 and 0.029 (more than twice greater than the error values - 0.011 for AUC and 0.008 for F1-score), respectively. The only previously reported approach evaluated on the same dataset was DeepDILI,38 where the performance was 0.659 in AUC. They used an ensemble learning approach on the set of base classifiers (logistic regression, K-nearest neighbors, XGBoost, random forests, and support vector machine) to improve the prediction power. They compared three different descriptors: Mold2, Mol2vec, and MACCS. DeepDILI developed on Mold2 descriptor was reported to perform the best on DILIst dataset. Though Mold2 descriptor was developed to describe general aspects of chemical compounds as a 777-long descriptor,39 it was not sufficient for the descriptor to be used for DILI classification. In the literature, as the other descriptors also showed comparable performance (Mol2vec: 0.654 and MACCS: 0.640 in AUC), this reassures that our approach was effective in generating data-specific features.
Table 2.
Performance comparison of SSM to previous studies on DILIst dataset was retrieved from24
| Model | AUC | F1-score | MCC | Accuracy |
|---|---|---|---|---|
| SSM | ||||
| SSM - RF (margin to DeepDILI) | 0.691 0.011 (+0.032) | 0.784 0.008 (+0.029) | 0.338 0.030 (+0.007) | 0.687 0.005 (−) |
| SSM - MLP | 0.654 0.008 | 0.752 0.007 | 0.240 0.019 | 0.639 0.006 |
| SSM - soft voting: RF & MLP | 0.664 0.008 | 0.760 0.007 | 0.264 0.020 | 0.683 0.004 |
| Mold2 descriptor | ||||
| DeepDILI | 0.659 | 0.755 | 0.331 | 0.687 |
| XGBoost | 0.651 0.015 | 0.732 0.012 | 0.219 0.037 | 0.642 0.016 |
| RF | 0.658 0.012 | 0.736 0.009 | 0.225 0.030 | 0.645 0.013 |
| SVM | 0.645 0.009 | 0.752 0.008 | 0.220 0.035 | 0.646 0.013 |
| KNN | 0.580 0.021 | 0.657 0.020 | 0.125 0.038 | 0.582 0.019 |
| LR | 0.628 0.009 | 0.744 0.007 | 0.130 0.038 | 0.617 0.011 |
| Deep graph neural network methods | ||||
| InfoMax | 0.624 0.009 | 0.687 0.007 | 0.226 0.027 | 0.627 0.011 |
| ContextPred | 0.628 0.009 | 0.687 0.030 | 0.242 0.029 | 0.632 0.018 |
| EdgePred | 0.642 0.010 | 0.690 0.021 | 0.261 0.025 | 0.639 0.015 |
| AttrMask | 0.608 0.009 | 0.653 0.032 | 0.203 0.032 | 0.606 0.022 |
| MolHGCN | 0.541 0.024 | 0.669 0.023 | 0.087 0.051 | 0.576 0.025 |
| GraphLOG | 0.577 0.017 | 0.751 | 0.000 | 0.602 |
Standard error of DeepDILI was not provided from the original article.
Performance without errors in GraphLOG indicates that all predicted values were DILI-positive.
We also achieved the best AUC at 0.923 using random forest classifier for the TDC dataset (Table S1). However, the performance of previous models reached 0.919 in AUC at best by AttrMask, as reported in the official TDC publication.36 To provide more concrete comparison, we measure different metrics such as F1-score, MCC, and accuracy (Table S1). As a result, our SSM model outperformed the other methods in AUC, MCC, and accuracy values. Among the graph learning methods run in this study, EdgePred was the most effective in all the performance metrics. We note here that our algorithm was superior to the previous models when training on DILIst to test on TDC and vice versa (Table S5). For individual prediction results, see Table S6.
Comparison to graph learning methods
As our method uses subgraphs as features, a natural question would be how well the two state-of-the-art deep graph learning methods perform in DILI prediction. Thus, we compared our model with pre-trained GINs and two deep graph learning methods, MolHGCN and GraphLOG.26,27,28 Surprisingly, the performance of graph learning methods is similar to that of traditional methods. Among the GNN methods compared here, GIN-EdgePred was the best performed model at 0.642. We note here that even the best-performing GNN model (GIN-EdgePred) showed less predictive power than both unsupervised SSM (AUC: 0.686) and supervised SSM (AUC: 0.691) at the margins of 0.044 and 0.047, respectively.
GraphLOG and MolHGCN achieved 0.577 and in AUC, respectively. Their performance was far behind even to non-DL methods such as DeepDILI and our unsupervised version. We note here that GraphLOG predictions were all DILI positive. The two GNN models (GraphLOG and MolHGCN) were also run and compared on TDC-benchmark dataset. Their performance (GraphLOG: 0.723 and MolHGCN: 0.707) was far behind even to the best-performed model of our investigation: AttrMask. The main reason why such powerful graph learning technology does not work for DILI prediction is because the graph learning methods are not yet powerful enough to handle subgraphs as features and to be trained with insufficient data. This result is consistent with the findings in a recent research work.29
Comparison to molecular fingerprints
We further checked the prediction power of the refined subgraphs as follows. We first investigated whether replacing the subgraphs from SSM with widely used molecular fingerprints was effective in DILI prediction. Most of the existing widely used molecular fingerprints were not effective in DILI prediction with the highest AUC of 0.631 on DILIst dataset using Avalon40 fingerprints and 0.895 on TDC-benchmark dataset using klekota-roth41 fingerprints (Table S2). Other fingerprints, such as Morgan,42 Pubchem,43 MACCS,44 and daylight,45 were also ineffective in DILI prediction. As mentioned in Section: research problem and motivation, such fingerprints are not powerful enough to describe chemical structures although they are known to be effective for capturing general chemical features. Overall, it is evident that our strategy was successful in mining subgraph features for liver toxicity and consequently increased the prediction power of our algorithm.
Performance evaluation of experimental settings and predictions of SSM
Various parameter combinations were tested for performance optimization, such as the length of random walks , augmentation level , and the rate of updating graph transitions . The number of allowed random walks varied from 1 to 10 to investigate to how much extent subgraph mining is needed. Applying is equivalent to mining only doublets as subgraphs, where the best model AUC is 0.635. Allowing higher gradually improved the performance until , while there was a decreasing trend afterward (Table S3). This is because larger subgraphs tend to occur in a smaller number of times, thus increasing the sparsity (see Section: discussion). To reduce the sparsity of the subgraph count matrix, we applied augmented random walk that independently generates more subgraphs on each of the nodes in a graph. As a result, generating more subgraphs was effective than generating single subgraphs for each node when comparing and (Table S4). However, increasing the level of augmentation resulted in a steady decrease in performance. Varying did not show a significant difference in performance. Testing on both the and , the AUC values were 0.684 and 0.690, respectively.
Doublet preference: Indicators to reflect the difference in DILI labels
As doublets are the most basic unit to build chemistry, doublet preference was first explored for DILI-positive/negative drugs. The spectrum of the doublet preference is shown in Figure 3A. Aromatic bonds (C:O and C:S) are found to be more preferred by DILI-positive drugs to DILI-negative drugs (89.3% and 70.8% DILI-positive preference, respectively). It was also interesting that C-F bond is prevalent in subgraph features of DILI-positive drugs, while C-Cl bond is the opposite even though both F and Cl are in the same halogens. When the halogen is changed to iodine, DILI-negative compounds are found to be prevalent at 82.0%. Thus, it is found that the larger the halogen element bonded to aliphatic carbon (C-F C-Cl C-I), the less liver toxicity is likely to be found in chemical compounds. We note here that N-N and O=S bonds are also found to be strong toxic alert candidates in the previous literature.46
Figure 3.

Doublet preference used from mined subgraph features
(A) Spectrum of commonly present doublets with probability of each class label.
(B) Doublet preference over iteration of OS and NO. At the initial state (unsupervised), the difference between DILI-positive and DILI-negative drugs to use of the two bonds was marginal. However, after several steps, the preference was reinforced to favor the either of the DILI labels.
To investigate how doublet preference changes over iterations, both OS and NO were chosen as examples (Figure 3B). Both of the doublets are more frequently found and used by DILI-positive drugs at the first step (SSM without supervision). As supervision applied, the preference of both doublets to DILI-positive drugs increased.
Convergence of transitions
We first investigated how fast each of the transition matrices converges over iterations. Figure S2 shows the convergence of the drugs in DILIst dataset. All the transition matrices converge dramatically at the beginning of the iteration. After several iterations, there are subtle fluctuations at later iterations. The top 3 convergent drugs are AMANTADINE (CID: 2130), TERBUTALINE (CID: 5403), and PROPOFOL (CID: 4943) and the least 3 convergent drugs are FOSFOMYCIN (CID: 446987), CID: 16682735, and CID: 5255827.
When we ranked the drugs in terms of the convergence rate of the corresponding transition matrix, there was a no statistically significant difference in the rate of convergence between DILI-positive and DILI-negative drugs as shown in Figure S3 ( = 0.3148; Kolmogorov-Smirnov test). To investigate whether such difference was not correlated with chemical properties, the convergence rank was compared with molecular weight, logP, the number of rings, and the number of aromatic rings (Figure S4). No significant correlation was observed between the convergence rate and either of molecular weight and logP. However, there was a slight correlation between convergence and the number of ring systems. There was a steady decrease in convergence as the number of rings starts from 0 to 6 (third panel of Figure S4). However, gradual increase in the convergence rate was observed in growing number of aromatic rings (fourth panel of Figure S4).
Discussion
To train ML models from data, features need to be well defined, and the amount of data needs to be sufficient. Often, both data and features are well defined in ML model development. However, the amount of data in the case of DILI prediction is very small (Table 1). Widely used features such as molecular fingerprints have limitations in discovering important features of chemical compounds for DILI (Table S2). In addition, it is important that DILI features are constructed in a way that allows chemical interpretation. Thus, we used subgraphs as DILI features. A natural question arises here—what subgraphs are important in terms of DILI? Thus, we discuss our results in terms of the enrichment of the subgraphs for DILI.
Evaluation of SA potentials of single subgraphs
Doublets are too small in size to reflect the mechanistic diversity in chemistry of various sizes and compositions. In fact, DILI prediction using = 1 (using doublets as features) had 0.667 in AUC at best, far behind the optimized performance (Table S3). Thus, we tried to represent important features using subgraphs. To understand the behavior of our model on the chemistry side, the SA potentials of single subgraphs were investigated using the feature importance of the trained RF model. For DILIst dataset, our model generated 10,459 subgraphs, of which 5,233, 2,736, and 2,490 subgraphs were present in DILI-positive-only, both, and DILI-negative-only drugs, respectively.
The 762 subgraphs were considered important with entropy 0.5 and feature importance 0.0001 in classifying DILI compounds (Table S7). Entropy was measured on each subgraph by comparing the support between DILI-positive and DILI-negative drugs. Feature importance was calculated from random forests classifier. Among the subgraphs, 29 subgraphs of greater support in DILI-positive drugs than in DILI-negative drugs with more than 1% support in DILI-positive drugs were considered as single-subgraph SAs in this study (Table 3). Among them, sixteen subgraphs (red-colored in Table 3) showed high fidelity to DILI-positive drugs in both training and test datasets. For example, cNc(c)c was exclusively present in 1.98% of DILI-positive drugs. This pattern was similarly observed in the test data with 2.03% coverage for DILI-positive drugs. For selected subgraphs (cNc(c)c, cSccc, NNC=O, cccBr, ccCNCCNC, and CCC=CN), matched drugs are displayed in Figure 4. We were able to observe that there are commonly present substructures within the subgraph-matched drugs of each panel in Figure 4. For example, in case of cNc(c)c (Figure 4A), seven out of nine drugs (piperacetazine, chlorpromazine, cyamemazine, perphenazine, trimeprezine, phenothiazine, and promethazine) share phenothiazine moiety as common backbone structure. They are all categorized as tricyclic antidepressants. This was also the case in cSccc-matched drugs (Figure 4B) as nine out of eleven drugs are of phenothiazine-based tricyclic antidepressants. We note that none of the subgraphs displayed in Figures 4A–2F were found in DILI-negative drugs. Thus, we were able to observe that these subgraphs are single-subgraph SAs.
Table 3.
Twenty-nine subgraphs with feature importance 0.001 and entropy 0.5
| SMILES | Support (Train) |
Support (Valid) |
Importance x (1e-2) |
||
|---|---|---|---|---|---|
| F_NT | F_T | F_NT | F_T | ||
| CCNN | 0.34 | 2.86 | 1.02 | – | 0.094 |
| C[C@](C)(C)C | 0.34 | 3.08 | – | – | 0.064 |
| cNc(c)c | – | 1.98 | – | 2.03 | 0.057 |
| C[C@H](C)CO | – | 2.20 | 4.08 | 0.68 | 0.048 |
| nncS | – | 1.76 | – | – | 0.044 |
| cSccc | – | 2.42 | – | 0.68 | 0.042 |
| NNC=O | – | 2.20 | – | 1.35 | 0.042 |
| cScc | 0.34 | 2.86 | – | 0.68 | 0.040 |
| cncc[nH] | – | 1.54 | – | 0.68 | 0.030 |
| CCOCn | – | 1.10 | 2.04 | – | 0.022 |
| CC(=C)N | – | 1.98 | 1.02 | 0.68 | 0.021 |
| cc(c)o | – | 1.76 | – | 1.35 | 0.020 |
| C=CN | – | 1.31 | 2.04 | 0.68 | 0.019 |
| CCC=CN | – | 1.10 | – | 0.68 | 0.018 |
| cccBr | – | 1.54 | – | 1.35 | 0.018 |
| ccScc | – | 1.76 | – | 1.35 | 0.018 |
| ccCNCCNC | – | 1.32 | – | 1.35 | 0.017 |
| cccCNCCCC | – | 1.10 | 1.02 | 2.03 | 0.017 |
| CC(N)=CC | – | 1.32 | 1.02 | – | 0.016 |
| Coc | – | 1.10 | – | 0.68 | 0.011 |
| cc(N)cS | – | 1.32 | – | – | 0.011 |
| cCNCC = O | – | 1.10 | 1.02 | – | 0.011 |
| C[C@@H](C)CO | – | 1.98 | 4.08 | 2.70 | 0.011 |
| C/C(c)=N | – | 1.10 | – | 0.68 | 0.010 |
| C=C[C@H](C)C | – | 1.10 | – | – | 0.010 |
| C1=CCCCC1 | – | 1.10 | 1.02 | 0.68 | 0.010 |
| C=C/CO | – | 1.54 | 3.06 | – | 0.010 |
| NC=CCS | – | 1.10 | – | – | 0.010 |
| C[C@@H](C)CCCC | – | 1.10 | – | 1.35 | 0.010 |
| CNCC=O | – | 1.10 | – | 0.68 | 0.010 |
| cccSC | – | 1.10 | – | 0.68 | 0.010 |
Figure 4.

Examples of single SA identification
(A) cNc(c)c, (B) cSccc, (C) NNC=O, (D) cccBr, (E) ccCNCCNC, and (F) CCC=CN. For each SA, matched patterns in each of the drugs are highlighted. All the drugs here are labeled as DILI-positive.
Discriminative subgraph combinations of DILI with respect to the drugs’ ATC code
A set of subgraphs is mixed up in a single compound, and they co-occur at different positions with varying inter-distances. We want to discover a set of subgraphs that are overrepresented in DILI-positive/negative compounds. Thus, a set of these subgraphs is referred to as discriminative subgraph combinations (DiSC) and further considered as potential SAs for DILI-positive drugs. We used SMILES arbitrary target specification (SMARTS) language47 to combine individual subgraphs where “.” notation denotes a combined string representation of subgraphs. There are 500 and 368 subgraphs for DiSC identification in DILIst and TDC-benchmark datasets, respectively. We experimented on 2-subgraph and 3-subgraph combinations in this study. Detailed methods are described in Discriminative Subgraph Combinations.
We investigate whether subgraph combinations are enriched according to Anatomical Therapeutic Chemical Classification System (ATC) code of the matched drugs (See Discriminative Subgraph Combinations and Table 4). There are 68 and 44 DiSCs of 2-subgraph and 3-subgraph combinations in DILIst dataset, respectively. (Table 4).
Table 4.
DiSCs enriched to ATC code
| ATC | Description | DiSC | Total Drugs |
Matched Drugs |
-value | Coverage | ||
|---|---|---|---|---|---|---|---|---|
| DILIp | DILIn | DILIp | DILIn | |||||
| 2-subgraph DiSCs | ||||||||
| A03 | Drugs for functional gastrointestinal disorders | C=O.COccO | 5 | 4 | 0 | 1 | 7.72e-3 | 0.11 |
| A10 | Drugs used in diabetes | CCCCCCNC.CCc | 1 | 11 | 0 | 3 | 9.78e03 | 0.25 |
| C01 | Cardiac therapy | cCCN.cO | 9 | 10 | 5 | 1 | 1.77e-3 | 0.32 |
| C03 | Diuretics | CCC.ccccS | 4 | 8 | 2 | 1 | 8.04e-3 | 0.25 |
| C07 | Beta blocking agents | CCCNC.cc(c)C=O | 7 | 6 | 0 | 3 | 3.80e-3 | 0.23 |
| C08 | Calcium channel blockers | CCC.cC(C)CC | 4 | 10 | 2 | 2 | 6.85e-3 | 0.29 |
| C09 | Agents acting on the renin–angiotensin system | CCCCCCNC.CCc | 2 | 12 | 0 | 4 | 7.31e-3 | 0.29 |
| C10 | Lipid modifying agents | cC=O.cOCC | 2 | 9 | 1 | 1 | 6.14e-3 | 0.18 |
| J01 | Antibacterials for systemic use | Cccc.O=CCNC=O | 11 | 39 | 5 | 16 | 4.21e-5 | 0.42 |
| J05 | Antivirals for systemic use | CCC.cc(n)N | 4 | 7 | 2 | 0 | 5.01e-3 | 0.18 |
| L01 | Antineoplastic agents | CN.cCCO | 11 | 29 | 6 | 6 | 6.18e-6 | 0.30 |
| M01 | Anti-inflammatory and antirheumatic products | Ccc.cc(c)c | 2 | 11 | 1 | 2 | 5.30e-3 | 0.23 |
| M03 | Muscle relaxants, directly acting agents | C=O.CC[N&+](C)C | 5 | 7 | 3 | 0 | 5.57e-3 | 0.25 |
| N01 | Anesthetics | C1CCNCC1.Cc(c)ccc | 5 | 7 | 2 | 1 | 8.94e-3 | 0.25 |
| N02 | Analgesics | CC.cC(C)CC | 13 | 6 | 9 | 0 | 7.61e-3 | 0.47 |
| N03 | Antiepileptics | CN.cC(C)CC | 2 | 10 | 1 | 2 | 9.05e-3 | 0.25 |
| N05 | Psycholeptics | CCC.ccccS | 18 | 28 | 2 | 8 | 9.98e-8 | 0.22 |
| N06 | Psychoanaleptics | ccccN.cn | 5 | 22 | 0 | 4 | 9.74e-6 | 0.15 |
| P01 | Antiprotozoals | C1CCNCC1.Cc(c)ccc | 3 | 8 | 0 | 2 | 6.71e-3 | 0.18 |
| R06 | Antihistamines for systemic use | CO.C1CCNCC1 | 8 | 6 | 3 | 1 | 7.35e-3 | 0.29 |
| 3-subgraph DiSCs | ||||||||
| A03 | Drugs for functional gastrointestinal disorders | C=O.COccO.CNCC | 5 | 4 | 0 | 1 | 7.72e-3 | 0.11 |
| A10 | Drugs used in diabetes | ccC.cccCCN.CC | 1 | 11 | 0 | 2 | 4.17e-3 | 0.17 |
| C01 | Cardiac therapy | ccO.cCCN.cO | 9 | 10 | 5 | 0 | 6.39e-4 | 0.26 |
| C07 | Beta blocking agents | CC(C)N.cOC.CCCcc | 7 | 6 | 3 | 0 | 4.29e-3 | 0.23 |
| C08 | Calcium channel blockers | CC.cC(C)CC.CCN(C)CC | 4 | 10 | 0 | 2 | 1.37e-3 | 0.14 |
| C09 | Agents acting on the renin–angiotensin system | cCC.ccCCCN.CC | 2 | 12 | 1 | 3 | 7.41e-3 | 0.29 |
| C10 | Lipid modifying agents | cC.ccc(c)c.c1ccccc1 | 2 | 9 | 0 | 2 | 6.94e-3 | 0.18 |
| J01 | Antibacterials for systemic use | Cccc.CCSCC.O=CCNC=O | 11 | 39 | 4 | 15 | 1.21e-5 | 0.38 |
| J05 | Antivirals for systemic use | CCC.cc(n)N.cn | 4 | 7 | 2 | 0 | 5.01e-3 | 0.18 |
| L01 | Antineoplastic agents | CCC.cCCO.cO | 11 | 29 | 5 | 4 | 6.63e-7 | 0.23 |
| M03 | Muscle relaxants, directly acting agents | CCC.OccO.C=O | 5 | 7 | 2 | 1 | 8.94e-3 | 0.25 |
| N01 | Anesthetics | C=O.C1CCNCC1.Cc(c)ccc | 5 | 7 | 2 | 1 | 8.94e-3 | 0.25 |
| N02 | Analgesics | CCCO.cCCN.Cccccc | 13 | 6 | 9 | 0 | 7.61e-3 | 0.47 |
| N05 | Psycholeptics | cccN.cccS.CCN(C)C | 18 | 28 | 2 | 7 | 4.70e-8 | 0.20 |
| N06 | Psychoanaleptics | CC.COccO.CNCC | 5 | 22 | 2 | 7 | 4.06e-6 | 0.11 |
| P01 | Antiprotozoals | cc.cccccc.Cc(c)ccc | 3 | 8 | 0 | 2 | 6.71e-3 | 0.18 |
| R06 | Antihistamines for systemic use | CO.C1CCNCC1.Cc1ccccc1 | 8 | 6 | 3 | 1 | 7.35e-3 | 0.29 |
The subgraph patterns were retrieved for those of -value less than 0.01 and the coverage on the corresponding ATC code more than 10%. In this table, only 20 and 17 representative patterns with the maximum coverage for each ATC code are displayed for 2-subgraph and 3-subgraph patterns, respectively. ATC code (level 2) was matched to each drug for upon availability. Full list of DiSCs, matched CIDs, and SMILES information is provided in Table S8. (-values were calculated by chi-square test).
Among the 2-subgraph DiSCs, drugs with “ccccN.cn” on ATC:N06 (psychoanaleptics) and “Cccc.O=CCNC=O” on ATC:J01 (antibacterials for systemic use) are displayed in Figures 5 and 6, respectively. Drugs matched with “ccccN.cn” on ATC:N06 were mirtazapine, tacrine, nefazodone, and trazodone. Both nefazodone and trazodone share the common backbone structure that is not found in any of DILI-positive drugs without the pattern. There are 16 out of 39 DILI-positive drugs matched with “Cccc.O=CCNC=O” on ATC:J01 drugs (Figure 6). Among the 3-subgraph DiSCs, drugs with “cccN.cccS.CCN(C)C” on ATC:N05 (psycholeptics) and “CC.cC(C)CC.CCN(C)CC” on ATC:C08 (calcium channel blockers) are displayed in Figures 7 and 8.
Figure 5.

“ccccN.cn” enriched to ATC code: N06 (Psychoanaleptics)
The matched drugs are displayed along with subgraph pattern as highlighted.
Figure 6.

“Cccc.C=CCNC=O” enriched to ATC code: J01 (Antibacterials for systemic use)
The matched drugs are displayed along with subgraph pattern as highlighted.
Figure 7.

“cccN.cccS.CCN(C)C” enriched to ATC code: N05 (Psycholeptics)
The matched drugs are displayed along with subgraph pattern as highlighted.
Figure 8.

“CC.cC(C)CC.CCN(C)CC” enriched to ATC code: C08 (Calcium channel blockers)
The matched drugs are displayed along with subgraph pattern as highlighted.
Limitations of the study
There are two limitations when using individual subgraphs as SA candidates. First, there is a trade-off between coverage and specificity. A small-sized subgraph is likely to be found in a significant number of drugs, resulting in many false positives. In contrast, with a large subgraph, the coverage for DILI-positive/negative drugs is decreased. Among the exclusively present SAs, only six (C[C@](C)(C)C, CCNN, cScc, cSccc, NNC=O, and C[C@H](C)CO) exceeded 2% fidelity to DILI-positive drugs in the training data. Second, single subgraphs cannot account for the variations derived from bioisosteres.48 Partial modifications outside the core structure of the toxic motifs can lead to similar toxicity mechanisms.49 Thus, we extended our approach to “structured SAs” to suggest extended SAs with both specific and meaningful coverage against DILI-positive drugs.
Besides, as mentioned in Results that DL methods suffer from the lack of data in DILI classification, our method can also be improved by incorporating more DILI information. Recent studies in graph learning extensively use pre-training strategies using a large-scale non-labeled chemical database (e.g. Zinc lead compounds) to build an embedding of chemical compounds with rich structural diversity. Future methods can be directed to leverage non-labeled chemical structures in building subgraph features.
Finally, potential SAs need to be experimentally verified, which is costly and time consuming. An effective strategy would be to prospectively examine the presence of these DILI-alert and DILI-safe subgraphs in newly reported toxic drugs. On the computational side, our algorithm does not guarantee the discovery of all subgraphs overrepresented in toxic drugs. The main reason is that subgraph generation using SRW does not enumerate all possible subgraph set, although the iterated supervision on doublet probabilities has shown good convergence behavior. Another important graph mining issue is that subgraphs from DILI datasets may not be sufficient to estimate the true distribution of chemical compound space in terms of DILI. DL-based link prediction methods can be extended for this purpose, but the technology is not yet powerful enough to overcome problems of insufficient data.
Conclusion
Our work explicitly uses subgraphs as features to classify the liver toxicity of chemical drugs. To the best of our knowledge, our approach is the first subgraph mining approach for DILI prediction. Our contributions can be summarized as follows. First, the prediction accuracy of chemical toxicity outperforms the previous tools and state-of-the-art GNN methods. Second, subgraphs with high/extreme fidelity to DILI were extensively searched for by iterative supervision on graph transitions. Thus, the subgraph population can be directly used to catalog structural characteristics and to infer mechanism of DILI. We compiled 762 potential single SAs and 68 DiSCs enriched to either DILI label. Finally, our report can be extended as a computational guidance to structure-based drug design, as both DILI-alert and DILI-safe subgraph sets are prepared against many disease targets (ATC codes).
STAR★Methods
Key resources table
| REAGENT or RESOURCE | SOURCE | IDENTIFIER |
|---|---|---|
| Deposited data | ||
| DILIst dataset | Li et al., 202038 | https://pubs.acs.org/doi/suppl/10.1021/acs.chemrestox.0c00374/suppl_file/tx0c00374_si_004.xlsx |
| Therapeutics Data Commons (TDC) - DILI dataset | Huang et al., 202136 | https://tdcommons.ai/single_pred_tasks/tox/#dili-drug-induced-liver-injury |
| Software and algorithms | ||
| Supervised Subgraph Mining (SSM) | This study | https://github.com/sslim0814/SSM |
| DeepDILI | Li et al., 202038 | https://github.com/TingLi2016/DeepDILI |
| GIN - InfoMax/ContextPred/EdgePred/AttrMask | Hu et al., 202028 | https://github.com/snap-stanford/pretrain-gnns |
| MolHGCN | Chen et al., 202226 | https://github.com/fychen32/MolHGCN |
| GraphLOG | Xu et al., 202127 | https://github.com/DeepGraphLearning/GraphLoG |
Resource availability
Lead contact
Further information and requests for resources and reagents should be directed to and will be fulfilled by the lead contact, Sun Kim (sunkim.bioinfo@snu.ac.kr).
Materials availability
This study did not generate new unique reagents.
Method details
An overview of the proposed method is illustrated in Figure 1. Each part is explained in detail as follows.
-
•
Preliminaries
-
•
Generate candidate subgraphs by supervised random walks
-
•
Updating Graph Transitions
-
•
Experiments for Performance Evaluation
-
•
Structural Alert Mining from Subgraph Features
Preliminaries
A chemical compound is transformed into an undirected and unweighted graph that consists of a set of nodes (heavy atoms) and a set of edges (bonds). The degree and adjacency matrices of are denoted as and , respectively. The transition matrix of is defined as . For a set of graphs that are labeled DILI-positive or DILI-negative, the doublet preference denotes the frequency table with counts of both labels for each distinct doublet found in (Figure S1). In addition, is a hyperparameter for updating graph transition matrix ; denotes the number of iterations; is the number of allowed walks; is the number of subgraphs for the augmentation.
Supervised subgraph mining algorithm
The workflow of our subgraph mining algorithm is illustrated in Figure 1 and Algorithm 1. Subgraphs are generated using a supervised RW-based approach so that subgraphs are overrepresented in either DILI-positive or DILI-negative class labels, not both. The final subgraphs set is stored and used for the next iteration. This process is iteratively executed by updating the graph transitions of each chemical graph using the doublet preference . From the subgraph sets stored as a result of each iteration, the subgraph set with the highest accuracy is selected as the final feature for the DILI prediction model. The whole procedure is described more formally in Algorithm 1.
Algorithm 1.

Overall procedure of supervised subgraph mining
Generate candidate subgraphs by supervised random walks
As in Algorithm 1, subgraphs are generated for each of the nodes in a chemical graph . For each node in , a random walker selects one of its direct neighbors based on transition probabilities in . The selection of nodes and edges by the walker is recorded for a preset number of random walks in a Markov chain model. Then, the final sets of two node and edge lists are used to mine a subgraph. We allowed multiple subgraphs to be generated from each node by setting up augmentation so that they independently traverse the compound graph, generating subgraphs. The final subgraph information of is then translated into a frequency table.
As an example, in Figure 2, cholesterol is transformed into an undirected and unweighted graph where the nodes are heavy atoms and the edges are bonds between the atoms. Then, for carbon numbered 2, a walker traverses the cholesterol graph with ten walks allowed ( = 10) producing the list of visited nodes (blue-colored numbers from 1 to 10). The subgraph retrieved using the graph traversal information is CCC[C@H](C)C (in SMARTS). This process is applied to all the nodes in the cholesterol graph to generate subgraphs. There are 28 subgraphs with . The subgraphs are summarized by which and how many subgraphs are generated. Thus, the final frequency table of cholesterol is {CCCC:6, CC(C)C:3, CCC[C@H](C)C: 2, …}.
Updating graph transitions
Subgraphs set as a result of each iteration is used to update the graph transitions for the next iteration. For this process, all subgraphs in are decomposed into doublets, and the doublets are counted for each class of origin. This means that the subgraph outcome is translated into a doublet-based class preference regarding how many time doublets are used in both class labels. The counts are then normalized to probabilities for each doublet to calculate the doublet preference . In Figure S1, there are selected subgraphs from two example drugs from both class labels. These subgraphs are decomposed into doublets, resulting in 13 unique doublets as a union set. Then, subgraphs are counted for each class of origin. There are 2 and 1 C-C subgraphs in the DILI-positive and DILI-negative classes, corresponding to 0.67 and 0.33 probability values, respectively.
Finally, the transition matrix of each compound graph is updated using the doublet preference depending on the given class label of a compound. Given an adjacency matrix = and a doublet preference of a compound graph, the temporary transition matrix is built as , where if and the doublet consisting of vertices (=heavy atoms) i, j and their connecting edge (=bond) exists in ; otherwise, . and are the DILI-positive and DILI-negative frequencies of the doublet in , respectively. Subsequently, is row-wise normalized ( = 1). As there are iterations, is updated using at iteration with parameter to calculate , where varying the hyperparameter controls the rate of supervision (Equation 1).
| (Equation 1) |
Experiments for performance evaluation
DILI prediction was performed by the ensemble of both random forest (RF) and multi-layer perceptron (MLP) classifiers of the sklearn library (version 0.23.2) of Python 3.7.7 on the subgraph count matrix from SSM. We chose the best performed model by combining both of the classifiers. For the RF classifier, the number of base trees was 100. For the MLP classifier, two layers were stacked with 1024 and 128 neurons for the first and second layer, respectively. Other parameters were set default unless mentioned elsewhere. Area under the ROC Curve (ROC-AUC) was used as a metric of performance. The results from the previous DILI prediction tools were retrieved from37,38 and directly compared in this study. Also, selected state-of-the-art GNN methods (GraphLOG,27 MolHGCN and GIN36) are directly run on the same DILI data sets in this study. For supervised subgraph generation, we tested all parameter combinations for , , and .
Structural alert mining from subgraph features
Single-subgraph SAs
Subgraphs that are mined by our SSM algorithm are overrepresented in either DILI-positive or DILI-negative drugs. In addition, individual subgraphs are tested for their predictive power for DILI with independent data sets. We chose important subgraphs with feature importance 0.0001 (greater than random importance) from the random forests model and entropy 0.5 at the individual subgraph level as single-subgraph SAs.
Discriminative subgraph combinations
A potential SA is a set of subgraphs that co-occur in many toxic compounds but not necessarily at consecutive positions of a compound. Thus, we name this set of subgraphs as Discriminative Subgraph Combinations (DiSCs).
However, there are two major challenges for mining potential SAs by combining subgraphs. First, there are small subgraphs with many overlapping parts due to their similar chemical composition: as we can see in the DILIst data that the average numbers of nodes and edges in the subgraphs are 6.11 1.25 and 5.16 1.27, respectively. Thus, we need to effectively combine them to increase the coverage of subgraphs in toxic drugs. Second, it is computationally infeasible to enumerate all possible subgraph combinations. Our SSM produced 10,459 subgraphs (see Section: results). Combining two of the 10,459 subgraphs from SSM requires to consider = 54,690,111 combinations. In general, these would require considering combinations. Thus, a strategy to combine all subgraphs would result in many false-positive SAs, although we did investigate whether subgraph combinations are overrepresented in toxic compounds.
We tackle the problem of characterizing DiSCs as follows: (1) mining non-overlapping subgraphs by utilizing SMARTS based pattern matching (2) iterative extension upon promising DiSC candidates. To cope with the exponentially large search space, we utilized a branch-and-bound like search tree pruning.
In this study, we restricted the template subgraphs to be combined into SMARTS pattern at 2% minimum support against the whole data drugs. This is because the individual subgraphs are sufficiently large enough to be matched against compound graphs, thus, combining more than three subgraphs hardly produces informative SAs, rather produces highly sparse SAs. Moreover, considering all possible combinations of subgraphs requires exponential computational cost, which is not feasible. As we have selected the individual subgraphs for DiSC as those with more than 2% support, there are 500 and 368 subgraphs used for DILIst and TDC-benchmark data sets, respectively.
-
1.
Among the found subgraphs , those with support less than 2% are dropped. For the remaining ones, if and have same support (occurs in the same set of compounds) while is a subgraph of , is again dropped.
-
2.
Remaining subgraphs are considered as 1-mer SAs ; we repeat the following step to find -mer SAs for 1.
-
(a)
For and subgraph , we generate the SMARTS pattern for to by using grouping operator ‘.’.
-
(b)
Match the generated pattern to the set of compounds to find support on DILI-positive and support on DILI-negative drugs, and compute entropy-based significance score of the support values to see whether this -mer is a potential SA. The significance is computed as:
(c)If the significance or support is below the predefined criteria (resp. 0.1 and 0.02), we define this to be (resp.) insignificant/infrequent and discard from further enumeration. Otherwise, we add to .
As the potential SA pattern grows in size, support does monotonically decrease, but in general entropy does not. Nevertheless, to explore the vast search space effectively, our approach can be interpreted as growing the promising SAs. We note that for initial , entropy cutoff is not applied, due to small generic backbone subgraphs such as short carbon chains appearing universally among both toxic and nontoxic compounds. Application of entropy cutoff to can lead to a premature termination of the search, ignoring meaningful combination of small motifs that can be informative in identifying toxic compounds.
To make our results interesting, DiSCs were investigated against ATC code of the data set drugs.
Acknowledgments
This research was supported by the Collaborative Genome Program for Fostering New Post-Genome Industry of the National Research Foundation (NRF) funded by the Ministry of Science and ICT (MSIT) (No. NRF-2014M3C9A3063541), by the Bio & Medical Technology Development Program of the National Research Foundation (NRF) & funded by the Korean government (MSIT) (No. 2022M3E5F3085677, NRF-2022M3E5F3085681), by Institute of Information & communications Technology Planning & Evaluation (IITP) grant funded by the Korea government (MSIT) [NO. 2021–0-01343, Artificial Intelligence Graduate School Program (Seoul National University)], by a grant (No. DY0002259501) from Ministry of food and Drug Safety, and by Basic Science Research Program through the NRF funded by the Ministry of Education (NRF-2022R1A6A3A01087470).
Author contributions
S.Lim and S.K. conceptualized the study. S.Lim and S.K. obtained funding. S.K. and S.Lim wrote the initial manuscript. S.Lim developed overall algorithm. Y.K. performed GNN comparisons. J.G. provided medicinal insights and discussions. W.S. run SMARTS-based pattern mining. S.Lee revised the algorithm and logic. S.K. supervised the project. All authors discussed the results and revised the manuscript.
Declaration of interests
The authors declare no competing interests.
Published: January 20, 2023
Footnotes
Supplemental information can be found online at https://doi.org/10.1016/j.isci.2022.105677.
Supplemental information
Performance Evaluation for DILI Classification. A DILIst test data, B TDC benchmark test data, Please refer to the excel file (file name: SSM_extended_supplementary_tables.xlsx) attached to the Supplementary File. See STAR Methods for experimental details.
Evaluation of SA Potentials of Single Subgraphs. Please refer to the excel file (file name: SSM_extended_supplementary_tables.xlsx) attached to the Supplementary File. See STAR Methods for experimental details.
Please refer to the excel file (file name: SSM_extended_supplementary_tables.xlsx) attached to the Supplementary File. See STAR Methods for experimental details.
Data and code availability
-
•
DILIst data set can be found in Li et al.38 and TDC benchmark data set can be found in https://tdcommons.ai/single_pred_tasks/tox/#dili-drug-induced-liver-injury.
-
•
All original code has been deposited at GitHub and is publicly available as of the date of publication. The DOI is listed in the key resources table.
-
•
Any additional information required to reanalyze the data reported in this paper is available from the lead contact upon request.
References
- 1.Stevens J.L., Baker T.K. The future of drug safety testing: expanding the view and narrowing the focus. Drug Discov. Today. 2009;14:162–167. doi: 10.1016/j.drudis.2008.11.009. [DOI] [PubMed] [Google Scholar]
- 2.Andrade R.J., Chalasani N., Björnsson E.S., Suzuki A., Kullak-Ublick G.A., Watkins P.B., Devarbhavi H., Merz M., Lucena M.I., Kaplowitz N., et al. Drug-induced liver injury. Nat. Rev. Dis. Prim. 2019;5:1–22. doi: 10.1038/s41572-019-0105-0. [DOI] [PubMed] [Google Scholar]
- 3.Berggren R., Möller M., Moss R., Poda P., Smietana K. Outlook for the next 5 years in drug innovation, Nature reviews. Nat. Rev. Drug Discov. 2012;11:435. doi: 10.1038/nrd3744. [DOI] [PubMed] [Google Scholar]
- 4.U.S. Department of Health and Human Services Food and Drug Administration Guidance for industry drug-induced liver injury: premarketing clinical evaluation. Drug Safety. 2009 [Google Scholar]
- 5.Hoofnagle J.H., Björnsson E.S. Drug-induced liver injury—types and phenotypes. N. Engl. J. Med. 2019;381:264–273. doi: 10.1056/NEJMra1816149. [DOI] [PubMed] [Google Scholar]
- 6.Mondaca S.P., Liu D., Flynn J.R., Badson S., Hamaway S., Gounder M.M., Khalil D.N., Drilon A.E., Li B.T., Jhaveri K.L., et al. Clinical implications of drug-induced liver injury in early-phase oncology clinical trials. Cancer. 2020;126:4967–4974. doi: 10.1002/cncr.33153. [DOI] [PMC free article] [PubMed] [Google Scholar]
- 7.Olson H., Betton G., Robinson D., Thomas K., Monro A., Kolaja G., Lilly P., Sanders J., Sipes G., Bracken W., et al. Concordance of the toxicity of pharmaceuticals in humans and in animals. Regul. Toxicol. Pharmacol. 2000;32:56–67. doi: 10.1006/rtph.2000.1399. [DOI] [PubMed] [Google Scholar]
- 8.Mulliner D., Schmidt F., Stolte M., Spirkl H.-P., Czich A., Amberg A. Computational models for human and animal hepatotoxicity with a global application scope. Chem. Res. Toxicol. 2016;29:757–767. doi: 10.1021/acs.chemrestox.5b00465. [DOI] [PubMed] [Google Scholar]
- 9.Chierici M., Francescatto M., Bussola N., Jurman G., Furlanello C. Predictability of drug-induced liver injury by machine learning. Biol. Direct. 2020;15:3–10. doi: 10.1186/s13062-020-0259-4. [DOI] [PMC free article] [PubMed] [Google Scholar]
- 10.Fraser K., Bruckner D.M., Dordick J.S. Advancing predictive hepatotoxicity at the intersection of experimental, in silico, and artificial intelligence technologies. Chem. Res. Toxicol. 2018;31:412–430. doi: 10.1021/acs.chemrestox.8b00054. [DOI] [PubMed] [Google Scholar]
- 11.Keenan A.B., Jenkins S.L., Jagodnik K.M., Koplev S., He E., Torre D., Wang Z., Dohlman A.B., Silverstein M.C., Lachmann A., et al. The library of integrated network-based cellular signatures nih program: system-level cataloging of human cells response to perturbations. Cell Syst. 2018;6:13–24. doi: 10.1016/j.cels.2017.11.001. [DOI] [PMC free article] [PubMed] [Google Scholar]
- 12.Wang Z., Clark N.R., Ma’ayan A. Drug-induced adverse events prediction with the lincs l1000 data. Bioinformatics. 2016;32:2338–2345. doi: 10.1093/bioinformatics/btw168. [DOI] [PMC free article] [PubMed] [Google Scholar]
- 13.Andersen M.E., Krewski D. Toxicity testing in the 21st century: bringing the vision to life. Toxicol. Sci. 2009;107:324–330. doi: 10.1093/toxsci/kfn255. [DOI] [PubMed] [Google Scholar]
- 14.National Research Council . National Academies Press; 2007. Toxicity Testing in the 21st Century: A Vision and a Strategy. [Google Scholar]
- 15.Wu L., Liu Z., Auerbach S., Huang R., Chen M., McEuen K., Xu J., Fang H., Tong W. Integrating drug’s mode of action into quantitative structure–activity relationships for improved prediction of drug-induced liver injury. J. Chem. Inf. Model. 2017;57:1000–1006. doi: 10.1021/acs.jcim.6b00719. [DOI] [PMC free article] [PubMed] [Google Scholar]
- 16.Kawaguchi M., Nukaga T., Sekine S., Takemura A., Susukida T., Oeda S., Kodama A., Hirota M., Kouzuki H., Ito K. Mechanism-based integrated assay systems for the prediction of drug-induced liver injury. Toxicol. Appl. Pharmacol. 2020;394:114958. doi: 10.1016/j.taap.2020.114958. [DOI] [PubMed] [Google Scholar]
- 17.Feng C., Chen H., Yuan X., Sun M., Chu K., Liu H., Rui M. Gene expression data based deep learning model for accurate prediction of drug-induced liver injury in advance. J. Chem. Inf. Model. 2019;59:3240–3250. doi: 10.1021/acs.jcim.9b00143. [DOI] [PubMed] [Google Scholar]
- 18.Kalgutkar A.S., Gardner I., Obach R.S., Shaffer C.L., Callegari E., Henne K.R., Mutlib A.E., Dalvie D.K., Lee J.S., Nakai Y., et al. A comprehensive listing of bioactivation pathways of organic functional groups. Curr. Drug Metab. 2005;6:161–225. doi: 10.2174/1389200054021799. [DOI] [PubMed] [Google Scholar]
- 19.Hewitt M., Enoch S.J., Madden J.C., Przybylak K.R., Cronin M.T.D. Hepatotoxicity: a scheme for generating chemical categories for read-across, structural alerts and insights into mechanism (s) of action. Crit. Rev. Toxicol. 2013;43:537–558. doi: 10.3109/10408444.2013.811215. [DOI] [PubMed] [Google Scholar]
- 20.Singh P.K., Negi A., Gupta P.K., Chauhan M., Kumar R. Toxicophore exploration as a screening technology for drug design and discovery: techniques, scope and limitations. Arch. Toxicol. 2016;90:1785–1802. doi: 10.1007/s00204-015-1587-5. [DOI] [PubMed] [Google Scholar]
- 21.Hakimelahi G.H., Khodarahmi G.A. The identification of toxicophores for the prediction of mutagenicity, hepatotoxicity and cardiotoxicity. J. Iran. Chem. Soc. 2005;2:244–267. [Google Scholar]
- 22.Kazius J., McGuire R., Bursi R. Derivation and validation of toxicophores for mutagenicity prediction. J. Med. Chem. 2005;48:312–320. doi: 10.1021/jm040835a. [DOI] [PubMed] [Google Scholar]
- 23.Pu L., Naderi M., Liu T., Wu H.-C., Mukhopadhyay S., Brylinski M. e ToxPred: a machine learning-based approach to estimate the toxicity of drug candidates. BMC Pharmacol. Toxicol. 2019;20:1–15. doi: 10.1186/s40360-018-0282-6. [DOI] [PMC free article] [PubMed] [Google Scholar]
- 24.Thakkar S., Li T., Liu Z., Wu L., Roberts R., Tong W. Drug-induced liver injury severity and toxicity (dilist): binary classification of 1279 drugs by human hepatotoxicity. Drug Discov. Today. 2020;25:201–208. doi: 10.1016/j.drudis.2019.09.022. [DOI] [PubMed] [Google Scholar]
- 25.Vall A., Sabnis Y., Shi J., Class R., Hochreiter S., Klambauer G. The promise of ai for dili prediction. Front. Artif. Intell. 2021;4:638410. doi: 10.3389/frai.2021.638410. [DOI] [PMC free article] [PubMed] [Google Scholar]
- 26.Chen F., Park J., Park J. A hypergraph convolutional neural network for molecular properties prediction using functional group. arXiv. 2021 doi: 10.48550/arXiv.2106.01028. Preprint at. [DOI] [Google Scholar]
- 27.Xu M., Wang H., Ni B., Guo H., Tang J. Self-supervised graph-level representation learning with local and global structure. arXiv. 2021 doi: 10.48550/arXiv.2106.04113. Preprint at. [DOI] [Google Scholar]
- 28.Hu W., Liu B., Gomes J., Zitnik M., Liang P., Pande V., Leskovec J. International Conference on Learning Representations (ICLR) 2020. Strategies for pre-training graph neural networks. [Google Scholar]
- 29.Jiang D., Wu Z., Hsieh C.-Y., Chen G., Liao B., Wang Z., Shen C., Cao D., Wu J., Hou T. Could graph neural networks learn better molecular representation for drug discovery? a comparison study of descriptor-based and graph-based models. J. Cheminform. 2021;13:12–23. doi: 10.1186/s13321-020-00479-8. [DOI] [PMC free article] [PubMed] [Google Scholar]
- 30.Toutanova K., Manning C.D., Ng A.Y. Proceedings of the twenty-first international conference on Machine learning. 2004. Learning random walk models for inducing word dependency distributions; p. 103. [Google Scholar]
- 31.Fouss F., Pirotte A., Renders J.-M., Saerens M. Random-walk computation of similarities between nodes of a graph with application to collaborative recommendation. IEEE Trans. Knowl. Data Eng. 2007;19:355–369. [Google Scholar]
- 32.Perozzi B., Al-Rfou R., Skiena S. Proceedings of the 20th ACM SIGKDD international conference on Knowledge discovery and data mining. 2014. Deepwalk: online learning of social representations; pp. 701–710. [Google Scholar]
- 33.Grover A., Leskovec J. Proceedings of the 22nd ACM SIGKDD international conference on Knowledge discovery and data mining. 2016. node2vec: scalable feature learning for networks; pp. 855–864. [DOI] [PMC free article] [PubMed] [Google Scholar]
- 34.Backstrom L., Leskovec J. Proceedings of the fourth ACM international conference on Web search and data mining. 2011. Supervised random walks: predicting and recommending links in social networks; pp. 635–644. [Google Scholar]
- 35.Zhang W., Ma J., Ideker T. Classifying tumors by supervised network propagation. Bioinformatics. 2018;34:i484–i493. doi: 10.1093/bioinformatics/bty247. [DOI] [PMC free article] [PubMed] [Google Scholar]
- 36.Huang K., Fu T., Gao W., Zhao Y., Roohani Y.H., Leskovec J., Coley C.W., Xiao C., Sun J., Zitnik M. Thirty-fifth Conference on Neural Information Processing Systems Datasets and Benchmarks Track (Round 1) 2021. Therapeutics data commons: machine learning datasets and tasks for drug discovery and development. [Google Scholar]
- 37.Xu Y., Dai Z., Chen F., Gao S., Pei J., Lai L. Deep learning for drug-induced liver injury. J. Chem. Inf. Model. 2015;55:2085–2093. doi: 10.1021/acs.jcim.5b00238. [DOI] [PubMed] [Google Scholar]
- 38.Li T., Tong W., Roberts R., Liu Z., Thakkar S. Deepdili: deep learning-powered drug-induced liver injury prediction using model-level representation. Chem. Res. Toxicol. 2020;34:550–565. doi: 10.1021/acs.chemrestox.0c00374. [DOI] [PubMed] [Google Scholar]
- 39.Hong H., Xie Q., Ge W., Qian F., Fang H., Shi L., Su Z., Perkins R., Tong W. Mold2, molecular descriptors from 2d structures for chemoinformatics and toxicoinformatics. J. Chem. Inf. Model. 2008;48:1337–1344. doi: 10.1021/ci800038f. [DOI] [PubMed] [Google Scholar]
- 40.Gedeck P., Rohde B., Bartels C. Qsar- how good is it in practice? comparison of descriptor sets on an unbiased cross section of corporate data sets. J. Chem. Inf. Model. 2006;46:1924–1936. doi: 10.1021/ci050413p. [DOI] [PubMed] [Google Scholar]
- 41.Klekota J., Roth F.P. Chemical substructures that enrich for biological activity. Bioinformatics. 2008;24:2518–2525. doi: 10.1093/bioinformatics/btn479. [DOI] [PMC free article] [PubMed] [Google Scholar]
- 42.Morgan H.L. The generation of a unique machine description for chemical structures-a technique developed at chemical abstracts service. J. Chem. Doc. 1965;5:107–113. [Google Scholar]
- 43.Bolton E.E., Wang Y., Thiessen P.A., Bryant S.H. volume 4. Elsevier; 2008. Pubchem: integrated platform of small molecules and biological activities; pp. 217–241. (Annual Reports in Computational Chemistry). [Google Scholar]
- 44.Durant J.L., Leland B.A., Henry D.R., Nourse J.G. Reoptimization of mdl keys for use in drug discovery. J. Chem. Inf. Comput. Sci. 2002;42:1273–1280. doi: 10.1021/ci010132r. [DOI] [PubMed] [Google Scholar]
- 45.Toolkit D. 2007. Daylight Chemical Information Systems, Inc. [Google Scholar]
- 46.Liu R., Yu X., Wallqvist A. Data-driven identification of structural alerts for mitigating the risk of drug-induced human liver injuries. J. Cheminform. 2015;7:4. doi: 10.1186/s13321-015-0053-y. [DOI] [PMC free article] [PubMed] [Google Scholar]
- 47.Sayle R. 1st-class smarts patterns. EuroMUG. 1997;97 [Google Scholar]
- 48.Patani G.A., LaVoie E.J. Bioisosterism: a rational approach in drug design. Chem. Rev. 1996;96:3147–3176. doi: 10.1021/cr950066q. [DOI] [PubMed] [Google Scholar]
- 49.Vane J.R., Botting R.M. volume 26. Elsevier; 1997. Mechanism of action of aspirin-like drugs; pp. 2–10. (Seminars in arthritis and rheumatism). [DOI] [PubMed] [Google Scholar]
Associated Data
This section collects any data citations, data availability statements, or supplementary materials included in this article.
Supplementary Materials
Performance Evaluation for DILI Classification. A DILIst test data, B TDC benchmark test data, Please refer to the excel file (file name: SSM_extended_supplementary_tables.xlsx) attached to the Supplementary File. See STAR Methods for experimental details.
Evaluation of SA Potentials of Single Subgraphs. Please refer to the excel file (file name: SSM_extended_supplementary_tables.xlsx) attached to the Supplementary File. See STAR Methods for experimental details.
Please refer to the excel file (file name: SSM_extended_supplementary_tables.xlsx) attached to the Supplementary File. See STAR Methods for experimental details.
Data Availability Statement
-
•
DILIst data set can be found in Li et al.38 and TDC benchmark data set can be found in https://tdcommons.ai/single_pred_tasks/tox/#dili-drug-induced-liver-injury.
-
•
All original code has been deposited at GitHub and is publicly available as of the date of publication. The DOI is listed in the key resources table.
-
•
Any additional information required to reanalyze the data reported in this paper is available from the lead contact upon request.