

Abstract
Renal interstitial fibrosis (RIF) is a common pathological manifestation of chronic kidney diseases. Epithelial-mesenchymal transition (EMT) of tubular epithelial cells is considered a major cause of RIF. Although long non-coding RNAs (lncRNAs) are reportedly involved in various pathophysiological processes, the roles and underlying molecular mechanisms of lncRNAs in the progression of RIF are poorly understood. In this study, we investigated the function of lncRNAs in RIF. Microarray assays showed that expression of the lncRNA lnc-CHAF1B-3 (also called claudin 14 antisense RNA 1) was significantly upregulated in human renal proximal tubular cells by both transforming growth factor-β1 (TGF-β1) and hypoxic stimulation, accompanied with increased expression of EMT-related genes. Knockdown of lnc-CHAF1B-3 significantly suppressed TGF-β1-induced upregulated expression of collagen type I alpha 1, cadherin-2, plasminogen activator inhibitor-1, snail family transcriptional repressor I (SNAI1) and SNAI2. Quantitative reverse transcriptase PCR analyses of paraffin-embedded kidney biopsy samples from IgA nephropathy patients revealed lnc-CHAF1B-3 expression was correlated positively with urinary protein levels and correlated negatively with estimated glomerular filtration rate. In situ hybridization demonstrated that lnc-CHAF1B-3 is expressed only in proximal tubules. These findings suggest lnc-CHAF1B-3 affects the progression of RIF by regulating EMT-related signaling. Thus, lnc-CHAF1B-3 is a potential target in the treatment of RIF.
Keywords: MT: Non-coding RNAs, long non-coding RNA, lnc-CHAF1B-3, renal interstitial fibrosis, epithelial-to-mesenchymal transition, IgA nephropathy, proximal tubular cell
Graphical abstract
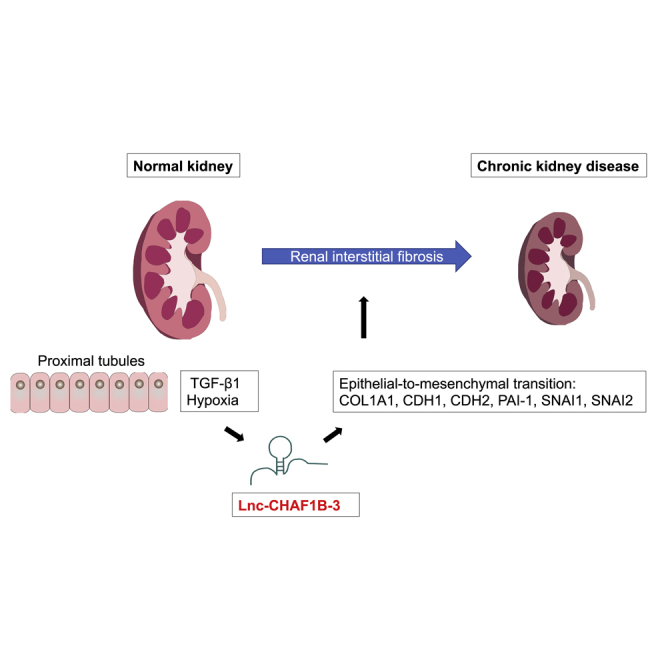
Imai et al. found that a lncRNA, lnc-CHAF1B-3, regulates EMT-related signaling in human renal proximal tubules, and that renal lnc-CHAF1B-3 expression is associated with disease severity of IgA nephropathy, including interstitial fibrosis. Thus, lnc-CHAF1B-3 may serve as a potential target for the treatment of renal fibrosis.
Introduction
Chronic kidney disease (CKD) is a serious health problem worldwide. The global incidence of CKD in men and women is as high as 10.4% and 11.8%, respectively, making the disease an important challenge facing nephrologists.1 Although the causes of CKD are diverse, renal interstitial fibrosis (RIF) is a common and final pathological pathway to end-stage renal failure. It is characterized by inflammatory cell infiltration, fibroblast accumulation, renal tubular atrophy, rarefaction of interstitial capillaries, and excessive accumulation of extracellular matrix (ECM), which replaces the normal renal structure, leading to renal dysfunction.2,3,4 Although the precise molecular mechanisms of renal fibrosis remain unclear, epithelial-mesenchymal transition (EMT) of tubular epithelial cells is considered a major cause of renal fibrosis. Transforming growth factor-β1 (TGF-β1) is a key mediator of the intrarenal EMT program and renal fibrosis.5,6 Furthermore, blood oxygen level-dependent magnetic resonance imaging studies have confirmed exacerbated kidney hypoxia in CKD patients.7 Recent studies have suggested that chronic hypoxia can trigger the kidney damage response and induce irreversible pathological changes in tubular epithelial cells, such as EMT, thus leading to renal fibrosis.8 Tubular epithelial cell (TEC) damage results in loss of functional parenchyma and also evasive survival mechanisms such as initiation of the EMT program via TGF-β1-induced expression of Twist1 and snail family transcriptional repressor I (Snai1). EMT programs further damage TECs, leading to compromise of their functional capacity, generation of pathological secretomes, and induction of cell-cycle arrest. These events further enhance the host injury response, resulting in a robust immune response and myofibroblast recruitment. The EMT program of TECs leads to a vicious cycle of injury and host response, leading to chronic fibrosis.9 However, no effective treatments for renal fibrosis are currently available.
Long non-coding RNAs (lncRNAs) are non-protein encoding RNAs composed of more than 200 nucleotides that play roles in many physio-pathological processes through epigenetic modification, transcription regulation, and post-transcriptional modification.10,11 It has been found that lncRNAs are related closely to the development and prognosis of renal fibrosis.12 Upregulation of serum metastasis-associated lung adenocarcinoma transcript 1 (MALAT1) seems to be involved in the pathogenesis of diabetic nephropathy-related end-stage renal disease (ESRD),13 whereas circulating levels of MALAT1 are also reportedly associated with disease severity and survival in sepsis patients, including those with acute kidney injury.14 The lncRNA LINC00968 was shown to be highly expressed in diabetic db/db mouse tissue and high glucose-induced mesangial cells,15 and it was also found to be associated with tumor progression and drug resistance in lung adenocarcinoma.16 Livin and lncRNA-ATB participate in TGF-β1-induced EMT of cultured renal tubular cells.17 Although lncRNAs may be used as biomarkers for the clinical diagnosis of renal diseases and modulation of lncRNA expression seems to be a promising therapeutic approach for treating renal fibrosis, the roles and underlying molecular mechanisms of lncRNAs in the progression of RIF are poorly understood.18
In this study, we used microarray assays to comprehensively explore the relevance of lncRNAs in the EMT program of renal TECs induced by TGF-β1 and hypoxia. We identified a target, lnc-CHAF1B-3 (also called Claudin 14 antisense RNA 1), and evaluated the clinico-pathological relevance of lnc-CHAF1B-3 in human kidney disease.
Results
TGF-β1 stimulation and hypoxia upregulated lnc-CHAF1B-3 expression
To identify lncRNAs relevant to renal fibrosis, lncRNA and mRNA microarray analyses were conducted using immortalized human proximal tubular cells (HK-2) and primary cultured human renal proximal TECs (RPTECs) treated with TGF-β1 (10 ng/mL) or exposed to hypoxia (1% O2) (Figure 1A). Both TGF-β1 and hypoxia are major causes of renal fibrosis in many CKDs. A gene set enrichment analysis (GSEA) of the mRNA microarray data confirmed the gene sets associated with TGF-β signaling and hypoxia, and genes associated with EMT were significantly enriched in cells treated with TGF-β1 or hypoxia (Figures 1B and S1, Table S1). “Epithelial-Mesenchymal-Transition” was one of the top-ranked gene sets, along with COL1A1, CDH2, PAI-1, and SNAI2, which are fibrosis-related genes of particular interest.19
Figure 1.

TGF-β1 and hypoxia upregulated lnc-CHAF1B-3 expression in renal proximal tubular cells
Differential expression of lncRNAs and mRNAs in HK-2 cells or RPTECs treated with TGF-β1 or hypoxia. (A) Venn diagram showing that five lncRNAs were commonly upregulated under the four conditions. (B) GSEA of mRNA microarray data confirmed that the gene set associated with EMT was significantly enriched in TGF-β1- or hypoxia-treated HK-2 cells or RPTECs. (C) Hierarchical clustering of lncRNA expression. (D) Differential expression of lncRNAs commonly upregulated (>1.5-fold) under the four conditions (TGF-β1 or hypoxia in HK-2 cells or RPTECs) compared with the controls. Data represent means ± standard deviation. Data were analyzed by moderated t test. ∗p < 0.05, ∗∗p < 0.01, ∗∗∗p < 0.001.
Differentially expressed lncRNAs are shown in heatmaps in Figure 1C. In total, 21,470 lncRNAs were identified. Figure S2 shows volcano plots of upregulated (red) and downregulated (blue) lncRNAs in HK-2 cells and RPTECs treated with TGF-β1 or hypoxia (>1.5-fold change; p < 0.05). A Venn diagram showed that five lncRNAs (lnc-CHAF1B-3, lnc-CHAF1B-2, MIR181A2HG, LOC100507487, and LINC01638) were commonly upregulated (>1.5-fold) under all conditions examined (TGF-β1 or hypoxia in HK-2 cells and RPTECs, Figures 1A and 1D, Table S2). Of these lncRNAs, LINC01638 was also registered as an mRNA in the National Center for Biotechnology Information Reference Sequence database (http://www.ncbi.nlm.nih.gov/RefSeq/). Furthermore, quantitative reverse transcriptase (qRT-PCR) analysis showed that the expression level of LOC100507487 was significantly increased in TGF-β1-treated HK-2 cells, but only slightly (Figure S3). Among the other three lncRNAs, we decided to further investigate lnc-CHAF1B-3 due to its greater upregulation and the absence of reports regarding its function.
lnc-CHAF1B-3 knockdown suppressed TGF-β1-induced responses in HK-2 cells
The upregulation of lnc-CHAF1B-3 expression in TGF-β1-treated HK-2 cells was validated by qRT-PCR analysis (Figure 2A). Consistent with the mRNA microarray results, marked increases in mRNA and protein levels of COL1A1, CDH2, PAI-1, SNAI1, and SNAI2 in TGF-β1-treated HK-2 cells were also confirmed (Figures 2B, 2C, 2E–2I, and 2K–2N). To investigate the role of lnc-CHAF1B-3 in renal proximal tubular cells, we used two different synthetic small interfering RNAs (siRNAs) and an antisense oligonucleotide (ASO) targeting lnc-CHAF1B-3. siRNA #1 significantly downregulated lnc-CHAF1B-3 expression in both control and TGF-β1-treated HK-2 cells (Figure 2A). Meanwhile, the upregulation of mRNA and protein levels of COL1A1, CDH2, PAI-1, SNAI1, and SNAI2 by TGF-β1 treatment was significantly suppressed in cells transfected with siRNA #1 compared with control siRNA-transfected cells (Figures 2B, 2C, 2E–2I, and 2K–2N). These changes with 48-h TGF-β1 treatment with siRNA #1 in HK-2 cells were validated with 7-day TGF-β1 treatment (Figure S4). In terms of vimentin (VIM), although there was significant reduction of TGF-β1-induced VIM mRNA expression by knocking down lnc-CHAF1B-3, no significant change in protein levels was observed (Figures 2D, 2J, and 2N). Moreover, similar results were obtained with siRNA #2 (Figures S5A–S5L) and ASO #1 (Figures S6A–S6L). In addition, we also performed RNA sequencing (RNA-seq) experiments. GSEA demonstrated that knockdown of lnc-CHAF1B-3 by siRNA #1 and siRNA #2 significantly decreased gene sets associated with EMT, TGF-β signaling, and hypoxia in TGF-β1-stimulated HK-2 cells. In addition, of the top 20 gene sets significantly altered by each siRNA, 14 gene sets were common. (Figures 3 and S7, Table S3). To determine whether lnc-CHAF1B-3 is also involved in inflammatory signaling, HK-2 cells were stimulated with tumor necrosis factor alpha (TNF-α). In TNF-α-treated HK-2 cells, the mRNA level of CDH1 was significantly suppressed.20 However, TNF-α stimulation did not increase the expression of lnc-CHAF1B-3 and EMT-related genes. (Figures 2O and S5M). These results indicate that lnc-CHAF1B-3 is involved in the TGF-β1-induced EMT program.
Figure 2.

lnc-CHAF1B-3 knockdown by siRNA #1 suppressed TGF-β1-induced responses in HK-2 cells
HK-2 cells transfected with lnc-CHAF1B-3 siRNA #1 (4 nM) were stimulated with TGF-β1 (10 ng/mL). (A) qRT-PCR analysis of lnc-CHAF1B-3 (n = 3). (B–N) qRT-PCR and western blotting analyses of COL1A1, CDH2, VIM, PAI-1, SNAI1, and SNAI2 expression (n = 3). GAPDH was used as an internal control. Data represent means ± standard deviation. Data were analyzed by one-way ANOVA followed by Tukey’s multiple comparisons tests. ∗p < 0.05, ∗∗p < 0.01, ∗∗∗p < 0.001. ns, not significant. (O) HK-2 cells were stimulated with TNF-α. qRT-PCR analysis of lnc-CHAF1B-3 (n = 3). GAPDH was used as an internal control. Data represent means ± standard deviation. Data were analyzed by unpaired t test. ns, not significant.
Figure 3.

Differential gene expression analysis of an RNA-seq experiment
(A) Hierarchical clustering of mRNA expression in HK-2 cells treated with control siRNA or lnc-CHAF1B-3 siRNA #1 under TGF-β1 stimulation. (B) GSEA analysis of RNA-seq data revealed that knockdown of lnc-CHAF1B-3 by siRNA #1 significantly reduced gene sets associated with EMT, TGF-β signaling, and hypoxia in HK-2 cells under TGF-β1.
Lnc-CHAF1B-3 knockdown suppressed TGF-β1-induced responses in RPTECs
To further explore the effects of lnc-CHAF1B-3 in renal proximal tubular cells, we performed similar experiments with RPTECs. Because of the poor knockdown efficiency of siRNAs, we used two different synthetic ASOs targeting lnc-CHAF1B-3; lnc-CHAF1B-3 expression was significantly increased in TGF-β1-treated RPTECs compared with control cells (Figure 4A). The mRNA and protein levels of COL1A1, CDH2, PAI-1, and SNAI1 were also markedly elevated in TGF-β1-treated RPTECs (Figures 4B, 4D–4G, and 4I–4L). However, the expressions of COL1A1, PAI-1, and SNAI1 mRNA and protein were significantly diminished after knockdown of lnc-CHAF1B-3 by ASO #1 (Figures 4B, 4E–G, and 4J–4L). Levels of CDH1 protein decreased significantly after TGF-β1 treatment, but they recovered after knockdown of lnc-CHAF1B-3 (Figures 4H and 4L). Similar results were obtained with ASO #2 (Figures S8A–S8L). These results indicate that lnc-CHAF1B-3 is involved in EMT-related signaling in renal TECs and may play an important role in the development of renal fibrosis.
Figure 4.

lnc-CHAF1B-3 knockdown by ASO #1 suppressed TGF-β1-induced changes in RPTECs
RPTECs transfected with lnc-CHAF1B-3 ASO (100 nM) were stimulated with TGF-β1 (2 ng/mL) for 48 h. (A) qRT-PCR analysis of lnc-CHAF1B-3 (n = 3). (B–L) qRT-PCR and western blotting analyses of COL1A1, CDH1, CDH2, PAI-1, SNAI1, and SNAI2 expression (n = 3). GAPDH was used as an internal control. Data represent means ± standard deviation. Data were analyzed by one-way ANOVA followed by Tukey’s multiple comparisons tests. ∗p < 0.05, ∗∗p < 0.01, ∗∗∗p < 0.001. ns, not significant.
lnc-CHAF1B-3 expression in renal biopsy tissue of patients with IgA nephropathy
To further investigate the role of lnc-CHAF1B-3 in human kidney disease, kidney specimens from IgA nephropathy patients were retrospectively analyzed. From 2014 to 2016, a total of 611 patients were diagnosed with IgA nephropathy by renal biopsy at a Nagoya University-affiliated hospital. Of these patients, 20 were eligible for this study according to the inclusion criteria (Figure S9), 7 mild cases and 13 advanced cases (Table 1). RNA extracted from masked-form fixed paraffin-embedded kidney biopsy tissues was used for qRT-PCR analysis. Peptidylprolyl isomerase A (PPIA), which is reportedly a stable housekeeping gene for analyses of formalin-fixed paraffin-embedded (FFPE) kidney biopsy specimens from lupus nephritis patients,21 was used as an endogenous control. As illustrated in Figure 5A, lnc-CHAF1B-3 expression evaluated by qRT-PCR was significantly increased in advanced cases compared with mild cases. As an alternative to healthy controls, kidney specimens from 3 patients diagnosed as minor glomerular abnormalities (MGAs) pathologically with relatively preserved renal function with mild urinary protein similar to mild cases of IgA nephropathy were also evaluated (Figures 5A and S10). It was found that lnc-CHAF1B-3 expression was significantly lower in MGA cases than in advanced IgA nephropathy cases. Renal lnc-CHAF1B-3 expression of IgA nephropathy patients was significantly positively correlated with serum creatinine (Cre), urinary protein levels, interstitial fibrosis and tubular atrophy (IF/TA). However, no significant correlation was observed between lnc-CHAF1B-3 expression and urinary red blood cells and (Figures 5B–5E), but a significant negative correlation was observed between the estimated glomerular filtration rate (eGFR) and lnc-CHAF1B-3 expression (Figure 5F). Furthermore, when all cases were divided into preserved and impaired eGFR groups based on an eGFR cutoff value of 60 mL/min/1.73 m2 (which is the definition of CKD), the expression level of lnc-CHAF1B-3 was significantly higher in the impaired group than in the preserved eGFR group (Figure 5G).
Table 1.
Expression levels of lnc-CHAF1B-3 and clinical characteristics of biopsy-proven IgA nephropathy and MGA patients at Nagoya University-affiliated hospitals from 2014 to 2016
| Patient | Age/gender | Red blood cells in urine (cells/HPF) | Urinary Protein (g/gCr) | Cre (mg/dL) | eGFR (mL/min/1.73 m2) | IF/TA (%) | Specimen | Lnc-CHAF1B-3/PPIA (relative expression) | |
|---|---|---|---|---|---|---|---|---|---|
| IgA nephropathy | #1 | 29/M | <5 | 0.45 | 0.6 | 129.06 | none | 2 cortices 1 corticomedulla |
0.534202498 |
| #2 | 25/F | Many | 0.19 | 0.55 | 109.47 | <5 | 2 cortices | 0.553325034 | |
| #3 | 20/F | many | 0.51 | 0.69 | 91.06 | <5 | 2 cortices | 0.701567902 | |
| #4 | 53/F | <5 | 0.64 | 0.57 | 84.85 | none | 3 cortices | 0.895559388 | |
| #5 | 22/F | 10–30 | 0.12 | 0.58 | 107.15 | <5 | 2 corticomedullas | 0.580043837 | |
| #6 | 25/F | many | 0.41 | 0.5 | 121.5 | <5 | 2 cortices | 0.788930886 | |
| #7 | 31/F | 5–10 | 0.29 | 0.6 | 93.57 | <5 | 3 cortices | 0.630989053 | |
| #8 | 45/M | <5 | 2.60 | 1.87 | 32.8 | 20 | 2 cortices | 0.838415656 | |
| #9 | 75/M | many | 4.10 | 2.37 | 21.86 | 25 | 2 cortices | 1.656966362 | |
| #10 | 49/F | many | 1.89 | 0.92 | 51.4 | 30 | 4 cortices | 0.983612715 | |
| #11 | 29/M | 5–10 | 1.57 | 1.13 | 64.57 | 20 | 2 cortices | 0.804379795 | |
| #12 | 66/M | 10–30 | 0.69 | 1.24 | 46.07 | 30 | 3 cortices | 0.686946584 | |
| #13 | 35/M | 10–30 | 1.42 | 1.19 | 57.81 | 30 | 2 cortices | 1.589548106 | |
| #14 | 44/M | <5 | 2.27 | 0.94 | 70.07 | 25 | 2 cortices | 0.821754249 | |
| #15 | 71/M | 10–30 | 5.88 | 1.67 | 32.57 | 40 | 2 cortices 1 corticomedulla |
1.321563566 | |
| #16 | 28/M | 5–10 | 2.13 | 1.92 | 36.52 | 20 | 2 cortices | 0.81238388 | |
| #17 | 50/F | many | 2.41 | 2.68 | 15.87 | 50 | 3 cortices | 1.022016558 | |
| #18 | 46/M | many | 3.15 | 1.77 | 34.62 | 50 | 1 cortex 1 corticomedulla |
0.611891158 | |
| #19 | 79/M | many | 4.68 | 7.07 | 6.52 | 50–60 | 2 cortices 1 corticomedulla |
1.114146043 | |
| #20 | 45/F | <5 | 3.16 | 3.27 | 13.15 | 60 | 2 cortices | 0.749024064 | |
| MGA | #21 | 50/F | 10–30 | 0.53 | 0.71 | 67.85 | <5 | 3 cortices | 0.49068941 |
| #22 | 27/M | 5–10 | 0.53 | 0.79 | 97.50 | <5 | 3 cortices | 0.611328655 | |
| #23 | 70/M | many | 0.43 | 0.83 | 70.27 | <5 | 1 cortex 1 corticomedulla |
0.104378659 |
Figure 5.

Renal lnc-CHAF1B-3 expression was upregulated in advanced cases of IgA nephropathy
(A) Expression of lnc-CHAF1B-3 in kidney biopsy specimens from 3 cases of MGA, 7 mild cases, and 13 advanced cases of IgA nephropathy. (B–F) Spearman correlation between renal lnc-CHAF1B-3 expression in IgA nephropathy patients and serum Cre level (B), urinary protein concentration (C), RIF and tubular atrophy (D), urinary red blood cells (E), and eGFR (F). r, Spearman correlation coefficient; p, associated p-value. (G) Comparison of renal lnc-CHAF1B-3 expression in two groups of IgA nephropathy patients divided based on eGFR of 60 mL/min/1.73 m2. PPIA was used as an internal control. Data represent means ± standard deviation. ∗p < 0.05. ns, not significant by unpaired t test. ##p < 0.01 by the Mann-Whitney U-test.
lnc-CHAF1B-3 was expressed in the proximal tubules
To investigate the localization and role of lnc-CHAF1B-3 in the diseased human kidney, multiplexed immunofluorescence labeling of lnc-CHAF1B-3 in kidney biopsy specimens was conducted using RNAscope fluorescence in situ hybridization (FISH) assays along with immunostaining of CD10 (proximal tubules),22 epithelial membrane antigen (EMA) (distal tubules),23 and 4′,6-diamidino-2-phenylindole (DAPI) (cell nuclei). First, we conducted in situ hybridization of kidney biopsy specimens from the same IgA nephropathy patients. However, these samples were not applicable for RNAscope FISH because of the tissue fixation method (masked form). Therefore, kidney biopsy tissues from 5 mild and 5 advanced cases of IgA nephropathy collected at another Nagoya University-affiliated hospital (Komaki City Hospital) and fixed with 10% formalin were analyzed. Double labeling of lnc-CHAF1B-3 (green) and CD10 (red, Figure 6A), EMA (blue, Figure 6B), or DAPI (blue, Figure 6C) showed that lnc-CHAF1B-3 was observed in the cytoplasm of the proximal tubules. Furthermore, lnc-CHAF1B-3 (green) was not co-localized with alpha smooth muscle actin (αSMA, red), a myofibroblast marker (Figure S11A). Consistent with those results, qRT-PCR analysis showed that lnc-CHAF1B-3 was not expressed in primary cultured human fibroblasts compared with HK-2 (Figure S11B).
Figure 6.

RNAscope FISH and immunofluorescence analysis of renal tissue of IgA nephropathy patients.
Representative photomicrographs of dual RNAscope FISH labeling of lnc-CHAF1B-3 (green) and immunofluorescent staining of CD10 (A, red) EMA (B, blue) or DAPI (C, blue) in kidney biopsy specimens of IgA nephropathy patients (A, B; top, low-power field; bottom, high-power field). (A, B) Top, scale bars, 500 μm; bottom, scale bars, 100 μm; (C) scale bars, 50 μm.
Discussion
The EMT of renal epithelial cells is a well-characterized pathological process of renal fibrosis. TGF-β1 and its downstream signaling drives key events of EMT both in vitro and in vivo and leads to renal fibrosis.24,25 Additionally, tubulointerstitial damage directly induces kidney parenchymal hypoxia because of the loss of peritubular capillaries, inducing global kidney damage.26 Moreover, a recent study showed an interaction between hypoxia-inducible factor 1α, the major regulator of gene expression under hypoxic conditions, and the TGF-β/Smad3 and phosphatidylinositol 3-kinase/AKT signaling pathways.27,28 In the present study, TGF-β1-induced EMT and hypoxia-induced EMT of two types of human renal TECs, HK-2 cells and RPTECs, were used to identify lncRNAs relevant to EMT and renal fibrosis. GSEA demonstrated EMT signatures in treatment with both TGF-β1 and hypoxia (Figure 1A). Of the identified differentially expressed genes, we selected COL1A1 as a marker of ECM production and PAI-1 as a marker of excessive accumulation of ECM proteins and inflammation.29,30 TGF-β1 stimulates the deposition of ECM, which is a hallmark of renal fibrosis and ESRD. TGF-β1 also upregulates PAI-1, which suppresses matrix degradation. PAI-1 gene deficiency attenuates TGF-β1-induced kidney disease, decreasing both glomerular and interstitial ECM deposition.31 In addition, CDH2, SNAI1, and SNAI2 were used as mesenchymal markers, with CDH1 as an epithelial marker, to evaluate transdifferentiation from epithelial cells to mesenchymal cells in renal fibrosis.32
The first major finding of this study is that a lncRNA, lnc-CHAF1B-3, is involved in the TGF-β1-induced and hypoxia-induced EMT process in renal proximal tubular cells. Knockdown of lnc-CHAF1B-3 expression significantly decreased the mRNA and protein levels of TGF-β1-induced COL1A1, CDH2, PAI-1, SNAI1, and SNAI2 expression in HK-2 cells (Figure 2). These effects were confirmed using two different lnc-CHAF1B-3 siRNAs and lnc-CHAF1B-3 ASO #1 (Figures S5 and S6). Similar results were also observed in RPTECs, indicating that lnc-CHAF1B-3 plays important roles related to the EMT process and ECM generation or degradation (Figure 3 and S7). In contrast, lnc-CHAF1B-3 expression was not affected by TNF-α, which is a pro-inflammatory mediator, indicating that lnc-CHAF1B-3 is not directly involved in its downstream signaling pathway (Figure 2O). In addition, whereas lnc-CHAF1B-3 is also called claudin 14 antisense RNA 1, its association with claudin 14 has not been reported. The mRNA expression of claudin 14 was not altered by lnc-CHAF1B-3 upregulation induced by TGF-β1 (data not shown).
The second major finding of the study is the clinical relevance of lnc-CHAF1B-3 expression in the kidneys of patients with IgA nephropathy, which is the most common among the causative diseases of CKD leading to ESRD.33 qRT-PCR analyses of thin sections of renal tissue from patients with IgA nephropathy showed that renal lnc-CHAF1B-3 expression was significantly increased in advanced cases compared with mild cases and MGA cases. MGA is defined as an entity whose glomerular structure shows minor changes on light microscopy, immunostaining, and electron microscopy.34 Since percutaneous renal biopsy is an invasive procedure and is usually performed for patients with suspected renal disease, it is difficult to obtain normal renal tissues from healthy individuals. Therefore, MGA cases were selected as an alternative to healthy controls as in previous studies by other investigators comparing them with IgA nephropathy cases.35,36 Furthermore, renal lnc-CHAF1B-3 expression levels were correlated with the urinary protein concentration and the progression of renal dysfunction in IgA nephropathy patients, suggesting that lnc-CHAF1B-3 expression has important implications for proteinuria-induced renal dysfunction in IgA nephropathy. Proteinuria has been shown to be associated with an adverse prognostic factor in IgA nephropathy.37 Since proteinuria induces renal tubular atrophy and is a major risk factor for exacerbation of renal function not only in IgA nephropathy, but also in CKD,38 lnc-CHAF1B-3 is expected to play a similar role in CKD. Double staining using RNAscope FISH and segment-specific immunofluorescence staining showed that lnc-CHAF1B-3 expresses in the cytoplasm of the proximal tubule, regardless of disease severity. Targeting proximal tubules is an effective strategy for treating renal fibrosis39; thus, the proximal tubule localization of lnc-CHAF1B-3 may offer advantages for drug delivery. Of note, lnc-CHAF1B-3 was not co-localized with αSMA, a myofibroblast marker (Figure S11A). Consistently, we also found that lnc-CHAF1B-3 was not expressed in primary cultured human fibroblasts compared with HK-2 (Figure S11B). These results indicated that lnc-CHAF1B-3 may be involved in the EMT process of renal tubular cells, not in fibroblasts.
Regarding the relationship between IgA nephropathy and lncRNAs, several studies have examined lncRNAs in serum or plasma of IgA nephropathy patients.40,41,42 However, few studies have analyzed renal biopsy tissues of IgA nephropathy patients. In a cohort of 58 patients with biopsy-confirmed IgA nephropathy, lnc-TSI renal expression was negatively correlated with the renal fibrosis index, and patients with lower expression of renal lnc-TSI at initial biopsy had a worse renal prognosis.43 This suggests that lnc-TSI is an endogenous inhibitor of renal fibrosis. However, our study demonstrates a positive correlation between disease severity and the intra-renal expression level of a specific lncRNA as a fibrosis-promoting factor in IgA nephropathy.
Interactions between miRNAs and lncRNAs are known to be important for gene regulation. To explore the mechanism by which lnc-CHAF1B-3 regulates the expression of EMT-related genes, we performed bioinformatic analyses of predicted miRNA-lncRNA associations using miRWalk (http://mirwalk.umm.uni-heidelberg.de/) and DIANA LncBase v.2 (http://carolina.imis.athena-innovation.gr/diana_tools/web/index.php?r=lncbasev2%2Findex). Eleven miRNA candidates (hsa-miR-3922-5p, hsa-miR-4317, hsa-miR-4646-3p, hsa-miR-4691-5p, hsa-miR-4743-3p, hsa-miR-4753-5p, hsa-miR-4755-3p, hsa-miR-5006-5p, hsa-miR-6748-5p, hsa-miR-6793-5p, and hsa-miR-8064) were selected. Of these candidates, only hsa-miR-4755-3p was predicted to be faintly expressed according to the FANTOM web resource (http://fantom.Gsc.Riken.Jp/). However, the actual expression level of hsa-miR-4755-3p in HK-2 cells examined by qRT-PCR was almost undetectable regardless of TGF-β1 treatment (data not shown), and it is unlikely that these miRNAs mediate the regulation of EMT-related genes by lnc-CHAF1B-3. In addition to regulating miRNAs, lncRNAs reportedly bind to epigenetic regulators to regulate gene expression.44 It is possible that lnc-CHAF1B-3 binds to histone acetyltransferase-active proteins such as CREB-binding protein/p300 to activate target gene expression.
This study has some limitations. Since lnc-CHAF1B-3 is not expressed in rodents, including mice, in vivo animal experiments could not be performed. Although significant associations between renal lnc-CHAF1B-3 expression and eGFR or proteinuria were observed, the therapeutic targeting of renal lnc-CHAF1B-3 in the progression of renal dysfunction and kidney fibrosis needs to be evaluated in an animal study using, for example, rhesus monkeys. A second limitation is that the underlying molecular mechanism behind the lnc-CHAF1B-3-related EMT program was not investigated. Future studies including CRISPR/Cas9 approaches are warranted to determine whether lnc-CHAF1B-3 modulates epigenetic, transcriptional, post-transcriptional, translational, and post-translational events of gene expression.
In conclusion, this study reports that lnc-CHAF1B-3 plays an important role in the development of renal fibrosis. lnc-CHAF1B-3 may serve as a potential target in the treatment of renal fibrosis. Whether lnc-CHAF1B-3 regulates gene expression at the epigenetic, transcriptional, post-transcriptional, or translational level remains to be determined in further studies.
Materials and Methods
Cell culture
Human proximal tubular cells (HK-2) obtained from the American Type Culture Collection were cultured in keratinocyte serum-free medium (Thermo Fisher Scientific, Waltham, MA) without antibiotics. Primary human RPTECs obtained from LONZA (CC-2553, lot #530068; Walkersvillle, MD) were cultured in REBM Renal Epithelial Cell Basal Medium (LONZA) without antibiotics. Primary human dermal fibroblasts obtained from LONZA (CC-2511, lot #21TL116652) were cultured in FBM Fibroblast Basal Medium (LONZA) without antibiotics. Serial cultures were maintained in 55-cm2 tissue culture dishes and incubated at 37°C in a humidified 5% CO2 atmosphere in a CO2 incubator (CO2 incubator, Panasonic, Newark, NJ).
Microarray analyses
Total RNA was extracted from cells using an RNeasy Mini kit (Qiagen, Hilden, Germany) according to the manufacturer’s instructions. The quality and quantity of the total RNA were measured using a spectrophotometer (NanoDrop2000C, Thermo Fisher Scientific). The RNA was amplified into cRNA and labeled according to the Agilent One-Color Microarray-Based Gene Expression Analysis protocol (Agilent Technologies, Santa Clara, CA). Labeled samples were purified using an RNeasy kit (Qiagen) and hybridized to SurePrint G3 Human Gene Expression 8 × 60K v3 array slides (G4851C, Agilent Technologies) at 65°C. The arrays were scanned using an Agilent Microarray Scanner (G2565BA, Agilent Technologies). The scanned images were analyzed using Feature Extraction software, version 12.0 (Agilent Technologies), with background correction. Quantile normalization and subsequent data processing were performed using GeneSpring GX software, version 14.9 (Agilent Technologies).
Two types of renal proximal tubular cells were used: HK-2, which is a cell line, and RPTECs, which are primary cells. Using TGF-β1 (10 ng/mL) and hypoxia (1% O2) for stimulation, lncRNAs for which expression was increased in common under four conditions (HK-2+TGF-β1 or hypoxia, and RPTEC + TGF-β1 or hypoxia) compared with controls (HK-2 cells and RPTECs, respectively) were extracted as reported previously.45 Significantly differentially expressed lncRNAs between treatment and control groups were identified based on p-value (<0.05) and fold-change (>1.5) filtering. To evaluate sets of related genes that could be systematically altered under all four conditions, we conducted a study of functional pathway gene sets by analyzing the microarray dataset using GSEA. A GSEA application, version 4.1.0, was used to analyze the microarray data. Gene sets for GSEA were taken from hallmark gene sets as Gene Symbols, version 7.4 (http://www.gsea-msigdb.org/gsea/downloads.jsp).
siRNAs and ASOs
Control siRNA was purchased from Dharmacon (Lafayette, CO). The siRNAs targeting lnc-CHAF1B-3 were constructed using Dharmacon’s siRNA Design Center algorithm and synthesized by Dharmacon. The sequences of the lnc-CHAF1B-3 siRNAs were as follows: siRNA #1, sense: 5′-GGGCAAAGUCACAGAAACAUU-3′, antisense: 5′-UGUUUCUGUGACUUUGCCCUU-3′; siRNA #2, sense: 5′-GAACUAACUUGGAGAUAGAUU-3′, antisense: 5′-UCUAUCUCCAAGUUAGUUCUU-3′. Custom-designed locked nucleic acid ASO gapmers were purchased from GeneDesign, Inc. (Osaka, Japan). The sequences of lnc-CHAF1B-3 ASOs were as follows: ASO #1, 5′-TCTATCTCCAAGTTAGTTC-3′; ASO #2, 5′-TTCTTGTCATGTTAAATCC-3′; and control ASO, 5′-GCTCCCTTCAATCCAA-3′.
Cell culture and transfection
HK-2 cells were seeded in a 55-cm2 tissue culture dish at an appropriate concentration, and when the confluence reached 70%–80%, the cells were evenly inoculated into 2 mL of medium without antibiotics and distributed in a six-well plate at a density of 1.0 × 10⁵ cells/well. Simultaneously, cells were transfected with 4 nM lnc-CHAF1B-3 siRNA or control siRNA using Lipofectamine RNAiMAX (Invitrogen, Carlsbad, CA) according to the manufacturer’s instructions. Cells were cultured for 24 h and then treated with or without 10 ng/mL of recombinant human TGF-β1 (R&D Systems, Minneapolis, MN) for 48 h or 7 days. HK-2 cells were also treated with TNF-α (R&D Systems) for 48 h. RPTECs were cultured and seeded into a six-well plate as described for HK-2 cells. At 24 h after inoculation, the cells were transfected with 100 nM lnc-CHAF1B-3 ASO or control ASO using Lipofectamine 3000 (Invitrogen) according to the manufacturer’s instructions. Transfected cells were cultured for 24 h before the addition of TGF-β1 (2 ng/mL) and then incubated for an additional 48 h.
RNA-seq analysis
For RNA-seq analyses, total RNA was extracted from HK-2 cells treated with control siRNA or lnc-CHAF1B-3 siRNAs under TGF-β1 as mentioned above. Libraries for RNA-seq were prepared using SMART-Seq v4 Ultra Low Input RNA Kits for Sequencing (Clontech, Tokyo, Japan) and Nextera XT DNA Library Prep Kits (Illumina, San Diego, CA). The libraries were sequenced on Illumina NovaSeq 6000 with 150 bp ×2 paired end protocol. Differentially expressed genes with statistical significance were identified based on the q-value (<0.05) and fold-change (>2.0). After gene expression was normalized by the transcripts per kilobase million method and the trimmed mean of M-values normalization method, GSEA analysis was performed, as described above.
RNA extraction from cells and paraffin-embedded samples
Total RNA was extracted from cultured cells using an RNeasy Mini kit (Qiagen) and used for qRT-PCR analysis of lncRNA (lnc-CHAF1B-3) or mRNAs (COL1A1, CDH1, CDH2, VIM, PAI-1, SNAI1, and SNAI2, glyceraldehyde-3-phosphate dehydrogenase [GAPDH], PPIA). Total RNA was extracted from cultured cells using Direct-zol RNA MiniPrep (ZymoResearch, Irvine, CA) for qRT-PCR analysis of miRNA (hsa-miR-4755-3p). From paraffin-embedded samples of kidney biopsy specimens from patients with IgA nephropathy, three unstained 10-μm-thick sections were prepared, and RNA was extracted using a Nucleospin total RNA FFPE XS kit (Macherey-Nagel, Düren, Germany) following the manufacturer’s instructions. The RNA concentration was measured using a spectrophotometer.
Selection of IgA nephropathy and MGA renal biopsy cases
We selected cases in which IgA nephropathy and MGA were diagnosed by renal biopsy performed at Nagoya University-affiliated hospitals from 2014 to 2016 and in which more than two cortical or corticomedullary samples with 70% or more of the cortex were obtained. As shown in Figure S9, the IgA nephropathy cases were then assigned as mild or advanced as follows: mild, IF/TA less than 10%, Cre less than 0.7 mg/dL, urinary protein less than 0.6 g/gCr; and advanced, IF/TA greater than greater than 20%, Cre greater than 0.9 mg/dL, urinary protein greater than 0.6 g/gCr. We selected three MGA cases according to the method for mild cases of IgA nephropathy, but because few cases satisfied Cre less than 0.7 mg/dL, an eGFR of greater than 60 mL/min/1.73 m2 was used as an inclusion criterion instead (Figure S10). The study was approved by the Ethics Committee of Nagoya University (approval number: 2010-1135-4) in accordance with the Declaration of Helsinki.
qRT-PCR
According to the manufacturers’ instructions, total RNA was reverse transcribed using a QuantiTect Reverse Transcription kit (Qiagen) for lncRNA and mRNA and a TaqMan MicroRNA Reverse Transcription kit (Thermo Fisher Scientific) for miRNA, and qRT-PCR was performed using an ABI Step One Plus Real-Time PCR system (Thermo Fisher Scientific) with TaqMan Gene Expression Assays (Thermo Fisher Scientific) for mRNA (COL1A1, CDH1, CDH2, VIM, PAI-1, SNAI1, SNAI2, GAPDH, and PPIA) and miRNA (hsa-miR-4755-3p). The primer sequences for lnc-CHAF1B-3 and LOC100507487 were designed using Primer3 software. The sequences of primer pairs were as follows: lnc-CHAF1B-3 (forward) 5′-CAGGGCCAGGGACTTACTTG-3′ and (reverse) 5′-TGTCCTTCACCGTCCCATTG-3′; LOC100507487 (forward) 5′- TCTCTGCCATTCACTGAACTTGGA-3′ and (reverse) 5′-CTTTGCACGGCTGTCTTGGTG-3′. qRT-PCR for lnc-CHAF1B-3 and LOC100507487 was performed using Power SYBR Green PCR master mix (Thermo Fisher Scientific). All data were normalized to GAPDH or PPIA expression.
Protein extraction and western blotting
Proteins were extracted from HK-2 cells and RPTECs lysed using RIPA lysis buffer (Santa Cruz Biotechnology, Dallas, TX). The cell lysates were centrifuged, and the protein concentration was determined using Pierce BCA reagents (Thermo Fisher Scientific) according to the manufacturer’s instructions. All samples were mixed and boiled with NuPAGE LDS sample buffer (4×) (Thermo Fisher Scientific) and subjected to SDS-PAGE analysis and transferred onto polyvinylidene difluoride membranes. The membranes were incubated overnight at 4°C with specific primary antibodies: rabbit anti-COL1A1 (dilution, 1:1,000; Cell Signaling Technology, Beverly, MA), rabbit anti-CDH1 (dilution, 1:1,000; Cell Signaling Technology), rabbit anti-CDH2 (dilution, 1:1,000; Abcam, Cambridge, MA) rabbit anti-VIM (dilution, 1:5,000; Cell Signaling Technology), rabbit anti-PAI-1 (dilution, 1:3,000; Abcam), rabbit anti-SNAI1 (dilution, 1:1,000; Cell Signaling Technology), rabbit anti-SNAI2 (dilution, 1:1,000;; Cell Signaling Technology), or rabbit anti-GAPDH (dilution, 1:5,000; Cell Signaling Technology). This was followed by incubation with the secondary antibody horseradish peroxidase-conjugated rabbit IgG (dilution, 1:3,000; Cell Signaling Technology) for 1 h at room temperature. Proteins were visualized on an Amersham Imager 680 with an enhanced chemiluminescence detection system (GE Healthcare UK Ltd.), and the optical densities of protein bands were measured using the Amersham Imager 680 analysis software.
RNAscope FISH and immunofluorescence staining
RNAscope Multiplex Fluorescent Reagent kit v2 (Advanced Cell Diagnostics, Hayward, CA) was used according to the manufacturer’s instructions. Hybridization was carried out with target probes (probe symbols: 20ZZ probe named Hs-LOC105369301-O1 targeting 701-1901 of XR_001755025.1). After the reaction with RNAscope, samples were immediately processed for immunofluorescence staining. The following primary and secondary antibodies were used: anti-EMA mouse monoclonal antibody (IS629, DAKO, Glostrup, Denmark), anti-CD10 mouse monoclonal antibody (Nichirei, Tokyo, Japan), goat anti-mouse IgG (H + L) highly cross-adsorbed secondary antibody, Alexa Fluor Plus 555 (Thermo Fisher Scientific). The study was approved by the Ethics Committee of Komaki City Hospital (approval number: 211002) in accordance with the Declaration of Helsinki.
Statistical analyses
All results are expressed as means ± standard deviation from at least three independent experiments. As indicated in the figure legends, differences between groups were analyzed by the unpaired t-test, the Mann-Whitney U-test or one-way ANOVA followed by Tukey’s multiple comparisons tests using GraphPad Prism software (GraphPad Software, San Diego, CA). A p value of less than 0.05 was considered significant.
Data availability
The microarray data have been deposited in the Genomic Expression Archive (GEA) under accession codes E-GEAD-540.
Acknowledgments
Supported in part by the Toyoaki Shogakukai (T.I.). The authors thank Noriyuki Suzuki, Naoko Asano, Ayako Sakamoto, and Yuriko Sawa for excellent technical assistance.
Author contributions
T.I. and T.D. designed and performed the experiments. K.I. conducted the experiments, performed the statistical analyses, and prepared the figures. K.I. and T.I. wrote the paper. T.T., H.O., Y.W., and K.F. contributed to acquisition of results. H.O. provided renal biopsy tissue for RNAscope ISH and immunofluorescence analyses. S.M., Y.K., and M.S. supervised the project and contributed to data analysis and interpretation. All authors read and approved the final manuscript.
Declaration of Interests
The authors declare that they have no competing interests.
Footnotes
Supplemental information can be found online at https://doi.org/10.1016/j.omtn.2022.12.011.
Supplemental information
References
- 1.Mills K.T., Xu Y., Zhang W., Bundy J.D., Chen C.S., Kelly T.N., Chen J., He J. A systematic analysis of worldwide population-based data on the global burden of chronic kidney disease in 2010. Kidney Int. 2015;88:950–957. doi: 10.1038/ki.2015.230. [DOI] [PMC free article] [PubMed] [Google Scholar]
- 2.Djudjaj S., Boor P. Cellular and molecular mechanisms of kidney fibrosis. Mol. Aspect. Med. 2019;65:16–36. doi: 10.1016/j.mam.2018.06.002. [DOI] [PubMed] [Google Scholar]
- 3.Liu Y. Cellular and molecular mechanisms of renal fibrosis. Nat. Rev. Nephrol. 2011;7:684–696. doi: 10.1038/nrneph.2011.149. [DOI] [PMC free article] [PubMed] [Google Scholar]
- 4.Edeling M., Ragi G., Huang S., Pavenstädt H., Susztak K. Developmental signalling pathways in renal fibrosis: the roles of Notch, Wnt and Hedgehog. Nat. Rev. Nephrol. 2016;12:426–439. doi: 10.1038/nrneph.2016.54. [DOI] [PMC free article] [PubMed] [Google Scholar]
- 5.Zeisberg M., Kalluri R. The role of epithelial-to-mesenchymal transition in renal fibrosis. J. Mol. Med. (Berl.) 2004;82:175–181. doi: 10.1007/s00109-003-0517-9. [DOI] [PubMed] [Google Scholar]
- 6.Lovisa S., Zeisberg M., Kalluri R. Partial epithelial-to-mesenchymal transition and other new mechanisms of kidney fibrosis. Trends Endocrinol. Metabol. 2016;27:681–695. doi: 10.1016/j.tem.2016.06.004. [DOI] [PubMed] [Google Scholar]
- 7.Inoue T., Kozawa E., Okada H., Inukai K., Watanabe S., Kikuta T., Watanabe Y., Takenaka T., Katayama S., Tanaka J., Suzuki H. Noninvasive evaluation of kidney hypoxia and fibrosis using magnetic resonance imaging. J. Am. Soc. Nephrol. 2011;22:1429–1434. doi: 10.1681/ASN.2010111143. [DOI] [PMC free article] [PubMed] [Google Scholar]
- 8.Manotham K., Tanaka T., Matsumoto M., Ohse T., Inagi R., Miyata T., Kurokawa K., Fujita T., Ingelfinger J.R., Nangaku M. Transdifferentiation of cultured tubular cells induced by hypoxia. Kidney Int. 2004;65:871–880. doi: 10.1111/j.1523-1755.2004.00461.x. [DOI] [PubMed] [Google Scholar]
- 9.Lovisa S., LeBleu V.S., Tampe B., Sugimoto H., Vadnagara K., Carstens J.L., Wu C.C., Hagos Y., Burckhardt B.C., Pentcheva-Hoang T., et al. Epithelial-to-mesenchymal transition induces cell cycle arrest and parenchymal damage in renal fibrosis. Nat. Med. 2015;21:998–1009. doi: 10.1038/nm.3902. [DOI] [PMC free article] [PubMed] [Google Scholar]
- 10.Li J., Xuan Z., Liu C. Long non-coding RNAs and complex human diseases. Int. J. Mol. Sci. 2013;14:18790–18808. doi: 10.3390/ijms140918790. [DOI] [PMC free article] [PubMed] [Google Scholar]
- 11.Adams B.D., Parsons C., Walker L., Zhang W.C., Slack F.J. Targeting noncoding RNAs in disease. J. Clin. Invest. 2017;127:761–771. doi: 10.1172/JCI84424. [DOI] [PMC free article] [PubMed] [Google Scholar]
- 12.Jia H., Ma T., Hao C. Identification of candidate lncRNA biomarkers for renal fibrosis: a systematic review. Life Sci. 2020;262:118566. doi: 10.1016/j.lfs.2020.118566. [DOI] [PubMed] [Google Scholar]
- 13.Fawzy M.S., Abu AlSel B.T., Al Ageeli E., Al-Qahtani S.A., Abdel-Daim M.M., Toraih E.A. Long non-coding RNA MALAT1 and microRNA-499a expression profiles in diabetic ESRD patients undergoing dialysis: a preliminary cross-sectional analysis. Arch. Physiol. Biochem. 2020;126:172–182. doi: 10.1080/13813455.2018.1499119. [DOI] [PubMed] [Google Scholar]
- 14.Geng F., Liu W., Yu L. Potential role of circulating long noncoding RNA MALAT1 in predicting disease risk, severity, and patients' survival in sepsis. J. Clin. Lab. Anal. 2019;33:e22968. doi: 10.1002/jcla.22968. [DOI] [PMC free article] [PubMed] [Google Scholar]
- 15.Li Z., Yu Z., Meng X., Yu P. LncRNA LINC00968 accelerates the proliferation and fibrosis of diabetic nephropathy by epigenetically repressing p21 via recruiting EZH2. Biochem. Biophys. Res. Commun. 2018;504:499–504. doi: 10.1016/j.bbrc.2018.08.048. [DOI] [PubMed] [Google Scholar]
- 16.Lu L., Liu L.P., Zhao Q.Q., Gui R., Zhao Q.Y. Identification of a ferroptosis-related LncRNA signature as a novel prognosis model for lung adenocarcinoma. Front. Oncol. 2021;11:675545. doi: 10.3389/fonc.2021.675545. [DOI] [PMC free article] [PubMed] [Google Scholar]
- 17.Zhou J., Jiang H. Livin is involved in TGF-β1-induced renal tubular epithelial-mesenchymal transition through lncRNA-ATB. Ann. Transl. Med. 2019;7:463. doi: 10.21037/atm.2019.08.29. [DOI] [PMC free article] [PubMed] [Google Scholar]
- 18.Gu Y.Y., Dou J.Y., Huang X.R., Liu X.S., Lan H.Y. Transforming growth factor-β and long non-coding RNA in renal inflammation and fibrosis. Front. Physiol. 2021;12:684236. doi: 10.3389/fphys.2021.684236. [DOI] [PMC free article] [PubMed] [Google Scholar]
- 19.Liberzon A., Birger C., Thorvaldsdóttir H., Ghandi M., Mesirov J.P., Tamayo P. The Molecular Signatures Database (MSigDB) hallmark gene set collection. Cell Syst. 2015;1:417–425. doi: 10.1016/j.cels.2015.12.004. [DOI] [PMC free article] [PubMed] [Google Scholar]
- 20.Zhao C., Xu Z., Wang Z., Suo C., Tao J., Han Z., Gu M., Tan R. Role of tumor necrosis factor-α in epithelial-to-mesenchymal transition in transplanted kidney cells in recipients with chronic allograft dysfunction. Gene. 2018;642:483–490. doi: 10.1016/j.gene.2017.11.059. [DOI] [PubMed] [Google Scholar]
- 21.Reich H.N., Landolt-Marticorena C., Boutros P.C., John R., Wither J., Fortin P.R., Yang S., Scholey J.W., Herzenberg A.M. Molecular markers of injury in kidney biopsy specimens of patients with lupus nephritis. J. Mol. Diagn. 2011;13:143–151. doi: 10.1016/j.jmoldx.2010.10.005. [DOI] [PMC free article] [PubMed] [Google Scholar]
- 22.Bombelli S., Meregalli C., Scalia C., Bovo G., Torsello B., De Marco S., Cadamuro M., Viganò P., Strada G., Cattoretti G., et al. Nephrosphere-derived cells are induced to multilineage differentiation when cultured on human decellularized kidney scaffolds. Am. J. Pathol. 2018;188:184–195. doi: 10.1016/j.ajpath.2017.09.012. [DOI] [PubMed] [Google Scholar]
- 23.Langner C., Ratschek M., Rehak P., Schips L., Zigeuner R. Expression of MUC1 (EMA) and E-cadherin in renal cell carcinoma: a systematic immunohistochemical analysis of 188 cases. Mod. Pathol. 2004;17:180–188. doi: 10.1038/modpathol.3800032. [DOI] [PubMed] [Google Scholar]
- 24.Meng X.M., Nikolic-Paterson D.J., Lan H.Y. TGF-β: the master regulator of fibrosis. Nat. Rev. Nephrol. 2016;12:325–338. doi: 10.1038/nrneph.2016.48. [DOI] [PubMed] [Google Scholar]
- 25.Tang P.C.T., Chan A.S.W., Zhang C.B., García Córdoba C.A., Zhang Y.Y., To K.F., Leung K.T., Lan H.Y., Tang P.M.K. TGF-β1 signaling: immune dynamics of chronic kidney diseases. Front. Med. 2021;8:628519. doi: 10.3389/fmed.2021.628519. [DOI] [PMC free article] [PubMed] [Google Scholar]
- 26.Nangaku M. Chronic hypoxia and tubulointerstitial injury: a final common pathway to end-stage renal failure. J. Am. Soc. Nephrol. 2006;17:17–25. doi: 10.1681/ASN.2005070757. [DOI] [PubMed] [Google Scholar]
- 27.Wei X., Zhu X., Jiang L., Huang X., Zhang Y., Zhao D., Du Y. Recent advances in understanding the role of hypoxia-inducible factor 1α in renal fibrosis. Int. Urol. Nephrol. 2020;52:1287–1295. doi: 10.1007/s11255-020-02474-2. [DOI] [PubMed] [Google Scholar]
- 28.Kushida N., Nomura S., Mimura I., Fujita T., Yamamoto S., Nangaku M., Aburatani H. Hypoxia-inducible factor-1α activates the transforming growth factor-β/SMAD3 pathway in kidney tubular epithelial cells. Am. J. Nephrol. 2016;44:276–285. doi: 10.1159/000449323. [DOI] [PubMed] [Google Scholar]
- 29.Ma L.J., Fogo A.B. PAI-1 and kidney fibrosis. Front. Biosci. 2009;14:2028–2041. doi: 10.2741/3361. [DOI] [PMC free article] [PubMed] [Google Scholar]
- 30.Ghosh A.K., Vaughan D.E. PAI-1 in tissue fibrosis. J. Cell. Physiol. 2012;227:493–507. doi: 10.1002/jcp.22783. [DOI] [PMC free article] [PubMed] [Google Scholar]
- 31.Krag S., Danielsen C.C., Carmeliet P., Nyengaard J., Wogensen L. Plasminogen activator inhibitor-1 gene deficiency attenuates TGF-beta1-induced kidney disease. Kidney Int. 2005;68:2651–2666. doi: 10.1111/j.1523-1755.2005.00737.x. [DOI] [PubMed] [Google Scholar]
- 32.Hung T.W., Tsai J.P., Lin S.H., Lee C.H., Hsieh Y.H., Chang H.R. Pentraxin 3 activates JNK signaling and regulates the epithelial-to-mesenchymal transition in renal fibrosis. Cell. Physiol. Biochem. 2016;40:1029–1038. doi: 10.1159/000453159. [DOI] [PubMed] [Google Scholar]
- 33.Lv J., Xu D., Perkovic V., Ma X., Johnson D.W., Woodward M., Levin A., Zhang H., Wang H., TESTING Study Group Corticosteroid therapy in IgA nephropathy. J. Am. Soc. Nephrol. 2012;23:1108–1116. doi: 10.1681/ASN.2011111112. [DOI] [PMC free article] [PubMed] [Google Scholar]
- 34.Matsumoto A., Matsui I., Katsuma Y., Yasuda S., Shimada K., Namba-Hamano T., Sakaguchi Y., Kaimori J.Y., Takabatake Y., Inoue K., Isaka Y. Quantitative analyses of foot processes, mitochondria, and basement membranes by structured illumination microscopy using elastica-masson- and periodic-acid-schiff-stained kidney sections. Kidney Int. Rep. 2021;6:1923–1938. doi: 10.1016/j.ekir.2021.04.021. [DOI] [PMC free article] [PubMed] [Google Scholar]
- 35.Urushihara M., Seki Y., Tayama T., Nagai T., Kinoshita Y., Jamba A., Kondo S., Kagami S. Glomerular angiotensin-converting enzyme 2 in pediatric IgA nephropathy. Am. J. Nephrol. 2013;38:355–367. doi: 10.1159/000355618. [DOI] [PubMed] [Google Scholar]
- 36.Tanaka K., Sugiyama H., Yamanari T., Mise K., Morinaga H., Kitagawa M., Onishi A., Ogawa-Akiyama A., Tanabe K., Eguchi J., et al. Renal expression of trefoil factor 3 mRNA in association with tubulointerstitial fibrosis in IgA nephropathy. Nephrology. 2018;23:855–862. doi: 10.1111/nep.13444. [DOI] [PMC free article] [PubMed] [Google Scholar]
- 37.Reich H.N., Troyanov S., Scholey J.W., Cattran D.C., Toronto Glomerulonephritis Registry Remission of proteinuria improves prognosis in IgA nephropathy. J. Am. Soc. Nephrol. 2007;18:3177–3183. doi: 10.1681/ASN.2007050526. [DOI] [PubMed] [Google Scholar]
- 38.Khan S., Cabral P.D., Schilling W.P., Schmidt Z.W., Uddin A.N., Gingras A., Madhavan S.M., Garvin J.L., Schelling J.R. Kidney proximal tubule Lipoapoptosis is regulated by fatty acid transporter-2 (FATP2) J. Am. Soc. Nephrol. 2018;29:81–91. doi: 10.1681/ASN.2017030314. [DOI] [PMC free article] [PubMed] [Google Scholar]
- 39.Xing L., Chang X., Shen L., Zhang C., Fan Y., Cho C., Zhang Z., Jiang H. Progress in drug delivery system for fibrosis therapy. Asian J. Pharm. Sci. 2021;16:47–61. doi: 10.1016/j.ajps.2020.06.005. [DOI] [PMC free article] [PubMed] [Google Scholar]
- 40.Shen M., Pan X., Gao Y., Ye H., Zhang J., Chen Y., Pan M., Huang W., Xu X., Zhao Y., Jin L. LncRNA CRNDE exacerbates IgA nephropathy progression by promoting NLRP3 inflammasome activation in macrophages. Immunol. Invest. 2022;51:1515–1527. doi: 10.1080/08820139.2021.1989461. [DOI] [PubMed] [Google Scholar]
- 41.Guo N., Zhou Q., Huang X., Yu J., Han Q., Nong B., Xiong Y., Liang P., Li J., Feng M., et al. Identification of differentially expressed circulating exosomal lncRNAs in IgA nephropathy patients. BMC Immunol. 2020;21:16. doi: 10.1186/s12865-020-00344-1. [DOI] [PMC free article] [PubMed] [Google Scholar]
- 42.Zuo N., Li Y., Liu N., Wang L. Differentially expressed long non-coding RNAs and mRNAs in patients with IgA nephropathy. Mol. Med. Rep. 2017;16:7724–7730. doi: 10.3892/mmr.2017.7542. [DOI] [PubMed] [Google Scholar]
- 43.Wang P., Luo M.L., Song E., Zhou Z., Ma T., Wang J., Jia N., Wang G., Nie S., Liu Y., Hou F. Long noncoding RNA lnc-TSI inhibits renal fibrogenesis by negatively regulating the TGF-β/Smad3 pathway. Sci. Transl. Med. 2018;10:eaat2039. doi: 10.1126/scitranslmed.aat2039. [DOI] [PubMed] [Google Scholar]
- 44.Liang Y., Chen X., Wu Y., Li J., Zhang S., Wang K., Guan X., Yang K., Bai Y. LncRNA CASC9 promotes esophageal squamous cell carcinoma metastasis through upregulating LAMC2 expression by interacting with the CREB-binding protein. Cell Death Differ. 2018;25:1980–1995. doi: 10.1038/s41418-018-0084-9. [DOI] [PMC free article] [PubMed] [Google Scholar]
- 45.Necsulea A., Soumillon M., Warnefors M., Liechti A., Daish T., Zeller U., Baker J.C., Grützner F., Kaessmann H. The evolution of lncRNA repertoires and expression patterns in tetrapods. Nature. 2014;505:635–640. doi: 10.1038/nature12943. [DOI] [PubMed] [Google Scholar]
Associated Data
This section collects any data citations, data availability statements, or supplementary materials included in this article.
Supplementary Materials
Data Availability Statement
The microarray data have been deposited in the Genomic Expression Archive (GEA) under accession codes E-GEAD-540.