

SUMMARY
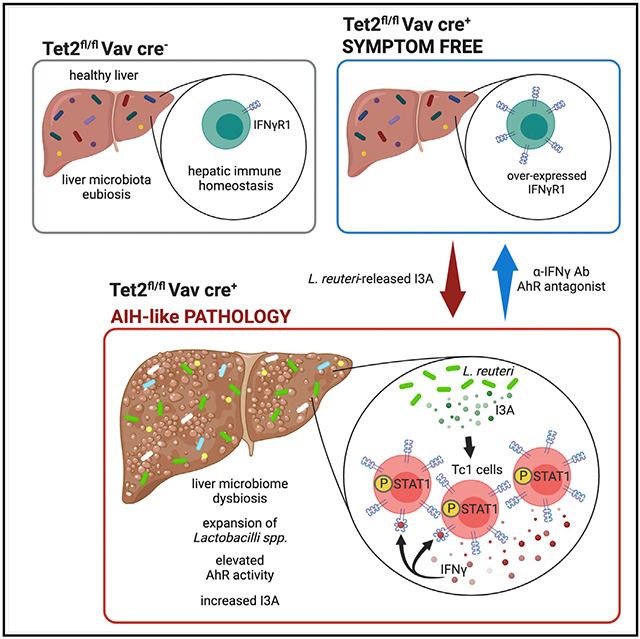
The triggers that drive interferon-γ (IFNγ)-producing CD8 T cell (Tc1 cell)-mediated autoimmune hepatitis (AIH) remain obscure. Here, we show that lack of hematopoietic Tet methylcytosine dioxygenase 2 (Tet2), an epigenetic regulator associated with autoimmunity, results in the development of microbiota-dependent AIH-like pathology, accompanied by hepatic enrichment of aryl hydrocarbon receptor (AhR) ligand-producing pathobionts and rampant Tc1 cell immunity. We report that AIH-like disease development is dependent on both IFNγ and AhR signaling, as blocking either reverts ongoing AIH-like pathology. Illustrating the critical role of AhR-ligand-producing pathobionts in this condition, hepatic translocation of the AhR ligand indole-3-aldehyde (I3A)-releasing Lactobacillus reuteri is sufficient to trigger AIH-like pathology. Finally, we demonstrate that I3A is required for L. reuteri-induced Tc1 cell differentiation in vitro and AIH-like pathology in vivo, both of which are restrained by Tet2 within CD8 T cells. This AIH-disease model may contribute to the development of therapeutics to alleviate AIH.
Graphical Abstract
In brief
In a mouse model of autoimmune hepatitis (AIH), Pandey et al. find that liver microbiome dysbiosis, characterized by an expansion of aryl hydrocarbon receptor (AhR) agonist-producing Lactobacilli, promotes CD8 T cell-dependent AIH. The epigenetic enzyme Tet methylcytosine dioxygenase 2 (Tet2) within CD8 T cells blocks AhR-agonist-induced AIH.
INTRODUCTION
Autoimmune hepatitis (AIH) is an autoinflammatory liver disorder that often becomes refractory to immunosuppressants—the sole therapeutic option for AIH patients (Manns et al., 2010)—and progresses to end-stage liver disease in the absence of treatment (Bataller and Brenner, 2005). Despite previous work suggesting genetic (Czaja and Donaldson, 2000; Krawitt, 2006) and environmental factors (Czaja, 2019) play a role in AIH development, mechanisms underlying disease initiation remain enigmatic due to the lack of suitable murine models. Hepatic inflammation, mediated by interferon-γ (IFNγ)-producing TCRβ CD4 and cytotoxic CD8 T cells (T helper [Th1] cells or Tc1 cells, respectively), is the main driver of hepatic tissue damage and sets the stage for overt AIH (Assis, 2020). In particular, Tc1 cells are considered to play an indispensable role in driving preclinical AIH-like pathology (Ikeda et al., 2014; Kido et al., 2008; Longhi et al., 2007; Watanabe et al., 1996; Zhang et al., 2019), and a histological hallmark of human AIH is global lymphocyte infiltration, dominated by cytotoxic TCRβ CD8 T cells (Assis, 2020; Eggink et al., 1982; Hashimoto et al., 1993; Ichiki et al., 2005; Renand et al., 2018; Tordjmann et al., 1998). However, the underlying mechanisms that trigger rampant hepatic Tc1 cell effector function and consequently drive AIH remain enigmatic.
Hematopoietic deficiency of the key epigenetic regulator Tet methylcytosine dioxygenase 2 (TET2), which occurs in around 10% of healthy individuals over 50 years of age, increases the risk of developing cancer (Busque et al., 2012; Delhommeau et al., 2009; Kosmider et al., 2009) and autoinflammatory disorders such as rheumatoid arthritis (Savola et al., 2018). Highlighting a key role for TET2 in autoimmune dysfunction, germline deficiency of TET2 has been associated with the development of autoinflammatory pathology (Stremenova Spegarova et al., 2020), and lack of Tet2 in TCRβ T cells increases the susceptibility to develop preclinical multiple sclerosis-like disease (Ichiyama et al., 2015). In addition, deficiency of Tet2 and Tet3 in either B cells or CD4 T cells promoted the development of lupus-like pathology (Tanaka et al., 2020) and fueled autoinflammatory CD4 T cell responses (Yue et al., 2016, 2019), respectively. Although the vast majority of previous studies describe Tet2 as a critical modulator in CD4 T cell function (Ichiyama et al., 2015; Nakatsukasa et al., 2019; Yue et al., 2016, 2019), emerging evidence highlights a key role of TET2 in shaping human (Fraietta et al., 2018) and murine (Carty et al., 2018) cytotoxic CD8 T cell fate via suppressing effector cytokine responses. Furthermore, it has been shown by us (McPherson et al., 2021; Meisel et al., 2018) and others (Fuster et al., 2017; Zhang et al., 2015) that loss of hematopoietic Tet2 invokes a poised cellular state—in a cell-autologous manner—that is highly sensitive to environmental, including microbial, signals and ultimately drives context-dependent inflammatory or autoinflammatory immune responses.
Systemic expansion of aryl hydrocarbon receptor (AhR) ligand-producing pathobionts is found to be associated with autoimmune inflammation in mice (Choi et al., 2020; Vieira et al., 2018; Sonner et al., 2019) and AIH in humans (Vieira et al., 2018). These observations together with the finding that experimental AIH requires the microbiota (Wei et al., 2016) illustrate the urgency to define if and how AhR ligand-releasing pathobionts impact the etiopathogenesis of AIH, given that such mechanisms potentially provide therapeutic targets for prevention or intervention in the development of AIH.
The AhR, a ligand-activated transcription factor, senses both endogenous and exogenous ligands, including microbial-derived ligands, and has been found to play a critical role in orchestrating CD4 T cell differentiation (Cervantes-Barragan et al., 2017; Quintana et al., 2008; Stockinger et al., 2014). However, whether and how microbial-induced AhR signaling affects CD8 T cell effector function remains to be defined.
In this study, we uncover a critical role for the hepatic microbiota in facilitating AhR-ligand-mediated Tc1 cell-driven AIH-like pathology development in an AIH-like disease model. Collectively, this work highlights the interplay between the liver microbiota, Tc1 cell immunity, and autoimmunity in the context of AIH.
RESULTS
Tet2 deficiency in hematopoietic cells drives spontaneous hepatic pathology
We have recently shown that loss of hematopoietic Tet2 (Tet2ΔVAV) is associated with the microbial-mediated systemic expansion of CD11b+Gr1+ myeloid cells in 50%–70% of >20-week-old mice (Meisel et al., 2018). This systemic myelo-expansion is a shared pathological feature of Tet2-deficiency (Abdel-Wahab and Levine, 2013; Delhommeau et al., 2009; Meisel et al., 2018; Moran-Crusio et al., 2011; Quivoron et al., 2011) and inflammatory liver disease (Cripps et al., 2010; Diao et al., 2014; Li et al., 2015) in mice and humans. These observations, in conjunction with the finding that myelo-expansion in humans with TET2 deficiency is associated with signs of hepatic pathology such as hepatomegaly and hepatic injury (Barraco et al., 2017; Pereira et al., 1988; Tefferi, 2016; Traina et al., 2012), led us to hypothesize that myelo-expansion in Tet2ΔVAV mice is linked to hepatic pathology. Assessment of hepatic injury in aged (20 weeks old) Tet2ΔVAV mice with (CD11b+Gr1+ frequency >16% in peripheral blood [PB]) or without (CD11b+Gr1+ frequency ≤ 16% in PB; referred to as symptom-free) myelo-expansion and Tet2 cre− littermates (Figure S1A; Meisel et al., 2018) revealed a significant correlation between myelo-expansion and the activity of plasma alanine aminotransferase (ALT), a key marker of hepatocyte injury (Fouts et al., 2012; Figure 1A). Unbiased transcriptomic profiling of livers from aged Tet2ΔVAV mice and Tet2 cre− littermates demonstrated that compared with WT littermates, Tet2ΔVAV mice with, but not those without, myelo-expansion displayed global alterations of transcription (Figures 1B, S1B, and S1C; Tables S1 and S2), including a substantial upregulation of genes indicative of hepatic fibrosis and inflammation (Figure 1C). Additionally, Tet2ΔVAV mice with myelo-expansion displayed cardinal signs of chronic hepatic pathology characterized by hepatomegaly (Figure 1D), hepatic fibrosis (Figures 1E and 1F), hepatic inflammation and immune cell infiltration (Figures 1F and 1G), hepatocyte injury (Figure 1H), and cell death (Figure 1I) relative to symptom-free Tet2ΔVAV mice and WT littermates.
Figure 1. Tet2ΔVAV mice develop spontaneous hepatic pathology with age.

>20-week-old Tet2ΔVAV mice and Tet2 cre− littermates were used.
(A) Correlation between CD11b+Gr1+ cell frequency and ALT activity. Pearson correlation test of Tet2ΔVAV mice, p value shown.
(B and C) RNA-seq of whole liver.
(B) Venn diagram.
(C) Heatmap of selected DEGs, average is shown.
(D) Liver weight.
(E) Representative trichrome staining of livers (left) and quantification of area of fibrosis (right). Scale bars, 100 μm.
(F) Hepatic gene expression.
(G) Number of CD45+ lymphocytes/g liver tissue quantified by flow cytometry.
(H) ALT activity.
(I) Representative images (left) and quantification (right) of TUNEL+ cells in livers; FOV, field of view. Scale bars, 20 μm.
(B and C) n = 4/5 mice/group. (D–I) Mean ± SEM, one-way ANOVA, Sidak’s post hoc test. Data represent three independent experiments. *p < 0.05, **p < 0.01, ***p < 0.001, ****p < 0.0001.
Taken together, our data demonstrate that a fraction of Tet2ΔVAV mice spontaneously develop age-related hepatic pathology and that myelo-expansion is a predictive marker of ongoing hepatic pathology in Tet2ΔVAV mice.
Hepatic disease in Tet2ΔVAV mice resembles autoimmune hepatitis-like pathology
Further computational assessment of hepatic transcriptomes of Tet2ΔVAV mice with myelo-expansion relative to WT littermates uncovered a highly significant enhancement of gene-sets associated with systemic autoimmunity (p = 1.54e–120) (Figure S1D; Table S3) and revealed a significant upregulation of several pathways associated with AIH (Sucher et al., 2019), such as T cell-mediated cytotoxicity (p = 1.13e–118) and positive regulation of IFNγ production (p = 8.56e–47) (Figures S1E and S1F; Table S4). This observation, together with the finding that Tet2ΔVAV mice spontaneously develop hepatic pathology in the absence of an overt pathological trigger, led us to hypothesize that there might be an autoimmune component in their hepatic disease etiology. In addition to common signs of hepatic pathology, AIH in mice (Cripps et al., 2010; Diao et al., 2014) and humans (Krawitt, 2006; Li et al., 2015) is characterized by elevated plasma nonorgan- and organ-specific autoantibodies, including antinuclear antibodies (ANAs) (Hennes et al., 2008). Interestingly, Tet2ΔVAV mice with myelo-expansion, in contrast to symptom-free Tet2ΔVAV mice and WT littermates, displayed significantly elevated blood plasma ANA levels (Figure 2A). Similar to observations in patients with AIH (Li et al., 2015), myelo-expansion in Tet2ΔVAV mice significantly correlated with both ANA plasma levels (Figure 2B) as well as liver injury (Figure 1A). Characterization of blood plasma ANA profiles by using ANA-reactive HEp2 cells (Tilstra et al., 2020) revealed that ANA profiles were significantly altered in Tet2ΔVAV mice with myelo-expansion (Figure 2C), mirroring ANA alterations typically documented in autoimmune-mouse models (Christensen et al., 2005; Nickerson et al., 2010; Tilstra et al., 2020). Of note, both symptom-free Tet2ΔVAV mice and WT littermates did not show aberrant ANA profiles (Figure 2C). Other autoantibodies found to be upregulated in plasma of preclinical and clinical AIH are antiliver-kidney microsomal (anti-LKM1) antibodies (Abs), antisoluble liver antigen (anti-SLA) Abs, and immunoglobulin G (IgG) (Hennes et al., 2008). Remarkably, anti-LKM1 Abs (Figure 2D), anti-SLA Abs (Figure 2E), and IgG levels (Figure 2F) were significantly increased within the plasma of Tet2ΔVAV mice with myelo-expansion relative to symptom-free Tet2ΔVAV mice and WT littermates. Assessment of our model for characteristic histological features of human AIH (Hennes et al., 2008) revealed that Tet2ΔVAV mice with myelo-expansion display key histological features of human AIH including interface hepatitis, lymphoplasmacytic infiltration, rosette formation, and emperipolesis, highlighting the translational relevancy of our model (Figures 2G and 2H). Furthermore, confirmation of hepatic plasma cell (PC) infiltration by flow cytometry revealed a significant expansion of CD138+ PCs in our AIH-like disease model (Figure 2I). Characterization of the hepatic immune response uncovered that Tet2ΔVAV mice with myelo-expansion, in stark contrast to symptom-free Tet2ΔVAV mice and WT littermates, displayed significantly elevated hepatic Tc1 and Th1 cell frequencies (Figure 2J). Notably, we failed to detect gross differences in hepatic IFNγ production of CD11b+Gr1+ cells, CD11b+ F4/80+ Kupffer cells, natural killer (NK) cells, NK T cells, or γδ T cells across groups, implying a TCRβ T cell specific type 1 immune response in our AIH-like disease model (Figure S2A). Although elevated Th17 cell numbers have been found in the PB of AIH patients relative to healthy controls (Zhao et al., 2011), the exact role of Th17 cells in AIH-like disease remains ill-defined as contrasting results have been described (Nagata et al., 2008; Zenewicz et al., 2007). In our AIH-like disease model, Th17 cell effector function remained unaffected (Figure S2B). In line with findings in clinical (Peiseler et al., 2012; Taubert et al., 2014) and preclinical AIH (Bochtler et al., 2008), hepatic Foxp3+ regulatory T cell (Treg) frequencies were significantly increased in AIH-like diseased Tet2ΔVAV mice relative to symptom-free Tet2ΔVAV mice and WT littermate controls (Figure S2C). Concordant with the dominant type 1 T cell immune response on a transcriptional level, we observed a significant upregulation of type 1 immune promoting transcription factors, such as T box transcription factor 21 (Tbet), PR domain 1 (Blimp1), Interferon regulatory factor 4 (Irf4), Signal transducer and activator of transcription 1 (Stat1) and Stat4, as well as type 1 immune effector cytokines Ifng and granzyme B (Gzmb), in livers of Tet2ΔVAV mice with AIH-like pathology relative to symptom-free Tet2ΔVAV mice and littermate controls (Figure S2D). Although interleukin-12 (IL-12)-producing antigen presenting cells (APCs) are key drivers of type 1 T cell immunity (Murphy et al., 1995), we found that the elevated type 1 T cell effector response in AIH-like diseased Tet2ΔVAV mice could not be explained by an increase in IL-12 production by hepatic APCs (Figure S2E). In accordance with the increased probability of developing AIH with age (Peng et al., 2014; Schramm and Lohse, 2014; Tanaka, 2020), young (6 weeks old) Tet2ΔVAV mice did not display signs of AIH (Figures S2F-S2N). To further define the AIH-specificity of our model, we interrogated the susceptibility of Tet2ΔVAV mice to AIH-specific and non-AIH-specific hepatic injury. We found that young Tet2ΔVAV mice displayed increased susceptibility to concanavalin A (ConA)-induced hepatitis, a well-accepted AIH model (Küsters et al., 1996; Ye et al., 2018; Figures 2K-2N), yet failed to display increased susceptibility to CCl4-mediated hepatic injury (Scholten et al., 2015; Figures S2O-S2R), demonstrating that Tet2ΔVAV mice display a selective susceptibility to AIH-like disease development, rather than a general susceptibility to hepatic injury.
Figure 2. Tet2ΔVAV mice develop AIH-like pathology.

(A–J) Mice from Figure 1 cohort were used. (A) ANA levels.
(B) Correlation between CD11b+Gr1+ cell frequency and ANA levels. Pearson correlation test of Tet2ΔVAV mice, p value shown.
(C) Representative images (top, left), scores (top, right), and pie charts of plasma ANA reactivity by Hep2 cells.
(D–F) Plasma levels of (D) LKM1, (E) SLA, and (F) total IgG.
(G) Representative H&E staining of livers. Scale bars, 100 μm.
(H) AIH-histology score. Each dot represents an independent mouse.
(I and J) Representative flow cytometry plots (left) and quantification (right) of hepatic (I) CD138+ PCs and (J) IFNγ-producing CD8 T cells (top) and CD4 T cells (bottom).
(K–N) 6-week-old Tet2ΔVAV and Tet2 cre− mice treated with ConA or PBS.
(K) ALT activity.
(L) Representative trichrome staining of livers. Scale bars, 100 μm.
(M and N) Hepatic gene expression.
(A, D–F, I–K, M, and N) Mean ± SEM, one-way ANOVA, Sidak’s post hoc test. (C and H) Kruskal-Wallis test, Dunn’s multiple comparisons test. Data represent at least two independent experiments. *p < 0.05, **p < 0.01, ***p < 0.001, ****p < 0.0001.
Taken together, these results demonstrate that Tet2ΔVAV mice spontaneously develop AIH-like pathology characterized by dominant type 1 T cell immunity.
IFNγ drives AIH-like pathology in Tet2ΔVAV mice
IFNγ is a key player in experimental AIH models (Gorham et al., 2001; Küsters et al., 1996; Nicoletti et al., 2000) and human AIH (Bovensiepen et al., 2019). To test the causal role of IFNγ in our AIH-like disease model, we treated Tet2ΔVAV mice with ongoing AIH, displayed by myelo-expansion, and WT littermates with a neutralizing IFNγ Ab (Figures S3A and S3B). Although isotype control Ab-treated Tet2ΔVAV mice showed overt AIH-like pathology (Figures 3A-3G), neutralizing IFNγ reversed AIH-like pathology in Tet2ΔVAV mice, as displayed by the absence of hepatic fibrosis, hepatic immune cell infiltration and inflammation (Figures 3A and 3B), hepatocyte injury (Figure 3C), restoration of Ifng mRNA levels (Figure 3D), hepatic Th1 and Tc1 cell frequencies (Figure 3E) and ANA plasma levels (Figure 3F), and the absence of hepatocyte cell death (Figure 3G). In accordance, aged Tet2−/−Ifng−/− mice, similar to Tet2+/+Ifng−/− littermates, did not develop AIH-like pathology (Figures S3C-S3H). Taken together, these data demonstrate that IFNγ is required for the development of AIH-like pathology in Tet2ΔVAV mice.
Figure 3. AIH-like pathology development in Tet2ΔVAV mice requires IFNγ.

>20-week-old Tet2ΔVAV mice with AIH-like disease and Tet2 cre− littermates treated with anti-IFNγ (see Figures S3A and S3B).
(A) Representative H&E (top) and trichrome (bottom) liver stain (left) and quantification of fibrosis area (right). Scale bars, 100 μm.
(B) Hepatic gene expression.
(C) ALT activity.
(D) Hepatic gene expression.
(E) Representative flow cytometry plots and quantification of hepatic IFNγ-producing CD4 T cells (left) and CD8 T cells (right).
(F) ANA levels.
(G) Representative image (left) and quantification of TUNEL+ cells in livers (right); FOV, field of view. Scale bars, 20 μm.(A-G) Mean ± SEM is shown. One-way ANOVA, Sidak’s post hoc test. Data represent two independent experiments. *p < 0.05, **p < 0.01, ***p < 0.001, ****p < 0.0001.
Deficiency of Tet2 in T cells alone is sufficient to drive AIH-like pathology development
We found the absence of Tet2 in myeloid cells, through the use of Tet2fl/fl LysM cre+ mice, was insufficient to drive AIH-like disease (Figures 4A-4E), and although reduced expression of TET2 in hepatocytes is associated with hepatic fibrosis (Wang et al., 2019; Xu et al., 2020), Tet2fl/fl Alb cre+ mice failed to develop signs of AIH-like pathology with age (Figures 4F-4J). Concordant with the key role of T cells in AIH (Senaldi et al., 1992; Tiegs et al., 1992; Zhang et al., 2019), we identified that aged Tet2fl/fl CD2 cre+ mice, in contrast to littermate controls, developed AIH-like pathology, displayed by substantial hepatic fibrosis and immune cell infiltration (Figure 4K), increased ALT levels (p = 0.055) (Figure 4L), significantly elevated ANA plasma levels (Figure 4M) and aberrant ANA profiles (Figure 4N), and significantly increased plasma anti-SLA Abs (Figure 4O) and IgG levels (Figure 4P). These key features of AIH were accompanied by a significantly increased frequency of hepatic Tc1, but not Th1, cells (Figure 4Q), suggesting that Tc1 cells are key drivers of AIH-like pathology. Further confirming the crucial role of T cells in our AIH model, although aged Tet2−/−Rag−/− mice exhibited significant myelo-expansio, they failed to develop AIH-like pathology (Figures S4A-S4F). These data reveal that Tet2 deficiency in T cells, but neither in myeloid cells nor hepatocytes, is sufficient to drive AIH-like pathology.
Figure 4. Deficiency of Tet2 in T cells, but neither in myeloid cells nor hepatocytes, is sufficient to drive the development of AIH-like pathology.

>20-week-old (A–E) Tet2fl/fl LysM cre+, (F–J) Tet2fl/fl Alb cre+, or (K–Q) Tet2fl/fl CD2 cre+ mice and corresponding WT littermates were used.
(A, F, and K) Representative H&E (top) and trichrome (bottom) liver stain (left) and quantification of fibrosis area (right). Scale bars, 100 μm.
(B, G, and Q) Quantification of IFNγ-producing CD4 T cells (left) and CD8 T cells (right).
(C, H, and L) ALT activity.
(D, I, and M) ANA levels.
(E, J, and P) Total IgG levels.
(N) Representative images (top, left), scores (top, right), and pie charts of plasma ANA reactivity by Hep2 cells.
(O) SLA levels.
(A–M and O–Q) Mean ± SEM is shown.
(K–M and O–Q) Two-tailed unpaired t test.
(N) Mann-Whitney test.
(A-Q) Data represent at least two independent experiments. *p < 0.05, **p < 0.01, ***p < 0.001, ****p < 0.0001.
The microbiota is required, and liver microbiome dysbiosis is linked to the development of AIH-like pathology in Tet2ΔVAV mice
Given that livers of Tet2ΔVAV mice with AIH-like disease harbor a transcriptional profile indicative of defense responses against microbial stimuli (Figure S1E; Table S4) and the reported requirement of the microbiota for the development of experimental AIH (Wei et al., 2016), we tested the requirement of the microbiota in our AIH model. Accordingly, aged germ-free (GF) Tet2−/− mice, similar to WT littermates, failed to display signs of AIH-like pathology (Figures 5A-5H). Liver microbiome dysbiosis has been identified in AIH patients relative to healthy controls (Vieira et al., 2018). Thus, we assessed the liver microbiome composition of symptomatic Tet2ΔVAV mice (myelo-expansion and elevated ANA plasma) compared with age-matched symptom-free Tet2ΔVAV mice and WT littermates using two independent but complementary approaches (Figure S5A). First, we sterilely cultured livers and performed 16S ribosomal RNA sequencing (16S rRNA-seq) of single colonies; second, we performed 16S rRNA-seq of hepatic microbial DNA. Intriguingly, profiling of the liver microbiota revealed a significant increase in microbial diversity in AIH-like diseased Tet2ΔVAV mice in both independent approaches (Figures 6A-6C and S5B; Table S5). Livers of AIH-like diseased Tet2ΔVAV mice harbored an increased diversity in translocated bacteria, such as Lactobacillus reuteri (L. reuteri), L. johnsonii, Enterococcus faecalis, and Escherichia coli when compared with symptom-free Tet2ΔVAV mice and WT littermate controls (Figure 6A). The increased microbial alpha-diversity identified by 16S rRNA-seq of hepatic microbial DNA (Figure 6B), predominately driven by the genera Lactobacillus, Sutterella, Lachnospiraceae, and Prevotella (Figure 6C), significantly correlated with both ANA plasma levels (Figure 6D) and hepatic IFNγ-producing T cell frequencies in Tet2ΔVAV mice (Figure 6E), indicating that liver dysbiosis may drive AIH-like disease. The significantly increased hepatic bacterial load in AIH-like diseased Tet2ΔVAV mice relative to WT littermates (Figure 6F) suggests that expansion of pathobionts is implicated in AIH-like disease. Of note, Tet2ΔVAV mice with both AIH-like disease and liver microbiome dysbiosis failed to display gross differences in their small and large intestinal microbial composition and bacterial load relative to symptom-free Tet2ΔVAV mice and WT littermates (Figures S5C-S5F), implying that gut dysbiosis does not drive AIH-like pathology in Tet2ΔVAV mice. Taken together, these data demonstrate that the microbiota is required for and that liver microbiome dysbiosis is linked to AIH-like disease development in Tet2ΔVAV mice.
Figure 5. The microbiota is required for the development of AIH-like pathology in Tet2-deficient mice.

25-week-old germ-free (GF) Tet2−/− and Tet2+/+ littermates were used.
(A) Liver weight.
(B) Representative H&E (top) and trichrome (bottom) liver stain (left) and quantification of fibrosis area (right). Scale bars, 100 μm.
(C) Hepatic gene expression.
(D) ALT activity.
(E) Hepatic gene expression.
(F) Quantification of hepatic IFNγ-producing CD4 T cells (left) and CD8 T cells (right).
(G) ANA levels.
(H) Total IgG levels.
(A–H) Mean ± SEM is shown. Data represent two independent experiments.
Figure 6. AIH-like pathology development in Tet2ΔVAV mice is linked to liver microbiome dysbiosis and is triggered upon L. reuteri treatment.

>20-week-old (A–G and N) and 6-week-old (H–M) Tet2ΔVAV mice and WT littermates were used.
(A) Live commensal bacteria identified in livers.
(B) Shannon diversity index of hepatic microbial DNA of species. p value compares AIH-like Tet2ΔVAV mice with WT littermates.
(C) Hierarchical clustering heatmap of hepatic genera identified from cohort defined in Figure S5A.
(D and E) Correlation of Shannon diversity indices (of B) with (D) ANA levels and (E) frequency of hepatic IFNγ-producing T cells. Pearson correlation test of Tet2ΔVAV mice, p value shown.
(F) Hepatic bacterial 16S rRNA gene expression.
(G) AhR activity of liver homogenate.
(H–M) Young Tet2ΔVAV mice and WT littermates were orally treated with 109 CFU L. reuteri consecutively (see STAR Methods for details).
(H) ANA levels.
(I) Representative flow cytometry plots (left) and quantification (right) of hepatic IFNγ-producing CD8 T cells.
(J) ALT activity.
(K) Presence of viable L. reuteri detected in livers of PBS (top) or L. reuteri-treated (bottom) mice.
(L and M) AhR activity of (L) recultured hepatic bacteria and (M) liver homogenate.
(N) I3A levels in liver homogenate.
(A) Data represent two independent experiments, n = 8 mice/group. (B) One-way ANOVA, Sidak’s post hoc test. Median, first and third quartiles are shown. (C) n = 4 mice/group, average is shown. (G, H–J, and N) Data represent two independent experiments. (F and H–J) Mean ± SEM, one-way ANOVA, Sidak’s post hoc test. (G and N) Kruskal-Wallis test, Dunn’s multiple comparisons test. Median, first, and third quartiles are shown. (L and M) Mean ± SEM, two-tailed unpaired t test. *p < 0.05, **p < 0.01, ***p < 0.001.
Indole-3-aldehyde-producing L. reuteri translocates to the liver and triggers AIH-like pathology in Tet2ΔVAV mice
To investigate whether the functional activities of intrahepatic bacteria are linked to AIH-like pathology in our model, we used the phylogenetic investigation of communities by reconstruction of unobserved states (PICRUSt) tool (Langille et al., 2013). Here, we identified that the hepatic microbiome of AIH-like diseased Tet2ΔVAV mice determines a differential enrichment of metabolic functional pathways in comparison with symptom-free Tet2ΔVAV mice and WT littermates (Figure S5G; Table S6). AIH-like diseased Tet2ΔVAV mice exhibited enriched pathways related to metabolism of amino acids and mono- and oligo-saccharides in addition to other cellular functions. Most intriguingly, there was a dominance of microbial genes that encode the Phenylalanine, tyrosine, and tryptophan biosynthesis pathway, a metabolic pathway that enables bacteria to catabolize dietary tryptophan (Trp) into indole derivatives, which have the ability to activate the AhR in mammalian cells (Zelante et al., 2013). Concordantly, we found several key AhR target genes to be significantly upregulated in AIH-like diseased livers of Tet2ΔVAV mice relative to WT littermates and symptom-free Tet2ΔVAV mice, such as Cyp1a1 (encodes cytochrome p450 family 1 subfamily a member 1), Cyp1b1, Ahrr (encodes aryl-hydrocarbon receptor repressor), Igf1r (encodes insulin like growth factor 1 receptor), and Nfe2l2 (encodes nfe2 like bzip transcription factor 2) (Figure S5H). Furthermore, we observed via an AhR reporter cell line that liver homogenate of AIH-like diseased Tet2ΔVAV mice displayed a significant increase in the ability to induce AhR activation relative to symptom-free Tet2ΔVAV mice and WT littermates (Figure 6G), indicating livers of Tet2ΔVAV mice harbor increased levels of AhR ligands.
Due to the observed enrichment of Lactobacillus in livers of AIH-like diseased Tet2ΔVAV mice and because L. reuteri is known to have high AhR ligand-producing abilities (Zelante et al., 2013), we set out to test whether L. reuteri is sufficient to induce AIH-like pathology. Indeed, we identified that oral administration of L. reuteri triggered significantly elevated ANA levels (Figure 6H), robust hepatic expansion of Tc1, but not Th1 cell frequencies (Figures 6I and S5I), and substantial hepatic injury (Figure 6J) in young Tet2ΔVAV mice relative to WT littermates and vehicle-treated Tet2ΔVAV mice. To better understand how L. reuteri induces AIH-like pathology, we set out to test whether orally gavaged L. reuteri translocates to and releases AhR ligands within the liver. We found that hepatic L. reuteri translocation was independent of Tet2 and occurs in L. reuteri-treated, but not PBS-treated, mice (Figure 6K), and confirmed that translocated L. reuteri maintained the ability to catabolize Trp and subsequently produce AhR ligands ex vivo (Figure 6L). Accordingly, L. reuteri-treated mice displayed significantly increased AhR activity in liver homogenate when compared with PBS-treated mice (Figure 6M), implying that intrahepatic L. reuteri releases AhR ligands within the liver. These findings prompted us to assess the hepatic abundance of indole-3-aldehyde (I3A), the primary AhR agonist of several Lactobacillus spp (Zelante et al., 2013), including L. reuteri, within the livers of untreated AIH-like diseased Tet2ΔVAV mice. Strikingly, we found a significant increase in hepatic I3A levels of AIH-like diseased Tet2ΔVAV mice relative to symptom-free Tet2ΔVAV mice and WT littermate controls via quantitative high-resolution mass spectrometry (Figure 6N). Furthermore, L. johnsonii, a phylogenetic relative of L. reuteri that lacks the ability to produce I3A (Cervantes-Barragan et al., 2017; Zelante et al., 2013), was insufficient to induce AIH-like pathology in young Tet2ΔVAV mice (Figures S6A-S6C), in stark contrast to L. reuteri (Figures 6H-6J).
Taken together, these findings imply that intrahepatic I3A-releasing pathobionts play a critical role in the induction of AIH in our model.
The development of AIH-like disease in Tet2ΔVAV mice is dependent on AhR signaling
Next, we assessed whether L. reuteri-induced AIH-like disease in Tet2ΔVAV mice is dependent on AhR signaling. As expected, L. reuteri treatment triggered AIH-like pathology in young Tet2ΔVAV mice, characterized by elevated ANA and ALT levels relative to vehicle-treated Tet2ΔVAV mice and L. reuteri-treated WT littermates, yet remarkably, AhR blockade efficiently suppressed the development of L. reuteri-mediated AIH-like pathology in Tet2ΔVAV mice (Figures 7A and 7B). L. reuteri translocated to a similar proportion of livers independent of AhR inhibitor treatment (Figure 7C). These findings prompted us to assess whether blocking AhR signaling reverts ongoing AIH-like pathology in Tet2ΔVAV mice. Strikingly, we observed that blocking AhR signaling efficiently suppressed ongoing AIH-like pathology in aged Tet2ΔVAV mice, demonstrated by a significant reduction in plasma ANA and ALT levels (Figures 7D and 7E) and hepatic Tc1 cell frequencies (Figure 7F). Of note, AhR inhibitor-treated, compared with vehicle-treated, WT littermates remained grossly unaffected (Figures 7D-7F). Taken together, these data demonstrate that AhR signaling is critical in the etiopathogenesis of Tc1 cell-dependent AIH-like pathology in the context of hematopoietic Tet2 deficiency.
Figure 7. I3A is required for, and the absence of Tet2 in CD8 T cells is sufficient to succumb to, L. reuteri-mediated AIH-like pathology.

(A–C) 6-week-old Tet2ΔVAV mice and WT littermates treated with L. reuteri or PBS ± AhR antagonist (CH223191; intraperitoneal [i.p.] injection) or vehicle control.
(A) ANA levels.
(B) ALT activity.
(C) Presence of viable L. reuteri in the livers of L. reuteri-treated mice.
(D–F) >20-week-old Tet2ΔVAV AIH-like diseased mice and WT littermates treated with AhR antagonist (CH223191; i.p.) or vehicle control.
(D) ANA levels; D, day.
(E) ALT activity.
(F) Representative flow cytometry plots (left) and quantification (right) of hepatic IFNγ-producing CD8 T cells.
(G) IFNγ production by naive CD8 T cells following stimulation with anti-CD3 and anti-CD28 ± L. reuteri supernatant ± ΔArAT L. reuteri supernatant ± AhR antagonist.
(H) RNA-seq heatmap of naive CD8 T cells following stimulation with anti-CD3 and anti-CD28 ± I3A ± AhR antagonist; WT, Tet2 cre− mice; KO, Tet2ΔVAV mice.
(I–K) 6-week-old Tet2ΔCD8 mice and WT littermates treated with L. reuteri or ΔArAT L. reuteri.
(I) ANA levels.
(J) ALT activity.
(K) Presence of viable L. reuteri in livers of L. reuteri or ΔArAT L. reuteri-treated mice.
(L and M) 6-week-old Tet2ΔVAV mice and WT littermates were used.
(L) Representative histogram plot of mean fluorescent intensity (MFI) (left) and quantification (right) of IFNγR1 expression on hepatic naive CD8 T cells.
(M) Representative histogram plot of mean fluorescent intensity (MFI) (left) and quantification (right) of pSTAT1 activation in naive CD8 T cells following stimulation with anti-CD3 and anti-CD28 ± recombinant IFNγ; dashed lines, PBS treated; solid lines, recombinant IFNγ treated.
(A–C) Data represent 3–7 mice/group.
(A and B) Mean ± SEM. (A) d0 to d35 comparison, paired t test, treatment comparison at D35, two-way ANOVA, Sidak’s multiple comparisons test. (B) One-way ANOVA, Sidak’s post hoc test.
(D–F) Data represent two independent experiments, mean ± SEM n = 4–6 mice/group.
(D) D0 to D35 comparison, paired t test, treatment comparison at D35, two-way ANOVA, Sidak’s multiple comparisons test.
(E and F) One-way ANOVA, Sidak’s post hoc test.
(G) Data represent 5 mice/group, mean ± SEM, two-way ANOVA, Sidak’s multiple comparisons test.
(H) Data represent n = 3–4 mice/group, average is shown.
(I and J) Mean ± SEM, two-way ANOVA, Sidak’s multiple comparisons test.
(L) Mean ± SEM, two-tailed unpaired t test.
(M) Data represent two independent experiments, mean ± S.E.M., paired t test, two-way ANOVA, Sidak’s multiple comparisons test. *p < 0.05, **p < 0.01, ***p < 0.001, ****p < 0.0001.
I3A is required for L. reuteri-induced Tc1 cell immunity in vitro and AIH-pathology in vivo, both of which are restrained by Tet2 within CD8 T cells
Finally, we interrogated whether L. reuteri-released I3A directly acts on CD8 T cells to promote effector function and the mechanism of how the absence of Tet2 in CD8 T cells elevates effector responses and subsequently accelerates the development of AIH in our model. To this end, we deployed a reductionist approach and cultured splenic naive CD8 T cells with supernatant derived from either I3A-releasing L. reuteri or a genetically engineered L. reuteri strain lacking the aromatic amino acid aminotransferase class I/II (ArAT) and consequently the ability to release the AhR agonist I3A (ΔArAT L. reuteri) (Cervantes-Barragan et al., 2017). We observed that L. reuteri-derived supernatant substantially promoted IFNγ production in WT CD8 T cells, which was significantly amplified in the absence of Tet2 (Figure 7G). This increase in Tc1 cell effector function was dependent on both AhR signaling and the presence of I3A, since both the addition of the AhR antagonist CH223191 and the supernatant of ΔArAT L. reuteri either efficiently suppressed or failed to induce IFNγ production in CD8 T cells, respectively (Figure 7G). In line with the ability of L. reuteri to selectively induce Tc1, but not Th1, cell effector function in vivo (Figures 6I and S5I), L. reuteri-derived supernatant failed to induce IFNγ production independent of Tet2 in CD4 T cells in vitro (Figure S6D), indicating that L. reuteri-derived I3A induces a type 1 immune profile selectively in CD8 T cells in vitro and in vivo. Assessment of the impact of I3A on CD8 T cells and its antagonism by Tet2 at a genome-wide level uncovered that I3A induced key type 1 immune transcription factors such as Tbet, Eomes, and Irf4, as well as effector cytokines such as Ifng, Gzmb, and perforin (Figure 7H; Table S7), and this effect was AhR dependent and significantly enhanced in the absence of Tet2 (Figure 7H).
Next, we interrogated whether I3A is required for, and absence of Tet2 within CD8 T cells is sufficient to succumb to, L. reuteri-induced AIH-like pathology. Remarkably, in contrast to PBS-treated young Tet2ΔCD8 mice and littermate controls that remained unaffected, L. reuteri-treated Tet2ΔCD8 mice, but not WT littermates, developed AIH-like pathology, displayed by significantly elevated ANA and ALT plasma levels, whereas ΔArAT L. reuteri-treated Tet2ΔCD8 mice failed to develop AIH-like disease (Figures 7I and 7J). Notably, both viable L. reuteri strains were present in a similar proportion of livers independent of genotype (Figure 7K). These findings demonstrate the absence of Tet2 in CD8 T cells is sufficient to render mice susceptible to L. reuteri-mediated AIH-like pathology, dependent on the production of I3A.
To better understand the mechanism of how the L. reuteri-derived I3A-induced Tc1 cell immune response is exacerbated in CD8 T cells deficient of Tet2, we assessed whether Tet2−/− CD8 T cells display a heightened sensitivity to IL-12, given that IL-12 is a key cytokine for inducing a type 1 effector program (Xiao et al., 2009). However, we found that Tet2+/+ and Tet2−/− CD8 T cells, which express comparable surface IL-12 receptor β2 levels, produced a comparable amount of IFNγ when stimulated with IL-12 ex vivo (Figures S6E and S6F). IFNγ-mediated engagement of IFNγR1 is described to promote a type 1 effector program (Whitmire et al., 2005). Interestingly, we found IFNγR1 to be significantly upregulated on hepatic and splenic naive CD8 T cells of young Tet2ΔVAV mice relative to WT littermates (Figures 7L and S6G). As expected, IFNγ stimulation of splenic Tet2+/+ and Tet2−/− naive CD8 T cells ex vivo led to an increase in STAT1 activation in both Tet2+/+ and Tet2−/− CD8 T cells; however, strikingly, IFNγ-induced STAT1 activation was significantly higher in Tet2−/− compared with Tet2+/+ CD8 T cells (Figure 7M). This finding suggests that given their elevated expression of IFNγR1, naive Tet2−/− CD8 T cells display enhanced sensitivity to extrinsic IFNγ leading to increased activation of STAT1 that maintains a type 1 immune program.
Taken together, these data suggest that mechanistically, Tet2 within CD8 T cells antagonizes L. reuteri-derived I3A-induction of Tc1 cell differentiation and function that ultimately drives the development of AIH-like pathology, possibly via restricting increased sensitivity to exogenous IFNγ.
DISCUSSION
Our defined AIH model suggests that the hepatic expansion of AhR ligand-releasing pathobionts triggers AIH-like pathology in an IFNγ and AhR-dependent manner. We postulate that given the enhanced sensitivity of naive Tet2−/− CD8 T cells to extrinsic IFNγ, I3A-induced IFNγ production promotes a vicious feedforward cycle that leads to AIH-like pathology (Figure S6H). Supporting this notion, genetic Ifng ablation prevented the development of (Figures S3C-S3H), and neutralization of IFNγ reverted ongoing, AIH-like pathology in our model (Figures 3A-3G).
AIH-like disease development in Tet2ΔVAV mice is linked to both elevated hepatic Tc1, as well as Th1 cell responses; thus, we postulate that other bacterial taxa, besides L. reuteri, promote hepatic Th1 cell effector function in our model. In line with this hypothesis, livers of AIH-like diseased Tet2ΔVAV mice displayed an expansion of other genera besides Lactobacillus spp., including Sutterella spp., Lachnospiraceae spp., and Prevotella spp.
Given that GF mice are absent of microbial-derived AhR ligands but are exposed to endogenous AhR ligands, our finding that GF Tet2−/− mice fail to develop AIH-like disease confirms that endogenous AhR ligands do not play a major role in our AIH-like disease model. Furthermore, although a recent report revealed alterations in AhR signaling in purified Th17 and Treg cells obtained from AIH patients (Vuerich et al., 2021), these alterations were ligand-specific and did not address the impact of microbial-derived AhR ligands. Thus, the impact of microbial-derived AhR ligands such as I3A on Th17 and Treg cells from AIH patients warrants further investigation.
Although our study shows that L. reuteri is sufficient to induce AIH-like pathology in Tet2ΔVAV and Tet2ΔCD8 mice, it is likely not required for the development of AIH in our model; rather, we hypothesize that an expansion of hepatic AhR ligand-producing pathobionts is required. This is supported by our observation that other pathobionts capable of producing AhR ligands translocate to livers of AIH-like Tet2ΔVAV mice, such as L. murinus, E. faecalis, and E. coli (Lamas et al., 2018).
Despite the defined role of Tet2 as critical modulator of CD4 T cell function (Ichiyama et al., 2015; Yue et al., 2019), the impact of Tet2 on CD8 T cell function remains poorly understood. In a mouse model of TCRβ Tet2 T cell deficiency, it was shown that the loss of Tet2 was associated with enhanced Tc1 cell effector function in acute lymphocytic choriomeningitis virus infection (Carty et al., 2018). Another study highlighted that TET2 acts as an epigenetic modulator of human CD8 T cell fate and showed that spontaneous somatic TET2 mutation (which led to bi-allelic deletion of TET2) within CD19-targeted CD8 T cells promoted their antitumor activity mediated by increased IFNγ and Gzmb release (Fraietta et al., 2018). Thus, these findings, in accordance with our own, suggest Tet2 antagonizes cytotoxic CD8 T cell effector function.
Our study shows that the liver microbiome, in particular translocated I3A-producing pathobionts, plays a critical role in mediating Tc1 cell effector function that drives AIH-like disease. One exciting area of future investigations will be to define the reactivity and antigen dependence of hepatic CD8 T cells against expanded AhR ligand-producing pathobionts, including L. reuteri, and/or hepatocytes in the context of Tet2 deficiency. Previous studies have shown increased abundance and effector function of autoantigen-specific CD4 T cells in AIH-like disease models and human AIH (Ma et al., 2006; Mix et al., 2008; Preti et al., 2021; Umeshappa et al., 2021) and that adoptive transfer of autoantigen-specific CD8 T cells is sufficient to promote AIH-like disease (Zierden et al., 2010), implicating both autoantigen-specific CD4 and CD8 T cells in AIH.
Collectively, we identified a AIH-like mouse model that will aid in a better understanding of the underlying mechanisms that drive microbiota- and Tc1 cell-dependent AIH and will help in developing innovative treatment regimens to alleviate AIH in humans.
Limitations of the study
Limitations to our study include identifying whether L. reuteri secretes I3A within the liver in situ and if an expansion of Trp catabolizing gut-pathobionts specifically within the liver is required to trigger AIH in our model. Furthermore, the cell type that directly responds to AhR ligands in our AIH model in vivo remains unaddressed. The mechanism that drives liver dysbiosis in Tet2ΔVAV mice remains unanswered and the genomic mechanism by which I3A induces Tc1 cell differentiation remains to be addressed. Future studies will need to test whether AIH-like pathology spontaneously develops in Tet2ΔCD8 mice and if so, the role of translocated AhR-ligand-producing pathobionts will need to be defined.
STAR★METHODS
RESOURCE AVAILABILITY
Lead contact
Further information and requests for resources and reagents should be directed to and will be fulfilled by the lead contact, Marlies Meisel (marlies@pitt.edu).
Materials availability
Mouse lines generated in this study are available from the lead contact upon request.
Data and code availability
Raw and analyzed 16S rRNA-Seq data are available via the NCBI Sequence Read Archive (SRA: PRJNA830441). Raw and analyzed hepatic RNA-seq data are available at NCBI: GSE201459. Remaining data needed to support the conclusion of this manuscript are included in the main text and supplementary materials. Any additional information required to reanalyze the data reported in this paper is available from the lead contact upon request
EXPERIMENTAL MODEL AND SUBJECT DETAILS
Mice
All knockout mice used in these studies are on a C57BL/6 background. Age-matched >20-week (wk)-old mice (age range 20-25 weeks) were used for all experiments, unless indicated otherwise. Both female and male mice were used for experiments at equal levels; no notable sex-dependent differences were found for the reported experiments. Tet2−/− mice were previously described (Moran-Crusio et al., 2011). Tet2fl (B6;129S-Tet2tm1.1Iaai/J) mice were crossed with the hematopoietic-specific Vav-cre line (B6.Cg-Tg(Vav1-icre)A2Kio/J), the myeloid cell lineage-specific LysM-cre line (Lyz2tm1(cre)Ifo)), the T cell specific CD2-cre line (C57BL/6-Tg(CD2-cre)1Lov/J), the hepatocyte specific Albumin-cre line (B6.Cg-Speer6-ps1Tg(Alb-cre)21Mgn/J), and the CD8 T cell specific CD8α-cre line (C57BL/6-Tg(Cd8a-cre)1Itan/J) all from the Jackson Laboratory. Full Tet2−/− mice were crossed with Ifng−/− mice (B6.129S7-Ifngtm1Ts/J) to generate Tet2−/−Ifng−/− and Tet2+/+Ifng−/− littermate controls. Tet2−/− mice were crossed with Rag−/− mice (B6(Cg)-Rag2tm1.1Cgn/J) to generate Tet2−/−Rag−/− and Tet2+/+Rag−/−littermate controls. Rag−/− mice were kindly provided by Dr. M. Shlomchik, University of Pittsburgh. Mice were housed at the University of Pittsburgh animal facilities under specific pathogen-free (SPF) conditions, where cages were changed on a weekly basis; ventilated cages, bedding, food, and water (non-acidified) were autoclaved before use, ambient temperature maintained at 23 °C, and 5% Clidox-S was used as a disinfectant. Experimental breeding cages were randomly housed on two different racks in vivarium, and all cages were kept on automatic 12-h light/dark cycles. Germ-free (GF) Tet2−/− mice (Meisel et al., 2018) were bred to GF C57BL/6 WT mice to generate littermate controls and maintained in flexible film isolators in University of Pittsburgh Axenic Gnotobiotic Units. Animal husbandry for both SPF and GF facilities, and experimental procedures, were performed in accordance with Public Health Service policy and approved by the University of Pittsburgh Institutional Animal Care and Use Committees and the University of Chicago Animal Care Committee.
Gnotobiotic animal husbandry
Food, bedding, and water (non-acidified) were autoclaved before transfer into sterile isolators. Cages within isolators were changed weekly, and all cages in the vivarium were kept on 12-h light/dark cycles. Microbiology testing of fecal (experimental mice), or of cecum samples (sentinel mice; aerobic and anaerobic culture, 16S qPCR) was performed every other week to confirm GF status.
Bacterial cultures
The following bacterial strains were used for in vitro and/or in vivo studies: Lactobacillus reuteri (L. reuteri; ATCC), L. johnsonii (ATCC) and ΔArAT L. reuteri (lacking the gene coding for aminotransferase class I/II (Cervantes-Barragan et al., 2017) generously provided by Dr. L. Cervantes-Barragan, Emory University). L. reuteri strains were grown in MRS broth (Gibco) at 37 °C under anaerobic conditions.
Culture of livers at steady state
Similar to Vieira et al. (2018), livers were aseptically removed and homogenized by mashing through a 100μm cell strainer in sterile water containing 0.05% NP-40. Post 3-4 h of incubation at 37 °C, an aliquot of the tissue homogenate was added to BBL Mycoflask Thioglycollate (Fluid) Prepared Media (BD Diagnostic Systems) and incubated for 72 h under aerobic or anaerobic conditions at 37 °C. Serial dilutions of samples were prepared and 12 μl of cell suspension were dropped, in duplicates, onto BD BBL™ Brucella Agar with 5% Sheep Blood, Hemin and Vitamin K1 agar plates (Fisher Scientific) under anaerobic (anaerobic chamber (Coy Systems)) or aerobic conditions. Plates were sealed with parafilm and incubated upside down for 48 h (aerobic) or 72 h (anaerobic).
METHOD DETAILS
Tissue harvest and cell purification
Peripheral blood (PB) was collected by cheek bleeding (post sterilizing cheeks with 70% ethanol wipes) into EDTA-containing tubes. Livers were harvested with autoclaved tools under sterile conditions and liver weight was recorded. Liver mononuclear cells (LMNCs) were isolated by using previously described protocol with the following modifications (Castillo-Dela Cruz et al., 2019). Briefly, livers were mashed through a 100μm cell strainer. LMNCs were purified from liver single cell suspensions by a 40% percoll (Fisher Scientific) centrifugation. Erylysis of PB and livers were performed using the Mouse Erythrocyte Lysing Kit (R&D Systems).
Flow cytometry
Single cell suspensions were prepared as described and either not stimulated (for assessment of myeloid cells in PB) or stimulated in RPMI containing PMA (0.1 μg/ml), ionomycin (1μg/ml), Golgi Stop (1.95μM), and Golgi Plug (1μg/ml). Post 3 h of stimulation, cells were washed and resuspended in FACS buffer (PBS, 2% FBS) for immunostaining and subsequent FACS analysis. All cell suspensions were incubated with Fc Block (BD Biosciences) followed with surface marker Ab stain for 20 min (min) at 4 °C. For dead cell exclusion, cells were stained with Zombie NIR™ Fixable (BioLegend) or LIVE/DEAD Fixable Aqua dye (Invitrogen) and washed with FACS buffer. For intracellular cytokine and transcription factor staining, surface Ab-stained cells were first fixed and permeabilized using the FoxP3 Transcription Factor Staining Buffer kit (eBioscience™) following manufacturer’s instructions. Cells were further stained with Abs for intracellular proteins for 30 min at 4 °C. For IL-12p40 staining, LMNCs were incubated in RPMI medium (Thermo Fisher Scientific) for 6 h in the presence of 1 μl/ml Golgi Plug (BD Biosciences). Surface staining was performed as described above and cells were permeabilized with Cytofix/Cytoperm (BD Biosciences) for intracellular cytokine staining. Samples were FSC-A/SSC-A gated to exclude debris and gated to exclude dead cells. Samples were run on an Aurora (Cytek) flow cytometer and analyzed with FlowJo 10 (Tree Star). All fluorophore conjugated Abs used are listed under key resources table. Representative gating strategies of all cell populations displayed in this study can be found in Figure S7.
KEY RESOURCES TABLE
| REAGENT or RESOURCE | SOURCE | IDENTIFIER |
|---|---|---|
| Antibodies | ||
| anti-CD16 and anti-CD32 (clone 2.4G2) | BD Biosciences | Cat# 553142; RRID:AB_394657 |
| anti-Mouse CD4 monoclonal antibody (Rat, Clone GK1.5), Brilliant Violet 650 conjugated | BD Biosciences | Cat# 563232; RRID:AB_2738083 |
| anti-Mouse CD8 monoclonal antibody (Rat, Clone 53-6.7), Brilliant Violet 570 conjugated | Biolegend | Cat# 100740; RRID:AB_2563055 |
| anti-Mouse IFN-gamma monoclonal antibody (Rat, Clone XMG1.2), Brilliant Violet 605 conjugated | BioLegend | Cat# 505839; RRID:AB_2561438 |
| anti-Mouse CD45 monoclonal antibody (Rat, Clone 30-F11), Brilliant Violet 480 conjugated | BD Biosciences | Cat# 566095; RRID:AB_2739499 |
| anti-Mouse TCR β monoclonal antibody (armenian hamster, Clone H57-597), Alexa Fluor® 700 conjugated | BD Biosciences | Cat# 560705; RRID:AB_1727573 |
| anti-Mouse FOXP3 monoclonal antibody (Rat, Clone FJK-16s), FITC conjugated | Thermo Fisher Scientific | Cat# 11-5773-82; RRID:AB_465243 |
| anti-Mouse CD45 monoclonal antibody (Rat, 30-F11), APC-Cy™7 conjugated | BD Biosciences | Cat# 557659; RRID:AB_396774 |
| anti-Mouse CD4 monoclonal antibody (Rat, GK1.5), BUV395 conjugated | BD Biosciences | Cat# 563790; RRID:AB_2738426 |
| anti-Mouse CD8 monoclonal antibody (Rat, 53-6.7), BUV737 conjugated | BD Biosciences | Cat# 612759; RRID:AB_2870090 |
| anti-Mouse CD19 monoclonal antibody (Rat, Clone 1D3/CD19), PerCP/Cyanine5.5 conjugated | BioLegend | Cat# 152406; RRID:AB_2629815 |
| anti-Mouse F4/80 monoclonal antibody (Rat, Clone BM8), PE-Cyanine5 conjugated | eBioscience™ | Cat# 15-4801-82; RRID:AB_468798 |
| anti-Mouse CD11c monoclonal antibody (Armenian hamster, Clone N418), Brilliant Violet 421 conjugated | BD Biosciences | Cat# 565451; RRID:AB_2744278 |
| anti-Mouse IL-17A monoclonal antibody (Rat, Clone TC11-18H10.1), Alexa Fluor(R) 647 conjugated | BioLegend | Cat# 506912; RRID:AB_536014 |
| anti-Mouse NK-1.1 monoclonal antibody (Mouse, Clone PK136), Brilliant Violet 786 conjugated | BD Biosciences | Cat# 740853; RRID:AB_2740506 |
| anti-Mouse CD44 monoclonal antibody (Rat, IM7), APC conjugated | BD Biosciences | Cat# 559250; RRID:AB_398661 |
| anti-Mouse CD62L monoclonal antibody (Rat, Clone MEL-14), PE conjugated | Thermo Fisher Scientific | Cat# 12-0621-81; RRID:AB_465720 |
| anti-Mouse NK1.1 monoclonal antibody (Rat, Clone PK136), FITC conjugated | BioLegend | Cat# 108706; RRID:AB_313393 |
| anti-Mouse MHC II monoclonal antibody (Rat, Clone M5/114.15.2), FITC conjugated | Thermo Fisher Scientific | Cat# 11-5321-82; RRID:AB_465232 |
| anti-Mouse TCR γ/δ monoclonal antibody (Rat, Clone UC7-13D5), FITC conjugated | BioLegend | Cat# 107504; RRID:AB_313313 |
| anti-Mouse CD11b monoclonal antibody (Rat, Clone M1/70), APC-eFluor 780 conjugated | Thermo Fisher Scientific | Cat# 47-0112-82; RRID:AB_1603193 |
| anti-Mouse Ly-6G/Ly-6C (Gr-1) monoclonal antibody (Rat, Clone RB6-8C5), Alexa Fluor(R) 700 conjugated | BioLegend | Cat# 108422; RRID:AB_2137487 |
| anti-Mouse Ly-6G/Ly-6C monoclonal Antibody (Rat, Clone RB6-8C5), PerCP-Cyanine5.5 conjugated | Thermo Fisher Scientific | Cat# 45-5931-80; RRID:AB_906247 |
| anti-Mouse CD11b Monoclonal Antibody (Rat, Clone M1/70), PE-Cyanine7 conjugated | Thermo Fisher Scientific | Cat# 25-0112-82; RRID:AB_469588 |
| anti-Mouse IL-12/IL-23 p40 Monoclonal Antibody (Rat, Clone C17.8), PE conjugated | eBioscience™ | Cat# 12-7123-82; RRID:AB_466185 |
| anti-Mouse IFNγ monoclonal Antibody (Rat, Clone XMG1.2) unconjugated | Bio X Cell | Cat# BE0055; RRID:AB_1107694 |
| IgG1 isotype control (anti-HRP) monoclonal antibody (Rat, Clone, HRPN) unconjugated | Bio X Cell | Cat# BE0088; RRID:AB_1107775 |
| anti-Mouse CD3e monoclonal antibody (Armenian hamster, 145-2C11) unconjugated | BD Biosciences | Cat# 553057; RRID:AB_394590 |
| anti-Mouse CD28 monoclonal antibody (Syrian hamster, 37.51) unconjugated | BD Biosciences | Cat# 553294; RRID:AB_394763 |
| anti-Mouse CD138 Monoclonal Antibody (Rat, Clone 281-2), PE conjugated | BioLegend | Cat# 142504; RRID:AB_10916119 |
| anti-Mouse IFN gamma Receptor 1 Monoclonal Antibody (Armenian hamster, Clone 2E2), PE conjugated | Thermo Fisher Scientific | Cat# 12-1191-82; RRID:AB_1210730 |
| anti-Human/Mouse IL-12 R beta 2 Monoclonal Antibody (Mouse IgG1, Clone 305719), APC conjugated | R & D Systems | Cat# FAB1959A; RRID: AB_2124049 |
| anti-Mouse STAT1 Monoclonal Antibody (Mouse, Clone A15158B), PE conjugated | BioLegend | Cat# 686404; RRID:AB_2616939 |
| Goat Anti-Mouse IgG, Human ads-UNLB antibody unconjugated | SouthernBiotech | Cat# 1030-01, RRID:AB_2794290 |
| goat anti-Mouse IgG, Human ads-HRP antibody unconjugated | SouthernBiotech | Cat# 1030-05, RRID:AB_2619742 |
| goat anti-Mouse IgG, Human ads-FITC antibody unconjugated | SouthernBiotech | Cat# 1030-02, RRID:AB_2794291 |
| anti-mouse IFN-gamma Monoclonal Antibody (Rat, Clone AN 18), unconjugated | BD Biosciences | Cat# 551309, RRID:AB_394145 |
| anti-mouse IFN-gamma Monoclonal Antibody (Rat, Clone XMG1.2), biotin conjugated | BD Biosciences | Cat# 554410, RRID:AB_395374 |
| Peroxidase-Streptavidin antibody | Jackson ImmunoResearch | Cat# 016-030-084, RRID:AB_2337238 |
| Chemicals, Peptides, and Recombinant Proteins | ||
| Recombinant Mouse IFN-gamma | R & D Systems | Cat# 485-MI-100 |
| Zombie NIR™ Fixable Viability Kit | BioLegend | Cat# 423106 |
| LIVE/DEAD™ Fixable Aqua Dead Cell Stain Kit | Invitrogen | Cat# L34957 |
| Super Bright Complete Staining Buffer | eBioscience | Cat# SB-4401-75 |
| Proteinase K Solution | Invitrogen | Cat# 25530049 |
| ExoSAP-IT™ PCR Product Cleanup Reagent | Applied Biosystems | Cat# 78201.1.ML |
| iTaq™ Universal SYBR® Green Supermix | Bio-Rad | Cat# 1725125 |
| GolgiStop™ | BD Biosciences | Cat# 554724 |
| GolgiPlug™ | BD Biosciences | Cat# 555029 |
| PMA | Sigma-Aldrich | Cat# P1585 |
| Ionomycin calcium salt | Sigma-Aldrich | Cat# I0634 |
| Mouse Erythrocyte Lysing Kit | R & D Systems | Cat# WL2000 |
| Percoll™ | Thermo Fisher Scientific | Cat# 45-001-747 |
| RPMI 1640 | Thermo Fisher Scientific | Cat# MT10040CV |
| DMEM | Gibco™ | Cat# 11-995-065 |
| Penicillin-Streptomycin-Glutamine | Gibco™ | Cat# 10-378-016 |
| L-Tryptophan | Sigma-Aldrich | Cat# T0254 |
| Peptone | Sigma | Cat# 70173 |
| Tryptone | Sigma | Cat# T7293 |
| Sodium chloride | Sigma | Cat# S3014 |
| Indole-3-aldehyde (carboxyaldehyde) | Sigma-Aldrich | Cat# 129445 |
| AHR inhibitor (CH-223191) | Sigma-Aldrich | Cat# C8124 |
| DNase I | Roche | Cat# 10104159001 |
| BBL™ Fluid Thioglycollate | BD Biosciences | Cat# BB21196 |
| BBL™ Brucella Agar with 5% Sheep Blood, Hemin and Vitamin K1 Prepared Media | Midland Scientific | Cat# 297848 |
| Lactobacillus spp. MRS Broth | BD Biosciences | Cat# DF0881-17-5 |
| Vancomycin | Sigma-Aldrich | Cat# V2002 |
| Kanamycin | Sigma-Aldrich | Cat# 60615 |
| Metronidazole | Sigma-Aldrich | Cat# M3761 |
| Colistin | Sigma-Aldrich | Cat# C4461 |
| Gentamycin | Sigma-Aldrich | Cat# G1914 |
| ALT /GPT Reagent; Infinity | Fisher Scientific | Cat# TR71121 |
| Normocin | InvivoGen | ant-nr-1 |
| Zeocin | InvivoGen | ant-zn-05 |
| QUANTI-Luc™ | InvivoGen | rep-qlc1 |
| Recombinant Mouse IL-12 (p70) | BioLegend | Cat#577002 |
| Concanavalin A | Sigma-Aldrich | Cat# C5275 |
| Carbon tetrachloride | Sigma-Aldrich | Cat# 319961 |
| Critical Commercial Assays | ||
| FoxP3 Transcription Factor Staining Kit | eBioscience | Cat# 00-5523-00 |
| Cytofix/Cytoperm™ Fixation/Permeablization Kit | BD Biosciences | Cat# 554714 |
| In Situ Cell Death Detection Kit, TMR red | Sigma-Aldrich | Cat# 12156792910 |
| EasySep™ Mouse Naïve CD8+ T Cell Isolation Kit | STEMCELL Technologies | Cat# 19858 |
| EasySep™ Mouse Naïve CD4+ T Cell Isolation Kit | STEMCELL Technologies | Cat# 19765 |
| Mouse Anti-nuclear antibody (ANA) ELISA Kit | MyBioSource | Cat# MBS261480 |
| TMB Substrate Kit | Thermo Fisher Scientific | Cat# 34021 |
| iScript™ cDNA Synthesis Kit | Bio-Rad | Cat# #1708891BUN |
| SuperScript™ VILO™ cDNA Synthesis Kit | Invitrogen | Cat# 11754050 |
| RNeasy Plus Mini Kit | Qiagen | Cat# 74136 |
| DNA Microbiome Kit | Qiagen | Cat# 51704 |
| RNeasy Plus Micro Kit | Qiagen | Cat# 74034 |
| QIAamp Fast DNA Stool Mini Kit | Qiagen | Cat# 51604 |
| Phosflow Lyse/Fix Buffer | BD Biosciences | Cat# 558049 |
| True-Phos™ Perm Buffer | BioLegend | Cat#425401 |
| Mouse Liver Kidney Microsome Autoantibody (Anti-LKM) ELISA Kit | MyBioSource | Cat# MBS3807100 |
| Mouse soluble liverantigen antibody (SLA) ELISA Kit | MyBioSource | Cat# MBS266348 |
| Kallestad HEp-2 Slides | Bio-Rad | Cat# 26103 |
| Invitrogen™ Fluoromount-G™ Mounting Medium | Fisher Scientific | Cat# 00-4958-02 |
| Deposited Data | ||
| Raw and analyzed 16S rRNA-Seq data | This paper | NCBI Sequence Read Archive, SRA: PRJNA830441 |
| Raw and analyzed hepatic RNA-seq data | This paper | NCBI: GSE201459 |
| Experimental Models: Organisms/Strains | ||
| Mouse: B6.Tet2−/− | Meisel et al. (2018) | N/A |
| Mouse: B6. Tet2f (B6;129S-Tet2tm1.1Iaai/J) | Meisel et al. (2018) | N/A |
| Mouse: B6. Vav-cre line (B6.Cg-Tg(Vav1-icre)A2Kio/J) | Jackson Laboratory | Stock No: 008610 |
| Mouse: B6. LysM-cre line (Lyz2tm1(cre)Ifo)) | Jackson Laboratory | Stock No: 004781 |
| Mouse: B6. Tg(CD2-cre)1Lov/J | Jackson Laboratory | Stock No: 027406 |
| Mouse: B6. Albumin-cre (B6.Cg-Speer6-ps1Tg(Alb-cre)21Mgn/J) | Jackson Laboratory | Stock no.: 003574 |
| Mouse: B6. Ifng−/− (B6.129S7-Ifngtm1Ts/J) | Jackson Laboratory | Stock no.: 002287 |
| CD8α-Cre (C57BL/6-Tg(Cd8a-cre)1Itan/J) | Jackson Laboratory | Stock no.: 008766 |
| Mouse: B6. Rag−/− | Provided by M. Shlomchik | N/A |
| Germ free B6. Tet2−/− and B6.Tet2+/+ | Meisel et al. (2018) | N/A |
| L. reuteri | ATCC | Cat# BAA-2837 |
| L. johnsonii | ATCC | Cat# BAA-3147 |
| ΔArAT L. reuteri | Dr. Cervantes-Barragan | N/A |
| AhR reporter cell line | Invivogen | Cat# ht2l-ahr |
| Blautia producta | ATCC | 27340D-5 |
| Oligonucleotides | ||
| (mouse) see Table S8 | ||
| Software and Algorithms | ||
| GraphPad Prism 9 | GraphPad Software | N/A |
| FlowJo 10.7.1 | Tree Star | https://www.flowjo.com/solutions/flowjo/downloads |
| ImageJ | Open source | https://imagej.nih.gov/ij/index.html |
| BioRender | BioRender Company | N/A |
RNA processing and RT-PCR
A piece of the left liver lobe (~3x3mm) was incubated in RNAlater™ (Qiagen) at 4 °C for 48 h and stored at −80 °C until further analysis. For RNA extraction a Tissue-Tearor Homogenizer (Biospec) was used. RNA was extracted using the RNeasy Mini Kit (Qiagen). cDNA synthesis was performed using iScript™ cDNA Synthesis Kit (Bio-Rad) according to manufacturer’s instructions. Expression analysis was performed in duplicate via real-time PCR on a BioRad CFX384 Touch™ Real-Time PCR Detection System using iTaq™ Universal SYBR (Bio-Rad). Expression levels were quantified and normalized to Gapdh expression.
RNA-sequencing processing and data analysis
RNA of liver tissue was extracted (see above for details). RNA-seq libraries were sequenced with single-end 50bp reads on an Illumina HiSeq4000. Single end Illumina reads were checked for quality using FastQC (v0.11.5) and they were trimmed for quality and adapters using Cutadapt (v1.12). These quality trimmed reads were later mapped against the Ensembl Mus Musculus reference transcriptome (GRCm38) using Salmon mapper (v0.9.1). edgeR (v3.24.1), a bioconductor R (v3.8) package, was used to analyze differentially expressed genes (DEG).
We considered a gene as differentially expressed (DEG) if statistically supported at a Q-value false discovery rate (FDR) < 0.1 and a ∣ log2(fold change)∣ > 0.5. The top 2000 DEGs with FDR < 0.05 and an absolute value of log2(Fold change) > 1 were uploaded to Cytoscape (v3.7.0) and to the Ingenuity pathway analysis platform (IPA). Analysis was performed by using IPA tools 7.0. Using the ClueGO (v2.5.3) (Backes et al., 2007) app extension, a visual representation of GO terms was created. The size of the nodes shows the enrichment significance after Bonferroni correction statistical analysis. Analysis was done using the following parameters: FDR < 0.01; terms > 10 genes; kappa 0.4, (see Table S4 for list of GO terms). Heat maps were made from select GO terms using the R package gplots (v3.0.1) or IPA (see Table S3 for list of GO terms). Venn Diagram was made from DEG list using the R package VennDiagram (1.6.20) (see Table S1 for list of genes displayed in Venn diagram and Table S2 for entire list of DEGs of RNA-seq analysis). For CD8 T cell RNA-sequencing libraries were prepared using the Illumina TruSeq protocol and sequenced with paired-end 75 bp reads on an Illumina HiSeq. FASTQ sequences with Phred scores less than 20 were trimmed from 3 prime end and reads smaller than 25 bp were removed. The remaining clean reads were aligned to the mm10 protein-coding reference library from Ensembl using STAR. Noise reduction filter was applied to quantified transcript counts to exclude features with maximum counts less than 10 and FPKMs were generated (see Table S7).
Measurement of intra-cellular staining pattern of plasma anti-nuclear antibodies
HEp-2 immunofluorescence assay (measures reactivity to plasma ANA) and HEp-2 -scoring were performed as previously described (Tilstra et al., 2020). Briefly, 1:50 PBS-diluted mouse plasma samples were incubated on HEp-2 cell slides according to manufacturer’s instructions (Bio-rad). After washing in PBS, cells were incubated with fluorescein isothiocyanate–conjugated goat anti-mouse IgG and mounted with Fluoromount-G. Images were captured on a fluorescent microscopy (Olympus, IX83) and processed in Adobe Photoshop. Slides (blinded) were imaged at 20x and scored 0 – 3 for intensity of Kallestad HEp-2 staining as either nuclear homogenous, nuclear speckled, or cytoplasmic staining patterns. Representative images were captured at 20x and with a constant exposure time of 250 ms.
ALT measurement in blood plasma
Plasma samples and controls were mixed with Infinity ALT reagent according to manufacturer’s instructions, and the absorptions read at 340 nm on a SuperMax i3 plate reader every 28 seconds for 10 min with a 1-minute initial lag time. ALT activity was determined by the slope of NADH degradation in a coupled enzyme reaction, using Softmax Pro 6.3 analytical software.
Total IgG ELISA
High-binding ELISA 96-well plates (Fisher Scientific) were coated with anti-mouse IgG (SouthernBiotech) in PBS overnight at 4 °C. Plates were washed three times with ELISA wash buffer (1x PBS and 0.05% Tween 20) and blocked with blocking buffer (2% FBS in wash buffer) for 2 h at room temperature. Plasma samples were diluted 1:50,0000 in PBS and the plates were incubated overnight at 4 °C. Anti-mouse IgG-horseradish peroxidase (HRP) (SouthernBiotech) in blocking buffer was added to plates and incubated for 1 h at room temperature. Plates were washed five times with wash buffer. HRP substrate TMB was added, and the reaction stopped by the addition of 2 N H2SO4. Absorbance was read at 450 nm. Levels of total IgG were expressed in OD values.
In vivo anti-IFNγ Ab treatment
PB of >20-wk-old Tet2ΔVAV mice and littermate controls were analyzed for myelo-expansion by flow cytometry prior to treatment. Tet2ΔVAV mice with myelo-expansion (frequency of CD11b+ Gr1+ >16% PB [Meisel et al., 2018]; see Figure S3B) and littermate controls were subjected to weekly intraperitoneal injections of 1 mg anti-IFNγ (XMG1.2, Bio X Cell) or IgG1 isotype control (HRPN, Bio X Cell), for a total period of three weeks. In vivo IFNγ depletion was confirmed by efficient suppression of plasma IFNγ levels in Tet2ΔVAV mice (data not shown).
Bacterial colony identification
Bacterial colonies were identified as described in Meisel et al. (2018). In brief, grown colonies were picked with sterile pipette tips and stored at −80 °C until analysis. At day of analysis, picked bacterial colonies were thawed at room temperature (RT), resuspended with 20 μL of sterile water and lysed at 95 °C for 10 min. Samples were subsequently cooled down to 4 °C and then the DNA (2 μl) was used as template DNA in PCR reactions amplifying the 16S rRNA gene using universal bacterial 16S rRNA primers (27F, 5′-AGAGTTTGATCMTGGCTCAG-3′ and 1525R, 5′-AAGGAGGTGATCCAGCC-3′) with reaction conditions: 95 °C for 5 min followed by 35 cycles of 95 °C for 30 sec, 55 °C for 30 sec, 72 °C for 2 min and then 72 °C for 20 min. The amplification product (8 μl) was incubated with 2 μl ExoSAP-IT™ (ThermoFisher) for 37 °C for 15 min, followed by 80 °C for 15 min. As recently described (Meisel et al., 2018), amplicons were sequenced by capillary sequencing, and the resulting sequences were analyzed using BLASTN and the 16S ribosomal RNA sequences NCBI database for species identification.
Oral gavage of Lactobacillus spp. to test for ability to induce AIH-like pathology
L. spp. were grown in MRS broth for 12-15 h. Bacteria were harvested by centrifugation (5000 x g for 10 min), washed and resuspended in PBS at a density of 5x10⁹ CFU/mL (CFU was quantified by plating dilutions on MRS agar). Naïve SPF mice were gavaged with 109 CFU of L. spp. in 200μl PBS. To assess impact of L. spp. on hepatic type 1 T cell effector function, as well as PB plasma levels of ANA, SPF mice were, similar to Meisel et al. (2018), pre-treated with broad-spectrum antibiotics for 10 days (100μl oral gavage), followed by oral gavage with 109 CFU four times (day 0, 1, 4 and 5). End point analysis (EPA) was performed on day 6. To define the impact of L. reuteri on hepatocyte damage (ALT in plasma), mice were treated for an additional week. In Figures 7A-7C and 7I-7K mice were pre-treated with broad-spectrum antibiotics for 10 days (100μl oral gavage) as previously described (Meisel et al., 2018), followed by oral gavage with 109 CFU with L. reuteri or ΔArAT L. reuteri up to 5 wk (five days in a week). PB plasma ANA and ALT level were determined on day 0 (before L. reuteri gavage) and EPA on day 35.
Assessment of bacterial translocation efficiency and ability to produce AhR ligands
L. reuteri: 6-8-wk-old SPF Tet2−/− and Tet2+/+ mice were orally gavaged (200μl) with 109 CFU L. reuteri for 6 consecutive days. EPA was performed 24 h after final oral gavage, where livers were aseptically removed, weighed, and homogenized by mashing through a 100 μm cell strainer in 3 mL sterile water containing 0.05% NP-40. Bacterial expansion was performed under anaerobic conditions at 37 °C as follows. After 1 h incubation, 3 mL MRS broth was added to each sample followed by an additional 23 h of incubation, after which, 500 μL of each sample was expanded in 5 mL MRS broth. Following an incubation of 24 h, the expansion and subsequent serial dilutions were plated on MRS agar and plates were incubated for 24 h. Single colonies were selected for 16s sequencing to confirm translocation of L. reuteri.
AhR activity measurement in translocated bacteria in the liver
For assessments of AhR activity, MRS broth-expanded cultures were pelleted at 5000 x g for 10 min, resuspended in Peptone Tryptone Tryptophan (PTT) media, and cultured anaerobically at 37 °C, shaking at 250 rpm, for 14 h. Bacteria were again pelleted and supernatant was collected and measured for AhR activity.
AhR activity measurement in liver homogenate
Pieces of liver (~75 mg) from the left lobe were removed and mashed through 100 μm cell strainers in PBS, followed by centrifugation at 1800 rpm for 5 min to pellet cells. Supernatant was collected and measured for AhR activity.
AhR activity assay
HT29-Lucia™ AhR cells were purchased from InvivoGen (ht2l-ahr). Cells were cultured in DMEM (Gibco) supplemented with 10% FBS, 1x Penicillin-Streptomycin-Glutamine (Gibco), 100 ug/mL Normocin (InvivoGen), and 100 ug/mL selective antibiotic Zeocin (InvivoGen). Briefly, 20 μL of sample was incubated with ~50,000 HT29-Lucia™ AhR Cells for 24 h. Following incubation, 20 uL of supernatant was transferred into a 96-Well Clear Bottom Black Microplate (Corning) and 50uL QUANTI-Luc™ (InvivoGen) was added. Samples were immediately read for luminescence via a SpectraMax® i3x using SoftMax Pro 3.0.7 Software under the following settings: read type endpoint at all wavelengths, integration time 100ms, read height 2mm.
AhR agonist containing supernatant
Similar to previously described (Cervantes-Barragan et al., 2017), to generate AhR agonist-containing supernatants, L. reuteri or ΔArAT L. reuteri were grown in MRS broth overnight, harvested by centrifugation, washed with PBS and ~1x10¹⁰ CFU were inoculated into 10 mL of peptone-tryptone water (10 g/L peptone and 10 g/L tryptone, 5 g/L NaCl) supplemented with 0.6 mM L-tryptophan. After a 14 h incubation at 37 °C under anaerobic conditions, cells were centrifuged (5000 x g, 10 min), supernatant collected and filter sterilized (0.2-μm pore diameter cellulose acetate filter (VWR)) and stored at −80 °C until further use. For in vitro experiments, supernatants were added to cells at a final concentration of 10% vol/vol in culture media (Cervantes-Barragan et al., 2017).
DNA extraction from liver tissue and intestinal contents
Microbial DNA was extracted from a piece of the left liver lobe (~30mg), harvested under sterile conditions, using the Microbiome Kit (Qiagen). The Fast DNA Stool Mini Kit (Qiagen) was used to extract total DNA from intestinal contents and intestinal scrapings. Quantitative PCR (qPCR) of 16S rRNA-encoding gene was performed as recently described (Meisel et al., 2017). Briefly, qPCR was performed on a BioRad CFX384 (BioRad) using the primers (340F, 5’-ACTCCTACGGGAGGCAGCAGT-3’) and (514R, 5’-ATTACCGCGGCTGCTGGC-3’). Reactions were run at 95 °C for 3 min, followed by 40 cycles of 95 °C for 15 min and 63 °C for 60 sec. Specific amplification of targets was quantified using dilution curves of a purified pCR4-TOPO vector (Invitrogen) containing a cloned 16S rRNA-encoding gene from Blautia producta (Prevot) (ATCC®, 27340D-5™) as a standard (Huse et al., 2014) for liver and intestinal contents. Standards ranging in concentration from 108 – 100 plasmid copies/μl were run in parallel with our samples during each qPCR run. Using those results, a standard curve was generated to quantify the number of copy numbers within the samples. To determine the bacterial load in the intestinal content/scraping samples, the results were normalized to their corresponding weight. Bacterial 16S rRNA gene RT-PCR from livers was normalized to the host murine Infb1 gene (forward: 5’-CCATCCAAGAGATGCTCCAG-3’; reverse 5’- GTGGAGAGCAGTTGAGGACA-3’).
16S rRNA amplicon library preparation, sequencing and data analysis
16S rRNA amplicon library preparation and sequencing of microbial hepatic DNA, intestinal luminal DNA, and fecal DNA (see above for extraction techniques) was performed as previously described (Meisel et al., 2017). Generated libraries underwent V3-V4 16S amplicon sequencing using the NextGen Illumina MiSeq platform (University of Pittsburgh Genomics Research Core). Raw sequencing data were processed in QIIME™ 1.9.1 (Caporaso et al., 2010b). Sequences were demultiplexed, denoised, and clustered into operational taxonomic units (OTUs) and aligned via PyNAST (Caporaso et al., 2010a). Taxonomy was assigned using the RDP Classifier (Wang et al., 2007) using GreenGenes (v13.8). Processed data were then imported into Calypso 8.84 for data analysis and visualization (Zakrzewski et al., 2017). Samples were rarified to a depth of 5000 reads per sample. For liver, samples were analyzed with and without inclusion of g_Burholderia, where the latter were rarified to a depth of 500 due to the dominance of this excluded taxa in tissue samples. To assess alpha diversity, the Shannon, Simpson’s and Richness diversity indices were calculated and significant differences were identified using ANOVA. Beta diversity were assessed using principal coordinates analysis (PCoA) plots of Bray-Curtis dissimilarity distances and Redundancy analysis (RDA) (Anderson, 2006). Statistical significance of beta diversity clustering was assessed using permutational multivariate analysis of variance (PERMANOVA) with 999 permutations followed by permutational analysis of multivariate dispersions (PERMDISP2) to assess the homogeneity of group variance (distance to centroid). Phylogenetic investigation of communities by reconstruction of unobserved states (PICRUSt) (Langille et al., 2013), a technique which uses evolutionary modeling, was used to predict metagenomes from 16S data and reference genome databases (Kanehisa and Goto, 2000). Heatmaps were generated using Spearman’s rank correlation coefficient with dendrograms illustrating relatedness of sample groups and taxa abundance.
In vitro naïve CD4 and CD8 T cell stimulation with L. reuteri-derived AhR ligand
Naïve CD8 or CD4 T cells were purified with respective purification kits (Stem cell Technologies). Purity test by flow cytometry revealed 95%–98% enriched TCRβ+ CD44− CD62L+ cells (data not shown). 5x10⁵ naïve CD4 or CD8 T cells were stimulated with plate coated anti-CD3 and soluble anti-CD28 (each 1 μg/mL) in the presence of 10% L. reuteri- or 10% ΔArAT L. reuteri-supernatant with or without 30 μM AhR antagonist (CH-223191, Sigma-Aldrich). Amount of produced IFNγ was assessed after 72 h by ELISA.
Enzyme-linked immunosorbent assay to measure IFNγ
In vitro T cell supernatants were used to measure IFNγ according to manufacturer’s instructions. Briefly, ELISA plates were coated overnight at 4 °C with 0.5 μg/ml IFNγ (BD Biosciences). Plates were washed once (0.05% Tween 20 in PBS) and blocked for 1 h with blocking buffer (5% FBS in PBS). Standards and samples were incubated overnight at 4 °C. Plates were washed and incubated with biotin-conjugated IFNγ detection Ab (0.5 μg/ml, BD Biosciences) for 1 h at RT. Plates were then washed and incubated with Horseradish Peroxidase-conjugated streptavidin (Jackson ImmunoResearch) for 15 min followed by washing and development with TMB substrate (Thermo Fisher Scientific). Reactions were stopped by the addition of 2N H2SO4, and absorbance was measured at 450 nm on a SpectraMax i3 plate reader (Molecular Devices). IFNγ concentration in supernatants was determined from a standard curve generated by serial dilution of IFNγ.
Measurement of plasma ANA, LKM1 and SLA
For ANA and SLA, plasma samples were diluted 1:10 and for LKM1 1:5 in sample diluent. Plasma anti-nuclear Abs (ANA), soluble liver antigen Abs (SLA), and liver kidney microsome Abs (LKM1) levels were determined by using the mouse specific Anti-nuclear antibody (ANA), soluble liver antigen antibody (SLA) and, liver kidney microsome autoantibody (Anti-LKM) ELISA Kit (MyBioSource) according to manufacturer’s instructions. Absorbance was measured at 450nm on a SpectraMax i3 plate reader (Molecular Devices). ANA, SLA, and LKM1 concentrations in plasma were determined from a standard curve generated by serial dilution of ANA, SLA, and LKM1.
Hematoxylin/eosin and Trichrome staining
A piece of the left liver lobe (5 x 5 mm) was fixed in 10% formalin for 24 h at RT, transferred to 70% ethanol, and processed for embedding in paraffin. Hematoxylin and eosin (H&E) and trichrome staining was performed on 4 μm paraffin-embedded liver sections. Staining was performed by the Clinical Biospecimen Repository and Processing Core (Pittsburgh Liver Research Center). The slides were imaged by LAS V4- Leica microscope. Fibrotic area was quantified using ImageJ Software by averaging the percent of quantified fibrotic area/ field of view (FOV) of >3 FOV/liver.
Histological grading for key AIH features
Using hematoxylin and eosin-stained slides, liver histological features that are either compatible with AIH or typical of AIH, such as interface hepatitis, lymphoplasmacytic infiltrate, rosette formation, and emperipolesis were scored in a blinded fashion by a gastrointestinal and hepatopancreatobiliary trained pathologist (ADS) on a scale from 0 to 3. Score: 0, negative; 1, mild; 1.5, mild-moderate: 2; moderate; 3, marked. Each dot represents an individual mouse.
TUNEL staining
Liver (left lobe) tissue was fixed in 10% formalin and processed for paraffin sectioning. 4 μm sections were dewaxed by immersion in xylene and hydrated by serial immersion in ethanol and PBS. Antigen retrieval was performed by incubating sections in Proteinase K (1 μg/ml, Invitrogen) at 37 °C for 30 min. Sections were washed with PBS (4x for 2 min) and blocking buffer (0.1M Tris-HCl containing 3% BSA and 20% normal bovine serum) was added for 30 min. TUNEL reaction mixture was added to liver sections according to the manufacturer’s instructions (Roche Applied Science). Sections were stained with DAPI (1 μg/ml, Invitrogen) and mounted with Fluoromount-G (Beckman Coulter). At least three images were taken randomly from each section by fluorescent microscopy (Olympus, IX83). 3-4 FOV were randomly selected from each section, 100 DAPI+ cells were counted for each FOV and double positive (DAPI+ fluorescent red nuclei) were considered TUNEL+ cells. Data are shown as the number of TUNEL+ cells per FOV.
In vivo AhR antagonist treatment
Test for requirement of AhR signaling in L. reuteri-induced AIH-like pathology: 6-wk-old Tet2ΔVAV mice and Tet2 cre− littermate controls were used and treated with 10*9 CFU (OG, oral gavage) along with either vehicle (corn oil) or AhR antagonist (CH223191; 300 μg/mouse) via intraperitoneal (i.p.) injection for 5 wk (five days in a week), and end point analysis (EPA) performed on day 35. Test for requirement of AhR signaling in AIH-like diseased Tet2ΔVAV mice: > 20-wk-old AIH-like diseased Tet2ΔVAV mice were treated with i.p. injections of AhR antagonist (CH-223191, Sigma-Aldrich) or vehicle control (corn oil) for 5 wk (five days in a week) and EPA performed on day 35.
Carbon tetrachloride and Concanavalin A treatment
6-wk-old Tet2ΔVAV and Tet2 cre- mice were treated twice per week for 6 weeks with CCl4 (0.5ml CCl4/kg body weight) or vehicle (corn oil) via intraperitoneal injection (Scholten et al., 2015). To assess impact of ConA-treatment on liver injury and fibrosis, 6-wk-old Tet2ΔVAV and Tet2 cre- mice were treated once with ConA (5 mg/kg body weight) or vehicle (PBS) iv (retroorbital injection) and analyzed after 42 h of administration.
In vitro naïve CD8 T cell stimulation for RNA-seq analysis
Naïve CD8 T cells were purified by a naïve CD8 purification Kit (Stem cell Technologies) and TCRβ+ NK1.1− TCRγδ− MHCII− CD44− CD62L+ cells were further enriched by FACS sorting. 3x10⁵ T cells were added per well and stimulated with plate bound anti-CD3 and soluble anti-CD28 (each 1μg/ml). Cells were treated with vehicle (DMSO), 1μM I3A (Sigma-Aldrich) with or without 30μM AhR antagonist (CH-223191, Sigma-Aldrich). Cells were lysed for RNA sequencing analysis after 8 h.
Sample preparation for quantitative LC-HRMS
Metabolic quenching and polar metabolite pool extraction was performed by adding 360 μL ice cold methanol containing 10 μM 13C1-creatine (Sigma-Aldrich, Boston MA) to 90 μL sample. After 3 min of vortexing, the supernatant was cleared of protein by centrifugation at 16,000 x g. 450 μL cleared supernatant was dried to completion under nitrogen gas and resuspended in 90 μL water. 2 μL of resuspended sample was subjected to online LC-MS analysis. Molar quantities were calculated using a calibration curve using indole-3-aldehyde (I3A, Sigma-Aldrich) in a 1:3 series dilution from 25 μM to 11 nM.
LC-HRMS Analysis
Briefly, samples were injected via a Thermo Vanquish UHPLC and separated over a reversed phase Phenomenex Kinetix C18 column (2.1 × 150mm, 1.7 μm particle size) maintained at 55 °C. For the 10 min LC gradient, the mobile phase consisted of the following: solvent A (water/5 mM ammonium formate/0.1% formic acid) and solvent B (methanol/0.1% formic acid). The gradient was the following: 0 - 0.3 min 3% B, increase to 30 % B over 0.5 min, continue increasing to 60% B over 1 min, hold at 60 % B for 1.3 min, increase to 95% B over 0.5 min, hold at 95% B for 1.4 min, equilibrate at 3% B for 4.5 min. The Thermo ID-X tribrid mass spectrometer was operated in positive ion mode, scanning in ddMS2 mode (2 μscans)from 70 to 800 m/z at 120,000 resolution with an AGC target of 2e5 for full scan, 2e4 for MS2 scans using HCD fragmentation at stepped 15,35,50 collision energies. Source ionization setting was 3.0 kV spray voltage for positive mode. Source gas parameters were 35 sheath gas, 12 auxiliary gas at 320 °C, and 8 sweep gas. Calibration was performed prior to analysis using the PierceTM FlexMix Ion Calibration Solutions (Thermo Fisher Scientific). Integrated peak areas were then extracted manually using Quan Browser (Thermo Fisher Xcalibur ver. 2.7). I3A was quantified using the calibration curve created with the I3A standard and 13C-1-creatine internal standard.
In vitro naïve CD8 T cell stimulation with mouse recombinant IL-12
Naïve CD8 cells were purified with a naïve CD8 purification Kit (Stem cell Technologies). Purity test by flow cytometry revealed 95%–98% enriched TCRb+ CD44− CD62L+ cells (data not shown). 5x10⁵ naïve CD8T cells were stimulated with different concentrations of plate coated anti-CD3 (BD Biosciences; 5 μg/ml) and soluble anti-CD28 (BD Biosciences; 2 μg/ml) respectively, with different doses of recombinant IL-12 (BioLegend; 0.1, 1.0 and, 10 ng/ml). Amount of produced IFNγ was assessed after 72 h by ELISA.
Assessment of STAT1 phosphorylation and IFNγR1 expression in CD8 T cells
Naïve CD8 T cells were purified by a naïve CD8 purification Kit (Stem cell Technologies). 106 naïve CD8 T cells were added per well into a 96-well flat-bottom plate and stimulated with plate bound anti-CD3 and soluble anti-CD28 (each 1 μg/ml) for 8 h. Cells were either treated with mouse recombinant IFNγ, 0.2 μg/ml (R & D Systems) for 40 min or left untreated. Fixable live/dead viability stain (Invitrogen) was added 10 min prior to fixation. Cells were fixed with BD Phosflow Lyse/Fix Buffer (BD Biosciences) and subsequently incubated for 15 min at 37 °C in a water bath. Next, samples were permeabilized with ice-cold pre-chilled True-Phos™ Perm Buffer (BioLegend) and incubated at −20 °C for 1 h. After washing, cells were incubated with Abs for CD45, CD4, CD8, TCRβ and anti-phospho-STAT1 (BioLegend) in FACS buffer for 30 min at RT. After washing twice, samples were acquired on an Aurora (Cytek) flow cytometer and analyzed with FlowJo 10 (Tree Star). To determine the surface expression of IFNγR1 on splenic CD8 T cells, naïve CD8 T cells were stimulated with anti-CD3 and anti-CD28 (both 1 μg/ml) for 48h followed by flow cytometry analysis for surface IFNγR1 expression (Figure S6G).
Statistical analysis
The majority of experiments were repeated at least two times to obtain data for indicated statistical analyses. Mice were allocated to experimental groups on the basis of their genotype and randomized within the given sex- and age-matched group. Given that our mice were inbred and matched for age and sex, we assumed similar variance between the different experimental groups. We did not perform a priori sample size estimation but always used as many mice per group as possible in an attempt to minimize type I and type II errors. Investigators were not blinded during experiments and outcome assessment, except for microscopic analysis of fluorescent immunostaining and HEp-2 ANA intensity analysis, which has been performed blinded. All experimental and control animals were littermates and none were excluded from the analysis at the time of harvest. All quantitative data are presented as mean ± standard error of the mean (sem), unless otherwise indicated. Data were analyzed using an unpaired two-tailed Student’s t-test for single comparisons, and one-way or 2-way ANOVA for multiple comparisons. ANOVA analysis was followed by a Sidak’s post-hoc test. Correlations were calculated using the Pearson correlation. Figures and statistical analysis were generated using GraphPad Prism 9 (GraphPad Software). The statistical test used, and P values are indicated in each figure legend. P values of < 0.05 were considered statistically significant. *P < 0.05, **P <0.01, ***P <0.001 and ****P <0.0001.
Supplementary Material
Highlights.
Lack of hematopoietic Tet2 drives microbiota- and IFNγ-dependent AIH-like disease in mice
AIH-like pathology associates with hepatic AhR agonist-producing pathobiont expansion
Liver translocated L. reuteri releases I3A driving AIH-like disease
Tet2 within CD8 T cells antagonizes I3A-induced AIH-like pathology
ACKNOWLEDGMENTS
We thank the Unified Flow Core at the Department of Immunology, the University of Pittsburgh for flow cytometry resources and sorting. We thank the Clinical Biospecimen Repository and Processing Core at the University of Pittsburgh Liver Research Center for histology work. We thank the Genomics Research Core at the University of Pittsburgh for liver RNA-seq and 16S seq. We thank the Gnotobiotic Core Facility at the University of Pittsburgh for their service. We thank the Metabolomics and Lipidomics Core at the University of Pittsburgh for their service. Model figures were created with BioRender. We thank the Microbiology and Immunology Diversity (MID) Scholar program. This work was supported by an Investigator Start-up Fund, Department of Immunology, University of Pittsburgh School of Medicine to M.M. and R.H.; NIH/NIDDK R01 DK130897, Liver Research Pilot Award (NIH/NIDDK P30 DK120531), Hillman Developmental Pilot Award (NIH/NCI P30 CA047904), NIH/NCI R21CA259636, and Pittsburgh PACER Award to M.M.; NIH R21AI163721 grant and Hillman Developmental Pilot Award (NIH/NCI P30 CA047904) to R.H.; R01 CA253329 and an R21 AI163503 to J.F.P.; 5K08AR075056-02 grant for J.S.T. Canada Research Chair, CIHR project grant 168840 and GIA from Crohn’s Colitis Canada to E.F.V.; R01 AA021978 and P30 DK120531 to G.E.A.; NIHS10OD023402 grant to S.G.W. and P30 DK120531 to A.D.S. This work was partially supported by funding to the Genomics Analysis Core from the University of Pittsburgh Office of the Senior Vice Chancellor, Health Sciences to U.R.C.
INCLUSION AND DIVERSITY
We worked to ensure sex balance in the selection of nonhuman subjects. One or more of the authors of this paper self-identifies as an underrepresented ethnic minority in science. One or more of the authors of this paper self-identifies as a member of the LGBTQ+ community. One or more of the authors of this paper received support from a program designed to increase minority representation in science.
Footnotes
SUPPLEMENTAL INFORMATION
Supplemental information can be found online at https://doi.org/10.1016/j.chom.2022.05.006.
DECLARATION OF INTERESTS
The authors declare no competing interests.
REFERENCES
- Abdel-Wahab O, and Levine RL (2013). Mutations in epigenetic modifiers in the pathogenesis and therapy of acute myeloid leukemia. Blood 121, 3563–3572. 10.1182/blood-2013-01-451781. [DOI] [PMC free article] [PubMed] [Google Scholar]
- Anderson MJ (2006). Distance-based tests for homogeneity of multivariate dispersions. Biometrics 62, 245–253. 10.1111/j.1541-0420.2005.00440.x. [DOI] [PubMed] [Google Scholar]
- Assis DN (2020). Immunopathogenesis of Autoimmune Hepatitis. Clin. Liver Dis. (Hoboken) 15, 129–132. 10.1002/cld.873. [DOI] [PMC free article] [PubMed] [Google Scholar]
- Backes C, Keller A, Kuentzer J, Kneissl B, Comtesse N, Elnakady YA, Müller R, Meese E, and Lenhof HP (2007). GeneTrail-advanced gene set enrichment analysis. Nucleic Acids Res. 35, W186–W192. 10.1093/nar/gkm323. [DOI] [PMC free article] [PubMed] [Google Scholar]
- Barraco D, Mudireddy M, Shah S, Hanson CA, Ketterling RP, Gangat N, Pardanani A, and Tefferi A (2017). Liver function test abnormalities and their clinical relevance in primary myelofibrosis. Blood Cancer J. 7, e557. 10.1038/bcj.2017.34. [DOI] [PMC free article] [PubMed] [Google Scholar]
- Bataller R, and Brenner DA (2005). Liver fibrosis. J. Clin. Invest 115, 209–218. 10.1172/JCI24282. [DOI] [PMC free article] [PubMed] [Google Scholar]
- Bochtler P, Riedl P, Gomez I, Schirmbeck R, and Reimann J (2008). Local accumulation and activation of regulatory Foxp3+ CD4 T(R) cells accompanies the appearance of activated CD8 T cells in the liver. Hepatology 48, 1954–1963. 10.1002/hep.22559. [DOI] [PubMed] [Google Scholar]
- Bovensiepen CS, Schakat M, Sebode M, Zenouzi R, Hartl J, Peiseler M, Li J, Henze L, Woestemeier A, Schramm C, et al. (2019). TNF-producing Th1 cells are selectively expanded in liver infiltrates of patients with autoimmune hepatitis. J. Immunol 203, 3148–3156. 10.4049/jimmunol.1900124. [DOI] [PubMed] [Google Scholar]
- Busque L, Patel JP, Figueroa ME, Vasanthakumar A, Provost S, Hamilou Z, Mollica L, Li J, Viale A, Heguy A, et al. (2012). Recurrent somatic TET2 mutations in normal elderly individuals with clonal hematopoiesis. Nat. Genet 44, 1179–1181. 10.1038/ng.2413. [DOI] [PMC free article] [PubMed] [Google Scholar]
- Caporaso JG, Bittinger K, Bushman FD, DeSantis TZ, Andersen GL, and Knight R (2010a). PyNAST: a flexible tool for aligning sequences to a template alignment. Bioinformatics 26, 266–267. 10.1093/bioinformatics/btp636. [DOI] [PMC free article] [PubMed] [Google Scholar]
- Caporaso JG, Kuczynski J, Stombaugh J, Bittinger K, Bushman FD, Costello EK, Fierer N, Peña AG, Goodrich JK, Gordon JI, et al. (2010b). QIIME allows analysis of high-throughput community sequencing data. Nat. Methods 7, 335–336. 10.1038/nmeth.f.303. [DOI] [PMC free article] [PubMed] [Google Scholar]
- Carty SA, Gohil M, Banks LB, Cotton RM, Johnson ME, Stelekati E, Wells AD, Wherry EJ, Koretzky GA, and Jordan MS (2018). The loss of TET2 promotes CD8(+) T cell memory differentiation. J. Immunol 200, 82–91. 10.4049/jimmunol.1700559. [DOI] [PMC free article] [PubMed] [Google Scholar]
- Castillo-Dela Cruz P, Wanek AG, Kumar P, An X, Elsegeiny W, Horne W, Fitch A, Burr AHP, Gopalakrishna KP, Chen K, et al. (2019). Intestinal IL-17R signaling constrains IL-18-driven liver inflammation by the regulation of microbiome-derived products. Cell Rep. 29, 2270–2283.e7. 10.1016/j.celrep.2019.10.042. [DOI] [PMC free article] [PubMed] [Google Scholar]
- Cervantes-Barragan L, Chai JN, Tianero MD, Di Luccia B, Ahern PP, Merriman J, Cortez VS, Caparon MG, Donia MS, Gilfillan S, et al. (2017). Lactobacillus reuteri induces gut intraepithelial CD4+CD8αα+ T cells. Science 357, 806–810. 10.1126/science.aah5825. [DOI] [PMC free article] [PubMed] [Google Scholar]
- Choi SC, Brown J, Gong M, Ge Y, Zadeh M, Li W, Croker BP, Michailidis G, Garrett TJ, Mohamadzadeh M, et al. (2020). Gut microbiota dysbiosis and altered tryptophan catabolism contribute to autoimmunity in lupus-susceptible mice. Sci. Transl. Med 12, eaax2220. 10.1126/scitranslmed.aax2220. [DOI] [PMC free article] [PubMed] [Google Scholar]
- Christensen SR, Kashgarian M, Alexopoulou L, Flavell RA, Akira S, and Shlomchik MJ (2005). Toll-like receptor 9 controls anti-DNA autoantibody production in murine lupus. J. Exp. Med 202, 321–331. 10.1084/jem.20050338. [DOI] [PMC free article] [PubMed] [Google Scholar]
- Cripps JG, Wang J, Maria A, Blumenthal I, and Gorham JD (2010). Type 1 T helper cells induce the accumulation of myeloid-derived suppressor cells in the inflamed Tgfb1 knockout mouse liver. Hepatology 52, 1350–1359. 10.1002/hep.23841 [DOI] [PMC free article] [PubMed] [Google Scholar]
- Czaja AJ (2019). Examining pathogenic concepts of autoimmune hepatitis for cues to future investigations and interventions. World J. Gastroenterol 25, 6579–6606. 10.3748/wjg.v25.i45.6579. [DOI] [PMC free article] [PubMed] [Google Scholar]
- Czaja AJ, and Donaldson PT (2000). Genetic susceptibilities for immune expression and liver cell injury in autoimmune hepatitis. Immunol. Rev 174, 250–259. 10.1034/j.1600-0528.2002.017401.x. [DOI] [PubMed] [Google Scholar]
- Delhommeau F, Dupont S, Della Valle V, James C, Trannoy S, Massé A, Kosmider O, Le Couedic JP, Robert F, Alberdi A, et al. (2009). Mutation in TET2 in myeloid cancers. N. Engl. J. Med 360, 2289–2301. 10.1056/NEJMoa0810069. [DOI] [PubMed] [Google Scholar]
- Diao W, Jin F, Wang B, Zhang CY, Chen J, Zen K, and Li L (2014). The protective role of myeloid-derived suppressor cells in concanavalin A-induced hepatic injury. Protein Cell 5, 714–724. 10.1007/s13238-014-0069-5. [DOI] [PMC free article] [PubMed] [Google Scholar]
- Eggink HF, Houthoff HJ, Huitema S, Gips CH, and Poppema S (1982). Cellular and humoral immune reactions in chronic active liver disease. I. Lymphocyte subsets in liver biopsies of patients with untreated idiopathic autoimmune hepatitis, chronic active hepatitis B and primary biliary cirrhosis. Clin. Exp. Immunol 50, 17–24. [PMC free article] [PubMed] [Google Scholar]
- Fouts DE, Torralba M, Nelson KE, Brenner DA, and Schnabl B (2012). Bacterial translocation and changes in the intestinal microbiome in mouse models of liver disease. J. Hepatol 56, 1283–1292. 10.1016/j.jhep.2012.01.019. [DOI] [PMC free article] [PubMed] [Google Scholar]
- Fraietta JA, Nobles CL, Sammons MA, Lundh S, Carty SA, Reich TJ, Cogdill AP, Morrissette JJD, DeNizio JE, Reddy S, et al. (2018). Disruption of TET2 promotes the therapeutic efficacy of CD19-targeted T cells. Nature 558, 307–312. 10.1038/s41586-018-0178-z. [DOI] [PMC free article] [PubMed] [Google Scholar]
- Fuster JJ, MacLauchlan S, Zuriaga MA, Polackal MN, Ostriker AC, Chakraborty R, Wu CL, Sano S, Muralidharan S, Rius C, et al. (2017). Clonal hematopoiesis associated with TET2 deficiency accelerates atherosclerosis development in mice. Science 355, 842–847. 10.1126/science.aag1381. [DOI] [PMC free article] [PubMed] [Google Scholar]
- Gorham JD, Lin JT, Sung JL, Rudner LA, and French MA (2001). Genetic regulation of autoimmune disease: BALB/c background TGF-beta 1-deficient mice develop necroinflammatory IFN-gamma-dependent hepatitis. J. Immunol 166, 6413–6422. 10.4049/jimmunol.166.10.6413. [DOI] [PubMed] [Google Scholar]
- Hashimoto E, Lindor KD, Homburger HA, Dickson ER, Czaja AJ, Wiesner RH, and Ludwig J (1993). Immunohistochemical characterization of hepatic lymphocytes in primary biliary cirrhosis in comparison with primary sclerosing cholangitis and autoimmune chronic active hepatitis. Mayo Clin. Proc 68, 1049–1055. 10.1016/S0025-6196(12)60897-0. [DOI] [PubMed] [Google Scholar]
- Hennes EM, Zeniya M, Czaja AJ, Parés A, Dalekos GN, Krawitt EL, Bittencourt PL, Porta G, Boberg KM, Hofer H, et al. (2008). Simplified criteria for the diagnosis of autoimmune hepatitis. Hepatology 48, 169–176. 10.1002/hep.22322. [DOI] [PubMed] [Google Scholar]
- Huse SM, Young VB, Morrison HG, Antonopoulos DA, Kwon J, Dalal S, Arrieta R, Hubert NA, Shen L, Vineis JH, et al. (2014). Comparison of brush and biopsy sampling methods of the ileal pouch for assessment of mucosa-associated microbiota of human subjects. Microbiome 2, 5. 10.1186/2049-2618-2-5. [DOI] [PMC free article] [PubMed] [Google Scholar]
- Ichiki Y, Aoki CA, Bowlus CL, Shimoda S, Ishibashi H, and Gershwin ME (2005). T cell immunity in autoimmune hepatitis. Autoimmun. Rev 4, 315–321. 10.1016/j.autrev.2005.01.005. [DOI] [PubMed] [Google Scholar]
- Ichiyama K, Chen T, Wang X, Yan X, Kim BS, Tanaka S, Ndiaye-Lobry D, Deng Y, Zou Y, Zheng P, et al. (2015). The methylcytosine dioxygenase Tet2 promotes DNA demethylation and activation of cytokine gene expression in T cells. Immunity 42, 613–626. 10.1016/j.immuni.2015.03.005. [DOI] [PMC free article] [PubMed] [Google Scholar]
- Ikeda A, Aoki N, Kido M, Iwamoto S, Nishiura H, Maruoka R, Chiba T, and Watanabe N (2014). Progression of autoimmune hepatitis is mediated by IL-18-producing dendritic cells and hepatic CXCL9 expression in mice. Hepatology 60, 224–236. 10.1002/hep.27087. [DOI] [PubMed] [Google Scholar]
- Kanehisa M, and Goto S (2000). KEGG: kyoto encyclopedia of genes and genomes. Nucleic Acids Res. 28, 27–30. 10.1093/nar/28.1.27. [DOI] [PMC free article] [PubMed] [Google Scholar]
- Kido M, Watanabe N, Okazaki T, Akamatsu T, Tanaka J, Saga K, Nishio A, Honjo T, and Chiba T (2008). Fatal autoimmune hepatitis induced by concurrent loss of naturally arising regulatory T cells and PD-1-mediated signaling. Gastroenterology 135, 1333–1343. 10.1053/j.gastro.2008.06.042. [DOI] [PubMed] [Google Scholar]
- Kosmider O, Gelsi-Boyer V, Ciudad M, Racoeur C, Jooste V, Vey N, Quesnel B, Fenaux P, Bastie JN, Beyne-Rauzy O, et al. (2009). TET2 gene mutation is a frequent and adverse event in chronic myelomonocytic leukemia. Haematologica 94, 1676–1681. 10.3324/haematol.2009.011205. [DOI] [PMC free article] [PubMed] [Google Scholar]
- Krawitt EL (2006). Autoimmune hepatitis. N. Engl. J. Med 354, 54–66. 10.1056/NEJMra050408. [DOI] [PubMed] [Google Scholar]
- Küsters S, Gantner F, Künstle G, and Tiegs G (1996). Interferon gamma plays a critical role in T cell-dependent liver injury in mice initiated by concanavalin A. Gastroenterology 111, 462–471. 10.1053/gast.1996.v111.pm8690213. [DOI] [PubMed] [Google Scholar]
- Lamas B, Natividad JM, and Sokol H (2018). Aryl hydrocarbon receptor and intestinal immunity. Mucosal Immunol. 11, 1024–1038. 10.1038/s41385-018-0019-2. [DOI] [PubMed] [Google Scholar]
- Langille MG, Zaneveld J, Caporaso JG, McDonald D, Knights D, Reyes JA, Clemente JC, Burkepile DE, Vega Thurber RL, Knight R, et al. (2013). Predictive functional profiling of microbial communities using 16S rRNA marker gene sequences. Nat. Biotechnol 31, 814–821. 10.1038/nbt.2676. [DOI] [PMC free article] [PubMed] [Google Scholar]
- Li H, Dai F, Peng Q, Gan H, Zheng J, Xia Y, and Zhang W (2015). Myeloid-derived suppressor cells suppress CD4+ and CD8+ T cell responses in autoimmune hepatitis. Mol. Med. Rep 12, 3667–3673. 10.3892/mmr.2015.3791. [DOI] [PubMed] [Google Scholar]
- Longhi MS, Hussain MJ, Bogdanos DP, Quaglia A, Mieli-Vergani G, Ma Y, and Vergani D (2007). Cytochrome P450IID6-specific CD8 T cell immune responses mirror disease activity in autoimmune hepatitis type 2. Hepatology 46, 472–84. 10.1002/hep.21658. [DOI] [PubMed] [Google Scholar]
- Ma Y, Bogdanos DP, Hussain MJ, Underhill J, Bansal S, Longhi MS, Cheeseman P, Mieli-Vergani G, and Vergani D (2006). Polyclonal T-cell responses to cytochrome P450IID6 are associated with disease activity in autoimmune hepatitis type 2. Gastroenterology 130, 868–882. 10.1053/j.gastro.2005.12.020. [DOI] [PubMed] [Google Scholar]
- Vieira SM, Hiltensperger M, Kumar V, Zegarra-Ruiz D, Dehner C, Khan N, Costa FRC, Tiniakou E, Greiling T, Ruff W, et al. (2018).Translocation of a gut pathobiont drives autoimmunity in mice and humans. Science 359, 1156–1161. 10.1126/science.aar7201. [DOI] [PMC free article] [PubMed] [Google Scholar]
- Manns MP, Czaja AJ, Gorham JD, Krawitt EL, Mieli-Vergani G, Vergani D, and Vierling JM; American Association for the Study of Liver Diseases (2010). Diagnosis and management of autoimmune hepatitis. Hepatology 51, 2193–2213. 10.1002/hep.23584. [DOI] [PubMed] [Google Scholar]
- McPherson AC, Pandey SP, Bender MJ, and Meisel M (2021). Systemic immunoregulatory consequences of gut commensal translocation. Trends Immunol. 42, 137–150. 10.1016/j.it.2020.12.005. [DOI] [PMC free article] [PubMed] [Google Scholar]
- Meisel M, Hinterleitner R, Pacis A, Chen L, Earley ZM, Mayassi T, Pierre JF, Ernest JD, Galipeau HJ, Thuille N, et al. (2018). Microbial signals drive pre-leukaemic myeloproliferation in a Tet2-deficient host. Nature 557, 580–584. 10.1038/s41586-018-0125-z. [DOI] [PMC free article] [PubMed] [Google Scholar]
- Meisel M, Mayassi T, Fehlner-Peach H, Koval JC, O’Brien SL, Hinterleitner R, Lesko K, Kim S, Bouziat R, Chen L, et al. (2017). Interleukin-15 promotes intestinal dysbiosis with butyrate deficiency associated with increased susceptibility to colitis. ISME J 11, 15–30. 10.1038/ismej.2016.114. [DOI] [PMC free article] [PubMed] [Google Scholar]
- Mix H, Weiler-Normann C, Thimme R, Ahlenstiel G, Shin EC, Herkel J, David CS, Lohse AW, and Rehermann B (2008). Identification of CD4 T-cell epitopes in soluble liver antigen/liver pancreas autoantigen in autoimmune hepatitis. Gastroenterology 135, 2107–2118. 10.1053/j.gastro.2008.07.029. [DOI] [PMC free article] [PubMed] [Google Scholar]
- Moran-Crusio K, Reavie L, Shih A, Abdel-Wahab O, Ndiaye-Lobry D, Lobry C, Figueroa ME, Vasanthakumar A, Patel J, Zhao X, et al. (2011). Tet2 loss leads to increased hematopoietic stem cell self-renewal and myeloid transformation. Cancer Cell 20, 11–24. 10.1016/j.ccr.2011.06.001. [DOI] [PMC free article] [PubMed] [Google Scholar]
- Murphy TL, Cleveland MG, Kulesza P, Magram J, and Murphy KM (1995). Regulation of interleukin 12 p40 expression through an NF-kappa B half-site. Mol. Cell. Biol 15, 5258–5267. 10.1128/MCB.15.10.5258. [DOI] [PMC free article] [PubMed] [Google Scholar]
- Nagata T, McKinley L, Peschon JJ, Alcorn JF, Aujla SJ, and Kolls JK (2008). Requirement of IL-17RA in Con A induced hepatitis and negative regulation of IL-17 production in mouse T cells. J. Immunol 181, 7473–7479. 10.4049/jimmunol.181.11.7473. [DOI] [PubMed] [Google Scholar]
- Nakatsukasa H, Oda M, Yin J, Chikuma S, Ito M, Koga-Iizuka M, Someya K, Kitagawa Y, Ohkura N, Sakaguchi S, et al. (2019). Loss of TET proteins in regulatory T cells promotes abnormal proliferation, Foxp3 destabilization and IL-17 expression. Int. Immunol 31, 335–347. 10.1093/intimm/dxz008. [DOI] [PubMed] [Google Scholar]
- Nickerson KM, Christensen SR, Shupe J, Kashgarian M, Kim D, Elkon K, and Shlomchik MJ (2010). TLR9 regulates TLR7- and MyD88-dependent autoantibody production and disease in a murine model of lupus. J. Immunol 184, 1840–1848. 10.4049/jimmunol.0902592. [DOI] [PMC free article] [PubMed] [Google Scholar]
- Nicoletti F, Zaccone P, Xiang M, Magro G, Di Mauro M, Di Marco R, Garotta G, and Meroni P (2000). Essential pathogenetic role for interferon (IFN-)gamma in concanavalin A-induced T cell-dependent hepatitis: exacerbation by exogenous IFN-gamma and prevention by IFN-gamma receptor-immunoglobulin fusion protein. Cytokine 12, 315–323. 10.1006/cyto.1999.0561. [DOI] [PubMed] [Google Scholar]
- Peiseler M, Sebode M, Franke B, Wortmann F, Schwinge D, Quaas A, Baron U, Olek S, Wiegard C, Lohse AW, et al. (2012). FOXP3+ regulatory T cells in autoimmune hepatitis are fully functional and not reduced in frequency. J. Hepatol 57, 125–132. 10.1016/j.jhep.2012.02.029. [DOI] [PubMed] [Google Scholar]
- Peng M, Li Y, Zhang M, Jiang Y, Xu Y, Tian Y, Peng F, and Gong G (2014). Clinical features in different age groups of patients with autoimmune hepatitis. Exp. Ther. Med 7, 145–148. 10.3892/etm.2013.1363. [DOI] [PMC free article] [PubMed] [Google Scholar]
- Pereira A, Bruguera M, Cervantes F, and Rozman C (1988). Liver involvement at diagnosis of primary myelofibrosis: a clinicopathological study of twenty-two cases. Eur. J. Haematol 40, 355–361. [DOI] [PubMed] [Google Scholar]
- Preti M, Schlott L, Lübbering D, Krzikalla D, Müller AL, Schuran FA, Poch T, Schakat M, Weidemann S, Lohse AW, et al. (2021). Failure of thymic deletion and instability of autoreactive Tregs drive autoimmunity in immune-privileged liver. JCI Insight 6. 10.1172/jci.insight.141462. [DOI] [PMC free article] [PubMed] [Google Scholar]
- Quintana FJ, Basso AS, Iglesias AH, Korn T, Farez MF, Bettelli E, Caccamo M, Oukka M, and Weiner HL (2008). Control of T(reg) and T(H) 17 cell differentiation by the aryl hydrocarbon receptor. Nature 453, 65–71. 10.1038/nature06880. [DOI] [PubMed] [Google Scholar]
- Quivoron C, Couronné L, Della Valle V, Lopez CK, Plo I, Wagner-Ballon O, Do Cruzeiro M, Delhommeau F, Arnulf B, Stern MH, et al. (2011). TET2 inactivation results in pleiotropic hematopoietic abnormalities in mouse and is a recurrent event during human lymphomagenesis. Cancer Cell 20, 25–38. 10.1016/j.ccr.2011.06.003. [DOI] [PubMed] [Google Scholar]
- Renand A, Habes S, Mosnier JF, Aublé H, Judor JP, Vince N, Hulin P, Nedellec S, Métairie S, Archambeaud I, et al. (2018). Immune alterations in patients with type 1 autoimmune hepatitis persist upon standard immunosuppressive treatment. Hepatol. Commun 2, 968–981. 10.1002/hep4.1202. [DOI] [PMC free article] [PubMed] [Google Scholar]
- Savola P, Lundgren S, Keränen MAI, Almusa H, Ellonen P, Leirisalo-Repo M, Kelkka T, and Mustjoki S (2018). Clonal hematopoiesis in patients with rheumatoid arthritis. Blood Cancer J. 8, 69. 10.1038/s41408-018-0107-2. [DOI] [PMC free article] [PubMed] [Google Scholar]
- Scholten D, Trebicka J, Liedtke C, and Weiskirchen R (2015). The carbon tetrachloride model in mice. Lab Anim 49, 4–11. 10.1177/0023677215571192. [DOI] [PubMed] [Google Scholar]
- Schramm C, and Lohse AW (2014). Autoimmune hepatitis on the rise. J. Hepatol 60, 478–479. 10.1016/j.jhep.2013.11.025. [DOI] [PubMed] [Google Scholar]
- Senaldi G, Portmann B, Mowat AP, Mieli-Vergani G, and Vergani D (1992). Immunohistochemical features of the portal tract mononuclear cell infiltrate in chronic aggressive hepatitis. Arch. Dis. Child 67, 1447–1453. 10.1136/adc.67.12.1447. [DOI] [PMC free article] [PubMed] [Google Scholar]
- Sonner JK, Keil M, Falk-Paulsen M, Mishra N, Rehman A, Kramer M, Deumelandt K, Röwe J, Sanghvi K, Wolf L, et al. (2019). Dietary tryptophan links encephalogenicity of autoreactive T cells with gut microbial ecology. Nat. Commun 10, 4877. 10.1038/s41467-019-12776-4. [DOI] [PMC free article] [PubMed] [Google Scholar]
- Stockinger B, Di Meglio P, Gialitakis M, and Duarte JH (2014). The aryl hydrocarbon receptor: multitasking in the immune system. Annu. Rev. Immunol 32, 403–432. 10.1146/annurev-immunol-032713-120245. [DOI] [PubMed] [Google Scholar]
- Stremenova Spegarova J, Lawless D, Mohamad SMB, Engelhardt KR, Doody G, Shrimpton J, Rensing-Ehl A, Ehl S, Rieux-Laucat F, Cargo C, et al. (2020). Germline TET2 loss of function causes childhood immunodeficiency and lymphoma. Blood 136, 1055–1066. 10.1182/blood.2020005844. [DOI] [PubMed] [Google Scholar]
- Sucher E, Sucher R, Gradistanac T, Brandacher G, Schneeberger S, and Berg T (2019). Autoimmune hepatitis-immunologically triggered liver pathogenesis-diagnostic and therapeutic strategies. J. Immunol. Res 2019, 9437043. 10.1155/2019/9437043. [DOI] [PMC free article] [PubMed] [Google Scholar]
- Tanaka A (2020). Autoimmune Hepatitis: 2019 Update. Gut Liver 14, 430–438. 10.5009/gnl19261. [DOI] [PMC free article] [PubMed] [Google Scholar]
- Tanaka S, Ise W, Inoue T, Ito A, Ono C, Shima Y, Sakakibara S, Nakayama M, Fujii K, Miura I, et al. (2020). Tet2 and Tet3 in B cells are required to repress CD86 and prevent autoimmunity. Nat. Immunol 21, 950–961. 10.1038/s41590-020-0700-y. [DOI] [PubMed] [Google Scholar]
- Taubert R, Hardtke-Wolenski M, Noyan F, Wilms A, Baumann AK, Schlue J, Olek S, Falk CS, Manns MP, and Jaeckel E (2014). Intrahepatic regulatory T cells in autoimmune hepatitis are associated with treatment response and depleted with current therapies. J. Hepatol 61, 1106–1114. 10.1016/j.jhep.2014.05.034. [DOI] [PubMed] [Google Scholar]
- Tefferi A (2016). Primary myelofibrosis: 2017 update on diagnosis, risk-stratification, and management. Am. J. Hematol 91, 1262–1271. 10.1002/ajh.24592. [DOI] [PubMed] [Google Scholar]
- Tiegs G, Hentschel J, and Wendel A (1992). A T cell-dependent experimental liver injury in mice inducible by concanavalin A. J. Clin. Invest 90, 196–203. 10.1172/JCI115836. [DOI] [PMC free article] [PubMed] [Google Scholar]
- Tilstra JS, John S, Gordon RA, Leibler C, Kashgarian M, Bastacky S, Nickerson KM, and Shlomchik MJ (2020). B cell-intrinsic TLR9 expression is protective in murine lupus. J. Clin. Invest 130, 3172–3187. 10.1172/JCI132328. [DOI] [PMC free article] [PubMed] [Google Scholar]
- Tordjmann T, Soulie A, Guettier C, Schmidt M, Berthou C, Beaugrand M, and Sasportes M (1998). Perforin and granzyme B lytic protein expression during chronic viral and autoimmune hepatitis. Liver 18, 391–397. 10.1111/j.1600-0676.1998.tb00823.x. [DOI] [PubMed] [Google Scholar]
- Traina F, Visconte V, Jankowska AM, Makishima H, O’Keefe CL, Elson P, Han Y, Hsieh FH, Sekeres MA, Mali RS, et al. (2012). Single nucleotide polymorphism array lesions, TET2, DNMT3A, ASXL1 and CBL mutations are present in systemic mastocytosis. PLoS One 7, e43090. 10.1371/journal.pone.0043090. [DOI] [PMC free article] [PubMed] [Google Scholar]
- Umeshappa CS, Solé P, Surewaard BGJ, Yamanouchi J, Mohapatra S, Uddin MM, Clarke R, Ortega M, Singha S, Mondal D, et al. (2021). Liver-specific T regulatory type-1 cells program local neutrophils to suppress hepatic autoimmunity via CRAMP. Cell Rep. 34, 108919. 10.1016/j.celrep.2021.108919. [DOI] [PubMed] [Google Scholar]
- Vuerich M, Harshe R, Frank LA, Mukherjee S, Gromova B, Csizmadia E, Nasser IAM, Ma Y, Bonder A, Patwardhan V, et al. (2021). Altered aryl-hydrocarbon-receptor signalling affects regulatory and effector cell immunity in autoimmune hepatitis. J. Hepatol 74, 48–57. 10.1016/j.jhep.2020.06.044. [DOI] [PMC free article] [PubMed] [Google Scholar]
- Wang P, Yan Y, Yu W, and Zhang H (2019). Role of ten-eleven translocation proteins and 5-hydroxymethylcytosine in hepatocellular carcinoma. Cell Prolif. 52, e12626. 10.1111/cpr.12626. [DOI] [PMC free article] [PubMed] [Google Scholar]
- Wang Q, Garrity GM, Tiedje JM, and Cole JR (2007). Naive Bayesian classifier for rapid assignment of rRNA sequences into the new bacterial taxonomy. Appl. Environ. Microbiol 73, 5261–5267. 10.1128/AEM.00062-07. [DOI] [PMC free article] [PubMed] [Google Scholar]
- Watanabe Y, Morita M, and Akaike T (1996). Concanavalin A induces perforin-mediated but not Fas-mediated hepatic injury. Hepatology 24, 702–710. 10.1053/jhep.1996.v24.pm0008781346. [DOI] [PubMed] [Google Scholar]
- Wei Y, Zeng B, Chen J, Cui G, Lu C, Wu W, Yang J, Wei H, Xue R, Bai L, et al. (2016). Enterogenous bacterial glycolipids are required for the generation of natural killer T cells mediated liver injury. Sci. Rep 6, 36365. 10.1038/srep36365. [DOI] [PMC free article] [PubMed] [Google Scholar]
- Whitmire JK, Tan JT, and Whitton JL (2005). Interferon-gamma acts directly on CD8+ T cells to increase their abundance during virus infection. J. Exp. Med 201, 1053–1059. 10.1084/jem.20041463. [DOI] [PMC free article] [PubMed] [Google Scholar]
- Xiao Z, Casey KA, Jameson SC, Curtsinger JM, and Mescher MF (2009). Programming for CD8 T cell memory development requires IL-12 or type I IFN. J. Immunol 182, 2786–2794. 10.4049/jimmunol.0803484. [DOI] [PMC free article] [PubMed] [Google Scholar]
- Xu Y, Sun X, Zhang R, Cao T, Cai SY, Boyer JL, Zhang X, Li D, and Huang Y (2020).A positive feedback loop of TET3 and TGF-β1 promotes liver fibrosis. Cell Rep. 30, 1310–1318.e5. 10.1016/j.celrep.2019.12.092. [DOI] [PMC free article] [PubMed] [Google Scholar]
- Ye T, Wang T, Yang X, Fan X, Wen M, Shen Y, Xi X, Men R, and Yang L, (2018). Comparison of concanavalin A-induced murine autoimmune hepatitis models. Cell. Physiol. Biochem 46, 1241–1251. 10.1159/000489074. [DOI] [PubMed] [Google Scholar]
- Yue X, Lio CJ, Samaniego-Castruita D, Li X, and Rao A (2019). Loss of TET2 and TET3 in regulatory T cells unleashes effector function. Nat. Commun 10, 2011. 10.1038/s41467-019-09541-y. [DOI] [PMC free article] [PubMed] [Google Scholar]
- Yue X, Trifari S, Äijö T, Tsagaratou A, Pastor WA, Zepeda-Martínez JA, Lio CW, Li X, Huang Y, Vijayanand P, et al. (2016). Control of Foxp3 stability through modulation of TET activity. J. Exp. Med 213, 377–397. 10.1084/jem.20151438. [DOI] [PMC free article] [PubMed] [Google Scholar]
- Zakrzewski M, Proietti C, Ellis JJ, Hasan S, Brion MJ, Berger B, and Krause L (2017). Calypso: a user-friendly web-server for mining and visualizing microbiome-environment interactions. Bioinformatics 33, 782–783. 10.1093/bioinformatics/btw725. [DOI] [PMC free article] [PubMed] [Google Scholar]
- Zelante T, Iannitti RG, Cunha C, De Luca A, Giovannini G, Pieraccini G, Zecchi R, D’Angelo C, Massi-Benedetti C, Fallarino F, et al. (2013). Tryptophan catabolites from microbiota engage aryl hydrocarbon receptor and balance mucosal reactivity via interleukin-22. Immunity 39, 372–385. 10.1016/j.immuni.2013.08.003. [DOI] [PubMed] [Google Scholar]
- Zenewicz LA, Yancopoulos GD, Valenzuela DM, Murphy AJ, Karow M, and Flavell RA (2007). Interleukin-22 but not interleukin-17 provides protection to hepatocytes during acute liver inflammation. Immunity 27, 647–659. 10.1016/j.immuni.2007.07.023. [DOI] [PMC free article] [PubMed] [Google Scholar]
- Zhang Q, Zhao K, Shen Q, Han Y, Gu Y, Li X, Zhao D, Liu Y, Wang C, Zhang X, et al. (2015). Tet2 is required to resolve inflammation by recruiting Hdac2 to specifically repress IL-6. Nature 525, 389–393. 10.1038/nature15252. [DOI] [PMC free article] [PubMed] [Google Scholar]
- Zhang Y, Qi C, Li L, Hua S, Zheng F, Gong F, and Fang M (2019). CD8+ T cell/IL-33/ILC2 axis exacerbates the liver injury in Con A-induced hepatitis in T cell-transferred Rag2-deficient mice. Inflamm. Res 68, 75–91. 10.1007/s00011-018-1197-9. [DOI] [PubMed] [Google Scholar]
- Zhao L, Tang Y, You Z, Wang Q, Liang S, Han X, Qiu D, Wei J, Liu Y, Shen L, et al. (2011). Interleukin-17 contributes to the pathogenesis of autoimmune hepatitis through inducing hepatic interleukin-6 expression. PLoS One 6, e18909. 10.1371/journal.pone.0018909. [DOI] [PMC free article] [PubMed] [Google Scholar]
- Zierden M, Kühnen E, Odenthal M, and Dienes HP (2010). Effects and regulation of autoreactive CD8+ T cells in a transgenic mouse model of autoimmune hepatitis. Gastroenterology 139, e971–e973. 10.1053/j.gastro.2010.05.075. [DOI] [PubMed] [Google Scholar]
Associated Data
This section collects any data citations, data availability statements, or supplementary materials included in this article.
Supplementary Materials
Data Availability Statement
Raw and analyzed 16S rRNA-Seq data are available via the NCBI Sequence Read Archive (SRA: PRJNA830441). Raw and analyzed hepatic RNA-seq data are available at NCBI: GSE201459. Remaining data needed to support the conclusion of this manuscript are included in the main text and supplementary materials. Any additional information required to reanalyze the data reported in this paper is available from the lead contact upon request