

Abstract
Adenosine N6‐methylation (m6A) and N6,2′‐O‐dimethylation (m6Am) are regulatory modifications of eukaryotic mRNAs. m6Am formation is catalyzed by the methyl transferase phosphorylated CTD‐interacting factor 1 (PCIF1); however, the pathophysiological functions of this RNA modification and PCIF1 in cancers are unclear. Here, we show that PCIF1 expression is upregulated in colorectal cancer (CRC) and negatively correlates with patient survival. CRISPR/Cas9‐mediated depletion of PCIF1 in human CRC cells leads to loss of cell migration, invasion, and colony formation in vitro and loss of tumor growth in athymic mice. Pcif1 knockout in murine CRC cells inhibits tumor growth in immunocompetent mice and enhances the effects of anti‐PD‐1 antibody treatment by decreasing intratumoral TGF‐β levels and increasing intratumoral IFN‐γ, TNF‐α levels, and tumor‐infiltrating natural killer cells. We further show that PCIF1 modulates CRC growth and response to anti‐PD‐1 in a context‐dependent mechanism with PCIF1 directly targeting FOS, IFITM3, and STAT1 via m6Am modifications. PCIF1 stabilizes FOS mRNA, which in turn leads to FOS‐dependent TGF‐β regulation and tumor growth. While during immunotherapy, Pcif1‐Fos‐TGF‐β, as well as Pcif1‐Stat1/Ifitm3‐IFN‐γ axes, contributes to the resistance of anti‐PD‐1 therapy. Collectively, our findings reveal a role of PCIF1 in promoting CRC tumorigenesis and resistance to anti‐PD‐1 therapy, supporting that the combination of PCIF1 inhibition with anti‐PD‐1 treatment is a potential therapeutic strategy to enhance CRC response to immunotherapy. Finally, we developed a lipid nanoparticles (LNPs) and chemically modified small interfering RNAs (CMsiRNAs)‐based strategy to silence PCIF1 in vivo and found that this treatment significantly reduced tumor growth in mice. Our results therefore provide a proof‐of‐concept for tumor growth suppression using LNP‐CMsiRNA to silence target genes in cancer.
Keywords: anti‐PD‐1 treatment, colorectal carcinoma, m6Am methylation, NK cells, PCIF1
Subject Categories: Cancer, RNA Biology
The cap‐specific adenine N6‐methyltransferase PCIF1 affects colorectal cancer tumorigenesis and response to anti‐PD‐1 immunotherapy via FOS, Ifitm3 and Stat1 5′‐cap modifications.
Introduction
Despite advances in the diagnosis and treatment of colorectal cancer (CRC), it is estimated that it will account for 10% of all new cancer diagnoses and 9.4% of cancer‐related deaths worldwide in 2020, placing CRC third and second, respectively, in those categories (Sung et al, 2021). Bioinformatics analyses of CRC patients have identified four robust molecular subtypes of CRC: microsatellite instable, canonical oncogene alteration, metabolic activation, and transforming growth factor beta (TGF‐β)‐dependent (Guinney et al, 2015). Although TGF‐β signaling plays a role in several molecular CRC subtypes, the TGF‐β‐dependent subtype is strongly associated with tumor angiogenesis, stromal invasion, and poor prognosis (Ikushima & Miyazono, 2010; Colak & Ten Dijke, 2017; Jung et al, 2017). Physiologically, TGF‐β plays important regulatory roles in tissue homeostasis through several key cellular processes, including proliferation, differentiation, and apoptosis. However, the functions of TGF‐β in cancer depend on the context; thus, TGF‐β signaling inhibits tumorigenesis in normal epithelial cells but promotes growth and metastasis of established tumor cells (Colak & Ten Dijke, 2017). The tumor‐promoting properties of TGF‐β include positive effects on intratumoral stromal cell function and angiogenesis, as well as suppression of tumor‐infiltrating effector cells such as T cells and natural killer (NK) cells.
Immune checkpoint blockade (ICB) has revolutionized our approach to cancer immunotherapy. However, while antibodies targeting inhibitory receptor–ligand interactions between T cells and tumor cells, such as those mediated by programmed cell death receptor 1 (PD‐1), its ligand programmed cell death ligand 1 (PD‐L1), and cytotoxic T lymphocyte‐associated protein 4 (CTLA‐4) can elicit durable remission in some cancers, and they are ineffective against other tumor types, such as CRC (Kim et al, 2014). Furthermore, not all patients with ICB‐responsive tumors have good outcomes to targeted therapy, and identification of tumor and host factors that determine the outcomes of ICB is therefore an active area of research. For example, exclusion of certain immune cell subsets and elevated TGF‐β signaling in the tumor microenvironment (TME) are recognized as determinants of poor responses to anti‐PD‐1/PD‐L1 therapy in some tumors, including CRC (Calon et al, 2015; Ganesh & Massague, 2018), which has raised the possibility that suppression of TGF‐β signaling could be used to amplify tumor responses to anti‐PD‐1/PD‐L1 therapy.
Posttranscriptional RNA modification is emerging as an important epigenetic regulatory circuit in multiple pathophysiological contexts. N 6 ‐methyladenosine (m6A) is the most abundant mRNA modification in mammals and is generally located at the 5′‐ and 3′‐untranslated regions (UTRs) and stop codons (Dominissini et al, 2012; Meyer et al, 2012; Schwartz et al, 2014). The abundance of m6A in cellular RNA metabolism is regulated by the activity of the methyltransferases METTL3/14 (Liu et al, 2014) (“writers”), the YTH family of m6A‐binding proteins (Wang et al, 2014, 2015; Xiao et al, 2016; Li et al, 2017) (“readers”), and demethylases such as ALKBH5 (Zheng et al, 2013) (“erasers”). Recent studies have identified roles for m6A in various diseases (Hess et al, 2013; Satterlee et al, 2014) including cancer (Barbieri et al, 2017; Vu et al, 2017; Su et al, 2018; Han et al, 2019; Paris et al, 2019; Yang et al, 2019), and in the response of cancer to immunotherapy. For example, knockdown of YTHDF1 and the demethylase FTO were shown to enhance the response of melanoma tumors to anti‐PD‐1 therapy (Han et al, 2019; Yang et al, 2019). In addition, we recently showed that deletion of ALKBH5 sensitized melanoma tumors to immunotherapy and prolonged mouse survival through a mechanism involving modulation of lactate levels in the TME, which, in turn, regulated accumulation of immunosuppressive T regulatory lymphocytes (Tregs) and myeloid‐derived suppressor cell (MDSCs) in the TME (Li et al, 2020). We also found that inhibition of m6A modification by depletion of Mettl3 and Mettl14 enhanced the response of pMMR‐MSI‐L CRC and melanoma to anti‐PD‐1 treatment (Wang et al, 2020). Consequently, inhibitors targeting enzymes regulating m6A pathways are being developed as potential new therapeutics to treat multiple cancers (Li et al, 2020; Huff et al, 2021, 2022; Yankova et al, 2021).
Another abundant RNA modification located near the mRNA cap structure is the dimethylated N 6 ,2′‐O‐dimethyladenosine (m6Am) (Wei et al, 1975; Keith et al, 1978). m6Am is located at the first transcribed nucleotide in ~ 30% of cellular mRNAs and thus can have a major influence on the transcriptome (Wei et al, 1975). Recent studies identified the methylase phosphorylated CTD‐interacting factor 1 (PCIF1) as the enzyme that catalyzes m6A methylation of 2′‐O‐methylated adenosine at the 5′‐end of mRNAs (Akichika et al, 2019; Boulias et al, 2019; Sendinc et al, 2019; Sun et al, 2019). However, the pathophysiological roles of m6Am and PCIF1 are unclear. Two recent studies revealed the function of PCIF1 in modulating HIV and VSV pathogenesis and immune responses (Tartell et al, 2021; Zhang et al, 2021). During HIV infection, viral protein Vpr degrades PCIF1 and reprograms human T cells m6Am methylome. In VSV, PCIF1 modifies viral mRNA cap structure and attenuates the antiviral effects of interferon‐beta (Tartell et al, 2021). In the present study, we set out to determine the role of m6Am modification in CRC and its response to anti‐PD‐1 immunotherapy. We found that PCIF1 is highly expressed in human CRC tumors and correlates with poor patient prognosis and that PCIF1‐mediated m6Am modification of the classical oncogene FOS promotes CRC malignant behaviors and suppresses the response to anti‐PD‐1 immunotherapy in mouse tumor models. Thus, our results identify a novel role for m6Am in tumor biology and also raise the possibility that m6Am‐regulating pathways could serve as therapeutic targets for cancer both directly and by sensitizing refractory tumors to ICB therapy.
Results
PCIF1 is overexpressed in CRC and correlates with poor survival
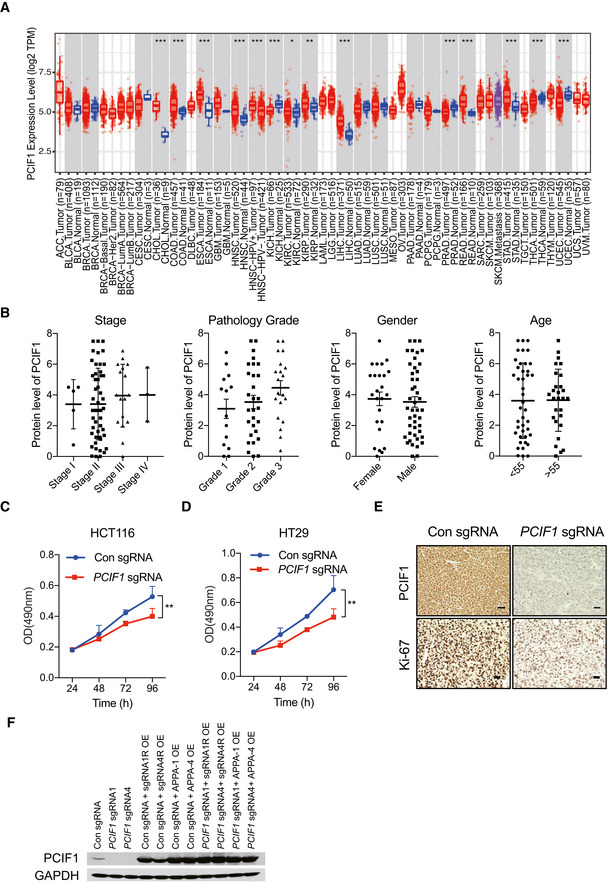
To determine whether m6Am, like m6A, may play a role in cancer development and response to therapy, we first examined the expression level of PCIF1 in multiple cancers by analyzing RNA‐seq data sets using TIMER2.0 database. This analysis showed that PCIF1 was significantly elevated in several tumors, including CRC (n = 457), compared with adjacent normal tissues (n = 41; Fig EV1A). To verify these results, we performed immunohistochemical (IHC) staining of PCIF1 protein in 27 matched pairs of CRC and normal tissues. We found that PCIF1 was expressed at much higher levels in tumor cells compared with normal colon cells and was mainly localized to the nucleus (Fig 1A). Moreover, of those 27 patients, 19 patients whose tumors were classified as having low PCIF1 expression survived significantly longer than did the eight patients with high PCIF1 levels (Fig 1B). However, PCIF1 staining intensity did not correlate with stage, pathology grade, gender, or age in 70 patients with CRC (Fig EV1B). These results therefore demonstrate that PCIF1 is overexpressed in CRC and that high expression correlates with poor survival.
Figure EV1. PCIF1 depletion decreases proliferation of CRC cells.
-
APCIF1 mRNA expression in multiple tumor tissues and adjacent normal tissues in datasets analyzed with TIMER2.0. Distributions of PCIF1 gene expression levels are displayed through boxplots. A box was draw from the first to the third quartile and the median is shown as a central band of the box. The whiskers go from each quartile to the minimum or maximum value. *P < 0.05; **P < 0.01; ***P < 0.001 computed by the Wilcoxon test.
-
BAnalysis of correlations between PCIF1 expression with stage, pathology grade, gender, or age in 70 patients with CRC using IHC staining. Each dot presents one patient. Data are the mean ± SEM of the number of patients/group as indicated.
-
C, DMTS cellular proliferation assay of control and PCIF1‐depleted HCT116 and HT29 cells. Data are mean ± SD of n = 3 biological replicates. **P < 0.01 by Student's t‐tests.
-
ERepresentative IHC staining of PCIF1 and Ki‐67 protein in control and PCIF1‐depleted tumors. n = 3 mice/group. Scale bars, 50 μm.
-
FWestern blot analysis of PCIF1 in HCT116 cells overexpressing either sgRNA resistant (sgRNA1R and sgRNA4R) wild‐type PCIF1 or catalytically inactive PCIF1 (APPA‐1 and APPA‐4) in the control and PCIF1 knockout cells.
Figure 1. PCIF1 is upregulated in CRC .
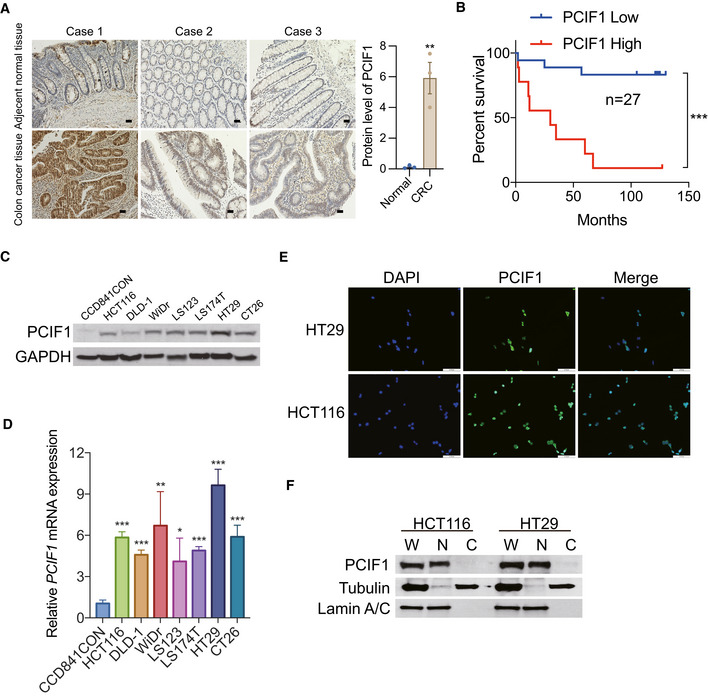
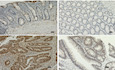
- Representative images of IHC staining of PCIF1 in three CRC tissues and adjacent noncancerous tissues. Scale bar, 50 μm (left). Analysis of the PCIF1 protein expression in normal and CRC tissues. Each dot represents one sample (right). Data are the mean ± SEM. **P < 0.01, by Student's t‐test.
- Kaplan–Meier plots of overall survival of 27 CRC patients with low tumor PCIF1 expression (0–4.5 staining score, n = 18) or high tumor PCIF1 expression (4.6–9.0 staining score, n = 9). Data are the mean ± SEM. ***P < 0.001 by Student's t‐test.
- Western blot analysis of PCIF1 in normal colon cells (CCD841CON) and various CRC cell lines. GAPDH served as a loading control.
- qRT‐PCR analysis of PCIF1 mRNA in the indicated cell lines. Levels were normalized to GAPDH expression. Data are the mean ± SD of n = 3 biological replicates. *P < 0.05, **P < 0.01, ***P < 0.001 by Student's t‐test.
- Representative immunofluorescence images of HT29 and HCT116 cells stained for endogenous PCIF1 protein (green). Nuclei were stained with DAPI (blue). Scale bar, 30 μm.
- Western blot analysis of PCIF1 in whole extract (W), cytosolic (C), and nuclear (N) fractions of HCT116 and HT29 cells. Tubulin and lamin A/C served as cytosolic and nuclear markers, respectively.
We further investigated the PCIF1 expression level in multiple established CRC cell lines and a normal human colon cell line. Western blot and qRT‐PCR analysis revealed that PCIF1 is expressed at higher levels in CRC cell lines compared with normal colon cells at both the protein and mRNA levels (Fig 1C and D). Moreover, PCIF1 was localized predominantly in the nucleus of HCT116 and HT29 CRC cells, as measured by immunofluorescence staining (Fig 1E) and subcellular fractionation followed by immunoblotting (Fig 1F). These results confirm that the human CRC cells lines effectively phenocopy human CRC tissues in both the elevated expression and nuclear localization of PCIF1.
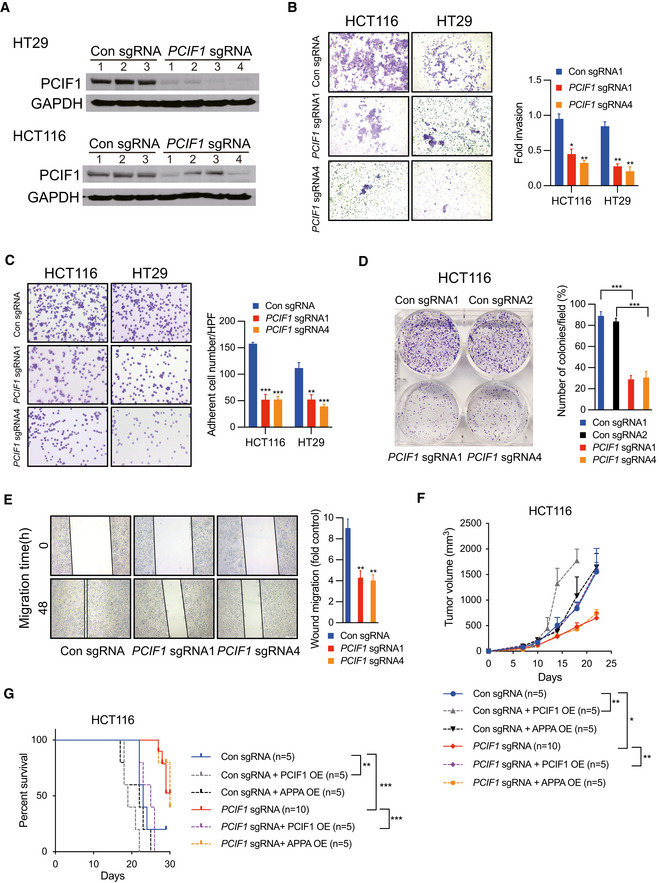
PCIF1 depletion suppresses the malignant behavior of CRC cells in vitro and in vivo
Because the functional role of PCIF1 in CRC is not known, we examined the growth and malignant behaviors of cell lines subjected to PCIF1 knockout by CRISPR/Cas9 editing with PCIF1‐specific single‐guide RNA (sgRNA). Western blot analysis of HCT116 and HT29 cells showed that PCIF1 protein was effectively reduced by infection with PCIF1 sgRNA compared with control sgRNA (Fig 2A). Notably, assays of cell proliferation (Fig EV1C and D), invasion (Fig 2B), fibronectin adhesion (Fig 2C), colony formation (Fig 2D), and migration (Fig 2E) revealed that PCIF1 depletion significantly reduced all of these malignancy‐associated behaviors compared with the control cells. To confirm that the effect of PCIF1 depletion on CRC growth was not restricted to the in vitro conditions, PCIF1‐depleted HCT116 tumor cells were injected subcutaneously into athymic nude mice. Indeed, PCIF1‐depleted tumors grew significantly more slowly than control tumors (Fig 2F) and mice bearing the PCIF1‐depleted tumors survived significantly longer than control tumor‐bearing mice (Fig 2G). Furthermore, IHC staining of the proliferation marker Ki‐67 in sections of tumors confirmed significantly reduced Ki‐67 expression levels in PCIF1‐depeled tumors compared with control tumors (Fig EV1E). Collectively, these results indicate that PCIF1 plays a pivotal role in promoting the growth of CRC. To further determine whether the methyltransferase activity of PCIF1 is required for enhancing CRC tumor growth, we performed rescue experiments by overexpressing either sgRNA resistant (sgRNA R) wild‐type PCIF1 or catalytically inactive PCIF1 (APPA) mutant (Zhang et al, 2021) in the control sgRNA and PCIF1 knockout cells (Fig EV1F) and analyzed the tumor growth. In the control sgRNA group, overexpression of wild‐type PCIF1, but not APPA mutant, enhanced tumor growth and shortened the mice survival (Fig 2F and G). Accordingly, in PCIF1‐deficient group, only the overexpression of wild‐type PCIF1, and not the APPA mutant, rescued the tumor suppression caused by PCIF1 depletion and shortened the animal survival (Fig 2F and G). These results demonstrate that catalytically active PCIF1 contributes to promoting tumor growth.
Figure 2. PCIF1 depletion reduces CRC tumorigenesis.
-
AWestern blot analysis of PCIF1 in HT29 and HCT116 cells depleted of PCIF1 using four different sgRNAs. GAPDH served as a loading control.
-
B–EMatrigel invasion assay (B), fibronectin adhesion assay (C), colony formation assay (D), and wound healing migration assay (E) of the indicated control and PCIF1‐depleted CRC cell lines. Representative images and quantification of cells are shown at the left and right, respectively, of each panel. Data are the mean ± SD of n = 3 replicates/condition. *P < 0.05, **P < 0.01, ***P < 0.001 by Student's t‐test.
-
FGrowth of the indicated HCT116 tumors after subcutaneous injection into athymic nude mice. Tumor volume was recorded on the indicated days. Data are the mean ± SEM of the number of mice/group indicated on each panel. n, the numbers of mice. *P < 0.05, **P < 0.01 by Student's t‐test.
-
GSurvival analysis of mice injected bearing the indicated HCT116 tumors. Data are the mean ± SEM of the number of mice/group indicated on each panel. n, the numbers of mice. **P < 0.01, ***P < 0.001 by Student's t‐test.
Identification of potential target genes of PCIF1 in CRC
To understand the molecular mechanisms by which PCIF1 promotes the growth and malignant behaviors of CRC, we first determined whether PCIF1 mediates deposition of m6Am in CRC cell RNA. Using an LC–MS/MS protocol (Li et al, 2020; Huff et al, 2021), we examined the ratios of m6A and m6Am to unmethylated adenosine (m6A/A and m6Am/A, respectively) in total mRNA from control and PCIF1‐depleted HCT116 cells. We found that PCIF1 silencing significantly reduced the ratio of m6Am/A, but not m6A/A, compared with control cells, which is consistent with previous findings (Fig 3A; Sendinc et al, 2019). Next, we performed RNA sequencing (RNA‐seq) and m6Am‐exo‐Seq (Sendinc et al, 2019) to identify genome‐wide changes in total mRNA and m6Am‐modified mRNA, respectively. From the m6Am‐exo‐seq analysis, we found a clear enrichment of 5′ ends around transcription start sites (TSS) in control mRNA rather than PCIF1‐depleted mRNA by metagene plots of m6Am enrichment analysis, indicating that these transcripts are likely m6Am modified (Fig 3B). The RNA‐seq analysis identified 464 genes that were significantly downregulated in PCIF1‐depleted cells compared with control cells, and the m6Am‐exo‐seq data identified 3,585 significantly decreased m6Am peaks in PCIF1 depleted compared with control cells. By comparing overlap between the two gene sets, we identified a total of 76 candidate genes whose expression was regulated by PCIF1‐mediated m6Am modification (Figs 3C and EV2A; Dataset [Link], [Link]). Gene Ontology analysis of the function of these 76 genes revealed enrichment in pathways relevant to “regulation of epithelial cell proliferation,” “cell‐cell signaling by WNT,” “regulation of cell adhesion,” and other pathways relevant to tumor growth (Fig 3D). Of particular interest, the 76 PCIF1‐regulated genes were particularly highly enriched in the “response to transforming growth factor beta (TGF‐β)” pathway.
Figure 3. PCIF1 target genes identified by RNA‐seq and m6Am‐exo‐seq.
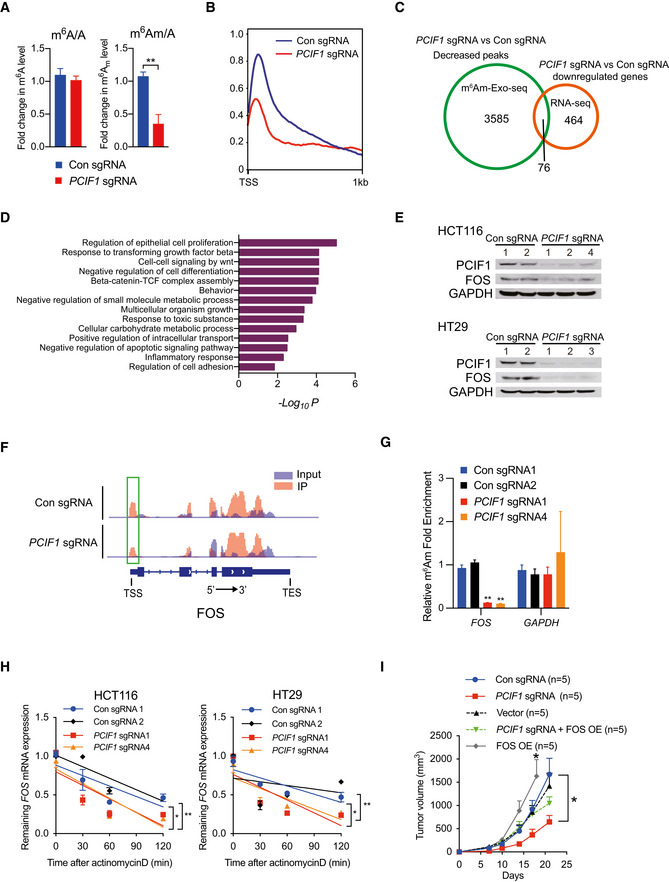
- LC–MS/MS quantification of m6Am or m6A levels in mRNA from control and PCIF1‐depleted HCT116 cells. Data are presented as the enrichment of methylated vs unmethylated mRNA. Data are the mean ± SD of n = 3 biological replicates. **P < 0.01 by Student's t‐test.
- Metagene plots analysis of m6Am enrichment around the transcription start site (TSS) of all expressed genes in control and PCIF1‐depleted HCT116 cells.
- Venn diagram of PCIF1 peaks number, downstream genes, and identified genes from m6Am‐exo‐seq and RNA‐seq.
- Meta‐enrichment analysis summary for the 76 genes identified as PCIF1 targets in HCT116 cells.
- Western blot analysis of FOS and PCIF1 in control and PCIF1‐depleted HCT116 and HT29 cells. GAPDH served as a loading control.
- Genome browser views of FOS with m6Am sites. Read coverage of input sample and IP sample are shown in blue and red, respectively, and green rectangle indicates the m6Am peaks located near the TSS.
- m6Am‐exo‐qPCR analysis of m6Am enrichment in FOS mRNAs from the indicated HCT116 cells. GAPDH served as a negative control. Data are the mean ± SD of n = 3 biological replicates. **P < 0.01 by Student's t‐test.
- qRT‐PCR analysis of FOS mRNA stability in control and PCIF1‐depleted HCT116 and HT29 cells treated with actinomycin D for the indicated times. Data are the mean ± SD of n = 3 biological replicates. *P < 0.05, **P < 0.01 by Student's t‐test.
- Growth of tumors after subcutaneous injection of the indicated HCT116 cells into athymic nude mice. Tumor volumes were recorded on the indicated days. Data are the mean ± SEM of n = 5. *P < 0.05 by Student's t‐test.
Figure EV2. Validation of target genes of PCIF1 .
-
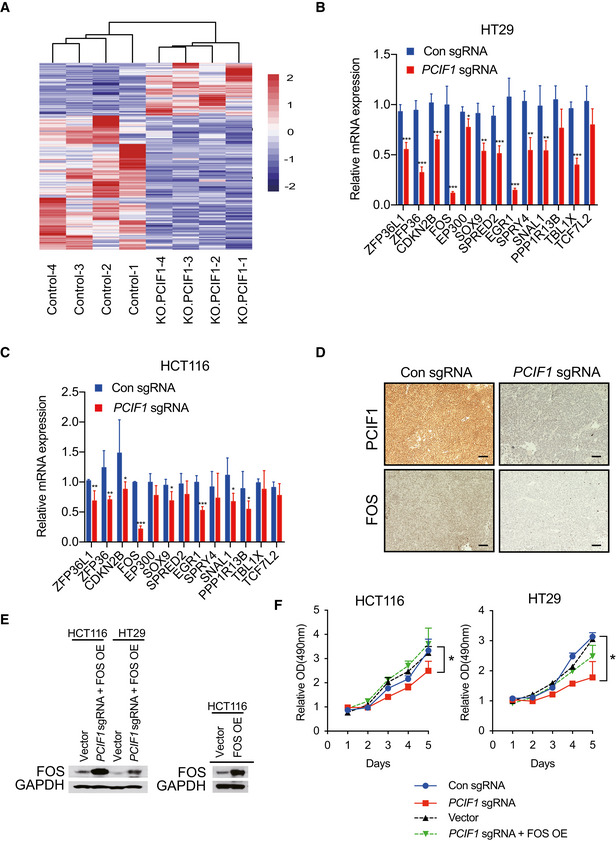
AHeat map representation of differentially expressed genes in control and PCIF1‐depleted HCT116 cells analyzed by RNA‐seq. Purple and red indicate genes downregulated and upregulated, respectively, upon PCIF1 depletion.
-
B, CqRT‐PCR analysis of the indicated TGFβ pathway‐related genes (identified from Fig 3D) in control and PCIF1‐depleted HCT116 and HT29 cells. Mean ± SD of n = 3 biological replicates. *P < 0.05, **P < 0.01, ***P < 0.001 by Student's t‐test.
-
DRepresentative IHC staining of PCIF1 and FOS protein expression in control and PCIF1‐deficient HCT116 tumors excised from athymic nude mice. n = 3 mice/group. Scale bars, 25 μm.
-
EWestern blot analysis of FOS expression in the indicated HCT116 and HT29 cells transfected with empty vector or a FOS overexpression vector. GAPDH served as a loading control.
-
FMTS proliferation assay of control and PCIF1‐depleted HCT116 and HT29 cells expressing control sgRNA, PCIF1 sgRNA, empty vector, or PCIF1 sgRNA plus FOS overexpression vector. Mean ± SD of n = 3 biological replicates. *P < 0.05 by Student's t‐test.
Because mutations in TGF‐β receptors and aberrant TGF‐β signaling are strongly associated with certain CRC subtypes (Xu & Pasche, 2007), we examined the involvement of PCIF1 in regulation of the TGF‐β pathway in more detail. We first performed qRT‐PCR analysis of all of the genes included in the TGF‐β pathway in PCIF1‐depleted and control CRC cells. This analysis confirmed the differential regulation of TGF‐β‐associated genes by PCIF1 and identified the proto‐oncogene FOS as the most significantly downregulated gene in PCIF1‐depleted HCT116 and HT29 cells (Fig EV2B and C). In agreement with the qRT‐PCR results, western blot analysis of CRC cells (Fig 3E) and IHC staining of HCT116 tumors from Fig 2F (Fig EV2D) confirmed that FOS protein expression was reduced by PCIF1 depletion in CRC. Analysis of the m6Am‐exo‐seq data, which showed m6Am on 5′ ends immediate to TSS had a clear decreased peak in PCIF1‐depleted cells, indicating FOS is a m6Am‐modified gene (Fig 3F). We further validated this result by m6Am‐exo‐qPCR showing significant decrease in FOS mRNA levels in PCIF1‐deficient cells, which is consistent with sequencing results (Fig 3G). These findings suggest that FOS expression is regulated by PCIF1‐mediated m6Am modification. One of the functions of 5′‐cap‐located m6Am is to control mRNA stability (Boulias et al, 2019); therefore, we analyzed the half‐life of FOS mRNA upon PCIF1 knockout in CRC cells. Control or PCIF1‐depleted HCT116 and HT29 cells were incubated with actinomycin D to inhibit new RNA synthesis, and FOS mRNA levels were quantified by qRT‐PCR at various times thereafter. The results showed that FOS mRNA was significantly less stable in PCIF1‐depleted cells than in control cells (Fig 3H). Collectively, these results demonstrate that PCIF1 controls FOS mRNA stability in CRC cells via m6Am deposition.
Next, we determined whether FOS mediates the effects of PCIF1 on CRC cell function by examining whether restoration of FOS expression can overcome the functional deficits of PCIF1 depletion. Control and PCIF1‐depleted HCT116 and HT29 cells were transfected with a FOS overexpression vector, and restoration of FOS protein expression was confirmed by western blot analysis (Fig EV2E). We then examined the effects of FOS overexpression on CRC cell growth in vitro and in vivo. Notably, overexpression of FOS essentially overcomes the inhibitory effects of PCIF1 depletion on HCT116 and HT29 cell proliferation in vitro (Fig EV2F) and tumor growth in vivo (Fig 3I). Furthermore, FOS overexpression alone promotes tumor growth compared with control cells (Fig 3I). These data confirm that FOS plays a role in mediating the CRC growth‐promoting effects of PCIF1.
FOS suppression inhibits CRC tumorigenesis
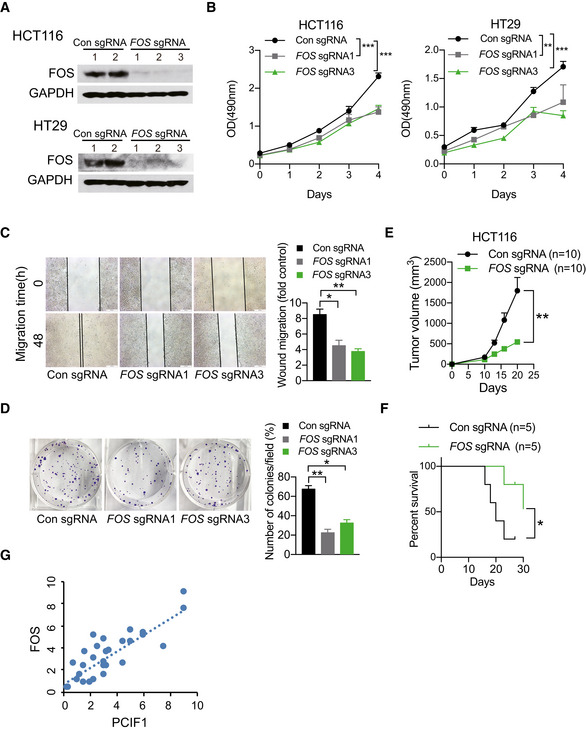
FOS, a proto‐oncogene, is required in malignant progress of multiple cancer types including head and neck squamous cell carcinoma (Muhammad et al, 2017) and skin cancer (Saez et al, 1995). However, little is known about the role of FOS in CRC, thus we initially explored the expression of FOS in a normal human colon cell line and numerous established human CRC cell lines and found that FOS is expressed at higher levels in CRC cell lines compared to normal colon cells at both the protein and mRNA levels determined by Western blot and qRT‐PCR analyses, repectively (Fig EV3A and B). Thereafter, FOS‐depleted HCT116 and HT29 cells via CRISPR/Cas9 editing was generated to investigate its function. Western blot analysis confirmed the near‐complete loss of FOS protein in cells expressing FOS‐targeted sgRNAs compared with control sgRNA (Fig 4A). Moreover, cell proliferation (Fig 4B), migration (Fig 4C), and colony formation (Fig 4D) were all markedly reduced in FOS‐depleted CRC cells compared with control cells. Consistent with these in vitro analyses, tumors formed by FOS‐depleted HCT116 cells grew significantly more slowly than control tumors (Fig 4E), and accordingly, mice bearing FOS‐depleted tumors survived significantly longer than the control mice (Fig 4F). Taken together, these data indicate that FOS promotes CRC malignant behavior, consistent with a role in mediating the effects of PCIF1. Finally, we asked whether FOS expression was dysregulated similarly to PCIF1 in CRC tumor tissues. Indeed, IHC staining of tumors from 29 patients with CRC identified a significant positive correlation between PCIF1 and FOS protein levels (Fig 4G). Collectively, these data support a role for FOS in PCIF1‐mediated regulation of CRC growth.
Figure EV3. FOS regulates transcription of TGFβ in CRC .
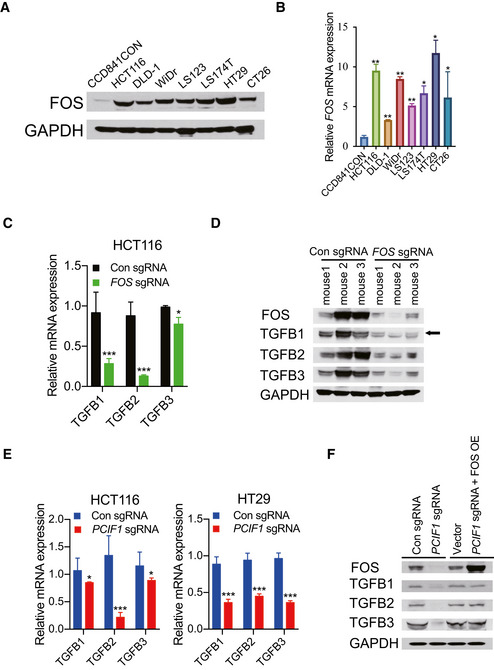
- Immunoblotting analysis of PCIF1 in normal colon cells (CCD841CON) and various CRC cell lines. GAPDH served as a loading control.
- PCIF1 mRNA level was analyzed by qRT‐PCR in the indicated cell lines. Levels were normalized to GAPDH expression. Data are the mean ± SD of n = 3 biological replicates. *P < 0.05, **P < 0.01 by Student's t‐test.
- qRT‐PCR analysis of TGFβ1‐3 mRNA in control and FOS‐depleted HCT116 cells. Mean ± SD of n = 3 biological replicates. *P < 0.05, ***P < 0.001 by Student's t‐test.
- Western blot analysis of FOS and TGFB1‐3 in control and FOS‐depleted HCT116 tumors excised from athymic nude mice. GAPDH served as a loading control.
- qRT‐PCR analysis of TGFB1‐3 mRNA levels in control or PCIF1‐depleted HCT116 and HT29 cells. Mean ± SD of n = 3 biological replicates. *P < 0.05, ***P < 0.001 by Student's t‐test.
- Immunoblot analysis of FOS and TGFB1‐3 proteins in control and PCIF1‐depleted HCT116 cells transfected with empty vector or a FOS overexpression vector. GAPDH served as a loading control.
Figure 4. Functional role of FOS in CRC .
-
AWestern blot analysis of FOS in control and FOS‐depleted HCT116 and HT29 cells. GAPDH served as a loading control.
-
B–DMTS cell proliferation assay (B), wound healing migration assay (C), and colony formation assay (D) of control and FOS‐depleted HCT116 cells. Representative images and quantification of colonies are shown to the left and right, respectively. Data are the mean ± SD of n = 3 biological replicates. *P < 0.05, **P < 0.01, ***P < 0.001 by Student's t‐test.
-
EGrowth of control and FOS‐depleted HCT116 tumors after subcutaneous injection into athymic nude mice. Tumor volume was recorded on the indicated days. Data are the mean ± SEM of n = 10 mice/group. **P < 0.01 by Student's t‐test.
-
FSurvival analysis of mice bearing control and FOS‐depleted HCT116 tumors. Data are the mean ± SEM of n = 5 mice/group. *P < 0.05 by Student's t‐test.
-
GPositive correlation between FOS and PCIF1 protein levels in tumors from 29 patients with CRC (R 2 = 0.6902, P < 0.001).
FOS is a primary member of the AP‐1 family of transcription factors, is known to regulate transcription of TGF‐β (Pandey et al, 2012; Zhou et al, 2020), and TGFβ has a well‐characterized role in promoting CRC (Xu & Pasche, 2007). Given the known role of FOS in TGF‐β transcription, and the link between TGF‐β and CRC, we next asked whether FOS regulates TGF‐β expression in CRC, and if so, whether that occurs in a PCIF1‐dependent or ‐independent manners. To this end, we first examined expression of the three TGF‐β isoforms (TGFβ1‐3) in FOS‐deficient HCT116 cells and tumors from Fig 4E by qRT‐PCR and immunoblot analysis, respectively. Compared with control, we found that all three isoforms were significantly reduced in FOS‐depleted cells and tumors (Fig EV3C and D), indicating that FOS regulates TGF‐β transcription in CRC. Notably, similar reductions in TGF‐β mRNA and protein levels were also observed in PCIF1‐depleted CRC cells (Fig EV3E and F), but the effects were reversed by concomitant overexpression of FOS (Fig EV3F). Thus, PCIF1 regulates TGF‐β expression in CRC through FOS.
PCIF1 sensitizes CRC to anti‐PD‐1 therapy
The sensitivity of tumors to anti‐PD‐1 therapy appears to be influenced by a number of factors, including the composition of immune cells and cytokines within the TME (Li et al, 2020; Wang et al, 2020). Therefore, we next asked whether PCIF1 and/or FOS suppression influence anti‐PD‐1 effects on CRC in vivo, and if so, whether the effects are mediated by alteration of the TME. We first performed CRISPR/Cas9‐mediated deletion of Pcif1 in the murine CRC cell lines CT26 and MC38 and examined tumor growth in syngeneic immunocompetent mice. Efficient depletion of Pcif1 protein in the two cell lines was confirmed by western blot analysis (Fig EV4A and B). Control and Pcif1‐depleted CT26 and MC38 cells were injected subcutaneously into BALB/c or C57BL/6J mice, respectively, and groups of mice were then either untreated or treated with 200 μg anti‐PD‐1 antibody as described in methods. Intriguingly, Pcif1 depletion alone and anti‐PD‐1 treatment alone both significantly inhibited the growth of CRC tumors; however, an additive effect of both treatments was observed such that tumor growth was virtually abolished in anti‐PD‐1 antibody‐treated animals bearing Pcif1‐depleted tumors (Fig 5A and B). These results indicate that Pcif1 depletion further sensitizes CRC tumors to the growth inhibitory effects of anti‐PD‐1 therapy in immunocompetent mice.
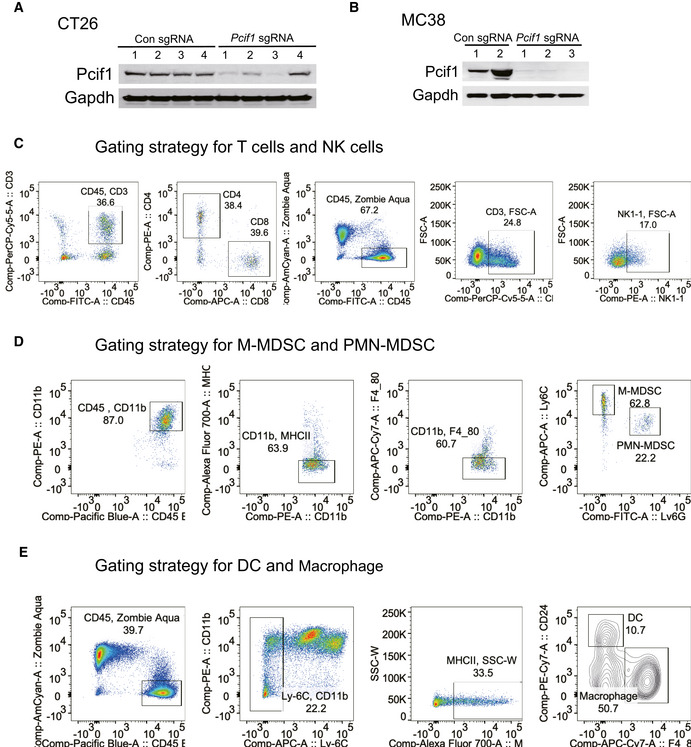
Figure EV4. Validation for Pcif1 depletion in mouse CRC cell lines and gating strategy for immune cell analysis.
-
A, BWestern blot analysis of Pcif1 and Gapdh (loading control) protein in control and Pcif1‐depleted CT26 and MC38 cells.
-
CGating strategy for T cells and NK cells.
-
DGating strategy for M‐MDSC and PMN‐MDSC.
-
EGating strategy for DC and macrophage.
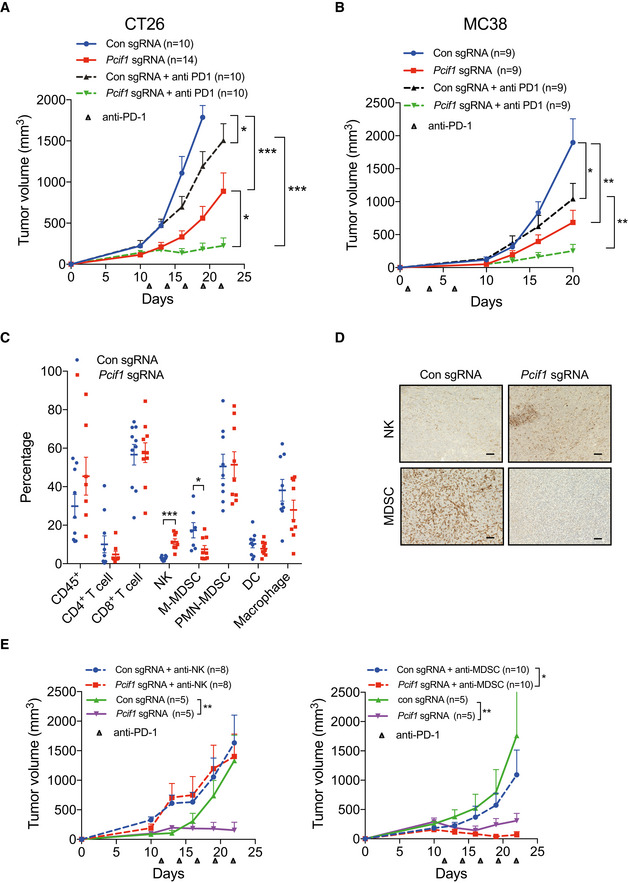
Figure 5. Depletion of Pcif1 sensitizes mouse CRC to anti‐PD‐1 treatment.
-
A, BGrowth of control and Pcif1‐depleted CT26 (A) and MC38 (B) tumors in BALB/c and C57 BL /6J mice, respectively, untreated or injected intraperitoneally with 200 μg anti‐PD‐1 antibody. n, number of mice. Data are the mean ± SEM of the number of mice/group indicated on each panel. *P < 0.05, **P < 0.01, ***P < 0.001 by Student's t‐test.
-
CFlow cytometric analysis of the percentage of total CD45+ lymphocytes, CD4+ T cells, CD8+ T cells, NK cells, MDSCs, DCs, and macrophages in extracts of control and Pcif1‐depleted CT26 tumors as indicated. Each spot represents individual mice. Data are the mean ± SEM of the number of mice/group as indicated. *P < 0.05; ***P < 0.001 by Student's t‐test.
-
DRepresentative images of IHC staining of NK and MDSC cells in control and Pcif1‐depleted CT26 tumors. n = 3 mice/group. Scale bars, 25 μm.
-
EGrowth of control and Pcif1‐depleted CT26 tumors in BALB/c mice injected with 200 μg anti‐PD‐1 antibody with/without depleted of NK or MDSC cells as indicated. Data are the mean ± SEM of the number of mice/group indicated on each panel. *P < 0.05, **P < 0.01 by Student's t‐test.
To identify the potential mechanisms by which Pcif1 depletion enhanced the effects of anti‐PD‐1 on CRC tumor growth, we performed flow cytometry to analyze the composition of tumor‐infiltrating cells in CT26 tumors after subcutaneous injection into BALB/c mice. Tumors formed by control and Pcif1‐depleted CT26 cells showed no significant differences in the numbers of tumor‐associated total tumor infiltrated CD45+ lymphocytes, CD4+ T cells, CD8+ T cells, polymorphonuclear myeloid‐derived suppressor cells (PMN‐MDSCs), dendritic cells (DCs), or macrophages (Figs 5C and EV4C–E). However, Pcif1‐depleted tumors contained significantly higher numbers of NK cells and significantly lower numbers of mononuclear MDSCs (M‐MDSCs) compared with control tumors (Fig 5C). Moreover, the same specific increase in NK cells and reduction in M‐MDSCs were observed in Pcif1‐depeleted compared with control tumors formed by MC38 cells (Fig EV5A). Consistent with these findings, IHC staining of CT26 tumors indicated markedly higher staining with the NK cell marker anti‐NK1.1 and lower staining with the MDSC marker anti‐Ly6G/Ly6C compared with control tumors (Fig 5D). Given that NK cells and M‐MDSCs promote and inhibit antitumor immunity, respectively, these findings suggest that alterations in the abundance of these cell types may play a role in the growth‐suppressive effects of PCIF1 depletion. To assess this, we injected mice with anti‐NK1.1 or anti‐Ly6G/C antibodies twice weekly starting on day 5 after tumor cell inoculation to deplete the mice of NK cells or MDSCs, respectively. Notably, the tumor‐suppressive effects of Pcif1 knockout was completely reversed in mice depleted of NK cells, whereas enhanced response to immunotherapy by Pcif1 loss was not abolished by MDSCs depletion (Fig 5E). These results are consistent with a crucial role for NK cells in mediating the antitumor effects of PCIF1 knockout.
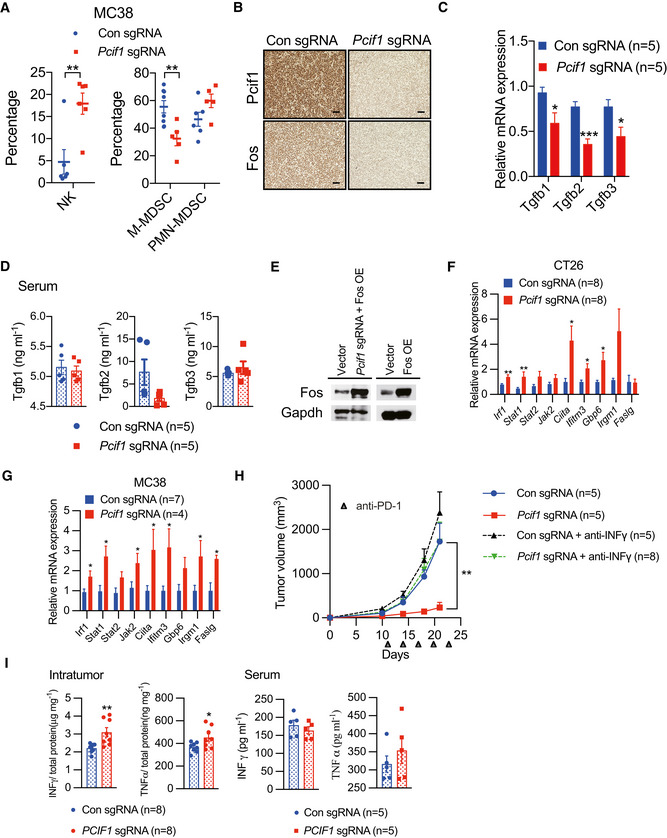
Figure EV5. Pcif1 depletion enhances the CRC tumor response to anti‐PD‐1 immunotherapy.
-
AFlow cytometric analysis of the percentage of MDSCs and NK cells in extracts of control and Pcif1‐depleted MC38 tumors. Each spot represents individual mice. Data are the mean ± SEM of the indicated number of mice. **P < 0.01 by Student's t‐test.
-
BIHC staining of Pcif1 and Fos protein expression in control and Pcif1‐depleted CT26 tumors after anti‐PD‐1 antibody injection. n = 3 mice/group. Scale bars, 25 μm.
-
CqRT‐PCR analysis of Tgfb1‐3 mRNA in control and Pcif1‐depleted CT26 tumors of the indicated number of mice. Data are the mean ± SEM of n = 5 mice/group. *P < 0.05, ***P < 0.001 by Student's t‐test.
-
DQuantification of Tgfb1‐3 secretion levels in serum extracts from BALB/c mice carrying control and Pcif1‐depleted CT26 tumors by ELISA. Data are the mean ± SEM of n = 5. Symbols represent individual mice.
-
EFos expression was validated in the indicated cells transfected with a Fos overexpression vector or empty vector by western blot.
-
F, GThe indicated mRNA expression was assessed using qRT‐PCR in Pcif1‐depleted and control CT26 (F) and MC38 tumors (G). Data are the mean ± SEM of the indicated number of mice. *P < 0.05, **P < 0.01 by Student's t‐test.
-
HBALB/c mice bearing Pcif1‐deficient and control tumors were treated with PD‐1 antibody and IFN‐γ‐blocking antibody as indicated. Tumor volume was recorded over time. n, the numbers of mice. Data are mean ± SEM of the indicated number of mice. **P < 0.01 by Student's t‐tests.
-
IThe production of IFN‐γ and TNFα in tumor (left) and serum (right) extracts from BALB/c mice injected with control and Pcif1‐depleted CT26 cells via ELISA. Data are the mean ± SEM of the indicated number of mice. Each spot represents individual mice. *P < 0.05, **P < 0.01 by Student's t‐test.
The mechanisms of Pcif1 in modulating CRC tumor microenvironment during immunotherapy
Finally, we asked whether Fos activity might contribute to the additive effects of Pcif1 depletion on anti‐PD‐1 treatment of Pcif1‐depleted CRC tumors. Fos mRNA levels and protein levels were reduced in Pcif1‐depleted CT26 tumors compared with control tumors excised from anti‐PD‐1‐treated mice (Figs 6A and EV5B). Moreover, decreased m6Am levels of Fos were detected in Pcif1 null tumors by m6Am‐exo‐qPCR experiments as well (Fig 6B), indicating that Pcif1 continues to regulate Fos under immunotherapy. Since TGF‐β is closely connected to immunotherapy, where exposure to TGF‐β ligand limits the activity of NK cells, while TGF‐β signaling suppression preserves highly activated NK cells to kill cancer cells (Otegbeye et al, 2018; Itatani et al, 2019). Therefore, we continued to assess the expression of TGFβs using qRT‐PCR analysis. Evaluation of Tgfbs expression showed that Tgfb1‐3 were all downregulated in Pcif1‐depleted tumors (Fig EV5C), and, interestingly, this was accompanied by a significant reduction in intratumoral levels, but not serum levels, of Tgfb1‐3 secretion (Figs 6C and EV5D). To further investigate if the mechanism of enhanced immunotherapy response of Pcif1‐deficient tumors relies on the decreased Fos, we overexpressed Fos in Pcif1‐depleted and parental CT26 cells (Fig EV5E), and then compared the tumor growth of these cell with Pcif1 knockout tumors only under immunotherapy. Mice bearing Pcif1‐depleted tumors with Fos overexpression reversed the observed effects on Pcif1 null tumor growth (Fig 6D). Furthermore, the reduced production of TGF‐βs from Pcif1 null tumors was restored as well (Fig 6E). Accordingly, FOS overexpression alone significantly increased tumor size (Fig 6D) and TGFβs' secretion compared to control (Fig 6E). Taken together, these results suggest that Pcif1‐mediated regulation of the tumor response to anti‐PD‐1 antibody therapy is mediated via m6Am modification of Fos mRNA, Fos‐regulated TGF‐β production, and recruitment/retention of NK cells in the TME.
Figure 6. Pcif1‐depletion alters the CRC tumor microenvironment during anti‐PD‐1 immunotherapy.
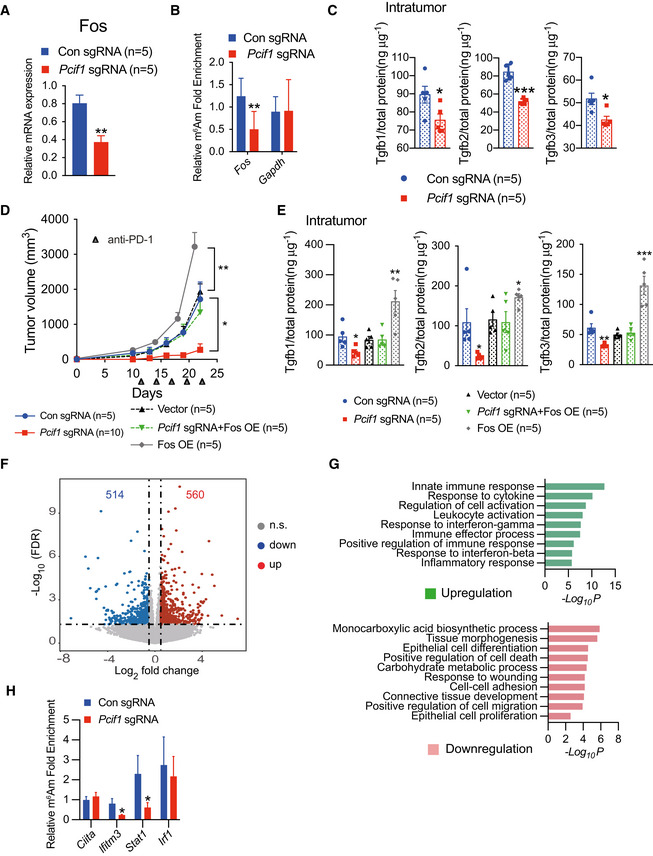
- qRT‐PCR analysis of Fos mRNA expression in control and Pcif1‐depleted CT26 tumors after anti‐PD‐1 antibody injection. Data are the mean ± SEM of n = 5. **P < 0.01 by Student's t‐test.
- m6Am‐exo‐qPCR analysis of m6Am enrichment in Fos mRNA in control and Pcif1‐depleted CT26 tumors. Gapdh served as a negative control. Data are the mean ± SEM of n = 3. **P < 0.01 by Student's t‐test.
- ELISA quantification of Tgfb1‐3 secretion levels in tumor extracts from BALB/c mice injected with control and Pcif1‐depleted CT26 cells. Data are the mean ± SEM of n = 5. Symbols represent individual mice. *P < 0.05, ***P < 0.001 by Student's t‐test.
- Tumor growth with the indicated gene edited CT26 cells in BALB/c mice treated with anti‐PD‐1 antibody. n, mouse number. Data are the mean ± SEM of the indicated mice in each group. *P < 0.05, **P < 0.01 by Student's t‐test.
- Production of Tgfb1‐3 was measured by ELISA from the indicated tumors. Data are the mean ± SEM of n = 5. Symbols represent individual mice. *P < 0.05, **P < 0.01, ***P < 0.001 by Student's t‐test.
- Volcano plot of differentially expression genes analyzed using DESeq2 in Pcif1‐depleted tumors compared with control. Significantly up or downregulated genes are plotted in red and blue points, respectively. n.s, nonsignificant.
- Meta‐enrichment analysis summary for the significant up and down‐regulated genes identified as Pcif1 targets in CT26 tumor with PD‐1 treatment.
- m6Am enrichment in the indicated mRNA was assessed in control and Pcif1‐depleted CT26 tumors by m6Am‐exo‐qPCR. Data are the mean ± SEM of n = 3. *P < 0.05 by Student's t‐test.
In order to obtain further mechanistic insight into how Pcif1 depletion remodels the TME, we performed RNA‐seq in Pcif1‐depleted CT26 depleted and control tumors with anti‐PD‐1 treatment. Our RNA‐seq analysis identified 560 genes were upregulated and 514 genes were downregulated in Pcif1 depleted tumors compared with control tumors (Fig 6F; Dataset EV4). According to Gene Ontology (GO) classification, these genes were enriched in the pathways associated with innate immune response, response to cytokine, interferon‐gamma (IFN‐γ) signaling and regulation of cell death, cellular proliferation, migration, adhesion etc. (Fig 6G). Given that IFN‐γ signaling is a critical contributor to adaptive resistance mechanisms of the checkpoint blockade therapy and has substantial effects on antitumor immune responses (Sharma et al, 2017), upregulated genes involved in the interferon γ pathway (Irf1, Stat1, Stat2, Jak2, Ciita, Ifitm3, Gbp6, Irgm1 and Faslg) were further confirmed by qRT‐PCR. We found that Irf1, Stat1, Ciita and Ifitm3 are the common upregulated genes in both Pcif1‐depleted CT26 and MC38 tumors compared to control (Fig EV5F and G), suggesting that Pcif1 depletion is involved in enhancing IFN‐γ response. Further m6Am‐exo‐qPCR experiments showed that Ifitm3 and Stat1 were m6Am‐modified genes by Pcif1 (Fig 6H). Above findings support that Ifitm3 and Stat1 are the specific targets of Pcif1 under immunotherapy. We next investigated whether depleting IFN‐γ influence the effect of Pcif1 deletion on tumor growth during immunotherapy. To address this question, we treated the BALB/c mice with anti‐IFN‐γ‐antibody during anti‐PD1 treatment of control sgRNA and Pcif1 sgRNA tumors. Our results showed that blocking of IFN‐γ reversed the inhibition of tumor growth by loss of Pcif1 under immunotherapy (Fig EV5H). These results suggest that IFN‐γ is essential to suppress tumor growth by Pcif1 depletion during anti‐PD‐1 treatment. Since IFN‐γ and TNFα as two of the most potent effector cytokines secreted by NK cells play a key role in antitumor activity (Paul & Lal, 2017), therefore, we then assessed the production of IFN‐γ and TNFα in both mouse serum and tumors by ELISA. Our results suggested that compared to control, the production of IFN‐γ and TNFα was significantly increased in mouse tumors with Pcif1 depletion, whereas no differences in serum were observed (Fig EV5I). Thus, these results indicated the increased production of IFN‐γ and TNFα in the TME also contributed to the enhanced efficacy of immunotherapy in Pcif1‐depleted tumors. Collectively, our findings revealed a context depended mechanisms of PCIF1 in CRC tumorigenesis and response to anti‐PD‐1 treatment. In summary, the PCIF1‐FOS‐TGF‐β axis regulates CRC tumors growth, whereas, during the immunotherapy, the Pcif1‐Fos‐TGF‐β and Pcif1‐Stat1/Ifitm3‐IFN‐γ mechanisms play essential roles in the interactions between the tumor and immune system (Fig 7H).
Figure 7. On‐target efficacy of LNP‐siRNA in vitro and in vivo .
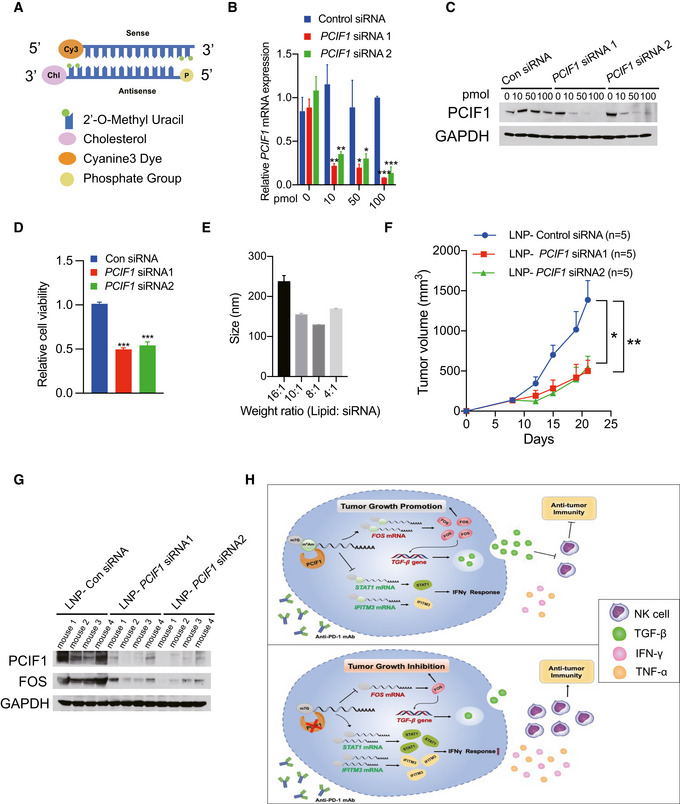
- Structures of siRNAs utilized in this study.
- mRNA expression of PCIF1 was quantified by qRT‐PCR in the HCT116 cells transfected with gradient amount of control and PCIF1 siRNAs. Data are the mean ± SD of n = 3 biological replicates. *P < 0.05, **P < 0.01, ***P < 0.001 by Student's t‐test.
- Western blot analysis of PCIF1 in HCT116 cells with control and PCIF1 siRNAs. GAPDH served as a loading control.
- Cell viability assays were performed in in the HCT116 cells transfected with 100 pmol control and PCIF1 siRNAs. Data are the mean ± SD of n = 3 biological replicates. ***P < 0.001 by Student's t‐test.
- Size of LNP‐siRNA formulations were analyzed by Zetasizer. Data are the mean ± SD of n = 3 biological replicates.
- Tumor growth of HCT116 cells treated with 1 mg/kg control and PCIF1 LNP‐siRNAs starting on day 9 and mice were intratumorally treated twice a week. Data are the mean ± SEM of n = 5 mice/group. *P < 0.05, **P < 0.01 by Student's t‐test.
- Immunoblots of PCIF1 and FOS were carried out from the indicated tumors in four replicates with GAPDH as a loading control.
- Schematic of the proposed function of PCIF1‐mediated m6Am modification in CRC.
Formulation and characterization of LNP‐CMsiRNA as advanced tools for clinical translational application
Our results demonstrated that loss of m6Am methyltransferase PCIF1 inhibits tumor malignancy and potentiates anti‐PD‐1 response during immunotherapy. In order to investigate the clinical translational potential of our findings, we developed efficacious nanoparticle‐mediated siRNA delivery system. To obtain an effective PCIF1 silencing in vivo, we chemically modified siRNAs (CMsiRNAs) to enhance their loading into RISC (RNA‐induced silencing complex) assembly, stability, lipophilicity, and cell permeability. RNA sequences were modified with 5′‐end phosphorylation, 2′‐O‐methyl U, and conjugated with cholesterol at the 3′ end (Fig 7A). PCIF1 silencing activities of modified siRNAs were analyzed by transfecting cells with varying amounts of siRNAs. Compared to control, PCIF1 expression was effectively reduced by the two designed siRNAs at the both mRNA and protein levels in a dose‐dependent manner (Fig 7B and C). Further, the effect of PCIF1 siRNA on cell survival was determined, and the results showed that PCIF1 siRNAs significantly inhibited cellular viability (Fig 7D). We next formulated siRNAs in LNPs at varying ratios from 16:1 to 4:1 (weight ratio of LNP: siRNA) for size analysis using the Zetasizer system. The estimated mean diameter of the LNP‐siRNA formulations with LNP: siRNA weight ratio at 8:1 was 125 nm, and this ratio was selected as the formulation for in vivo LNP‐siRNA administrations (Fig 7E). To further assess the efficiency of PCIF1 silencing by LNP‐siRNA formulation in vivo, 1 mg/kg of LNP‐siRNAs were injected intratumorally into the athymic nude mice twice a week. Our results showed that the tumor size was significantly reduced in mice treated with LNP‐PCIF1 siRNAs as compared with control siRNA (Fig 7F), and efficient silencing of PCIF1 in tumors was also observed by immunoblotting (Fig 7G). Altogether, these results suggest a new possibility to improve therapeutic methods for patients with CRC through the suppression of PCIF1 using siRNA therapy.
Discussion
In the present study, we sought to determine whether m6Am RNA modification by PCIF1 plays a role in CRC growth and response to ICB. The results reveal several new findings: First, PCIF1 is upregulated in CRC and correlates inversely with survival, suggesting that it plays an oncogenic role. Second, PCIF1 regulates the expression of genes associated with pathways involved in tumor malignancy and controls those cell behaviors in vitro and in vivo. Third, PCIF1‐mediated deposition of m6Am regulates FOS mRNA stability and transcription of TGF‐β. Fourth, Pcif1 regulates recruitment and/or retention of NK cells and Tgfβ1‐3, IFN‐γ, and TNF‐α levels in the tumor microenvironment. Finally, downregulation of Pcif1 significantly increases the sensitivity of CRC tumors to anti‐PD‐1 therapy in vivo through regulating Pcif1‐mediated Fos‐Tgf‐β and Stat1/Ifitm3‐IFN‐γ axes, establishing this methyltransferase as a contributor to CRC resistance to this therapy. Overall, our study demonstrates a key role for PCIF1 and the m6Am modification in regulating the balance between pro‐ and anti‐proliferative conditions in the CRC TME and the response to anti‐PD‐1 immunotherapy.
Our findings suggest that components of the PCIF1‐FOS‐TGF‐β pathway may serve as therapeutic targets not only for cancer therapy directly but also as modulators of ICB responses. The promoting role of m6Am in CRC development demonstrated in this study indicated the abolishment of this modification could be beneficial to cancer treatment. Here, we developed a LNPs packaging system for intratumoral chemically modified siRNA delivery and a significantly reduced tumor growth was found in mice treated with LNP‐PCIF1 siRNA as compared to control. These results provide a proof‐of‐concept for siRNA‐mediated silencing of target genes for potential clinical applications. Besides, it has been reported that the loss of PCIF1 in mice does not affect viability or fertility (Pandey et al, 2020), thus, we are expecting the development of PCIF1 inhibitor could open‐up the possibility to enhance the performance of immunotherapy for CRC through the suppression of m6Am modification. Similarly, inhibitors of methyltransferase METTL3 have been recently developed to treat myeloid leukemia (Bedi et al, 2020; Yankova et al, 2021). Taken together, our study delineates the role of m6Am in both CRC tumors and its response to immunotherapy, which provides broader mechanistic insight for our understanding and the potential clinical application value of RNA modification in cancer patients' treatment.
Materials and Methods
Immunohistochemical staining
Human colorectal cancer tissues were obtained from US Biomax. The staining procedure for paraffin‐embedded mouse and human tissues were as previously described (Mu et al, 2018). Tissue staining was semi‐quantitatively scored on a 0–9 scale by multiplying the score for the proportion of positively stained tumor cells (0, < 10%; 1, 10–25%; 2, 26–50%; 3, > 50%) by the staining intensity score (0–3) as previously defined (Wang et al, 2021). For the comparison of low/high PCIF1 expression and patient survival, overall survival was defined as the time between date of diagnosis and death. Primary antibodies used in IHC include anti‐PCIF1 (Invitrogen, PA5‐61996), anti‐FOS (Abcam, ab222699), anti‐Ki‐67 (Cell Signaling Technology, 12202T), anti‐Ly‐6G/Ly6C (Invitrogen, 14‐5931‐81), and anti‐NK1.1 (Invitrogen, MA1‐70100).
Western blot analysis
Cells or tumor tissues were lysed in RIPA buffer supplemented with protease inhibitors (Life Technologies, 87786), sonicated, and centrifuged. Protein concentrations in the supernatants were measured using a BCA protein assay kit (Bio‐Rad). Total protein samples were resolved on 4–12% NuPAGE Bis‐Tris or Tris‐Glycine gels (Fisher Scientific) and transferred to PVDF membranes (Bio‐Rad). Membranes were blocked with 5% (w/v) nonfat dry milk in PBS and incubated with primary antibodies against GAPDH (Proteintech, HRP‐60004), PCIF1 (Proteintech, 16082‐1), FOS (Abcam, ab222699), TGFB1 (Abcam, ab179695), TGFB2 (Proteintech, 19999‐1‐AP), TGFB3 (Proteintech, 18942‐1‐AP), tubulin (Santa Cruz Biotechnology, sc‐5286), or lamin A/C (Santa Cruz Biotechnology, sc‐6215) overnight at 4°C. Membranes were then incubated with HRP‐conjugated secondary antibodies for 15 min at 25°C (Thermo Scientific, Pierce Fast Western Blotting Blot Kit). Protein bands were visualized using the enhanced chemiluminescence (ECL) detection system (Thermo Scientific) followed by imaging of X‐ray film (Genesee Scientific, 30‐100).
RNA purification and quantitative reverse‐transcription PCR (qRT‐PCR)
RNA was extracted from cultured cells using Quick‐RNA Miniprep Kit (Zymo Research, R1055) and from fresh mouse tumors using Direct‐zol RNA MiniPrep Kit (Zymo Research, 11‐331) according to the manufacturer's instructions. Aliquots of 1 μg RNA were reverse‐transcribed using an iScript cDNA Synthesis Kit (Bio‐Rad, 1708841), and qPCR was performed with SsoAdvanced Universal SYBR Green PCR SuperMix (Bio‐Rad, 1725270) on an LightCycler480 PCR system. All qPCR primers are listed in Table EV1.
Immunofluorescence microscopy
Cells were grown in 24‐well tissue culture plates, washed with PBS, fixed with 4% formaldehyde for 10 min, permeabilized with PBS containing 0.5% Triton X‐100 for 10 min, blocked with 10% goat serum for 60 min, and incubated with primary anti‐PCIF1 antibody (Proteintech, 16082‐1) for 1 h. The cells were then washed, incubated with a secondary antibody conjugated to anti‐Rabbit Alexa Fluor 488 dye (Thermo Scientific, A‐11034) for 1 h, and counterstained with 4′,6‐diamidino‐2‐phenylindole (DAPI) for 10 min.
Cell culture and viral infection
The normal human colon cell line CCD841CoN (CRL‐1790) and human CRC cell lines HCT116 (CCL‐247), DLD‐1 (CCL‐221), WiDr (CCL‐218), LS123 (CCL‐255), LS174T (CL‐188), and HT29 (HTB‐38) were purchased from American Type Culture Collection (ATCC; Manassas, VA). The murine CRC cell lines CT26 (CRL‐2638) and MC38 (ENH204‐FP) were obtained from the ATCC and Kerafast, Inc., respectively. 293T (CRL‐3216) cells were obtained from ATCC. Cells were grown in EMEM (ATCC), DMEM, or RPMI (Gibco) supplemented with 10% fetal bovine serum (Gibco) and were maintained at 37°C in a 5% CO2 atmosphere according to ATCC's culture methods, respectively.
For lentiviral production, 293T cells were co‐transfected with the packaging plasmids psPAX2 and pMD2.G, CRISPRV2, and the indicated sgRNAs in 10 cm dishes using Lipofectamine (Life Technologies, 11668027) in Opti‐MEM medium (Gibco). The medium was replaced with fresh complete DMEM after 4–6 h, and the cells were incubated at 37°C for an additional 48 h. Culture supernatants were then removed and used to infect cells by spin transduction. SgRNAs for targeting human genes were PCIF1‐sgRNA1: CGGTTGAAAGACTCCCGTGG; PCIF1‐sgRNA2: TTCGGCGTGGGCCTCTACGA; PCIF1‐sgRNA3: GATCCGTTTGACGTACTCCA; PCIF1‐sgRNA4: ATTCACCAACCAGTCCCTGT. FOS‐sgRNA1: CTGCAGCCAAATGCCGCAAC; FOS‐sgRNA2: CTTCGTCTTCACCTACCCCG; and FOS‐sgRNA3: AACCGCCACGATGATGTTCT. SgRNAs for targeting mouse genes were: Pcif1‐sgRNA1: TGAAGCTCCGCCAGCACTAC; Pcif1‐sgRNA2: CACGTCGTGCTGACCCAGCA; Pcif1‐sgRNA3: GCTTCAAGATGAGCTGCGAG; and Pcif1‐sgRNA4: CTCTGAGAGCTGTCGCTTTC.
Transwell invasion assay
Cells were plated at 2 × 10⁵/well into Transwell chambers containing 8‐μm pore size filters (BD Biosciences) in serum‐free medium, and the assay was performed as previously described (Wang et al, 2021). After 24 h, invaded cells were stained with crystal violet solution (bioWORLD, 30430001‐1) and enumerated under a light microscope.
Wound healing and migration assay
Cells at 5 × 10⁴ cells/ml were added to Culture‐Insert 3 wells (Ibidi, 80366) in complete medium according to the manufacturer's instructions. Briefly, after cell attachment (12–24 h), the culture‐insert 3 well was gently removed by using sterile tweezer and the dish was filled with cell medium. The dishes were subsequently washed with cell medium and cells were analyzed using a microscope at 0 and 48 h.
Cell adhesion assay
DMEM containing fibronectin (10 μg/ml; R&D Systems, Minneapolis, MN) was added to 48‐well plates and incubated at 4°C for 12 h. The wells were washed and 5 × 10⁴ cells/well were added and the plates were incubated for 15 min at 37°C. Nonadherent cells were then rinsed away with PBS, and adherent cells were fixed with 4% paraformaldehyde, stained with 0.1% crystal violet solution, and enumerated.
Colony formation assay
Aliquots of 1 × 10³ cells/well were added to 6‐well plates and incubated for 14 days. Cells were fixed with 4% paraformaldehyde, stained with 0.1% crystal violet solution, and photographed. Colonies, defined as foci contained ≥ 50 cells, were enumerated.
Animal experiments
Protocols were approved by the Institutional Animal Care and Use Committee at the University of California, San Diego, and studies were performed in accordance with Committee guidelines. BALB/c and C57BL/6J mice at 6–8 weeks of age and athymic nude mice at 4–5 weeks of age were purchased from The Jackson Laboratory. CT26 or HCT116 cells with two independent control and PCIF1/FOS sgRNAs subjected to the indicated treatments were resuspended at 2 × 10⁶ in 200 μl of 1:1 PBS: Matrigel (Corning) and injected subcutaneously into the flanks of BALB/c mice (CT26) or athymic nude mice (HCT116). Mice were injected intraperitoneally with 200 μg (10 mg/kg) of anti‐PD‐1 antibody (Bio X Cell, clone 29F.1A12) on days 11, 14, 17, 20, and 23 after tumor injection as previously described (Wang et al, 2020). MC38 cells with two independent control and Pcif1 sgRNAs subjected to the indicated treatments were resuspended at 5 × 10⁵ in PBS and injected into the flanks of C57BL/6J mice. The mice were injected intraperitoneally with 200 μg (10 mg/kg) anti‐PD‐1 antibody on days 1, 4, and 7 after tumor injection.
For in vivo depletion of NK cells and MDSCs, CT26 tumor‐bearing mice were injected intraperitoneally with 200 μg (10 mg/kg) of anti‐NK1.1 (Bio X Cell, clone PK136) or anti‐Ly6G/Ly6C (Bio X Cell, clone RB6‐8C5) antibodies twice weekly starting on day 5. Tumor sizes were measured on the indicated days and tumor volumes were calculated as: volume (mm3) = (long diameter × short diameter2)/2. For the in vivo IFN‐γ blocking experiments, BALB/c mice bearing the control and Pcif1‐depleted tumors were treated i.p. with 200 μg (10 mg/kg) of anti‐IFN‐γ antibody (Bio X Cell, Clone: XMG1.2) every 2 days starting on day 7 and injected i.p. with 200 μg (10 mg/kg) of anti‐PD1 antibody as indicated.
MTS proliferation assay
2 × 10³ cells were seeded into each well of 96‐well plates and then processed at the indicated time using a CellTiter AQueous One Solution Cell Proliferation Assay Kit (Promega, G3580) according to the manufacturer's instructions. Absorbance at 490 nm was recorded.
Flow cytometry
Control and Pcif1‐depleted mice tumors were weighed, diced mechanically, and then digested with 2 mg/ml collagenase P (Sigma‐Aldrich) and 50 μg/ml DNase I (Sigma‐Aldrich) for 30 min at 37°C. The cells were filtered through a 70‐μm cell strainer and stained as previously described (Wang et al, 2020) with antibodies against CD45 (clone 30‐F11), CD3e (clone 145‐2C11), NK1.1 (clone PK136), CD4 (clone RM4‐5), CD8 (clone 53‐6.7), MHC class II (clone M5/114.15.2), CD24 (clone M1/69), F4/80 (BM8), and CD11b/Ly‐6C/Ly‐6G (Mouse MDSC Flow Cocktail 2, clones M1/70, 1A8, and HK1.4), all from BioLegend.
RNA‐seq
RNA was extracted from PCIF1‐depleted and control HCT116 cells (four biological replicates per group) using Quick‐RNA Miniprep Kit (Zymo Research, R1055). RNA‐seq library preparation and sequencing were performed at the IGM Genomics Center, UCSD, using an Illumina HiSeq 4000. Single‐end reads were trimmed using cutadapt (v1.18) and mapped to human genome (hg38) through HISAT2 (v2.1.0). Transcripts were quantified via HTSeq (0.11.2), and differentially expressed genes were then determined by DESeq2. Genes with a P value < 0.05 and fold change < 1 were considered downregulated and selected for further analysis.
m6Am‐exo‐seq and m6Am‐exo‐qPCR
m6Am‐exo‐Seq was performed according to previously described protocols (Sendinc et al, 2019). Briefly, mRNA was purified from control and PCIF1‐depeleted HCT116 cells using a Magnetic mRNA Isolation Kit (New England Biolabs, S1550S). mRNA was then fragmented with a Fragmentation Reagents Kit (Invitrogen, AM8740), phosphorylated with T4 PNK (NEB, M0201S), and treated with Terminator 5′‐Phosphate‐Dependent Exonuclease (Lucigen) to remove phosphorylated transcripts. Lastly, Cap‐Clip (CellScript) was used to remove capped transcripts. A sample equivalent to 10% of the 5′‐uncapped mRNA fragments was reserved as input, and the remainder was immunoprecipitated with anti‐m6A antibody (Abcam, ab151230). Library generation and sequencing were performed at IGM Genomics core, UCSD on an Illumina NovaSeq 6000.
For m6Am‐exo‐qPCR, mRNA was extracted from freshly excised control and Pcif1‐depeleted tumors and processed using the procedures described above. Reserved input and anti‐m6Am immunoprecipitated samples were reverse‐transcribed and analyzed by qPCR as described above.
m6Am‐exo‐seq analysis
Paired‐end reads generated from the m6Am‐exo‐seq data were trimmed by cutadapt and then mapped to the human genome (hg38) using HISAT2. Reads that fell within 100 bp upstream/downstream of TSS sites were considered TSS reads, which were then quantified by featureCount in Rsubread package and normalized by sequencing depth. For each gene, normalized TSS reads from immunoprecipitates or input samples from control or PCIF1‐depleted cells were subjected to a hypergeometric test, and the fold‐change enrichment was defined as . Genes with P < 0.05 and fold change < 1 were defined as cap‐m6Am‐modified genes.
HPLC–MS/MS
mRNA was purified from control and PCIF1‐depleted cells using a Magnetic mRNA Isolation Kit (New England Biolabs, S1550S) according to the manufacturer's protocol. Aliquots of 0.5 μg mRNA were de‐capped with 1 U Cap‐Clip (CellScript) at 37°C for 1 h and digested with 0.5 U of nuclease P1 (Sigma) at 37°C for 2 h. Ammonium bicarbonate and alkaline phosphatase (Sigma) were added and the mixture was incubated at 37°C for 2 h. The samples were then filtered (0.22‐μm pore, Millipore) and analyzed by LC–MS/MS as previously described (Li et al, 2020; Huff et al, 2021).
mRNA stability
mRNA stability was assessed as previously reported (Wei et al, 2018). In brief, PCIF1‐depleted and control HCT116 and HT29 cells were treated with 5 μg/ml actinomycin D (Alfa Aesar, AAJ67160XF) for 0, 30, 60, or 120 min, and FOS mRNA levels were then quantified by qRT‐PCR. Primers are listed in Table EV1.
Cytokine ELISA
Mouse serum samples and CT26 tumor extracts were prepared as described previously (Wang et al, 2020). The secretions of Tgfb1, Tgfb2, Tgfb3, IFN‐γ, and TNFα were quantified using a TGF beta‐1 Human/Mouse ELISA Kit (Fisher Scientific, 88‐8350‐22), a mouse TGFB2 ELISA Kit (Aviva Systems Biology, OKEH00309), a Tgfb3 mouse ELISA Kit (Boster Biological Technology, EK1104), an IFN‐γ mouse ELISA Kit (Fisher Scientific, 88‐7314‐22), and a TNFα mouse ELISA Kit (Fisher Scientific, 88‐7324‐22), respectively, according to the manufacturers' protocols.
Formulation of LNP‐siRNAs
The LNP‐siRNA was formulated using previous protocols as described (Jayaraman et al, 2012). Briefly, LNPs were formed by mixing lipids (Selleckchem, S6683), 1, 2‐distearoyl‐sn‐glycero‐3‐phosphocholine (DSPC) (Avanti Polar Lipids, 850365p‐200mg), cholesterol (Sigma, C3045), and DMG‐PEG2000 (Avanti Polar Lipids, 880151p‐1g) at a molar ratio of 50:10:38.5:1.5 in ethanol. siRNA solutions were diluted in 50 mM sodium citrate (pH = 4) such that the final weight ratio of lipid: siRNA was achieved from 16:1 to 4:1, accordingly, the mixture was incubated for 15 min at 37°C to encapsulate the siRNAs. LNP‐siRNAs were diluted in PBS and analyzed further. siRNAs used in this study are listed below:
control siRNA: 5′‐U.U.G.U.A.G.G.C.C.A.G.C.U.G.U.G.A.G.U.A.G‐3′ (Sense);
5′‐C.U.A.C.U.C.A.C.A.G.C.U.G.G.C.C.U.A.C.A.A‐3′ (Antisense).
PCIF1 siRNA1: 5′‐U.U.A.U.A.C.C.G.G.A.U.G.C.A.G.A.C.C.A.C.G‐3′ (Sense);
5′‐C.G.U.G.G.U.C.U.G.C.A.U.C.C.G.G.U.A.U.A.A‐3′ (Antisense).
PCIF1 siRNA2: 5′‐A.U.G.A.C.A.G.C.A.U.U.G.G.U.C.U.G.G.A.U.G‐3′ (Sense);
5′‐C.A.U.C.C.A.G.A.C.C.A.A.U.G.C.U.G.U.C.A.U‐3′ (Antisense).
Cell viability assay
5 × 10³ cells were seeded into each well of 96‐well plates and performed the experiment using a CellTiter‐Glo® Luminescent Cell Viability Assay kit (Promega, G7570) according to the manufacturer's instructions. Briefly, a volume of CellTiter‐Glo Reagent equal to the volume of cell culture medium present in each well was added and mixed for 2 min. After 10 min, luminescence was recorded.
Statistical analysis
Data were analyzed using Prism 5.0 software (GraphPad) and are presented as the mean ± standard deviation (SD) or standard error (SEM) as indicated. P values were determined using Student's t‐test and were considered to be significant at < 0.05.
Author contributions
Lingling Wang: Formal analysis; validation; investigation; methodology; writing—original draft. Lujing Wu: Validation. Zhouting Zhu: Validation. Gwendolyn Michelle Gonzalez: Formal analysis; methodology. Yinsheng Wang: Formal analysis; methodology. Tariq M Rana: Conceptualization; formal analysis; supervision; funding acquisition; investigation; methodology; project administration; writing—review and editing.
Disclosure and competing interests statement
TMR is a co‐founder and has equity interest in Gibraltar Sciences, a company dedicated to developing targeted molecular and immunotherapies for untreatable cancers. The terms of this arrangement have been reviewed and approved by the University of California, San Diego in accordance with its conflict of interest policies.
Supporting information
Expanded View Figures PDF
Table EV1
Dataset EV1
Dataset EV2
Dataset EV3
Dataset EV4
Source Data for Expanded View
Review Process File
PDF+
Source Data for Figure 1
Source Data for Figure 2
Source Data for Figure 3
Source Data for Figure 4
Source Data for Figure 5
Acknowledgments
We thank Dr. Kristen Jepsen of the Institute of Genomic Medicine at UCSD for help with HTSeq, Dr. Neal Sekiya and Ms. Tara Rambled at the Center for AIDS Research at UCSD for flow cytometry analysis, Dr. M. Valeria Estrada at the Biorepository and Tissue Technology Shared Resource at UC San Diego Moores Cancer Center for assistance with histology and immunohistochemistry, and members of the Rana lab for helpful discussions and advice. We also thank Ye Wang (University of California, Los Angeles) for help with the m6Am‐exo‐seq data analysis and Dr. Yong Cheng at UCSD for assistance in LNP‐siRNAs size analysis. This publication includes data generated at the UC San Diego IGM Genomics Center utilizing an Illumina NovaSeq 6000 that was purchased with funding from a National Institutes of Health SIG grant (#S10 OD026929). This work was supported in part by UCSD and grants from the National Institutes of Health (CA177322, CA030199, AI125103, DA046171).
The EMBO Journal (2023) 42: e111673
Data availability
RNA‐seq and m6Am‐exo‐seq data were deposited at the Gene Expression Omnibus database (https://www.ncbi.nlm.nih.gov/geo/) under accession number GSE175803.
References
- Akichika S, Hirano S, Shichino Y, Suzuki T, Nishimasu H, Ishitani R, Sugita A, Hirose Y, Iwasaki S, Nureki O (2019) Cap‐specific terminal N 6‐methylation of RNA by an RNA polymerase II–associated methyltransferase. Science 363: eaav0080 [DOI] [PubMed] [Google Scholar]
- Barbieri I, Tzelepis K, Pandolfini L, Shi J, Millán‐Zambrano G, Robson SC, Aspris D, Migliori V, Bannister AJ, Han N (2017) Promoter‐bound METTL3 maintains myeloid leukaemia by m6A‐dependent translation control. Nature 552: 126–131 [DOI] [PMC free article] [PubMed] [Google Scholar]
- Bedi RK, Huang D, Eberle SA, Wiedmer L, Caflisch A, Śledź P (2020) Small‐molecule inhibitors of METTL3, the major human epitranscriptomic writer. ChemMedChem 15: 744–748 [DOI] [PubMed] [Google Scholar]
- Boulias K, Toczydłowska‐Socha D, Hawley BR, Liberman N, Takashima K, Zaccara S, Guez T, Vasseur J‐J, Debart F, Aravind L (2019) Identification of the m6Am methyltransferase PCIF1 reveals the location and functions of m6Am in the transcriptome. Mol Cell 75: 631–643.e8 [DOI] [PMC free article] [PubMed] [Google Scholar]
- Calon A, Lonardo E, Berenguer‐Llergo A, Espinet E, Hernando‐Momblona X, Iglesias M, Sevillano M, Palomo‐Ponce S, Tauriello DV, Byrom D et al (2015) Stromal gene expression defines poor‐prognosis subtypes in colorectal cancer. Nat Genet 47: 320–329 [DOI] [PubMed] [Google Scholar]
- Colak S, Ten Dijke P (2017) Targeting TGF‐beta signaling in cancer. Trends Cancer 3: 56–71 [DOI] [PubMed] [Google Scholar]
- Dominissini D, Moshitch‐Moshkovitz S, Schwartz S, Salmon‐Divon M, Ungar L, Osenberg S, Cesarkas K, Jacob‐Hirsch J, Amariglio N, Kupiec M et al (2012) Topology of the human and mouse m6A RNA methylomes revealed by m6A‐seq. Nature 485: 201–206 [DOI] [PubMed] [Google Scholar]
- Ganesh K, Massague J (2018) TGF‐beta inhibition and immunotherapy: checkmate. Immunity 48: 626–628 [DOI] [PMC free article] [PubMed] [Google Scholar]
- Guinney J, Dienstmann R, Wang X, De Reynies A, Schlicker A, Soneson C, Marisa L, Roepman P, Nyamundanda G, Angelino P (2015) The consensus molecular subtypes of colorectal cancer. Nat Med 21: 1350–1356 [DOI] [PMC free article] [PubMed] [Google Scholar]
- Han D, Liu J, Chen C, Dong L, Liu Y, Chang R, Huang X, Liu Y, Wang J, Dougherty U (2019) Anti‐tumour immunity controlled through mRNA m 6 a methylation and YTHDF1 in dendritic cells. Nature 566: 270–274 [DOI] [PMC free article] [PubMed] [Google Scholar]
- Hess ME, Hess S, Meyer KD, Verhagen LA, Koch L, Bronneke HS, Dietrich MO, Jordan SD, Saletore Y, Elemento O et al (2013) The fat mass and obesity associated gene (Fto) regulates activity of the dopaminergic midbrain circuitry. Nat Neurosci 16: 1042–1048 [DOI] [PubMed] [Google Scholar]
- Huff S, Tiwari SK, Gonzalez GM, Wang Y, Rana TM (2021) M(6)A‐RNA demethylase FTO inhibitors impair self‐renewal in glioblastoma stem cells. ACS Chem Biol 16: 324–333 [DOI] [PMC free article] [PubMed] [Google Scholar]
- Huff S, Kummetha IR, Zhang L, Wang L, Bray W, Yin J, Kelley V, Wang Y, Rana TM (2022) Rational design and optimization of m(6)A‐RNA demethylase FTO inhibitors as anticancer agents. J Med Chem 65: 10920–10937 [DOI] [PMC free article] [PubMed] [Google Scholar]
- Ikushima H, Miyazono K (2010) TGFbeta signalling: a complex web in cancer progression. Nat Rev Cancer 10: 415–424 [DOI] [PubMed] [Google Scholar]
- Itatani Y, Kawada K, Sakai Y (2019) Transforming growth factor‐β signaling pathway in colorectal cancer and its tumor microenvironment. Int J Mol Sci 20: 5822 [DOI] [PMC free article] [PubMed] [Google Scholar]
- Jayaraman M, Ansell SM, Mui BL, Tam YK, Chen J, Du X, Butler D, Eltepu L, Matsuda S, Narayanannair JK (2012) Maximizing the potency of siRNA lipid nanoparticles for hepatic gene silencing in vivo . Angew Chem Int Ed 124: 8657–8661 [DOI] [PMC free article] [PubMed] [Google Scholar]
- Jung B, Staudacher JJ, Beauchamp D (2017) Transforming growth factor beta superfamily signaling in development of colorectal cancer. Gastroenterology 152: 36–52 [DOI] [PMC free article] [PubMed] [Google Scholar]
- Keith JM, Ensinger MJ, Moss B (1978) HeLa cell RNA (2′‐O‐methyladenosine‐N6‐)‐methyltransferase specific for the capped 5′‐end of messenger RNA. J Biol Chem 253: 5033–5039 [PubMed] [Google Scholar]
- Kim K, Skora AD, Li Z, Liu Q, Tam AJ, Blosser RL, Diaz LA, Papadopoulos N, Kinzler KW, Vogelstein B (2014) Eradication of metastatic mouse cancers resistant to immune checkpoint blockade by suppression of myeloid‐derived cells. Proc Natl Acad Sci USA 111: 11774–11779 [DOI] [PMC free article] [PubMed] [Google Scholar]
- Li A, Chen YS, Ping XL, Yang X, Xiao W, Yang Y, Sun HY, Zhu Q, Baidya P, Wang X et al (2017) Cytoplasmic m6A reader YTHDF3 promotes mRNA translation. Cell Res 27: 444–447 [DOI] [PMC free article] [PubMed] [Google Scholar]
- Li N, Kang Y, Wang L, Huff S, Tang R, Hui H, Agrawal K, Gonzalez GM, Wang Y, Patel SP et al (2020) ALKBH5 regulates anti‐PD‐1 therapy response by modulating lactate and suppressive immune cell accumulation in tumor microenvironment. Proc Natl Acad Sci USA 117: 20159–20170 [DOI] [PMC free article] [PubMed] [Google Scholar]
- Liu J, Yue Y, Han D, Wang X, Fu Y, Zhang L, Jia G, Yu M, Lu Z, Deng X et al (2014) A METTL3‐METTL14 complex mediates mammalian nuclear RNA N 6‐adenosine methylation. Nat Chem Biol 10: 93–95 [DOI] [PMC free article] [PubMed] [Google Scholar]
- Meyer KD, Saletore Y, Zumbo P, Elemento O, Mason CE, Jaffrey SR (2012) Comprehensive analysis of mRNA methylation reveals enrichment in 3′ UTRs and near stop codons. Cell 149: 1635–1646 [DOI] [PMC free article] [PubMed] [Google Scholar]
- Mu Y, Yan X, Li D, Zhao D, Wang L, Wang X, Gao D, Yang J, Zhang H, Li Y (2018) NUPR1 maintains autolysosomal efflux by activating SNAP25 transcription in cancer cells. Autophagy 14: 654–670 [DOI] [PMC free article] [PubMed] [Google Scholar]
- Muhammad N, Bhattacharya S, Steele R, Phillips N, Ray RB (2017) Involvement of c‐Fos in the promotion of cancer stem‐like cell properties in head and neck squamous cell carcinoma. Clin Cancer Res 23: 3120–3128 [DOI] [PMC free article] [PubMed] [Google Scholar]
- Otegbeye F, Ojo E, Moreton S, Mackowski N, Lee DA, de Lima M, Wald DN (2018) Inhibiting TGF‐beta signaling preserves the function of highly activated, in vitro expanded natural killer cells in AML and colon cancer models. PLoS One 13: e0191358 [DOI] [PMC free article] [PubMed] [Google Scholar]
- Pandey MK, Liu G, Cooper TK, Mulder KM (2012) Knockdown of c‐Fos suppresses the growth of human colon carcinoma cells in athymic mice. Int J Cancer 130: 213–222 [DOI] [PMC free article] [PubMed] [Google Scholar]
- Pandey RR, Delfino E, Homolka D, Roithova A, Chen K‐M, Li L, Franco G, Vågbø CB, Taillebourg E, Fauvarque M‐O (2020) The mammalian cap‐specific m6Am RNA methyltransferase PCIF1 regulates transcript levels in mouse tissues. Cell Rep 32: 108038 [DOI] [PubMed] [Google Scholar]
- Paris J, Morgan M, Campos J, Spencer GJ, Shmakova A, Ivanova I, Mapperley C, Lawson H, Wotherspoon DA, Sepulveda C et al (2019) Targeting the RNA m(6)a reader YTHDF2 selectively compromises cancer stem cells in acute myeloid leukemia. Cell Stem Cell 25: 137–148.e6 [DOI] [PMC free article] [PubMed] [Google Scholar]
- Paul S, Lal G (2017) The molecular mechanism of natural killer cells function and its importance in cancer immunotherapy. Front Immunol 8: 1124 [DOI] [PMC free article] [PubMed] [Google Scholar]
- Saez E, Rutberg SE, Mueller E, Oppenheim H, Smoluk J, Yuspa SH, Spiegelman BM (1995) c‐Fos is required for malignant progression of skin tumors. Cell 82: 721–732 [DOI] [PubMed] [Google Scholar]
- Satterlee JS, Basanta‐Sanchez M, Blanco S, Li JB, Meyer K, Pollock J, Sadri‐Vakili G, Rybak‐Wolf A (2014) Novel RNA modifications in the nervous system: form and function. J Neurosci 34: 15170–15177 [DOI] [PMC free article] [PubMed] [Google Scholar]
- Schwartz S, Mumbach MR, Jovanovic M, Wang T, Maciag K, Bushkin GG, Mertins P, Ter‐Ovanesyan D, Habib N, Cacchiarelli D et al (2014) Perturbation of m6A writers reveals two distinct classes of mRNA methylation at internal and 5′ sites. Cell Rep 8: 284–296 [DOI] [PMC free article] [PubMed] [Google Scholar]
- Sendinc E, Valle‐Garcia D, Dhall A, Chen H, Henriques T, Navarrete‐Perea J, Sheng W, Gygi SP, Adelman K, Shi Y (2019) PCIF1 catalyzes m6Am mRNA methylation to regulate gene expression. Mol Cell 75: 620–630.e9 [DOI] [PMC free article] [PubMed] [Google Scholar]
- Sharma P, Hu‐Lieskovan S, Wargo JA, Ribas A (2017) Primary, adaptive, and acquired resistance to cancer immunotherapy. Cell 168: 707–723 [DOI] [PMC free article] [PubMed] [Google Scholar]
- Su R, Dong L, Li C, Nachtergaele S, Wunderlich M, Qing Y, Deng X, Wang Y, Weng X, Hu C et al (2018) R‐2HG exhibits anti‐tumor activity by targeting FTO/m(6)a/MYC/CEBPA signaling. Cell 172: 90–105.e23 [DOI] [PMC free article] [PubMed] [Google Scholar]
- Sun H, Zhang M, Li K, Bai D, Yi C (2019) Cap‐specific, terminal N 6‐methylation by a mammalian m6Am methyltransferase. Cell Res 29: 80–82 [DOI] [PMC free article] [PubMed] [Google Scholar]
- Sung H, Ferlay J, Siegel RL, Laversanne M, Soerjomataram I, Jemal A, Bray F (2021) Global cancer statistics 2020: GLOBOCAN estimates of incidence and mortality worldwide for 36 cancers in 185 countries. CA Cancer J Clin 71: 209–249 [DOI] [PubMed] [Google Scholar]
- Tartell MA, Boulias K, Hoffmann GB, Bloyet LM, Greer EL, Whelan SPJ (2021) Methylation of viral mRNA cap structures by PCIF1 attenuates the antiviral activity of interferon‐beta. Proc Natl Acad Sci USA 118: e2025769118 [DOI] [PMC free article] [PubMed] [Google Scholar]
- Vu LP, Pickering BF, Cheng Y, Zaccara S, Nguyen D, Minuesa G, Chou T, Chow A, Saletore Y, MacKay M (2017) The N6‐methyladenosine (m6A)‐forming enzyme METTL3 controls myeloid differentiation of normal hematopoietic and leukemia cells. Nat Med 23: 1369–1376 [DOI] [PMC free article] [PubMed] [Google Scholar]
- Wang X, Lu Z, Gomez A, Hon GC, Yue Y, Han D, Fu Y, Parisien M, Dai Q, Jia G (2014) N 6‐methyladenosine‐dependent regulation of messenger RNA stability. Nature 505: 117–120 [DOI] [PMC free article] [PubMed] [Google Scholar]
- Wang X, Zhao BS, Roundtree IA, Lu Z, Han D, Ma H, Weng X, Chen K, Shi H, He C (2015) N6‐methyladenosine modulates messenger RNA translation efficiency. Cell 161: 1388–1399 [DOI] [PMC free article] [PubMed] [Google Scholar]
- Wang L, Hui H, Agrawal K, Kang Y, Li N, Tang R, Yuan J, Rana TM (2020) M(6) a RNA methyltransferases METTL3/14 regulate immune responses to anti‐PD‐1 therapy. EMBO J 39: e104514 [DOI] [PMC free article] [PubMed] [Google Scholar]
- Wang L, Sun J, Yin Y, Sun Y, Ma J, Zhou R, Chang X, Li D, Yao Z, Tian SJC et al (2021) Transcriptional coregualtor NUPR1 maintains tamoxifen resistance in breast cancer cells. Cell Death Dis 12: 1–16 [DOI] [PMC free article] [PubMed] [Google Scholar]
- Wei C, Gershowitz A, Moss B (1975) N6, O2'‐dimethyladenosine a novel methylated ribonucleoside next to the 5′ terminal of animal cell and virus mRNAs. Nature 257: 251–253 [DOI] [PubMed] [Google Scholar]
- Wei L‐H, Song P, Wang Y, Lu Z, Tang Q, Yu Q, Xiao Y, Zhang X, Duan H‐C, Jia G (2018) The m6A reader ECT2 controls trichome morphology by affecting mRNA stability in Arabidopsis . Plant Cell 30: 968–985 [DOI] [PMC free article] [PubMed] [Google Scholar]
- Xiao W, Adhikari S, Dahal U, Chen Y‐S, Hao Y‐J, Sun B‐F, Sun H‐Y, Li A, Ping X‐L, Lai W‐Y (2016) Nuclear m6A reader YTHDC1 regulates mRNA splicing. Mol Cell 61: 507–519 [DOI] [PubMed] [Google Scholar]
- Xu Y, Pasche B (2007) TGF‐β signaling alterations and susceptibility to colorectal cancer. Hum Mol Genet 16: R14–R20 [DOI] [PMC free article] [PubMed] [Google Scholar]
- Yang S, Wei J, Cui Y‐H, Park G, Shah P, Deng Y, Aplin AE, Lu Z, Hwang S, He C (2019) m6A mRNA demethylase FTO regulates melanoma tumorigenicity and response to anti‐PD‐1 blockade. Nat Commun 10: 2782 [DOI] [PMC free article] [PubMed] [Google Scholar]
- Yankova E, Blackaby W, Albertella M, Rak J, De Braekeleer E, Tsagkogeorga G, Pilka ES, Aspris D, Leggate D, Hendrick AG (2021) Small‐molecule inhibition of METTL3 as a strategy against myeloid leukaemia. Nature 593: 597–601 [DOI] [PMC free article] [PubMed] [Google Scholar]
- Zhang Q, Kang Y, Wang S, Gonzalez GM, Li W, Hui H, Wang Y, Rana TM (2021) HIV reprograms host m(6)Am RNA methylome by viral Vpr protein‐mediated degradation of PCIF1. Nat Commun 12: 5543 [DOI] [PMC free article] [PubMed] [Google Scholar]
- Zheng G, Dahl JA, Niu Y, Fedorcsak P, Huang C‐M, Li CJ, Vågbø CB, Shi Y, Wang W‐L, Song S‐H (2013) ALKBH5 is a mammalian RNA demethylase that impacts RNA metabolism and mouse fertility. Mol Cell 49: 18–29 [DOI] [PMC free article] [PubMed] [Google Scholar]
- Zhou P, Wan X, Zou Y, Chen Z, Zhong A (2020) Transforming growth factor beta (TGF‐β) is activated by the CtBP2‐p300‐AP1 transcriptional complex in chronic renal failure. Int J Biol Sci 16: 204–215 [DOI] [PMC free article] [PubMed] [Google Scholar]
Associated Data
This section collects any data citations, data availability statements, or supplementary materials included in this article.
Supplementary Materials
Expanded View Figures PDF
Table EV1
Dataset EV1
Dataset EV2
Dataset EV3
Dataset EV4
Source Data for Expanded View
Review Process File
PDF+
Source Data for Figure 1
Source Data for Figure 2
Source Data for Figure 3
Source Data for Figure 4
Source Data for Figure 5
Data Availability Statement
RNA‐seq and m6Am‐exo‐seq data were deposited at the Gene Expression Omnibus database (https://www.ncbi.nlm.nih.gov/geo/) under accession number GSE175803.