

Abstract
Proteins exit from endosomes through tubular carriers coated by retromer, a complex that impacts cellular signaling, lysosomal biogenesis and numerous diseases. The coat must overcome membrane tension to form tubules. We explored the dynamics and driving force of this process by reconstituting coat formation with yeast retromer and the BAR‐domain sorting nexins Vps5 and Vps17 on oriented synthetic lipid tubules. This coat oligomerizes bidirectionally, forming a static tubular structure that does not exchange subunits. High concentrations of sorting nexins alone constrict membrane tubes to an invariant radius of 19 nm. At lower concentrations, oligomers of retromer must bind and interconnect the sorting nexins to drive constriction. Constricting less curved membranes into tubes, which requires more energy, coincides with an increased surface density of retromer on the sorting nexin layer. Retromer‐mediated crosslinking of sorting nexins at variable densities may thus tune the energy that the coat can generate to deform the membrane. In line with this, genetic ablation of retromer oligomerization impairs endosomal protein exit in yeast and human cells.
Keywords: endosomes, lysosomes, membrane traffic, retromer, yeast
Subject Categories: Membranes & Trafficking
In vitro reconstitution of the yeast retromer complex supports that the energy provided by the SNX‐BAR coat to deform membranes can be adjusted through apposition and oligomerization of retromer complex, allowing this coat to operate over a wide range of endosomal membrane tension.

Introduction
Endosomes and lysosomes form a complex network of interconnected organelles of different composition and function. They exchange proteins through fusion and fission with each other and, in a more selective fashion, through endosomal transport carriers (ETCs). ETCs are tubulo‐vesicular structures bulging from the limiting membrane of these organelles. The formation of ETCs comprises several steps: Cargo selection, membrane deformation and detachment from the donor organelle through membrane fission. Alternatively, cargo can also pass between endo‐lysosomal compartments through kiss‐ and‐run, a transient fusion between two endo‐lysosomal organelles followed by immediate re‐fission (Luzio et al, 2014; Solinger et al, 2020). In mammalian cells, ETCs form through a variety protein coats, such as SNX17‐retriever (McNally et al, 2017), CCC (Phillips‐Krawczak et al, 2015; Bartuzi et al, 2016), ESCPE‐1 (Rojas et al, 2007; Simonetti et al, 2019), SNX27‐retromer (Lauffer et al, 2010; Temkin et al, 2011; Steinberg et al, 2013; Simonetti et al, 2022), SNX3‐retromer (Rojas et al, 2007; Strochlic et al, 2007; Harterink et al, 2011; Harrison et al, 2014; Lucas et al, 2016; Deatherage et al, 2020) and SNX‐BAR‐retromer (Seaman et al, 1998).
Retromer is a conserved tubular membrane coat (Seaman, 2021). It was originally identified in yeast as a stable complex that can be dissociated into two parts: the SNX‐BAR complex, consisting of the sorting nexins Vps5 and Vps17, and the peripheral retromer complex (Vps26, Vps29 and Vps35; Seaman et al, 1998). The SNX‐BAR complex binds membranes through PX domains, which recognize phosphatidylinositol‐3‐phosphate (PI3P), and through BAR domains, which bind highly curved membranes (Burda et al, 2002; Carlton et al, 2004; Peter et al, 2004). The SNX‐BAR complex recruits retromer, which by itself shows only weak affinity for the membrane, although it can interact with the bilayer when bound to other sorting nexins, such as Snx3/Grd19 (Strochlic et al, 2007; Lucas et al, 2016; Purushothaman & Ungermann, 2018; Deatherage et al, 2020; Leneva et al, 2021). Since mammalian Vps26/Vps29/Vps35 complex does not form stable assemblies with SNX‐BAR proteins that can be isolated, Vps26/Vps29/Vps35 alone is referred to as the retromer complex in non‐yeast systems (Burd & Cullen, 2014; Yong et al, 2022). Like mammalian retromer, however, the yeast complex associates with numerous other factors, which are important for the formation of the transport carriers and/or their fission from the membrane. These include components of the Rab‐GTPase system such as the yeast Rab7 homologue Ypt7 (Rojas et al, 2008; Seaman et al, 2009; Balderhaar et al, 2010; Liu et al, 2012; Jia et al, 2016; Purushothaman & Ungermann, 2018), Rab5‐family GEFs (Bean et al, 2015) and the PROPPIN Atg18 (Courtellemont et al, 2022). To avoid confusion between retromer nomenclature in yeast and mammalian systems, we shall refer to the yeast Vps26/Vps29/Vps35 complex as retromer and to the yeast Vps5/Vps17 complex as SNX‐BARs in this manuscript.
Structural studies of sorting nexins and retromer begin to elucidate how these coats wrap around membranes and how they recruit cargo (Collins et al, 2005, 2008; Hierro et al, 2007; Lucas et al, 2016; Purushothaman et al, 2017; Kovtun et al, 2018; Kendall et al, 2020; preprint: Kendall et al, 2022a; Leneva et al, 2021; Zhang et al, 2021). A further mechanistic analysis of the formation of ETCs and their fission from endo‐lysosomal compartments will, however, require complementing dynamic data from in vitro systems that reproduce the formation and fission of ETCs in a well‐defined, tunable and optically well‐resolved setting. Attempts in this direction have already been undertaken. Retromer coat produces tubules on giant unilamellar vesicles (GUVs; Purushothaman et al, 2017; Purushothaman & Ungermann, 2018). Those are hard to quantify because the tubules are numerous and difficult to resolve by light microscopy. Retromer oligomerization could also be followed on supported planar lipid bilayers (Deatherage et al, 2020), where protein interactions can be studied very well. But such a system appears less apt for observing tubulation by the coat and fission.
We engaged in an in vitro characterization of Saccharomyces cerevisiae retromer because our studies on membrane fission on yeast vacuoles and mammalian endosomes revealed the PROPPINs Atg18 and WIPI1, respectively, as crucial factors (Peters et al, 2004; Zieger & Mayer, 2012; Gopaldass et al, 2017; DeLeo et al, 2021). Atg18 integrates with retromer to form the CROP complex (Courtellemont et al, 2022; Marquardt et al, 2022), which displays much more potent membrane fission activity than the PROPPIN alone. To generate a system that may allow to analyze the mechanistic relationship of CROP, retromer and other factors involved in membrane fission (Peters et al, 2004; Baars et al, 2007; Michaillat et al, 2012; Michaillat & Mayer, 2013), we used oriented lipid tubules on glass supports (Dar et al, 2015). The tubules allow to quantitatively follow the formation of the coat on them, a property which we exploited for an analysis of the properties and dynamics of retromer.
Results
Supported membrane tubes (SMTs; Dar et al, 2015) are individually observable tubular membranes that are immobilized and amenable to quantitative optical analysis. SMTs can be generated by liquid flow through a microfluidic chamber carrying lipid spots on its glass bottom. The flow produces arrays of parallel membrane tubes, which probably become stabilized in this orientation by occasional contacts with non‐coated spots of the glass surface. Such SMTs allow to image the behavior of proteins on the tubes over extended periods of time. The tube diameters can be quantified via a low percentage of incorporated fluorescent lipidic tracers because the fluorescence per unit tube length will depend on the number of fluorescent lipids in that unit, and hence upon the radius of the tube. We adapted this system to study the formation of retromer coats from S. cerevisiae.
Retromer and SNX‐BAR complex cooperate to constrict pre‐formed membrane tubules to a uniform radius
To visualize coat formation by retromer (Vps26/Vps29/Vps35) and SNX‐BAR (Vps5/Vps17) complexes, an SMT array was formed on a coverslip that was covalently coated with polyethylene glycol and mounted in a flow chamber. The SMTs were labeled through 1 mol% of Texas Red DHPE and contained 5% PI3P, because this phosphoinositide is required to recruit SNX‐BAR proteins onto membranes (Cheever et al, 2001; Song et al, 2001; Yu & Lemmon, 2001). Upon addition of purified recombinant SNX‐BAR complex and retromer carrying mClover‐tagged Vps29 (Appendix Fig S1A and B), spinning disc fluorescence microscopy revealed uniform membrane binding of retromer within seconds (Fig 1A, Movie EV1). PI3P and SNX‐BARs were necessary to recruit retromer to the tubes (Appendix Fig S2A). About one minute after addition of SNX‐BARs and retromermClover, the mClover‐signal strongly accumulated at multiple discrete sites on a tubule, suggesting that retromer was concentrating into separate protein domains (Fig 1A, Movie EV1). The domains elongated over time, as visualized by kymograph analysis (Fig 1B). Co‐labelling of retromer and SNX‐BARs with mRuby and GFP, respectively, revealed that the zones where both retromermRuby and SNX‐BARGFP were concentrated mirrored precisely zones of decreased lipid fluorescence, in this case visualized through the lipid tracer Cy5.5‐PE (Fig 1C and D). The concentrations necessary for domain‐formation by SNX‐BARs and retromer varied from one preparation to another and were in general in the range of 10–25 nM. For this reason, the SNX‐BAR concentrations used were adapted as a function of the activity of the individual preparation used. Domains did not form in the absence of retromer when SNX‐BARs were used at low concentrations of around 10 nM (Fig 1E). However, domains could be formed by SNX‐BARs alone when they were used at elevated concentrations (Fig 1F–H, Movie EV2). For a given preparation, this always required SNX‐BAR concentrations 5–10 times above those that sufficed to generate domains in the presence of retromer.
Figure 1. Assembly of retromer coats on supported membrane tubes.
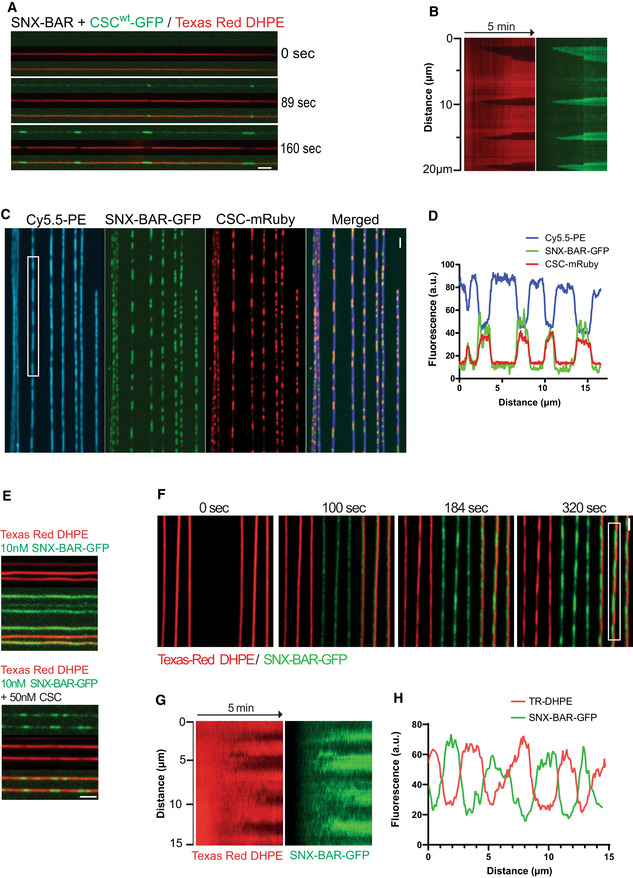
- Dynamics of scaffold formation. 25 nM SNX‐BARs and 25 nM retromermClover in PBS were added to SMTs and imaged by confocal microscopy at a frame rate of 1 Hz for 5 min. Scale bar: 2 μm.
- Kymograph of the tubule shown in (A). See Movie EV1.
- SNXGFP colocalizes with retromermRuby on SMTs. SMTs containing 1 mol % of the fluorescent lipid Cy5.5‐PE were incubated with 25 nM of SNXGFP and retromermRuby for 2 min. Then, the tubes were imaged by confocal microscopy. Scale bar: 2 μm.
- Line scan analysis along the boxed tubule from (C).
- Scaffold formation at low SNX‐BARs concentration is facilitated by retromer. SMTs were incubated as in (A), using 10 nM SNX‐BARGFP complex in combination with either 50 nM retromer or only control buffer. Scale bar: 2 μm.
- Scaffold formation by elevated concentrations of SNX‐BARs alone. 100 nM SNX‐BARs‐GFP was added to SMTs and imaged by confocal microscopy at a rate of 0.5 Hz for 5 min. Scale bar: 2 μm.
- Kymograph of the tubule highlighted in (F).
- Line scan analysis of the tubule highlighted in (F). This experiment is also shown in Movie EV2.
The protein‐enriched domains showed a strong reduction in lipid fluorescence (Fig 1A–C, Appendix Fig S2B and C). The decrease in fluorescence was not due to a change in the direct environment of the fluorescent lipid upon protein binding (Jung et al, 2009; Hsieh et al, 2012), as we could observe the same effect using alternative lipid probes, which carry the fluorophore either on the membrane surface (Texas Red DHPE, Cy5.5‐PE) or inside the hydrophobic part of the bilayer (NBD‐PC; Appendix Fig S2B; Fig 1C and D). Therefore, we attribute the decrease in lipid fluorescence to a reduction in the amount of lipid underneath the protein domain, that is, to a reduced radius of the membrane tube.
The radius of the membrane tubes in the constricted domains could be estimated using dynamin as a reference. Dynamin constricts membrane tubes to a defined radius of 11.2 nm (Roux et al, 2010). The lipid fluorescence in the SMTs can thus be calibrated and their radius can be deduced (Dar et al, 2015; see Materials and Methods and Fig EV1 for details). This method revealed that the radius of membrane tubes underneath the retromer/SNX‐BARs domains was 19.1 ± 0.6 nm (Fig 2A–D). This radius was the same for membrane tubes constricted by high concentrations of SNX‐BARs alone. Domains formed by SNX‐BARs alone remained competent to bind retromermClover in a second incubation phase (Fig 2E and F). However, the recruitment of retromermClover had no effect on lipid fluorescence under the pre‐formed domains (Fig 2G), suggesting that the tubes maintained their radius. This invariant radius was independent of the initial radius of the non‐constricted tube, both for SNX‐BARs/ retromermClover and for SNX‐BARs‐only domains (Fig 2D). Thus, in agreement with structural studies (Hierro et al, 2007; Lucas et al, 2016; Purushothaman et al, 2017; Kovtun et al, 2018; Kendall et al, 2020; Leneva et al, 2021; Zhang et al, 2021), both retromer and SNX‐BARs contribute to a constriction of the membrane tubes, probably by forming the retromer coat. SNX‐BAR complex alone has membrane scaffolding activity, which defines the diameter of the coat independently of retromer, but retromer allows coat formation at lower SNX‐BAR complex concentrations.
Figure EV1. Procedure for quantifying constrictions along tubules.
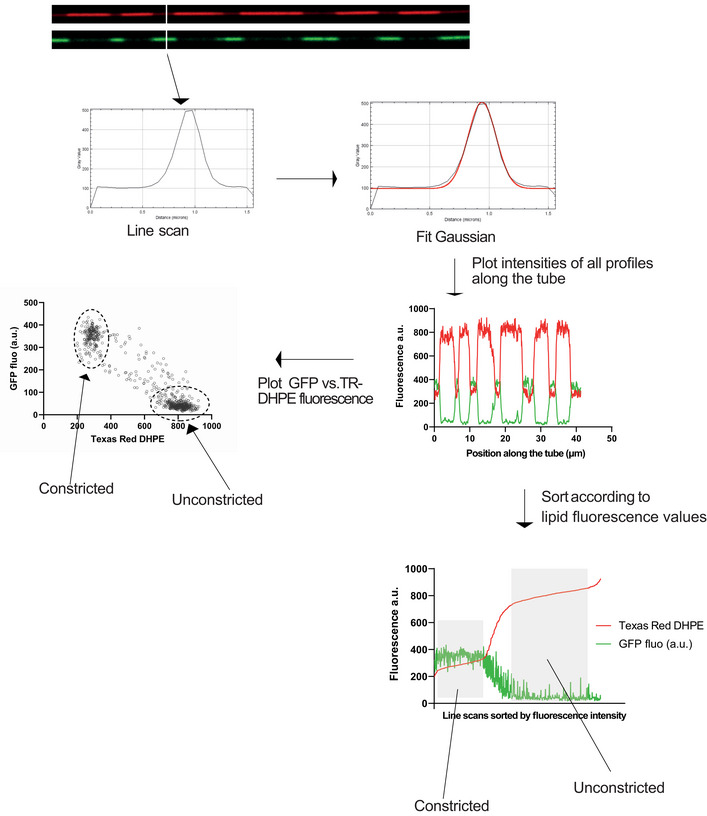
A series of line scans were performed along the entire length of an SMT, perpendicular to the tube. For each line scan, a Gaussian curve was fitted, and the maximum height of the coat signal (e.g., GFP) and the lipid signal (e.g., Texas Red DHPE) were extracted. The maximum height was then plotted against the intensity of the lipid signal along the same scan. This was performed for every line scan along the tube, yielding two populations. The number of dots in each population is a measure for the length of constricted and non‐constricted regions. For each tube, the zones corresponding to the constricted and non‐constricted areas were determined manually and their mean fluorescence value was used to calculate the tube diameter by comparison with the signals obtained with dynamin‐coated tubes. The mean fluorescence intensity of the tube under the protein scaffold was equated to the tube radius by I = K × R where I is the tube fluorescence under the scaffold and R is the tube radius. Using Dynamin (R = 11.2 nm) we can then calculate the calibration constant K.
Figure 2. Constriction of membrane tubes by SNX‐BARs and SNX‐BARs/retromer.
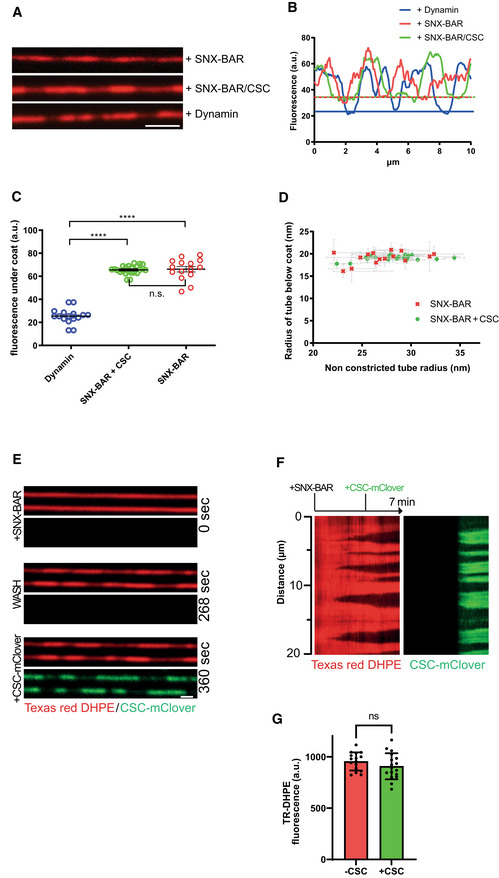
- SMTs labeled with Texas‐Red DHPE were incubated with non‐tagged proteins at 25°C for 3–5 min and analyzed by fluorescence microscopy. Proteins were used at the following concentrations: 100 nM SNX‐BARs; 25 nM SNX‐BARs/25 nM retromer; 50 nM dynamin. Scale bar: 2 μm.
- Line scan analysis along the tubules from (A). The lower boundaries of fluorescence are indicated by horizontal lines in the respective colors.
- Distribution of Texas‐Red DHPE fluorescence in constricted domains for tubules coated by SNX‐BARs (n = 16), SNX‐BARs plus retromer (n = 18), or dynamin (n = 15). Error bars represent the standard deviation from the mean. P‐values were calculated by Welch's t‐test. ****P < 0.0001.
- Constricted domain radius as a function of starting (non‐constricted) tube radius. Radii of constricted and non‐constricted regions of a variety of lipid tubes were determined using the known diameter of a dynamin‐coated tube as a reference. Experiments were performed as in (A), using 25 nM SNXs (n = 16) or 25 nM SNX‐BARs plus 25 nM retromer (n = 18). Error bars represent the standard error from the mean.
- Binding of retromermClover to constricted SNX‐BARs domains. SMTs were first incubated with 100 nM SNX‐BARs for 2 min at 25°C until constriction zones were visible through reduced lipid fluorescence. Then, 50 nM retromermClover was added under continuous acquisition at 0.5 Hz. Scale bar: 2 μm.
- Kymograph of a tubule from (E).
- Quantification of Texas‐Red‐DHPE fluorescence under the constriction zones before and after retromermClover addition (n = 16 tubes). Error bars represent the standard error from the mean. P‐values were calculated by Welch's t‐test. n.s.: not significant (P = 0.235).
Retromer coats grow rapidly and bidirectionally
Cryo‐EM analyses of retromer uncovered that the interface between the two Vps35 subunits of a retromer arch was asymmetric and that these subunits differed in overall structure (Leneva et al, 2021). It was proposed that this asymmetry might render coat assembly directional. Since the SMTs allow to observe coat growth in real time, we tested this hypothesis. To this end, we first generated small red‐fluorescing constricted coats using SNX‐BARs and retromermRuby complexes. After a brief wash with protein‐free buffer, SNX‐BARs and retromermClover were added (Fig 3A–C). The green‐fluorescing retromermClover extended the pre‐existing red‐fluorescing constricted zones that had been formed by retromermRuby during the first incubation. The extension speed of the coat was substantial, ranging from 1 to 1.5 μm/min. This is in a similar range as the speed of dynamin polymerization (Roux et al, 2010). The elongation speed of this coat can also be put into perspective by comparison to the speeds of polymerization of actin tails (up to 3.6 μm/min; Cameron et al, 1999) or microtubules (10 μm/s; Gierke et al, 2010). Based on the proposed structure of the retromer coat (Kovtun et al, 2018), we estimate the observed extension speed to require the addition of approximately 10 to 15 SNX‐BAR dimers per second at each end. RetromermClover/SNX‐BARs elongated both ends of the pre‐existing red‐fluorescing coats at similar rates (Fig 3B and C). Thus, despite the asymmetry in the arches (Leneva et al, 2021), the retromer coat displayed no inherent directionality of growth.
Figure 3. Bidirectional elongation of the coat.
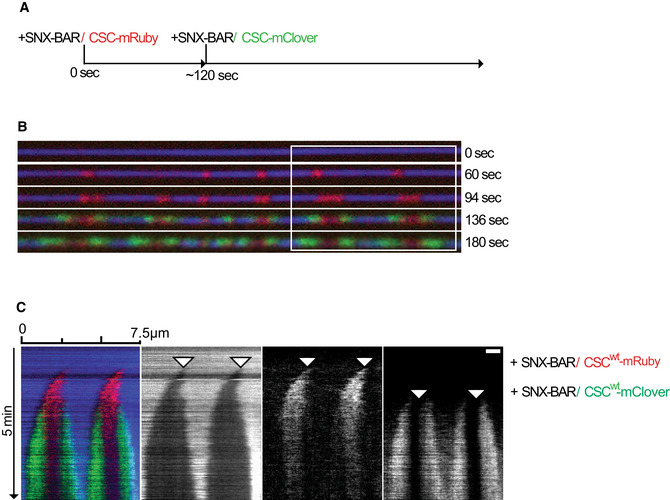
- Scheme of the experiment.
- Representative tube of the experiment performed as described in (A). Tubes were imaged by confocal microscopy at a framerate of 0.5 Hz. Scale bar: 2 μm.
- Kymograph of the tubule shown in (B). Arrowheads show the origin of coat polymerization.
The retromer coat forms a static scaffold that stabilizes membrane tubules
Structural studies of retromer‐coated tubules formed with Vps5 in the absence of Vps17 revealed that these retromer coats are irregular in terms of their coverage with protein and that retromer oligomerizes into arch‐like structures on the sorting nexins (Kovtun et al, 2018; Leneva et al, 2021). The irregularity raises several questions: Does the tubular coat represent a static structure, or is it rather dynamic, with subunits readily moving in and out? Does retromer facilitate SNX‐BAR coat formation by oligomerization and does the apparent variability in the occupancy of the SNX‐BAR layer by retromer have functional implications?
The formation of a static structure by SNX‐BARs/retromer implies that the proteins might form a rigid coat that stabilizes the underlying membrane tubule. To test this, we used an assay where a membrane tubule is pulled out of a giant unilamellar vesicle (GUV) by means of an optical trap. Through analyzing the displacement of the bead in the trap, such a setup allows direct measurement of the force required to generate and maintain the tubule (Roux et al, 2010). Shortly after SNX‐BARs/retromermClover addition, protein bound the pulled tubule (Fig 4A). Consequently, the pulling force exerted on the bead decreased sharply (Fig 4B). Elongating this tubule by displacing the GUV transiently increased in the force again (Fig 4C and D), but as the SNX‐BARs/retromermClover coat grew along the newly extracted portion of the tubule (Fig 4E), the force decreased again. This could be repeated several times (Fig 4D). A similar decrease in force was observed when SNX‐BAR complex alone was used (Fig EV2A and B). Together, these data suggest that the SNX‐BARs/retromer coat forms a scaffold of sufficient rigidity to stabilize a membrane tubule.
Figure 4. Stabilization of pulled membrane tubes by retromer/SNX‐BARs.
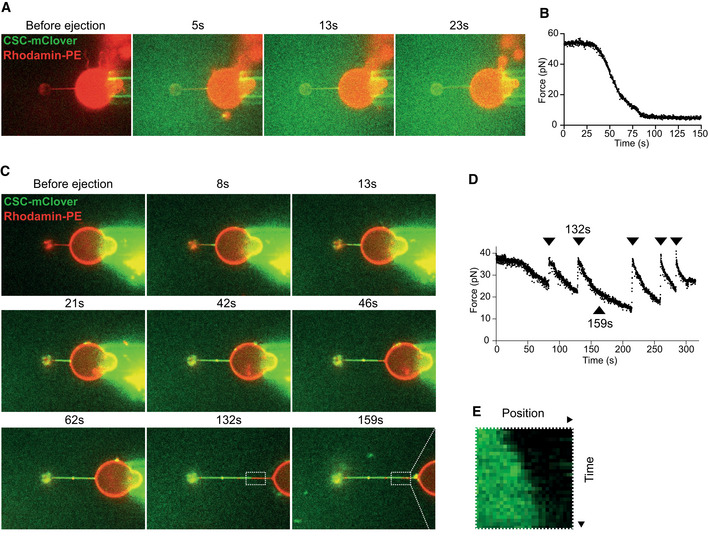
- Coat formation on a pulled membrane tubule. Confocal pictures of a GUV labeled with Rhodamine‐DHPE (red). A membrane tubule has been pulled from the GUV through a small bead and optical tweezers. The GUV is shown before and at several time points after ejection of SNX‐BARs/retromermClover (green) from a pipette in the vicinity of the GUV. The images shown are representative of a total of five tubes analyzed, which all showed similar behavior.
- Measurement of the force exerted on the bead as a function of time after protein ejection, taken from the experiment shown in (A).
- Repetitive pulling and stabilization. Confocal pictures of a GUV labeled with Rhodamine‐DHPE (red). A tubule has been pulled as in (A) and SNX‐BARs/retromermClover (green) was added. The GUV is shown before and after protein ejection, and at several stages of subsequent re‐pulling and stabilization through additional coat recruitment. Protein quickly populates new tube regions generated by pulling back the GUV. The images are representative of a total of five tubes analyzed.
- Measurement of the force exerted on the bead as a function of time for the experiment shown in (C). Arrowheads mark the timepoints when the GUV has been pulled back.
- Kymograph of the portion of the tubule boxed in (D), showing growth of retromer coat into a newly pulled portion of the tubule.
Figure EV2. Stabilization of pulled membrane tubes by SNX‐BARs.
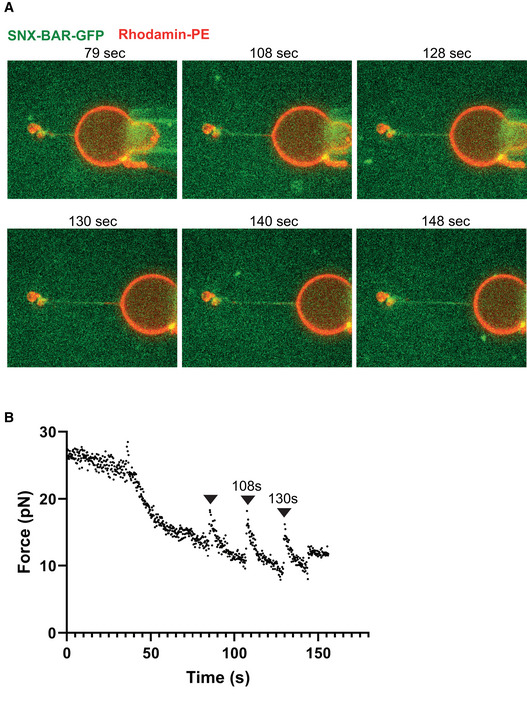
- Repetitive pulling and stabilization. Confocal pictures of a GUV labeled with Rhodamine‐DHPE (red). A tubule has been pulled as in (A) and SNX‐BAR‐GFP (green) was added. The GUV is shown at several stages of subsequent re‐pulling and stabilization through additional coat recruitment. Protein quickly populates new tube regions generated by pulling back the GUV. The images show a representative experiment. Equivalent behavior was observed with another, independently prepared tube.
- Measurement of the force exerted on the bead as a function of time for the experiment shown in (A). Arrowheads mark the timepoints when the GUV has been pulled back.
Next, we assayed whether the coats are saturated, using SNX‐BARs and retromer separately in a two‐stage experiment. Constricted coats on SMTs were pre‐formed from SNX‐BARs and red‐fluorescing retromermRuby complexes. Non‐bound proteins were washed away, and, in a second incubation, we added either green‐fluorescing SNX‐BARGFP complex or retromermClover (Fig 5A and B). SNX‐BARGFP was recruited to the non‐constricted areas of the tubes but could not integrate into the constricted domains, suggesting that the membrane in these domains was fully covered. By contrast, retromermClover bound mainly to the constricted domains. RetromermClover was not recruited in exchange for pre‐bound retromermRuby, which might have dissociated from the constriction, because the retromermRuby signal in the constricted domains remained constant after the addition of retromermClover (Fig 5C). This suggests that the constricted domains are saturated for SNX‐BARs but retain free binding sites for additional retromer. Furthermore, the coat does not appear to exchange subunits with the soluble pool of proteins and is hence a fairly static structure.
Figure 5. Variable saturation of the SNX‐BARs layer with retromer.
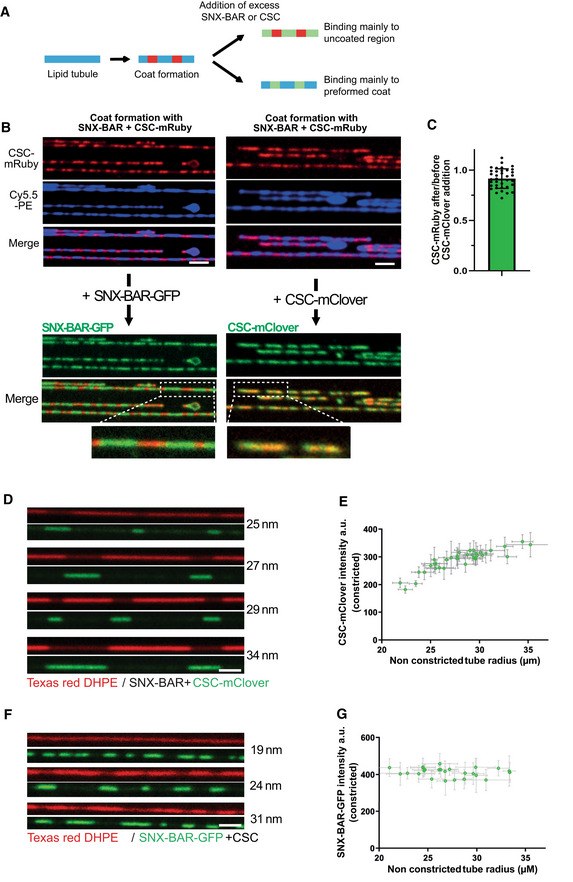
- Recruitment of additional subunits to pre‐formed coats using differentially labeled retromer and SNX‐BARs. Scheme of the experiment shown in (B) and (C).
- Coats were formed on SMTs using 25 nM SNX‐BARs and 25 nm retromermRuby. Excess protein was washed out with buffer, and 50 nM SNXGFP or 50 nM retromermClover was added. SMTs were imaged after SNX‐BARs/retromermRuby coat formation and 2 min after addition of retromermClover or SNXGFP. Scale bar: 2 μm. A magnification showing constriction zones for each panel is shown.
- Ratio of retromermRuby signals in the constricted areas before and after addition of retromermClover. Quantification of the experiment in (B). 36 coats from 10 different tubes were analyzed. Means and SEM are shown.
- Occupation of SNX‐BARs domains with retromer as a function of the starting radius of the tube (naked tube radius). Arrays of SMTs were incubated with 25 nM SNX‐BARs and 25 nM retromermClover. The density of retromermClover in constricted domains was traced through its fluorescence signal. The starting radius of the tube was estimated through Texas Red‐DHPE fluorescence in non‐constricted regions and calibration with dynamin. This radius is indicated for each tube. Scale bar: 2 μm.
- The density of retromermClover in SNX‐BARs/retromermClover coats from (D) was plotted as a function of the radius of the non‐constricted tube. 36 tubes were analyzed. Error bars represent the standard error of the mean.
- Experiment as in (D) using 25 nM SNXGFP and 25 nM retromer.
- The fluorescence signals of SNXGFP in SNX‐BARs/retromer coats from (F) were quantified plotted as a function of the radius of the non‐constricted tube as in (E). 26 tubes were analyzed. Error bars represent the standard error of the mean.
Retromer density may define the work that the coat performs in deforming membranes
Binding of retromer adds further interactions to the SNX‐BAR layer (Lucas et al, 2016; Kovtun et al, 2018; Leneva et al, 2021) and could hence provide additional energy for membrane deformation. This led us to test whether coat stoichiometry might vary as a function of the radius of the starting tubule, because constricting a less curved membrane requires more work (Roux, 2013). To this end, we compared the density of retromer in constricted coats that had been formed on membrane tubes of different starting radius. The SMT system is very apt for this analysis because it simultaneously generates many tubes of variable radii on the same slide. Calibration via the integrated fluorescent lipids showed that these “naked tube” radii varied mostly from 20 to 40 nm under the conditions we employed. We measured the radius of non‐constricted regions to approximate the starting radius of the tube and then measured the signals of SNX‐BARGFP and retromermClover in the constricted domains of that tube. Although retromermClover fluorescence per unit length of constricted tube increased as a function of starting tube radius (Fig 5D and E), the density of SNX‐BARGFP in the constricted domains was independent of the starting tube radius (Fig 5F and G). Thus, the larger the starting tube, the more retromer is incorporated by the coat during its constriction. Since the energy required to constrict a membrane tube to a defined diameter increases with its initial radius, this suggests that the work that the SNX‐BARs perform to constrict the membrane may be tuned through the density of retromer complexes that are incorporated to connect them.
Retromer oligomerization supports coat constriction
Retromer arches can connect multiple SNX‐BARs and they can oligomerize (Lucas et al, 2016; Kovtun et al, 2018; Deatherage et al, 2020; Kendall et al, 2020; preprint: Kendall et al, 2022a). Oligomerization might provide additional bonds for membrane deformation by the coat and/or facilitate coat assembly by constraining the subunits in an orientation relative to each other that is best compatible with a constricted lipid tube. In both cases, the capacity of retromer to oligomerize should play an important role for driving the formation of constricted domains. Structural studies showed that retromer forms dimers through a conserved interface on Vps35 (Kendall et al, 2020; Leneva et al, 2021). To assess the contribution of retromer dimerization on coat formation, we used the PDB‐PISA software (https://www.ebi.ac.uk/pdbe/pisa/) to model the Vps35‐Vps35 dimerization interface, using a retromer Cryo‐EM structure (Leneva et al, 2021) as an input. PDB‐PISA calculates the energy contribution of each residue to a protein–protein interaction surface. This approach predicts residues to form hydrogen bonds or salt bridges between the two Vps35 subunits. We selected the conserved Vps35 residues D671, L722, K726 and R775 for substitution by alanine, yielding the vps35 PISA allele (Fig 6A and B). We also generated vps35 AAA3KE , in which another set of conserved residues in the interaction region is substituted. The AAA3KE substitutions abolish the capacity of mammalian VPS35 to self‐associate and lead to partial secretion of the vacuolar protease CPY in yeast (Kendall et al, 2020). All these substituted residues contribute to an asymmetric Vps35‐Vps35 interface (Leneva et al, 2021). We purified retromer complexes containing both Vps35 variants from yeast (Fig 6C) and tested their capacity to form higher‐order oligomers by blue native gel electrophoresis (Fig 6D). Non‐substituted retromerwt migrated in three main bands at apparent molecular masses compatible with a Vps29mClover‐containing monomer of retromer (207 kDa), a dimer (414 kDa) and a tetramer (828 kDa; see Appendix Fig S3 for details on the tentative assignment of the bands to monomer, dimer and tetramer). The most slowly migrating species was abolished in retromer from vps35 AAA3KE cells and weaker in retromer from vps35 PISA , while the intermediate‐sized forms persisted. This suggests that the slowest form represents a retromer tetramer held together by Vps35 dimerization, whereas the dimer may persist through a Vps26‐Vps26 interface (Kovtun et al, 2018; Kendall et al, 2022b).
Figure 6. Substitutions destabilizing the Vps35‐Vps35 interface.
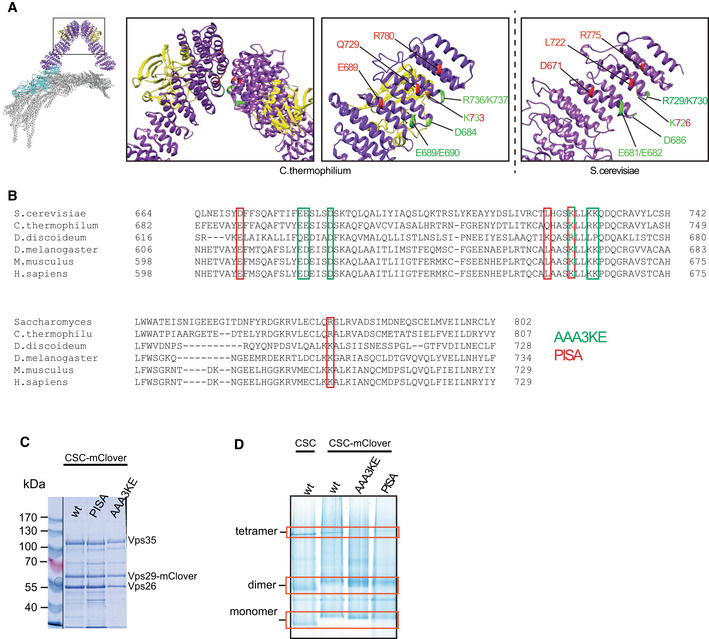
- Structure of the pentameric retromer complex (Kovtun et al, 2018; Leneva et al, 2021). The boxes highlight the Vps35 dimerization interface. Residues substituted in vps35 PISA and vps35 AAA3KE are shown red and green, respectively, in the structure from (C). thermophilum and in a model of the Saccharomyces cerevisiae complex derived from the Chaetomium thermophilum structure (PDB 7BLR) using the online modeling tool Swiss‐model (https://swissmodel.expasy.org).
- Sequence alignment of the Vps35 dimerization domains from different species. Amino acids substituted in vps35 PISA and vps35 AAA3KE are shown in red and green, respectively. One residue (in red‐green) is shared between the two.
- Coomassie‐stained SDS–PAGE gel of purified retromermClover complexes containing the indicated Vps35 variants.
- Blue native PAGE gel showing the formation of higher‐order assemblies for retromermClover complexes containing Vps35 variants and their tentative assignment as monomers, dimers and tetramers. The samples loaded stem from the same protein preparation as in (C). The bands for monomer, dimers and tetramer (red boxes) are linked to retromer because they show altered migration upon addition of the mClover tag (monomer and dimer), or are destabilized by the PISA and AAA3KE substitutions (tetramer). See also Appendix Fig S3.
We performed SMT assays to assess the capacity of both retromer variants to form constricted domains. To avoid potential influences of the retromer variants on the speed or extent of SNX‐BAR recruitment to the tubes, the experiments were performed in two phases. A first incubation at low SNX‐BARs concentration (25 nM) allowed this complex to bind the tubes without forming constricted domains (Fig 7A and B). Unbound SNX‐BAR complex was washed away before retromermClover variants were added for the second incubation phase. RetromermClover with Vps35AAA3KE and Vps35PISA was recruited to the prebound SNX‐BARs with similar kinetics and to similar extent as the wildtype complex (Fig 7B–D). However, only wildtype retromer drove the formation of constricted domains (Fig 7B and C). The retromer variants also failed to drive constriction when they were co‐incubated with SNX‐BARs right from the beginning in a one‐phase experiment (Fig EV3A and B). That the retromer variants were in principle able to bind a constricted SNX‐BARs layer was shown by a further experiment, in which constricted SNX‐BARs‐only coats were pre‐formed in a first incubation phase at high SNX‐BARs concentration. Retromer AAA3KE‐mClover and retromerPISA‐mClover bound to those pre‐formed constrictions similarly to the wildtype complex (Fig EV3C and D). Together, these results suggest that higher‐order self‐assembly of retromer via the conserved Vps35 interface is necessary to drive membrane constriction by the SNX‐BARs/retromer coat.
Figure 7. Effect of Vps35 dimerization on coat constriction.
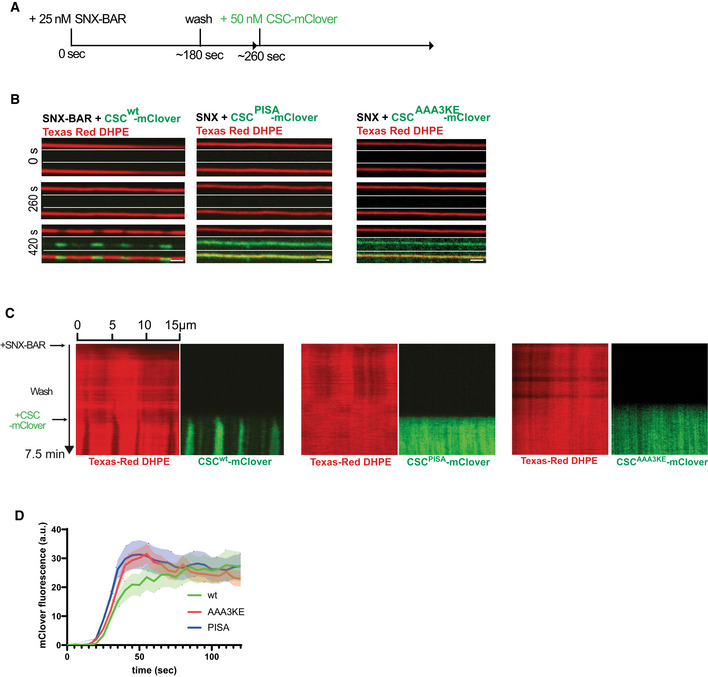
- Experimental setup: supported membrane tubes (SMTs) labeled with Texas Red DHPE were preincubated with 25 nM SNX‐BARs for 3 min to load them with SNX‐BARs but not allow formation of constrictions. After a wash with protein‐free buffer, 50 nM of retromermClover carrying the indicated Vps35 variants was added. The tubes were imaged by confocal microscopy at a framerate of 0.5 Hz.
- Images of three timepoints after addition of retromermClover variants. Scale bar: 2 μm.
- Quantification of retromermClover recruitment over time. SMTs were incubated as in (A). mClover fluorescence appearing along the entire length of the tubes during the second incubation phase was quantified over time. n = 10 tubes per variant. Curves represent the mean and shaded areas around the curves represent the SEM.
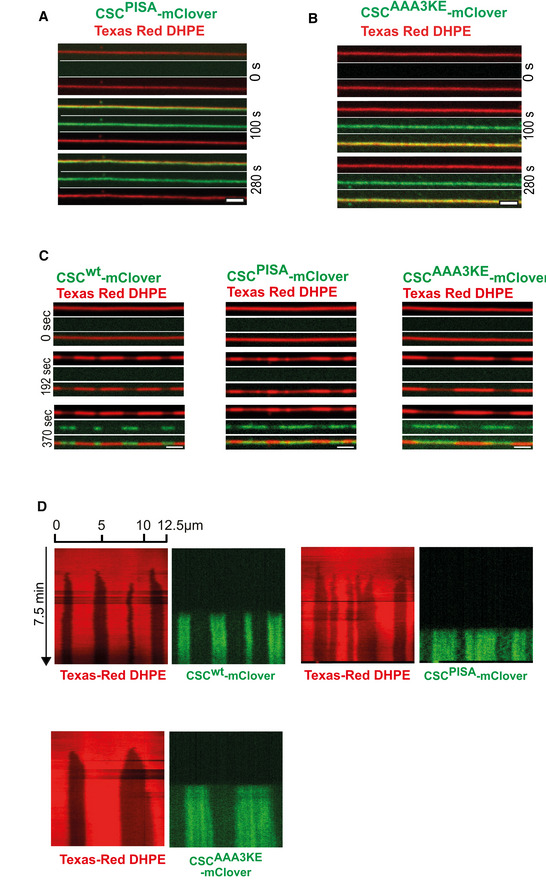
Figure EV3. Lack of constricted domain formation after co‐incubating SNX‐BARs with retromer containing vps35 PISA or vps35 AAA3KE .
-
A, BSMT assay with the dimerization mutants. 50 nM SNX‐BARs and 50 nM of retromermClover carrying the indicated Vps35 variants were incubated with SMTs and imaged by confocal microscopy. Note that for retromerwt already 25 nM reliably induces constrictions. The higher concentration chosen for the substituted retromer complexes is safely above that critical threshold and provides rapid formation of constrictions. Scale bars: 2 μm.
-
CBinding of retromer variants to pre‐formed SNX‐BARs domains. SMTs were incubated with high SNX‐BARs concentration (100 nM) for 2 min to pre‐form constrictions zones. Unbound SNX‐BARs were washed away and 50 nM retromermClover containing the indicated Vps35 variants was added. Panels show tubes before SNX‐BARs addition (0 s), after the formation of SNX‐BARs only coats (192 s) and after incubation with retromermClover variants (370 s). Tubes were imaged by spinning disc confocal microscopy at 0.5 Hz throughout the experiment. Scale bars: 2 μm.
-
DKymographs of the tubes shown in (C).
Mutations affecting retromer oligomerization impair cargo sorting in vivo
We used vps35 AAA3KE and vps35 PISA alleles to test the relevance of retromer oligomerization in vivo. To this end, VPS35 was TAP‐tagged and corresponding nucleotide exchanges were made at the VPS35 genomic locus, making the mutated alleles the sole source of Vps35 protein. Both vps35 AAA3KE and vps35 PISA were expressed at similar levels as a VPS35 WT allele (Appendix Fig S4A). They supported normal localization and abundance of yomCherry fusions of the retromer subunit Vps29 and the SNX‐BARs subunit Vps17, suggesting that they are folded (Appendix Fig S4B and C). In contrast to an earlier study, which used secretion of the vacuolar protease CPY as an indirect assay and found only a very mild impact of vps35 AAA3KE (Kendall et al, 2020), we assessed retromer function through microscopic localization of a yEGFP fusion of Vps10. Vps10 is a cargo receptor that uses retromer for returning from the pre‐vacuolar compartment (the equivalent of a late endosome) to the trans‐Golgi network (TGN; Marcusson et al, 1994). Cells expressing wildtype VPS35 showed Vps10yEGFP mostly in small dots scattered in the cytosol or adjacent to the vacuole (Fig 8A), consistent with its expected location in the TGN and pre‐vacuolar compartment (Chi et al, 2014). By contrast, cells lacking VPS35 (vps35Δ) accumulated significant amounts of Vps10yEGFP on the vacuolar membrane, where they co‐localized with the lipidic vacuole stain FM4‐64 (Fig 8A and B). This vacuolar localization is a hallmark of defective retromer function in yeast. It results from the failure to recycle Vps10 from the pre‐vacuolar compartment before this compartment fuses with the vacuole. The vps35 AAA3KE and vps35 PISA alleles produced an intermediate phenotype, where vacuoles were significantly more labeled by Vps10yEGFP than in wildtype, but less than in vps35Δ (Fig 8A and B).
Figure 8. In vivo effect of Vps35 dimerization mutants on Vps10 in yeast.
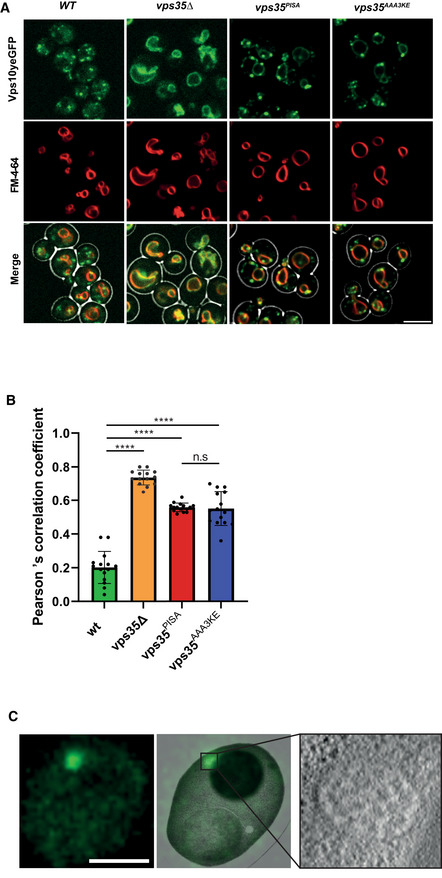
- Vps10yEGFP localization. Yeast cells carrying Vps10yEGFP and expressing the indicated vps35 alleles as the sole source of Vps35 were logarithmically grown in SC medium. Their vacuoles were labeled with FM4‐64. Cells were harvested by brief centrifugation and immediately imaged by confocal microscopy. Single confocal planes are shown. A brightfield image was used to outline the cell boundaries (shown in the merged images). Scale bar: 5 μm.
- Co‐localization of Vps10yEGFP and FM4‐64 in cells from (A) was measured using Pearson's coefficient. 15 Confocal planes with 20–30 cells each from three independent experiments were analyzed. Means and standard error of the mean are shown. P‐values were calculated by Welch's t‐test. ****P < 0.0001.
- CLEM analysis of Vps10yEGFP localization in vps35PISA mutant cells. Logarithmically growing cells were high‐pressure frozen and processed by freeze substitution and embedding. Scale bar: 5 μm.
The pre‐vacuolar compartment recruits SNX‐BARs and retromer (Burda et al, 2002; Liu et al, 2012). In line with this, Vps17yomCherry or Vps29yomCherry appeared as scattered dots when visualized by fluorescence microscopy (Appendix Fig S4B and C). We quantified the number of Vps10yEGFP dots that were also Vps17yomCherry positive. While 50% of Vps10yEGFP positive dots in wildtype cells co‐localized with Vps17yomCherry, 80–90% of colocalization was observed in cells expressing vps35 AAA3KE or vps35 PISA (Appendix Fig S4D). This is consistent with Vps10 accumulating in SNX‐BARs/retromer‐containing structures but unable to recycle back to the Golgi due to inefficient carrier formation. Correlative light and electron microscopy of the Vps10yEGFP dots in vps35 PISA cells showed that the structures accumulating Vps17 were indeed pre‐vacuolar compartments, because they carried multiple lumenal vesicles, which is characteristic for these compartments (Fig 8C).
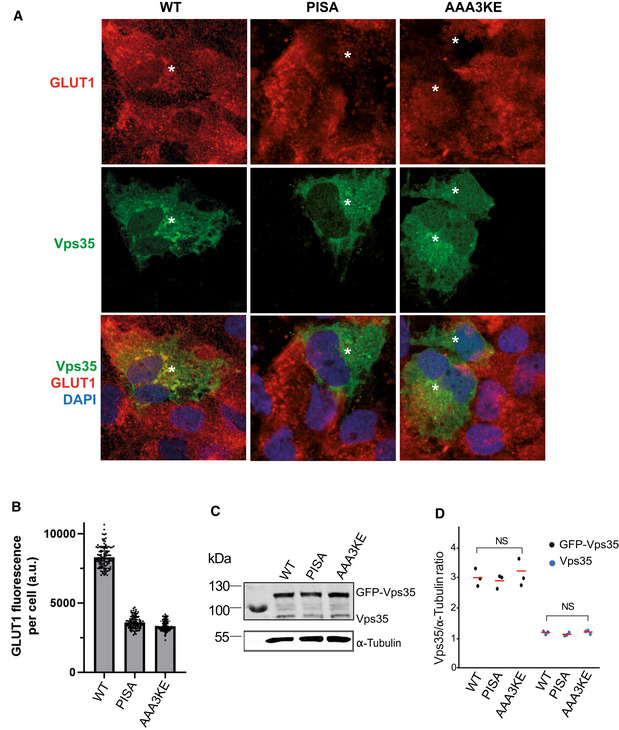
We also assessed the relevance of the Vps35‐Vps35 interface in human cells. SNX‐BAR‐dependent cargos, such as mannose‐6‐phosphate receptor or IGF1R, do not depend on retromer (Kvainickas et al, 2017). Therefore, we chose the glucose transporter GLUT1, which is a well‐characterized retromer cargo. Although retromer operates in this context with SNX27, which does not contain a BAR domain, this approach allows to test the impact of the Vps35‐Vps35 interface on a retromer pathway responsible for a very large number of cargos (Liu et al, 2012; Steinberg et al, 2013; Hesketh et al, 2014; Kvainickas et al, 2017; Evans et al, 2020). GLUT1 is normally localized at the plasma membrane and this localization requires its retromer‐dependent export from endosomes. Knock‐down of hVPS35 in HK2 cells resulted in a strong reduction of GLUT1 on the plasma membrane, consistent with a lack of its retromer‐dependent recycling (Fig 9A). Expression of an siRNA‐resistant form of hVPS35 rescued this phenotype, while corresponding expression of the mammalian mutant alleles hVPS35AAA3KE and hVPS35PISA did not (Fig 9B–E). Expressing the AAA3KE and PISA variants in wildtype cells led to a similar GLUT1 recycling phenotype as in the knock‐down cells, while expression of the wildtype did not interfere with GLUT1 localization (Fig EV4). The dominant negative effect suggests that the mutant proteins are correctly folded, such that they can compete with the endogenous wildtype version for retromer complex formation. Another striking phenotype of cells lacking hVPS35 is an increase in the size of lysosomal compartments, probably due to a lack of membrane recycling and/or accumulation of undigested material resulting from insufficient delivery of lysosomal enzymes (Cui et al, 2018). hVps35 knock‐down cells showed bigger LAMP1‐positive lysosomal compartments (Fig EV5A). These enlarged compartments could be brought back to normal size by expressing an siRNA‐resistant form of hVPS35, whereas expression of hVPS35PISA and hVPS35AAA3KE failed to rescue this phenotype (Fig EV5B–D). Altogether, these observations suggest a conserved role for Vps35 oligomerization in retromer‐dependent protein trafficking in both yeast and human cells.
Figure 9. Effects of Vps35 dimerization mutants in human kidney (HK2) cells.
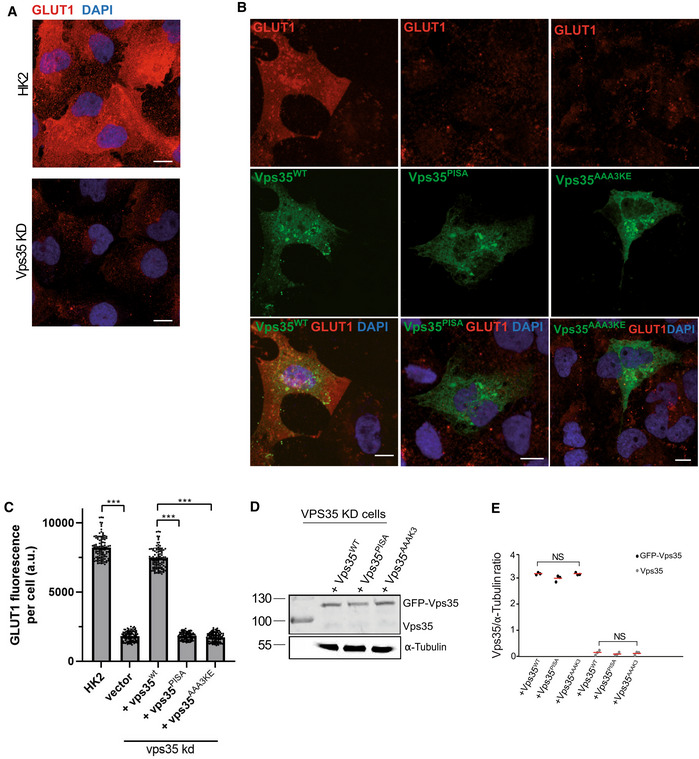
- GLUT1 at the plasma membrane. HK2 cells were treated with siRNA targeting VPS35 or with mock siRNA. Cells were fixed and stained with antibody to GLUT1 (red) and with DAPI (blue). Cells were not detergent permeabilized to preferentially show GLUT1 at the cell surface. Maximum projections of image stacks (step size in z of 300 nm) are shown. Scale bars: 10 μm.
- Influence of VPS35 variants on GLUT1. HK2 cells silenced for VPS35 were transfected with a plasmid carrying siRNA‐resistant wildtype or mutant forms of GFP‐VPS35. GLUT1 was detected by fixation and immunofluorescence staining as in (A). Maximum projections of image stacks (step size in z of 300 nm) are shown. Scale bars: 10 μm.
- Quantification of GLUT1 immunofluorescence in cells from (B). Regions of interest (ROIs) corresponding to cells expressing the indicated VPS35 variants, and some regions outside the cells (background), were manually defined using ImageJ software. Total cell fluorescence was integrated and corrected for background fluorescence. 105 cells per condition stemming from three independent experiments were analyzed. Mean and SEM are indicated. P‐values were calculated by Welch's t‐test. The analysis was performed with 99% confidence: ***P < 0.001.
- Expression of Vps35 variants in cells from (B) was analyzed by SDS–PAGE and Western blot against Vps35. Tubulin served as loading control.
- Quantification of the Vps35/tubulin ratio in cells from (B). Data stem from three independent experiments and show the mean and SEM. P‐values were calculated by Welch's t‐test. NS: not significant (P > 0.01).
Figure EV4. Dominant negative effect of hVPS35 variants on GLUT1 sorting in HK2 cells.
- HK2 cells were transfected with a plasmid carrying the indicated variants of hVPS35GFP, or with an empty plasmid, and cultivated for 24 h. They were fixed, stained with antibody to GLUT1 (red) and with DAPI (blue) and analyzed by confocal microscopy. The cells were not detergent permeabilized. Scale bar: 10 μm.
- Quantification of GLUT1 fluorescence in the cells from (A) was performed as in Fig 9C.
- Expression of Vps35 variants in cells from (A) was analyzed by SDS–PAGE and Western blot against Vps35. Tubulin served as loading control.
- Quantification of the Vps35/tubulin ratio in cells from (A). Data stem from three independent experiments and show the mean. NS: not significant according to a two‐tailed t‐test (P > 0.01).
Figure EV5. Effect of VPS35 variants on the size of LAMP1 compartments.
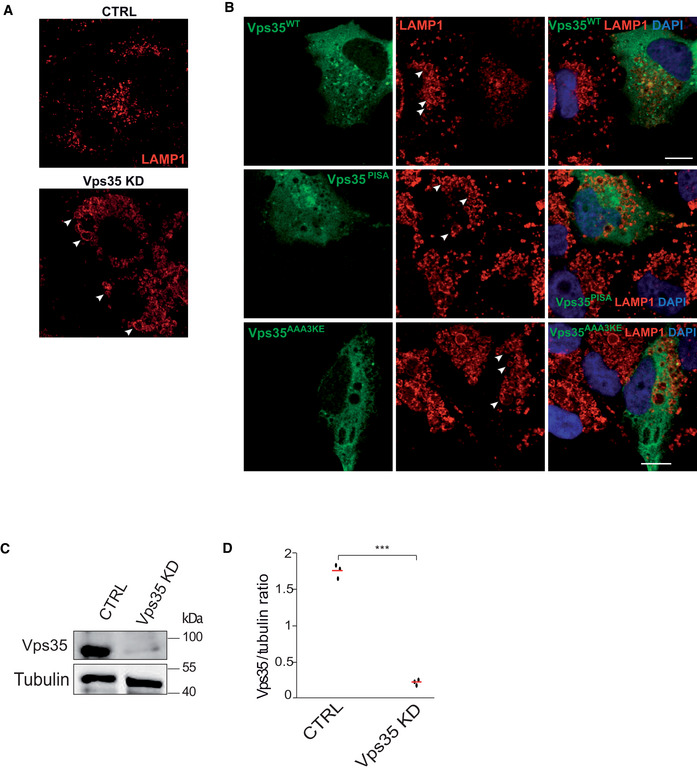
- Effect of VPS35 knockdown. HK2 cells were treated with siRNA targeting VPS35 or with mock siRNA. The cells were fixed and immuno‐stained with anti‐LAMP1 antibody and DAPI and imaged by confocal microscopy. Representative images are shown. Scale bar: 10 μm. Arrowheads point to examples of enlarged LAMP1‐compartments. Scale bar: 10 μm.
- Effect of VPS35 variants. Vps35 knock‐down cells were transfected with a plasmid expressing siRNA‐resistant wildtype or mutant forms of VPS35GFP, or with an empty plasmid. Cells were fixed, immuno‐stained with anti‐LAMP1 and DAPI and imaged by confocal microscopy. Scale bar: 10 μm. Arrowheads point to examples of enlarged LAMP1‐compartments.
- Western blot assessing the siRNA Vps35 knockdown efficiency. Tubulin was used as a loading control.
- Quantification of the siRNA knockdown efficiency of Vps35 for tree‐independent experiments.
Discussion
Structural analyses revealed many important features of retromer coats (Collins et al, 2005, 2008; Hierro et al, 2007; Lucas et al, 2016; Purushothaman et al, 2017; Kendall et al, 2020, 2022b; Zhang et al, 2021). Both Snx3‐ and Vps5‐based coats show retromer forming arch‐like structures that interconnect the sorting nexins over more than 20 nm and angular sections of around 60°C (Kovtun et al, 2018; Leneva et al, 2021). These models show limited regularity of the coat, both with respect to the placement of sorting nexins and their coverage with retromer (Kovtun et al, 2018; Leneva et al, 2021). This irregularity was suggested to represent potential plasticity that may, for example, allow the coat to adjust to different membrane curvatures or to integrate other proteins. Dynamic aspects of coat assembly have, however, not yet been experimentally tested. Our analyses of retromer coat formation in real time provide complementing functional information that relates to several features of the structural models. In our experiments with supported membrane tubes, SNX‐BARs/retromer assembled into a coat that constricted membranes of variable starting curvature to an invariant radius of 19 nm. This number, obtained with a coat including Vps5 and Vps17, is in the range of the radius of 15 nm that was obtained in a structural study of a retromer coat formed with Vps5 alone (Kovtun et al, 2018) and similar to the radii of tubules formed by mammalian Vps5 homologs (van Weering et al, 2012). Thus, even though both yeast SNX‐BAR proteins, Vps5 and Vps17, are required for retromer function (Horazdovsky et al, 1997; Seaman & Williams, 2002), absence of one of them has no major impact on the dimensions of the membrane tubules shaped by retromer.
The available ultrastructure of the SNX‐BAR/retromer coat shows only partially ordered SNX‐BAR layer (Kovtun et al, 2018). Transition into a perfectly ordered array should increase SNX‐BAR density on the membrane. One might hence ask whether the non‐constricted zones might contain SNX‐BARs in such a partially ordered state, and whether constriction could correspond to a transition into a fully ordered array of maximal density. This can be excluded based on the enrichment factor of SNX‐BARs in the constricted zones, as illustrated by the tubule in Fig 1D. In the constricted zones, the lipid signal drops at least two‐fold relative to the non‐constricted regions, while the SNX‐BAR signal increases 3‐ to 4‐fold, suggesting an increase in SNX‐BAR density on the membrane by a factor of 6 to 8. Therefore, the non‐constricted zones must be much more loosely occupied by SNX‐BARs than the tubules analyzed by Kovtun et al (2018), which could only accommodate increases in SNX‐BAR density of much less than 2‐fold.
The coat formed by SNX‐BARs/retromer appears as a stable and static scaffold because no exchange between subunits was observed when pre‐formed coats were incubated with an excess of either SNXs or retromer. Furthermore, it suffices to stabilize membrane tubules pulled out of a GUV. Similar experiments allowed to calculate the polymerization energy of dynamin by plotting membrane tension against the residual force exerted by the membrane tubule carrying the polymerized coat (Roux et al, 2010). We measured no significant residual force on SNX‐BARs/retromer tubules in the range of membrane tensions tested. This suggests a high polymerization energy of the retromer coat, which, however, cannot be quantified through this assay at this point. Determining it will require much more work and is beyond the scope of this study.
In situ, the stability of the coat may be combined with other sources of force to drive the formation of tubules. These include mechanochemical proteins that interact with SNX‐BAR proteins or retromer, such as the WASH complex, which regulates actin polymerization, motor proteins such as dynein (Wassmer et al, 2009), and the EHD proteins (Grant et al, 2001; Daumke et al, 2007; Gokool et al, 2007; Naslavsky et al, 2009). At the level of the whole organelle, it might influence endosomal maturation, where efficient intralumenal vesicle formation by the ESCRT complex requires low endosomal membrane tension. Stabilization of membrane tubules through retromer might maintain the endosomal membrane under high tension, which might then suppress MVB formation while enough recycling cargo is present in the endosome. Stability of the retromer coat could also be relevant for the final detachment of a coated carrier: It may impose constraints on lipid flow beneath the coat and thereby promote friction‐mediated membrane fission (Simunovic et al, 2017), when forces pull the tip of the membrane tubule. Such forces might be generated and transmitted through the retromer‐interacting mechanochemical proteins mentioned above. In mammalian cells, the WASH complex, an activator of Arp2/3 that generates branched actin filaments, has received much attention in this respect. It was proposed that actin polymerization generates force to elongate the retromer‐coated tubule and ultimately cause its fission (Derivery et al, 2009; Gomez & Billadeau, 2009; Temkin et al, 2011; Harbour et al, 2012; Jia et al, 2012; Phillips‐Krawczak et al, 2015). This force would be most efficiently transferred to the growing tubule through a retromer scaffold that is static and stable, which would be in line with our experimental observations. A caveat for this working model is that WASH does not exist in yeast—although also in this organism force produced by actin is harnessed to drive membrane trafficking processes, such as endocytosis (Kaksonen, 2008; Goode et al, 2015). One would hence have to postulate that in the yeast system force is transmitted independently of WASH.
The coat radius of 19 nm can be defined by SNX‐BARs alone, but retromer facilitates membrane constriction at lower SNX‐BARs concentration. In the constricted zones, the density of occupation of SNX‐BARs by retromer varies as a function of the starting diameter of the non‐constricted membrane tube. This implies that the SNX‐BAR/retromer complex, although it can form a stable pentameric complex, operates nevertheless as a modular coat, in which the two subcomplexes are not obligatorily linked. Furthermore, this suggests that constriction of less curved membranes engages more retromer, resulting in a SNX‐BARs coat with a higher degree of retromer‐mediated crosslinking between the SNX‐BAR subunits. The energy provided by these additional bonds and optimized scaffolding of SNX‐BARs by retromer may be two factors that enhance the capacity of the coat to work on the membrane. Then, the coat need not operate at a fixed stoichiometry and retromer density but can be tuned according to the circumstances. This is relevant because the loading and membrane tension of endo‐lysosomal compartments can be altered by a multitude of processes, such as solute transport, membrane influx (transport vesicles, autophagy), or the formation of intralumenal vesicles (Scott et al, 2014; Saric & Freeman, 2020; Chadwick et al, 2021). Furthermore, a tubule itself is a structure of very high surface‐to‐volume ratio. Membrane tension of the organelle must hence increase with the growth of a membrane tubule unless the organelle can compensate through an efflux of solutes and/or water, or through concomitant membrane influx. Tubulation requires more work at higher membrane tension, which could be provided by additional retromer recruitment into the coat. In this case, it is conceivable that the occupancy of a tubule by retromer and SNX‐BARs might change during its formation. Low densities might suffice in the beginning, but occupancy by retromer might increase as the tubule grows and membrane tension increases. Formation of high‐density coats constricting the tube might then be seen as a prelude to its fission from the organelle. In sum, regulating the concentration or activity of retromer could allow the cell to tune retromer‐mediated carrier formation to operate over a wide range of endosomal membrane tension.
Retromer incorporation into the coat may provide additional force for tubule formation. That this contribution depends on retromer oligomerization is underscored by the effect of substitutions in the conserved Vps35‐Vps35 interface (Kendall et al, 2020; Leneva et al, 2021), which compromise oligomerization. They abolish the capacity of retromer to drive membrane constriction, lead to miss‐sorting of the retromer‐dependent cargo receptor Vps10 in yeast, and, probably therefore, to the observed partial secretion of the vacuolar peptidase CPY (Kendall et al, 2020). We did not test the ability of human hVPS35AAA3KE or hVPS35PISA to form coats in vitro, but these variants induced a strong and even dominant negative recycling defect of the retromer cargo GLUT1 in living cells. This points to a conserved role of Vps35‐mediated retromer oligomerization in protein recycling from endosomes.
The asymmetry of the Vps35‐Vps35 interface was proposed to have potential functional consequences, such as for binding cofactors to the arch in a 1:2 stoichiometry and/or conferring directionality to the growth of the coat (Leneva et al, 2021). In our experiments, the coat grew bidirectionally, suggesting that it lacks an inherent preference for adding new subunits at one end. It remains possible, however, that directionality of coat growth can be conferred by additional factors that have not been present in our in vitro system. Structural asymmetry might also be exploited for other purposes, for example for binding cargo such as Vps10, which was proposed to bind to the C‐terminal part of Vps35 (Nothwehr et al, 1999) and promotes the tubulation activity of SNX‐BARs/retromer coats (Purushothaman & Ungermann, 2018). Cargo exerting control over tubule formation through retromer recruitment might then ensure that the recycling machinery is activated when sufficient cargo has accumulated in the compartment. The influence of cargo on retromer coat formation will be addressed in future studies.
Materials and Methods
Materials
The following lipids were purchased from Avanti Polar Lipids (USA): Egg L‐alpha‐phosphatidylcholine (EPC); 1,2‐dioleoyl‐sn‐glycero‐3‐phospho‐L‐serine sodium salt (DOPS); 1,2‐dioleoyl‐sn‐glycero‐3‐phospho‐(1′‐myo‐inositol‐3′‐phosphate; PI3P); 1,2‐dioleoyl‐sn‐glycero‐3‐phosphoethanolamine‐N‐(Cyanine 5.5; Cy5.5 PE); 1‐Oleoyl‐2‐[12‐[(7‐nitro‐2‐1,3‐benzoxadiazol‐4‐yl)amino]dodecanoyl]‐sn‐Glycero‐3‐Phosphocholine (NBD‐PC). All lipids were dissolved in chloroform. Phosphatidylinositol phosphates were dissolved in chloroform/methanol/water (20:10:1). Texas red DHPE (Thermo Fisher cat. T1395MP) was purchased as a mixed isomer. The para isomer was separated by thin‐layer chromatography as previously described (Dar et al, 2015).
Cell culture, strains and plasmids
Yeast cells BY4742 were grown at 30°C in YPD (2% peptone, 1% yeast extract, 2% β‐D‐glucose). Genes were deleted by replacing a complete open reading frame with a marker cassette (Güldener et al, 1996; Janke et al, 2004; see Appendix Table S1 for a list of strains used in this study and Appendix Table S2 for a list of PCR primers used in this study). Gene tagging was done as described (Sheff & Thorn, 2004). Strains used for expression and purification of the retromer complex have been previously described (Appendix Table S1). VPS35 with genomic mutations at the C‐terminus were amplified by PCR from a synthetic gene corresponding to the last 1,000 bp of VPS35 for the PISA mutant, or from the pRS315‐Vps35AAA3KE plasmid (Kendall et al, 2020) for the AAA3KE mutant. These fragments were then fused to a LEU2 cassette by fusion PCR and transformed into yeast cells (Janke et al, 2004).
Live microscopy
Vacuoles were stained with FM4‐64 essentially as described (Desfougères et al, 2016). An overnight preculture in HC (Hartwell's complete) medium was used to inoculate a 10 ml culture. Cells were then grown in HC to an OD600 between 0.6 and 1.0. The culture was diluted to an OD600 of 0.4, and FM4‐64 was added to a final concentration of 10 μM from a 10 mM stock in DMSO. Cells were labeled for 60 min with FM4‐64, washed three times in fresh media by short and gentle centrifugation in a benchtop centrifuge, and then incubated for 60 min in media without FM4‐64. Right before imaging, cells were concentrated by a brief low‐speed centrifugation, resuspended in 1/10 of their supernatant, placed on a glass microscopy slide and overlaid with a 0.17 mm glass coverslip. Imaging was done with a NIKON Ti2 spinning disc confocal microscope with a 100× 1.49 NA lens. Z‐stacks were taken with a spacing of 0.3 μm and assembled into maximum projections. Image analysis was performed with ImageJ. Pearson's correlation coefficient was used to quantify the colocalization between Vps10 and FM4‐64. The Nikon NIS‐Elements Software Pearson's correlation tool was used on at least five single stacks containing at least 100 cells each. All performed experiments were repeated at least three times. SEM calculation and plotting were done with GraphPad PRISM software.
Protein purification
TAP‐tagged retromer complex was extracted from yeast as previously described (Purushothaman et al, 2017; Purushothaman & Ungermann, 2018). Briefly, a 50 ml preculture of cells was grown overnight to saturation in YPGal medium. The next day, two 1 L cultures in YPGal were inoculated with 15 ml of preculture and grown for 20 h to late log phase (OD600 = 2–3). All following steps were performed at 4°C. Cells were pelleted and washed with 1 pellet volume of cold RP buffer (retromer purification buffer: 50 mM Tris pH 8.0, 300 mM NaCl, 1 mM MgCl2, 1 mM PMSF, Roche complete protease inhibitor). Pellets were either processed immediately or flash‐frozen in liquid nitrogen and stored at −80°C. For cell lysis, the pellet was resuspended in one volume of RP buffer and passed through a French press (One shot cell disruptor, Constant Systems LTD, Daventry, UK) at 2.2 Kpsi. 1 mg DNAse I was added to the lysate followed by a 20 min incubation on a rotating wheel. The lysate was precleared by centrifugation for 30 min at 45,000 g in a Beckman JLA 25.50 rotor and cleared by a 60 min centrifugation at 150,000 g in a Beckman Ti60 rotor. The cleared supernatant was passed through a 0.2 μm filter and transferred to a 50 ml Falcon tube. 1 ml IgG bead suspension (GE Healthcare, cat 17‐0969‐01) was washed three times with RP buffer and added to the supernatant. After 60 min incubation on a rotating wheel, beads were spun down and washed three times with RP buffer. 250 μg of purified HIS‐TEV protease from Escherichia coli was added to the beads. After 30 min incubation at 4°C, beads were centrifuged, the supernatant containing purified retromer subcomplex was collected and concentrated on a 100 kDa cutoff column (Pierce™ Protein Concentrator PES, 100 K MWCO). The concentrated protein fraction was re‐diluted in RP buffer and reconcentrated three times. This final step allowed for removal of TEV protease and a high enrichment for intact complexes. Proteins were concentrated to ~ 2 mg/ml, aliquoted in 10 μl fractions and flash‐frozen in liquid nitrogen. Proteins were stored at −80°C and used within 3 months. Thawed aliquots were used only once.
Supported membrane tubes
Supported membrane tubes were generated as described (Dar et al, 2015).
Briefly, glass coverslips were first washed with 3 M NaOH for 5 min and rinsed with water before a 60 min treatment with piranha solution (95% H2SO4 / 30% H2O2 3:2 v/v). Coverslips were rinsed with water and dried on a heat block at 90°C. Coverslips were then silanized with 3‐glycidyloxypropyltrimethoxysilane (Catalogue no. 440167, Sigma) for 5 h under vacuum, rinsed with acetone and dried. Polyethylene glycol coating was done by placing the coverslips in a beaker containing PEG400 (Sigma) or PEG8000 (affymetrix) at 90°C for 60 h. Coverslips were washed with distilled water and stored for up to 2 months at room temperature in a closed container.
To generate supported membrane tubes, lipids were freshly mixed from 10 mg/ml stocks in a glass vial and diluted to a final concentration of 1 mg/ml in chloroform. The same lipid composition was used throughout this study (5% PI(3)P, 15% DOPS, 0.1% fluorescent lipid tracer (in most cases Texas red DHPE), 79.5% egg‐PC). Lipids were spotted (typically 1 μl, corresponding to about 1 nmol) on the coverslips and dried for 30 min under vacuum. The coverslip was mounted on an IBIDI 6‐channel μ‐slide (μ‐Slide VI 0.4. IBIDI, catalog no: 80606). Lipids were hydrated for 15 min with buffer (PBS) and SMTs were generated by injecting PBS into the chamber using an Aladdin Single‐Syringe Pump (World Precision Instruments, model no. AL‐1000) at a flow rate of 1.5 ml/min for 5 min. SMTs were left to stabilize without flow for 5 min before the start of the experiment. Protein stocks (typically 1–2 μM) were first diluted in PBS and then injected in the chamber at a flow rate of 80 μl/min. Tubes were imaged with a NIKON Ti2E spinning disc confocal microscope equipped with a 100× 1.49 NA objective or an UltraView Vox confocal spinning disk unit (PerkinElmerCetus, Waltham, MA, USA) connected to an inverted Zeiss microscope (Carl Zeiss, Jena, Germany) with a 100x oil immersion objective with a numerical apersture of 1.40.
Native‐PAGE, SDS–PAGE and Western blotting
For analysis of retromer oligomer formation, 10 μl of purified retromer (~ 2 mg/ml) was diluted 1:1 with water and incubated for 5 min at 25°C. Samples were run on a commercial native‐PAGE gel (3–12%, Bis‐Tris, 1.0 mm, Mini Protein Gel, 10‐well, Invitrogen, Cat. BN1001BOX) at 100 V tension using as running buffer 50 mM Bis‐Tris, 50 mM Tricine, pH 6.8 (Invitrogen number BN2007). Cathode buffer: running buffer + 1/200 0.4% Coomassie G‐250. Sample buffer: 50 mM Bis‐Tris, 6 N HCl, 50 mM NaCl, 10% w/v Glycerol, 0.001% Ponceau S, pH 7.2. Gels were run at 4° C. After the run, gels were then washed in 20% ethanol + 10% acetic acid for 2 h.
Quantification of SMT fluorescence
Supported membrane tube fluorescence was quantified with ImageJ on images of the tubes taken with a spinning disc confocal microscope. The tubes carried fluorescent lipids. The fluorescence intensity of these lipids in the image is a measure of their number per pixel, which is related to the radius of the tube. Lipid fluorescence hence permits to measure the tube diameter. To determine this lipid fluorescence pixel‐by‐pixel along the tube line scan analysis was performed using an ImageJ plugin (available as a txt file in the supplement; see also Fig EV1). Each line scan was performed perpendicular to the tubule. Successive line scans were made along the tubule with a one‐pixel increment. For each line scan, a Gaussian curve was fitted, and the maximum height was extracted. Maximum height was then plotted against the position on the tube.
For segmenting the constricted areas and quantifying the diameters of the tubes, lipid fluorescence values of a tubule extracted from the series of line scans described above, were sorted in ascending order, and plotted (Fig EV1). The resulting curve typically shows two plateaus, the lower one corresponding to the constricted state and the higher one corresponding to the non‐constricted state. For each tube, the zones corresponding to the constricted and non‐constricted plateaus were delimited manually. The length (number of pixels belonging to constricted and non‐constricted zones) of these plateaus is a measure for the portion of the tubule that has been constricted. The mean fluorescence values of the plateaus for the constricted and non‐constricted states were used to calculate the tube diameter. Tube diameter was calibrated as described (Dar et al, 2015). To this end SMTs were incubated with ΔPRD‐dynamin‐1 as a reference. This protein forms well‐defined helical assemblies around membrane tubes with a precisely defined radius of 11.2 nM (Colom et al, 2017). The mean lipid fluorescence intensity of the tube underneath the protein scaffold is related to the tube radius by I = K*R where I is the tube fluorescence under the scaffold and R is the tube radius. Using Dynamin (R = 11.2 nm) we can then calculate the calibration constant K. K was then used to determine the radii of retromer‐coated SMTs through their measured lipid fluorescence in constricted and non‐constricted domains.
Tube pulling
The experimental set‐up used to aspirate GUVs with a micropipette and pull a membrane tube was the same as previously reported (Chiaruttini et al, 2015) combines bright‐field imaging, spinning disc confocal microscopy and optical tweezers on an inverted Nikon Eclipse Ti microscope. GUVs were made by electro‐formation as described (Angelova et al, 1992). Briefly, lipid mix (the same mix as for SMT experiments, supplemented with 0.03% mol/mol of the biotinylated lipid DSPE‐PEG2000‐Biotin, Avanti Polar Lipids, Alabaster, AL, USA) in chloroform was deposited on indium‐titanium oxide glass slides and dried for 60 min at 55°C to evaporate all solvents. GUVs were electroformed at 1 V and 10 Hz for 60 min at 55°C in a 380 mM sucrose solution. GUVs were then removed from the chamber and placed in an Eppendorf tube until use. GUVs were used within 1–2 h after formation. A GUV is aspirated within a micropipette connected to a motorized micromanipulator (MP‐285, Sutter Instrument, Novato, CA, USA) and a homemade pressure control system (Zaber Micro linear actuator, Zaber Technologies Inc., Canada) that sets the aspiration pressure ΔP. Then, a membrane nanotube is pulled out from the vesicle through a streptavidin‐coated bead (3.05 μm diameter, Spherotech, Lake Forest, IL, USA) held in a fixed optical trap. The optical trap was custom‐made with a continuous 5 W 1064 nm fiber laser (ML5‐CW‐P‐TKS‐OTS, Manlight, Lannion, France) focused through a 100× 1.3 NA oil immersion objective. The force F exerted on the bead was calculated from Hooke's law: F = k*Δx, where k is the stiffness of the trap (k = 60 pN/μm) and Δx the displacement of the bead from its equilibrium position. A mix of SNXs / retromer‐mClover at 1 μM with 280 mosm osmolarity was injected with a micropipette connected to a motorized micromanipulator and to the Fluigent pressure control system (MFCS‐VAC, −69 mbar; Fluigent).
CLEM
CLEM was performed as described (Kukulski et al, 2012; Muriel et al, 2021). Briefly, cells of a logarithmically growing culture were concentrated by centrifugation at 900 g for 2 min at RT. A few microliters of a thick cell slurry were pipetted onto a 3‐mm‐wide and 0.1‐mm deep specimen carrier (Wohlwend type A) closed with a flat lid (Wohlwend type B). The assembled carrier sandwich was high‐pressure frozen using a Wohlwend HPF Compact 02 and disassembled in liquid nitrogen. High‐pressure frozen samples were processed by freeze substitution and embedding in Lowicryl HM20 using the Leica AFS 2 robot as described (Kukulski et al, 2012). 300 nm sections were cut with a diamond knife using a Leica ultramicrotome, collected in water and picked up on carbon‐coated 200‐mesh copper grids (AGS160; Agar Scientific). For light microscopy, the grid was placed onto a drop of water and mounted onto a microscopy slide. Light microscopy images were acquired on a NIKON Ti2 spinning disc confocal microscope with a 100× 1.49 NA lens. The grid was recovered, dried and stained with Reynolds lead citrate for 10 min. 10‐nm protein A‐coupled gold beads were adsorbed to the top of the section as fiducials for tomography. TEMs were acquired on a FEI Tecnai 12 at 120 kV using a bottom mount FEI Eagle camera (4 k × 4 k). For tomographic reconstruction, tilt series were acquired over a tilt range of ± 60° at 1° increments using the Serial EM software. Tomogram reconstruction was performed using the IMOD software package with gold fiducial alignment.
Mammalian cell experiments
All chemical reagents were from Sigma‐Aldrich unless specified otherwise. Other reagents were Opti‐MEM (Thermo Fischer, 11058021) and Trypsin (Thermo Fischer, 27250018); LysoTracker® Deep Red (Thermo Fisher Scientific, L12492); Protease inhibitor (PI) cocktail final concentrations: 40 M Pefabloc SC (Merck, 11429876001), 2.1 M leupeptin (Merck, 11529048001), 80 μM o‐phenanthroline (Merck, 131377), 1.5 μM pepstatin A (Merck, 11524488001).
Cell culture, transfection and treatments
HK2 cells were grown in DMEM‐HAM's F12 (GIBCO‐Life Technologies), supplemented with 5% fetal calf serum, 50 IU/ml penicillin, 50 mg/ml streptomycin, 5 μg/ml insulin, 5 μg/ml transferrin, 5 ng/ml selenium (LuBio Science). Cells were grown at 37°C in 5% CO2 and at 98% humidity. Media, serum and reagents for tissue culture were purchased from GIBCO (Invitrogen). HK2 cells were transfected with different plasmids using X‐tremeGENE HP DNA transfection reagent (Sigma‐Aldrich) according to the manufacturer's instructions. Briefly, the plasmid was diluted with Opti‐MEM I Medium without serum to a final concentration of 1 μg plasmid DNA per 100 μl medium (0.01 μg/μl) and gently mixed. Then, 3 μl of X‐tremeGENE HP DNA Transfection Reagent was added directly into the medium containing the diluted DNA. The transfection reagent: DNA complex was incubated for 30 at room temperature under the hood. Finally, the transfection complex was added to the cells in a dropwise manner and they were incubated 24 h at 37°C in a CO2 incubator.
The HK‐2 cell line was checked for mycoplasma contamination by a PCR‐based method. All cell‐based experiments were repeated at least three times.
Knockouts and RNA interference
For RNA interference, HK2 cells were plated in 24‐well plate and then transfected with siRNA using Lipofectamine RNAiMax (Thermo Fisher Scientific). For each well to be transfected was first prepared the RNAi duplex‐Lipofectamine RNAiMAX complexes as follows: 6 pmol of RNAi duplex were diluted in 100 μl Opti‐MEM I Medium without serum in the well of the culture plate and gently mixed. Then, 1 μl Lipofectamine RNAiMAX was added to each well containing the diluted RNAi molecules, gently mixed and incubated for 20 min at room temperature under sterile conditions. In that time, cells were detached, counted and diluted in complete growth medium without antibiotics so that 500 μl contains the appropriate number of cells to give 30% confluence 24 h after plating. After the 20 min of incubation at room temperature to each well with RNAi duplex, Lipofectamine RNAiMAX complexes were added 500 μl of the diluted cells. This gives a final volume of 600 μl and a final RNA concentration of 10 nM. The 24well‐plate was gently mixed gently by rocking and incubated 24–72 h at 37°C in a CO2 incubator.
The siRNA targeting VPS35 was from Sigma (5′ CTGGACATATTTATCAATATA 3′; 3′ TATATTGATAAATATGTCCAG 5′). It was used at 10 nM final concentration. Control cells were treated with identical concentrations of siGENOME Control Pool Non‐Targeting from Dharmacon (D‐001206‐13‐05).
Immunostaining
HK2 cells were grown to 70% confluence on glass coverslips before immunofluorescence microscopy was performed. Cells were fixed for 10 min in 4% paraformaldehyde in PBS (phosphate‐buffered saline). After fixation, cells were incubated (30 min at room temperature) in blocking buffer with (permeabilized cells) or without (non‐permeabilized cells) 0.05% (w:v) saponin (Sigma‐Aldrich, 558255), 0.5% (w:v) BSA and 50 mM NH4Cl in PBS. The cells were incubated for 1 h with primary antibody in blocking buffer, washed three times in PB and incubated for 1 h with the secondary antibody in blocking buffer. Then, cells were washed three times in PBS, mounted with Mowiol (Sigma‐Aldrich, 475904‐M) on slides and analyzed by confocal microscopy.
Primary antibodies were anti‐LAMP1 (H4A3, USBiologicvak Life Sciences) and anti‐Glut1 (ab15309 Abcam). Secondary antibodies were Cy3‐conjugated AffiniPure Donkey anti‐Mouse IgG H + L (Jackson Immuno Research); Cy3‐conjugated AffiniPure Donkey anti‐Rabbit IgG H + L (Jackson Immuno Research); Alexa fluor® 488‐conjugated AffiniPure Donkey anti‐Rabbit IgG H + L (Jackson Immuno Research).
Confocal fluorescence microscopy and image processing
Confocal microscopy was performed on an inverted confocal laser microscope (Zeiss LSM 880 with Airyscan) with a 63× 1.4 NA oil immersion lens. Z‐stack Images were acquired on a Zeiss LSM880 microscope with Airyscan. GLUT1‐fluorescence was quantified using ImageJ. Individual cells were selected using the freeform drawing tool to create a ROI (ROI). The “Measure” function provided the area, the mean grey value and integrated intensity of the ROI. The mean background level was obtained by measuring the intensity in three different regions outside the cells, dividing them by the area of the regions measured and averaging the values obtained. This background noise was removed from each cell, yielding the CTCF (corrected total cell fluorescence): CTCF = integrated intensity of cell ROI − (area of ROI × mean fluorescence of background).
To quantify the degree of co‐localization, confocal z‐stacks were acquired. Single channels from each image in 8‐bit format were thresholded to subtract background and then the “Just Another Colocalisation Plug‐in” (JACOP) of ImageJ was used to measure Pearson's correlation coefficient.
Gel electrophoresis and Western blot
Ctrl and Vps35‐KD HK2 cells were plated into 12‐well tissue culture test plates (TPP) until 72 h after transfection with the siRNAs. Cells were then washed three times with ice‐cold PBS, scraped and proteins were extracted in ice‐cold lysis buffer (150 mM NaCl, 2 mM EDTA, 40 mM HEPES and 1% Triton X‐100) supplemented with phosphatase (Roche #04906837001) and protease inhibitor cocktail. Protease inhibitor (PI) cocktail final concentrations: 40 μM Pefabloc SC (Merck, 11429876001), 2.1 μM leupeptin (Merck, 11529048001), 80 μM o‐phenanthroline (Merck, 131377), 1.5 μM pepstatin A (Merck, 11524488001). Protein extracts were supplemented with 1/4 volume of 5× reducing sample buffer (250 mM Tris–HCl, pH 6.8, 5% β‐mercaptoethanol, 10% SDS, 30% glycerol, 0.02% bromophenol blue) and heated to 95°C for 5 min. The samples were run on SDS‐polyacrylamide gels (W × L × H: 8.6 × 6.8 × 0.15 cm). Running gels were either 8% or 4–16% ProtoGel (30% w/v acrylamide, 0.8% bisacrylamide; 37.5:1 solution, National diagnostics, Atlanta, USA), 0.38 M Tris, pH 8.8, 0.1% w/v SDS (AppliChem, 475904‐M), 0.06% TEMED (AppliChem, A1148), 0.06% w/v APS (AppliChem, A2941). The stacking gels were prepared as follows: 6% acrylamide, 0.16% bis‐acrylamide, 0.1 M Tris, pH 6.8, 0.1% SDS, 0.1% TEMED, 0.05% ammonium persulfate. The gels were run at constant current (35 mA). Proteins were blotted onto 0.45 μm nitrocellulose membrane (Amersham) overnight at a constant current of 200 mA using a Trans‐Blot® Cell (Bio‐Rad, USA).
After incubation with the primary antibody, signals were detected by secondary antibodies coupled to infrared dyes (LI‐COR) and detected on a LI‐COR Odyssey Infrared Imager. Images were exported as TIFF files and processed in Adobe Photoshop. Band intensity was quantified using ImageJ band analysis. We used anti‐LAMP1 (H4A3, USBiologicvak Life Sciences), anti‐Tubulin (T9026 Sigma‐Aldrich) anti‐Vps35 (ab10099 Abcam, ab157220 Abcam).
Statistics
Where averages were calculated, the values stem from experiments that were performed independently. For all experiments, significance of differences was tested by Welch's t‐test.
Author contributions
Andreas Mayer: Conceptualization; supervision; funding acquisition; methodology; writing – original draft; project administration; writing – review and editing. Navin Gopaldass: Conceptualization; data curation; formal analysis; investigation; methodology; writing – original draft; writing – review and editing. Maria Giovanna De Leo: Investigation; writing – original draft; writing – review and editing. Vincent Mercier: Formal analysis; investigation. Christin Bissig: Investigation. Aurélien Roux: Methodology. Thibault Courtellemont: Formal analysis; investigation.
In addition to the CRediT author contributions listed above, the contributions in detail are:
AM and NG conceived the study. MGDL performed experiments with mammalian cells. TC contributed to in vivo studies in yeast. CB performed electron microscopy. VM and AR contributed experiments with GUVs. All authors analyzed data. AM, MGDL and NG wrote the manuscript.
Disclosure and competing interests statement
The authors declare that they have no conflict of interest.
Supporting information
Appendix
Expanded View Figures PDF
Movie EV1
Movie EV2
Movie EV3
Movie EV4
Movie EV5
PDF+
Acknowledgements
We thank Christian Ungermann for strains expressing retromer and SNX‐BARs. This work was supported by grants from the SNSF (179306 and 204713) and ERC (788442) to AM.
The EMBO Journal (2023) 42: e112287
Contributor Information
Navin Gopaldass, Email: navin.gopaldass@unil.ch.
Andreas Mayer, Email: andreas.mayer@unil.ch.
Data availability
Microscopy images have been deposited in the BioImage Archive under accession number S‐BIAD567 via the link https://www.ebi.ac.uk/biostudies/bioimages/studies/S-BIAD567?query=S-BIAD567.
References
- Angelova MI, Soléau S, Méléard P, Faucon F, Bothorel P (1992) Trends in colloid and interface science VI. Prog Colloid Polym Sci 127–131 [Google Scholar]
- Baars TL, Petri S, Peters C, Mayer A (2007) Role of the V‐ATPase in regulation of the vacuolar fission‐fusion equilibrium. Mol Biol Cell 18: 3873–3882 [DOI] [PMC free article] [PubMed] [Google Scholar]
- Balderhaar HJK, Arlt H, Ostrowicz C, Bröcker C, Sündermann F, Brandt R, Babst M, Ungermann C (2010) The Rab GTPase Ypt7 is linked to retromer‐mediated receptor recycling and fusion at the yeast late endosome. J Cell Sci 123: 4085–4094 [DOI] [PubMed] [Google Scholar]
- Bartuzi P, Billadeau DD, Favier R, Rong S, Dekker D, Fedoseienko A, Fieten H, Wijers M, Levels JH, Huijkman N et al (2016) CCC‐ and WASH‐mediated endosomal sorting of LDLR is required for normal clearance of circulating LDL. Nat Commun 7: 10961 [DOI] [PMC free article] [PubMed] [Google Scholar]
- Bean BDM, Davey M, Snider J, Jessulat M, Deineko V, Tinney M, Stagljar I, Babu M, Conibear E (2015) Rab5‐family guanine nucleotide exchange factors bind retromer and promote its recruitment to endosomes. Mol Biol Cell 26: 1119–1128 [DOI] [PMC free article] [PubMed] [Google Scholar]
- Burd C, Cullen PJ (2014) Retromer: a master conductor of endosome sorting. Cold Spring Harb Perspect Biol 6: a016774 [DOI] [PMC free article] [PubMed] [Google Scholar]
- Burda P, Padilla SM, Sarkar S, Emr SD (2002) Retromer function in endosome‐to‐Golgi retrograde transport is regulated by the yeast Vps34 PtdIns 3‐kinase. J Cell Sci 115: 3889–3900 [DOI] [PubMed] [Google Scholar]
- Cameron LA, Footer MJ, van Oudenaarden A, Theriot JA (1999) Motility of ActA protein‐coated microspheres driven by actin polymerization. Proc Natl Acad Sci U S A 96: 4908–4913 [DOI] [PMC free article] [PubMed] [Google Scholar]
- Carlton J, Bujny M, Peter BJ, Oorschot VMJ, Rutherford A, Mellor H, Klumperman J, McMahon HT, Cullen PJ (2004) Sorting nexin‐1 mediates tubular endosome‐to‐TGN transport through coincidence sensing of high‐ curvature membranes and 3‐phosphoinositides. Curr Biol 14: 1791–1800 [DOI] [PubMed] [Google Scholar]
- Chadwick SR, Grinstein S, Freeman SA (2021) From the inside out: ion fluxes at the centre of endocytic traffic. Curr Opin Cell Biol 71: 77–86 [DOI] [PubMed] [Google Scholar]
- Cheever ML, Sato TK, de Beer T, Kutateladze TG, Emr SD, Overduin M (2001) Phox domain interaction with PtdIns(3)P targets the Vam7 t‐SNARE to vacuole membranes. Nat Cell Biol 3: 613–618 [DOI] [PubMed] [Google Scholar]
- Chi RJ, Liu J, West M, Wang J, Odorizzi G, Burd CG (2014) Fission of SNX‐BAR‐coated endosomal retrograde transport carriers is promoted by the dynamin‐related protein Vps1. J Cell Biol 204: 793–806 [DOI] [PMC free article] [PubMed] [Google Scholar]
- Chiaruttini N, Redondo‐Morata L, Colom A, Humbert F, Lenz M, Scheuring S, Roux A (2015) Relaxation of loaded ESCRT‐III spiral springs drives membrane deformation. Cell 163: 866–879 [DOI] [PMC free article] [PubMed] [Google Scholar]
- Collins BM, Skinner CF, Watson PJ, Seaman MNJ, Owen DJ (2005) Vps29 has a phosphoesterase fold that acts as a protein interaction scaffold for retromer assembly. Nat Struct Mol Biol 12: 594–602 [DOI] [PubMed] [Google Scholar]
- Collins BM, Norwood SJ, Kerr MC, Mahony D, Seaman MNJ, Teasdale RD, Owen DJ (2008) Structure of Vps26B and mapping of its interaction with the retromer protein complex. Traffic 9: 366–379 [DOI] [PubMed] [Google Scholar]
- Colom A, Redondo‐Morata L, Chiaruttini N, Roux A, Scheuring S (2017) Dynamic remodeling of the dynamin helix during membrane constriction. Proc Natl Acad Sci U S A 114: 5449–5454 [DOI] [PMC free article] [PubMed] [Google Scholar]
- Courtellemont T, Leo MGD, Gopaldass N, Mayer A (2022) CROP: a retromer‐PROPPIN complex mediating membrane fission in the endo‐lysosomal system. EMBO J 41: e109646 [DOI] [PMC free article] [PubMed] [Google Scholar]
- Cui Y, Carosi JM, Yang Z, Ariotti N, Kerr MC, Parton RG, Sargeant TJ, Teasdale RD (2018) Retromer has a selective function in cargo sorting via endosome transport carriers. J Cell Biol 218: 615–631 [DOI] [PMC free article] [PubMed] [Google Scholar]
- Dar S, Kamerkar SC, Pucadyil TJ (2015) A high‐throughput platform for real‐time analysis of membrane fission reactions reveals dynamin function. Nat Cell Biol 17: 1588–1596 [DOI] [PubMed] [Google Scholar]
- Daumke O, Lundmark R, Vallis Y, Martens S, Butler PJG, McMahon HT (2007) Architectural and mechanistic insights into an EHD ATPase involved in membrane remodelling. Nature 449: 923–927 [DOI] [PubMed] [Google Scholar]
- Deatherage CL, Nikolaus J, Karatekin E, Burd CG (2020) Retromer forms low order oligomers on supported lipid bilayers. J Biol Chem 295: 12305–12316 [DOI] [PMC free article] [PubMed] [Google Scholar]
- DeLeo MG, Berger P, Mayer A (2021) WIPI1 promotes fission of endosomal transport carriers and formation of autophagosomes through distinct mechanisms. Autophagy 17: 3644–3670 [DOI] [PMC free article] [PubMed] [Google Scholar]
- Derivery E, Sousa C, Gautier JJ, Lombard B, Loew D, Gautreau A (2009) The Arp2/3 activator WASH controls the fission of endosomes through a large multiprotein complex. Dev Cell 17: 712–723 [DOI] [PubMed] [Google Scholar]
- Desfougères Y, Neumann H, Mayer A (2016) Organelle size control ‐ increasing vacuole content activates SNAREs to augment organelle volume through homotypic fusion. J Cell Sci 129: 2817–2828 [DOI] [PubMed] [Google Scholar]
- Evans AJ, Daly JL, Anuar ANK, Simonetti B, Cullen PJ (2020) Acute inactivation of retromer and ESCPE‐1 leads to time‐resolved defects in endosomal cargo sorting. J Cell Sci 133: jcs246033 [DOI] [PMC free article] [PubMed] [Google Scholar]
- Gierke S, Kumar P, Wittmann T (2010) Analysis of microtubule polymerization dynamics in live cells. Methods Cell Biol 97: 15–33 [DOI] [PMC free article] [PubMed] [Google Scholar]
- Gokool S, Tattersall D, Seaman MNJ (2007) EHD1 interacts with retromer to stabilize SNX1 tubules and facilitate endosome‐to‐Golgi retrieval. Traffic 8: 1873–1886 [DOI] [PubMed] [Google Scholar]
- Gomez TS, Billadeau DD (2009) A FAM21‐containing WASH complex regulates retromer‐dependent sorting. Dev Cell 17: 699–711 [DOI] [PMC free article] [PubMed] [Google Scholar]
- Goode BL, Eskin JA, Wendland B (2015) Actin and endocytosis in budding yeast. Genetics 199: 315–358 [DOI] [PMC free article] [PubMed] [Google Scholar]
- Gopaldass N, Fauvet B, Lashuel H, Roux A, Mayer A (2017) Membrane scission driven by the PROPPIN Atg18. EMBO J 36: 3274–3291 [DOI] [PMC free article] [PubMed] [Google Scholar]
- Grant B, Zhang Y, Paupard MC, Lin SX, Hall DH, Hirsh D (2001) Evidence that RME‐1, a conserved C. elegans EH‐domain protein, functions in endocytic recycling. Nat Cell Biol 3: 573–579 [DOI] [PubMed] [Google Scholar]
- Güldener U, Heck S, Fiedler T, Beinhauer J, Hegemann JH (1996) A new efficient gene disruption cassette for repeated use in budding yeast. Nucleic Acids Res 24: 2519–2524 [DOI] [PMC free article] [PubMed] [Google Scholar]
- Harbour ME, Breusegem SY, Seaman MNJ (2012) Recruitment of the endosomal WASH complex is mediated by the extended “tail” of Fam21 binding to the retromer protein Vps35. Biochem J 442: 209–220 [DOI] [PubMed] [Google Scholar]
- Harrison MS, Hung C‐S, Liu T, Christiano R, Walther TC, Burd CG (2014) A mechanism for retromer endosomal coat complex assembly with cargo. Proc Natl Acad Sci U S A 111: 267–272 [DOI] [PMC free article] [PubMed] [Google Scholar]
- Harterink M, Port F, Lorenowicz MJ, McGough IJ, Silhankova M, Betist MC, van Weering JRT, van Heesbeen RGHP, Middelkoop TC, Basler K et al (2011) A SNX3‐dependent retromer pathway mediates retrograde transport of the Wnt sorting receptor Wntless and is required for Wnt secretion. Nat Cell Biol 13: 914–923 [DOI] [PMC free article] [PubMed] [Google Scholar]
- Hesketh GG, Pérez‐Dorado I, Jackson LP, Wartosch L, Schäfer IB, Gray SR, McCoy AJ, Zeldin OB, Garman EF, Harbour ME et al (2014) VARP is recruited on to endosomes by direct interaction with retromer, where together they function in export to the cell surface. Dev Cell 29: 591–606 [DOI] [PMC free article] [PubMed] [Google Scholar]
- Hierro A, Rojas AL, Rojas R, Murthy N, Effantin G, Kajava AV, Steven AC, Bonifacino JS, Hurley JH (2007) Functional architecture of the retromer cargo‐recognition complex. Nature 449: 1063–1067 [DOI] [PMC free article] [PubMed] [Google Scholar]
- Horazdovsky BF, Davies BA, Seaman MN, McLaughlin SA, Yoon S, Emr SD (1997) A sorting nexin‐1 homologue, Vps5p, forms a complex with Vps17p and is required for recycling the vacuolar protein‐sorting receptor. Mol Biol Cell 8: 1529–1541 [DOI] [PMC free article] [PubMed] [Google Scholar]
- Hsieh W‐T, Hsu C‐J, Capraro BR, Wu T, Chen C‐M, Yang S, Baumgart T (2012) Curvature sorting of peripheral proteins on solid‐supported wavy membranes. Langmuir 28: 12838–12843 [DOI] [PMC free article] [PubMed] [Google Scholar]
- Janke C, Magiera MM, Rathfelder N, Taxis C, Reber S, Maekawa H, Moreno‐Borchart A, Doenges G, Schwob E, Schiebel E et al (2004) A versatile toolbox for PCR‐based tagging of yeast genes: new fluorescent proteins, more markers and promoter substitution cassettes. Yeast 21: 947–962 [DOI] [PubMed] [Google Scholar]
- Jia D, Gomez TS, Billadeau DD, Rosen MK (2012) Multiple repeat elements within the FAM21 tail link the WASH actin regulatory complex to the retromer. Mol Biol Cell 23: 2352–2361 [DOI] [PMC free article] [PubMed] [Google Scholar]
- Jia D, Zhang J‐S, Li F, Wang J, Deng Z, White MA, Osborne DG, Phillips‐Krawczak C, Gomez TS, Li H et al (2016) Structural and mechanistic insights into regulation of the retromer coat by TBC1d5. Nat Commun 7: 1–11 [DOI] [PMC free article] [PubMed] [Google Scholar]
- Jung H, Robison AD, Cremer PS (2009) Detecting protein‐ligand binding on supported bilayers by local pH modulation. J Am Chem Soc 131: 1006–1014 [DOI] [PMC free article] [PubMed] [Google Scholar]
- Kaksonen M (2008) Taking apart the endocytic machinery. J Cell Biol 180: 1059–1060 [DOI] [PMC free article] [PubMed] [Google Scholar]
- Kendall AK, Xie B, Xu P, Wang J, Burcham R, Frazier MN, Binshtein E, Wei H, Graham TR, Nakagawa T et al (2020) Mammalian retromer is an adaptable scaffold for cargo sorting from endosomes. Structure 28: 393–405 [DOI] [PMC free article] [PubMed] [Google Scholar]
- Kendall AK, Chandra M, Xie B, Wan W & Jackson LP (2022a) Improved mammalian retromer cryo‐EM structures reveal a new assembly interface. bioRxiv 10.1101/2022.03.04.482375 [PREPRINT] [DOI] [PMC free article] [PubMed]
- Kendall AK, Chandra M, Xie B, Wan W, Jackson LP (2022b) Improved mammalian retromer cryo‐EM structures reveal a new assembly interface. J Biol Chem 298: 102523 [DOI] [PMC free article] [PubMed] [Google Scholar]
- Kovtun O, Leneva N, Bykov YS, Ariotti N, Teasdale RD, Schaffer M, Engel BD, Owen DJ, Briggs JAG, Collins BM (2018) Structure of the membrane‐assembled retromer coat determined by cryo‐electron tomography. Nature 561: 561–564 [DOI] [PMC free article] [PubMed] [Google Scholar]
- Kukulski W, Schorb M, Welsch S, Picco A, Kaksonen M, Briggs JAG (2012) Chapter 13 precise, correlated fluorescence microscopy and electron tomography of lowicryl sections using fluorescent fiducial markers. Methods Cell Biol 111: 235–257 [DOI] [PubMed] [Google Scholar]
- Kvainickas A, Jimenez‐Orgaz A, Nägele H, Hu Z, Dengjel J, Steinberg F (2017) Cargo‐selective SNX‐BAR proteins mediate retromer trimer independent retrograde transport. J Cell Biol 216: 3677–3693 [DOI] [PMC free article] [PubMed] [Google Scholar]
- Lauffer BEL, Melero C, Temkin P, Lei C, Hong W, Kortemme T, von Zastrow M (2010) SNX27 mediates PDZ‐directed sorting from endosomes to the plasma membrane. J Cell Biol 190: 565–574 [DOI] [PMC free article] [PubMed] [Google Scholar]
- Leneva N, Kovtun O, Morado DR, Briggs JAG, Owen DJ (2021) Architecture and mechanism of metazoan retromer:SNX3 tubular coat assembly. Sci Adv 7: eabf8598 [DOI] [PMC free article] [PubMed] [Google Scholar]
- Liu T, Gomez TS, Sackey BK, Billadeau DD, Burd CG (2012) Rab GTPase regulation of retromer‐mediated cargo export during endosome maturation. Mol Biol Cell 23: 2505–2515 [DOI] [PMC free article] [PubMed] [Google Scholar]
- Lucas M, Gershlick DC, Vidaurrazaga A, Rojas AL, Bonifacino JS, Hierro A (2016) Structural mechanism for cargo recognition by the retromer complex. Cell 167: 1623–1635 [DOI] [PMC free article] [PubMed] [Google Scholar]
- Luzio JP, Hackmann Y, Dieckmann NMG, Griffiths GM (2014) The biogenesis of lysosomes and lysosome‐related organelles. Cold Spring Harb Perspect Biol 6: a016840 [DOI] [PMC free article] [PubMed] [Google Scholar]
- Marcusson EG, Horazdovsky BF, Cereghino JL, Gharakhanian E, Emr SD (1994) The sorting receptor for yeast vacuolar carboxypeptidase Y is encoded by the VPS10 gene. Cell 77: 579–586 [DOI] [PubMed] [Google Scholar]
- Marquardt L, Taylor M, Kramer F, Schmitt K, Braus GH, Valerius O, Thumm M (2022) Vacuole fragmentation depends on a novel Atg18‐containing retromer‐complex. Autophagy 1–18 [DOI] [PMC free article] [PubMed] [Google Scholar]
- McNally KE, Faulkner R, Steinberg F, Gallon M, Ghai R, Pim D, Langton P, Pearson N, Danson CM, Nägele H et al (2017) Retriever is a multiprotein complex for retromer‐independent endosomal cargo recycling. Nat Cell Biol 19: 1214–1225 [DOI] [PMC free article] [PubMed] [Google Scholar]
- Michaillat L, Mayer A (2013) Identification of genes affecting vacuole membrane fragmentation in Saccharomyces cerevisiae . PLoS One 8: e54160 [DOI] [PMC free article] [PubMed] [Google Scholar]
- Michaillat L, Baars TL, Mayer A (2012) Cell‐free reconstitution of vacuole membrane fragmentation reveals regulation of vacuole size and number by TORC1. Mol Biol Cell 23: 881–895 [DOI] [PMC free article] [PubMed] [Google Scholar]
- Muriel O, Michon L, Kukulski W, Martin SG (2021) Ultrastructural plasma membrane asymmetries in tension and curvature promote yeast cell fusion. J Cell Biol 220: e202103142 [DOI] [PMC free article] [PubMed] [Google Scholar]
- Naslavsky N, McKenzie J, Altan‐Bonnet N, Sheff D, Caplan S (2009) EHD3 regulates early‐endosome‐to‐Golgi transport and preserves Golgi morphology. J Cell Sci 122: 389–400 [DOI] [PMC free article] [PubMed] [Google Scholar]
- Nothwehr SF, Bruinsma P, Strawn LA (1999) Distinct domains within Vps35p mediate the retrieval of two different cargo proteins from the yeast prevacuolar/endosomal compartment. Mol Biol Cell 10: 875–890 [DOI] [PMC free article] [PubMed] [Google Scholar]
- Peter BJ, Kent HM, Mills IG, Vallis Y, Butler PJG, Evans PR, McMahon HT (2004) BAR domains as sensors of membrane curvature: the amphiphysin BAR structure. Science 303: 495–499 [DOI] [PubMed] [Google Scholar]
- Peters C, Baars TL, Buhler S, Mayer A (2004) Mutual control of membrane fission and fusion proteins. Cell 119: 667–678 [DOI] [PubMed] [Google Scholar]
- Phillips‐Krawczak CA, Singla A, Starokadomskyy P, Deng Z, Osborne DG, Li H, Dick CJ, Gomez TS, Koenecke M, Zhang J‐S et al (2015) COMMD1 is linked to the WASH complex and regulates endosomal trafficking of the copper transporter ATP7A. Mol Biol Cell 26: 91–103 [DOI] [PMC free article] [PubMed] [Google Scholar]
- Purushothaman LK, Ungermann C (2018) Cargo induces retromer‐mediated membrane remodeling on membranes. Mol Biol Cell 29: 2709–2719 [DOI] [PMC free article] [PubMed] [Google Scholar]
- Purushothaman LK, Arlt H, Kuhlee A, Raunser S, Ungermann C (2017) Retromer‐driven membrane tubulation separates endosomal recycling from Rab7/Ypt7‐dependent fusion. Mol Biol Cell 28: 783–791 [DOI] [PMC free article] [PubMed] [Google Scholar]
- Rojas R, Kametaka S, Haft CR, Bonifacino JS (2007) Interchangeable but essential functions of SNX1 and SNX2 in the association of retromer with endosomes and the trafficking of mannose 6‐phosphate receptors. Mol Cell Biol 27: 1112–1124 [DOI] [PMC free article] [PubMed] [Google Scholar]
- Rojas R, van Vlijmen T, Mardones GA, Prabhu Y, Rojas AL, Mohammed S, Heck AJR, Raposo G, van der Sluijs P, Bonifacino JS (2008) Regulation of retromer recruitment to endosomes by sequential action of Rab5 and Rab7. J Cell Biol 183: 513–526 [DOI] [PMC free article] [PubMed] [Google Scholar]
- Roux A (2013) The physics of membrane tubes: soft templates for studying cellular membranes. Soft Matter 9: 6726–6736 [Google Scholar]
- Roux A, Koster G, Lenz M, Sorre B, Manneville J‐B, Nassoy P, Bassereau P (2010) Membrane curvature controls dynamin polymerization. Proc Natl Acad Sci U S A 107: 4141–4146 [DOI] [PMC free article] [PubMed] [Google Scholar]
- Saric A, Freeman SA (2020) Endomembrane tension and trafficking. Front Cell Dev Biol 8: 611326 [DOI] [PMC free article] [PubMed] [Google Scholar]
- Scott CC, Vacca F, Gruenberg J (2014) Endosome maturation, transport and functions. Semin Cell Dev Biol 31: 2–10 [DOI] [PubMed] [Google Scholar]
- Seaman MNJ (2021) The retromer complex: From genesis to revelations. Trends Biochem Sci 46: 608–620 [DOI] [PubMed] [Google Scholar]
- Seaman MNJ, Williams HP (2002) Identification of the functional domains of yeast sorting nexins Vps5p and Vps17p. Mol Biol Cell 13: 2826–2840 [DOI] [PMC free article] [PubMed] [Google Scholar]
- Seaman MN, McCaffery JM, Emr SD (1998) A membrane coat complex essential for endosome‐to‐Golgi retrograde transport in yeast. J Cell Biol 142: 665–681 [DOI] [PMC free article] [PubMed] [Google Scholar]
- Seaman MNJ, Harbour ME, Tattersall D, Read E, Bright N (2009) Membrane recruitment of the cargo‐selective retromer subcomplex is catalysed by the small GTPase Rab7 and inhibited by the Rab‐GAP TBC1D5. J Cell Sci 122: 2371–2382 [DOI] [PMC free article] [PubMed] [Google Scholar]
- Sheff MA, Thorn KS (2004) Optimized cassettes for fluorescent protein tagging in Saccharomyces cerevisiae . Yeast 21: 661–670 [DOI] [PubMed] [Google Scholar]
- Simonetti B, Paul B, Chaudhari K, Weeratunga S, Steinberg F, Gorla M, Heesom KJ, Bashaw GJ, Collins BM, Cullen PJ (2019) Molecular identification of a BAR domain‐containing coat complex for endosomal recycling of transmembrane proteins. Nat Cell Biol 21: 1219–1233 [DOI] [PMC free article] [PubMed] [Google Scholar]
- Simonetti B, Guo Q, Giménez‐Andrés M, Chen K‐E, Moody ERR, Evans AJ, Chandra M, Danson CM, Williams TA, Collins BM et al (2022) SNX27–Retromer directly binds ESCPE‐1 to transfer cargo proteins during endosomal recycling. PLoS Biol 20: e3001601 [DOI] [PMC free article] [PubMed] [Google Scholar]
- Simunovic M, Manneville J‐B, Renard H‐F, Evergren E, Raghunathan K, Bhatia D, Kenworthy AK, Voth GA, Prost J, McMahon HT et al (2017) Friction mediates scission of tubular membranes scaffolded by BAR proteins. Cell 170: 172–184 [DOI] [PMC free article] [PubMed] [Google Scholar]
- Solinger JA, Rashid H‐O, Prescianotto‐Baschong C, Spang A (2020) FERARI is required for Rab11‐dependent endocytic recycling. Nat Cell Biol 59: 237–212 [DOI] [PMC free article] [PubMed] [Google Scholar]
- Song X, Xu W, Zhang A, Huang G, Liang X, Virbasius JV, Czech MP, Zhou GW (2001) Phox homology domains specifically bind phosphatidylinositol phosphates. Biochemistry 40: 8940–8944 [DOI] [PubMed] [Google Scholar]
- Steinberg F, Gallon M, Winfield M, Thomas EC, Bell AJ, Heesom KJ, Tavaré JM, Cullen PJ (2013) A global analysis of SNX27–retromer assembly and cargo specificity reveals a function in glucose and metal ion transport. Nat Cell Biol 15: 461–471 [DOI] [PMC free article] [PubMed] [Google Scholar]
- Strochlic TI, Setty TG, Sitaram A, Burd CG (2007) Grd19/Snx3p functions as a cargo‐specific adapter for retromer‐dependent endocytic recycling. J Cell Biol 177: 115–125 [DOI] [PMC free article] [PubMed] [Google Scholar]
- Temkin P, Lauffer B, Jäger S, Cimermancic P, Krogan NJ, von Zastrow M (2011) SNX27 mediates retromer tubule entry and endosome‐to‐plasma membrane trafficking of signalling receptors. Nat Cell Biol 13: 715–721 [DOI] [PMC free article] [PubMed] [Google Scholar]
- Wassmer T, Attar N, Harterink M, van Weering JRT, Traer CJ, Oakley J, Goud B, Stephens DJ, Verkade P, Korswagen HC et al (2009) The retromer coat complex coordinates endosomal sorting and dynein‐mediated transport, with carrier recognition by the trans‐Golgi network. Dev Cell 17: 110–122 [DOI] [PMC free article] [PubMed] [Google Scholar]
- van Weering JRT, Sessions RB, Traer CJ, Kloer DP, Bhatia VK, Stamou D, Carlsson SR, Hurley JH, Cullen PJ (2012) Molecular basis for SNX‐BAR‐mediated assembly of distinct endosomal sorting tubules. EMBO J 31: 4466–4480 [DOI] [PMC free article] [PubMed] [Google Scholar]
- Yong X, Mao L, Seaman MNJ, Jia D (2022) An evolving understanding of sorting signals for endosomal retrieve. iScience 25: 104254 [DOI] [PMC free article] [PubMed] [Google Scholar]
- Yu JW, Lemmon MA (2001) All phox homology (PX) domains from Saccharomyces cerevisiae specifically recognize phosphatidylinositol 3‐phosphate. J Biol Chem 276: 44179–44184 [DOI] [PubMed] [Google Scholar]
- Zhang Y, Pang X, Li J, Xu J, Hsu VW, Sun F (2021) Structural insights into membrane remodeling by SNX1. Proc Natl Acad Sci U S A 118: e2022614118 [DOI] [PMC free article] [PubMed] [Google Scholar]
- Zieger M, Mayer A (2012) Yeast vacuoles fragment in an asymmetrical two‐phase process with distinct protein requirements. Mol Biol Cell 23: 3438–3449 [DOI] [PMC free article] [PubMed] [Google Scholar]