Abstract
Widespread aberrant gene expression is a pathological hallmark of polycystic kidney disease (PKD). Numerous pathogenic signaling cascades, including c-Myc, Fos, and Jun are transactivated. However, the underlying epigenetic regulators are poorly defined. Here we show that H3K27ac, an acetylated modification of DNA packing protein histone H3 that marks active enhancers, is elevated in mouse and human samples of autosomal dominant PKD. Using comparative H3K27ac ChIP-Seq analysis, we mapped over 16000 active intronic and intergenic enhancer elements in Pkd1-mutant mouse kidneys. We found that the cystic kidney epigenetic landscape resembles that of a developing kidney, and over 90% of upregulated genes in Pkd1-mutant kidneys are co-housed with activated enhancers in the same topologically associated domains. Furthermore, we identified an evolutionarily-conserved enhancer cluster downstream of the c-Myc gene and super-enhancers flanking both Jun and Fos loci in mouse and human models of autosomal dominant PKD. Deleting these regulatory elements reduced c-Myc, Jun, or Fos abundance and suppressed proliferation and 3D cyst growth of Pkd1-mutant cells. Finally, inhibiting glycolysis and glutaminolysis or activating Ppara in Pkd1-mutant cells lowerd global H3K27ac levels and its abundance on c-Myc enhancers. Thus, our work suggests that epigenetic rewiring mediates the transcriptomic dysregulation in PKD, and the regulatory elements can be targeted to slow cyst growth.
Keywords: Polycystic kidney disease, enhancers, super-enhancers, H3K27ac, ChIP-Seq, c-Myc, Jun, Fos, epigenetics
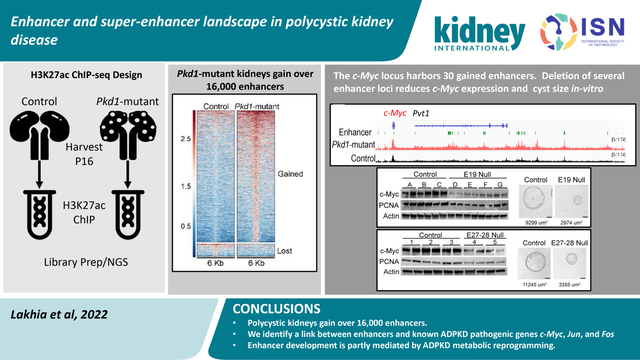
Graphical Abstract
INTRODUCTION
Autosomal Dominant Polycystic Kidney Disease (ADPKD), primarily caused by mutations in the PKD1 or PKD2 genes, affects nearly 12 million individuals worldwide and equally affects individuals irrespective of gender or race1. Fifty percent of individuals with ADPKD develop kidney failure2. The clinical hallmark of ADPKD is massive bilateral kidney enlargement due to numerous kidney tubule-derived cysts. These cysts are lined by rapidly proliferating and metabolically deranged tubular epithelial cells3–7, fueling their relentless growth. Additionally, there is substantial interstitial inflammation and fibrosis, which contributes to GFR decline8. Tolvaptan, a vasopressin receptor 2 antagonist, slows the rate of kidney function decline and is the only FDA-approved treatment9,10. There are other emerging therapeutic modalities11–14, but ADPKD pathogenesis is still incompletely understood, and there is a dire need for uncovering new drug targets.
Enhancers are dynamic cis-regulatory DNA elements (CREs), approximately 200–2,000 bp, that help shape cellular and tissue identity by fine-tuning transcriptomic makeup15. Active enhancers are marked by the transcriptionally-permissive H3K27 acetylation (H3K27ac) histone modification and accessible chromatin that allows the binding of sequence and cell type-specific transcription factors, transcriptional co-activators, and RNA polymerase II (RNAP II)16,17. A subset of CREs are referred to as super-enhancers18–20. These span large genomic regions (several kb in length) and exhibit unusually high transcriptional factor binding density and H3K27ac histone modifications. Active enhancers/super-enhancers physically interact with gene promoters, often over long genomic distances, to regulate gene transcription15. Unlike promoters, enhancers/super-enhancers can be present upstream or downstream of their target genes. The enhancer/super-enhancer landscape is tissue-specific, contributing to each organ’s unique transcriptomic output. Enhancers are also dynamically regulated, facilitating gene expression switches accompanying tissue developmental stage. With regards to diseases, enhancer biology is best studied in cancer, where many tumor-specific enhancers/super-enhancers have been reported. Moreover, targeting enhancers has shown early promise as a novel method to reduce pathogenic gene expression. However, barring a few exceptions21,22, enhancer impact on most kidney diseases still remains poorly defined.
Large-scale transcriptomic dysregulation is a pathological hallmark of ADPKD. Numerous pro-proliferative and pathogenic signaling cascades, including c-Myc, Fos, Jun, and cAMP23–25, are transactivated in cystic kidneys. Thus, the goal of this study was to define the epigenetic mechanisms that underlie this widespread aberrant gene expression. We perform a comparative H3K27ac ChIP-Seq analysis and provide a detailed enhancer/super-enhancer map of cystic kidneys. We find that mice and human ADPKD kidneys bear a similar enhancer signature. Moreover, we dissect and characterize a series of enhancers flanking the pathogenic c-Myc, Jun, and Fos genes. Finally, our studies suggest that enhancer rewiring is partly fueled by the metabolic reprogramming observed in ADPKD kidneys. Together, the epigenetic map unveiled by our studies has uncovered a series of potential new targets to slow cyst growth.
METHODS
Details for all experiments are provided in supplementary methods.
ChIP-seq:
ChIP was performed using Simple ChIP Enzymatic Chromatin IP Kit (Cell-Signaling #9005). The H3K27ac enriched regions were analyzed by quantitative real-time PCR and ChIP-seq.–(Suppl. Table 1,2). to obtain 50–60 million reads per sample. Additional details_included in supplemental methods.
Generation of CRISPR-KO cell lines:
SgRNAs were designed to flank enhancers (Suppl. Table 3). Clonal cell lines were genotyped (Suppl Table 4) to assess for deletion of each respective enhancer. In each experiment, clonal cell lines which underwent transfection with sgRNAs but did not develop deletion of enhancers were utilized as control cell lines for subsequent experiments.
Data Availability:
ChIP-seq data are available at Geo Expression Omnibus GSE189153 and GSE202681.
RESULTS
H3K27ac histone modification is increased in mouse and human ADPKD samples:
Active enhancers are marked by H3K27ac, an acetylation of lysine residue (27th position) of the DNA packing protein Histone H326. Therefore, to assess the epigenetic status of cystic kidneys, we began by measuring global H3K27ac abundance in kidneys of orthologous ADPKD mouse models. We assessed total H3K27ac levels in lysates from whole kidneys of 18-day-old KspCre;Pkd1F/RC (Pkd1-mutant) mice and littermate control mice. Western blot analysis revealed increased H3K27ac in Pkd1-mutant kidneys compared to control kidneys (Fig 1A). Next, we extracted histones from whole kidneys of Pkd1-mutant and 28-day-old Pkhd1cre; Pkd2F/F (Pkd2-KO), and their respective age-matched littermate control mice. We then used ELISA to quantify H3K27ac levels within the extracted histones. We found that H3K27ac levels were 55% higher in Pkd1-mutant and 17% higher in Pkd2-KO kidneys compared to their respective age-matched control kidneys (Fig. 1B–C). Moreover, staining with an anti-H3K27ac antibody and quantification of random 20x images demonstrated that the H3K27ac signal was higher in Pkd1-mutant kidneys (Fig. 1E–F and M, Suppl Fig 1A) and in Pkd2-KO kidneys compared to their respective control kidneys (Fig. 1G–H and N, Suppl Fig 1B). We also measured H3K27ac abundance in the long-lived, slowly progressive Pkd1RC/RC ADPKD mouse model. Compared to age-matched controls, the H3K27ac level was increased in 160-day-old Pkd1RC/RC mice kidneys (Fig. 1I, J, and O, Suppl Fig 1C). Notably, the predominant increase in the H3K27ac signal in each mouse model originates from the cyst epithelial cells.
Figure 1. Global H3K27ac level is increased in ADPKD models.
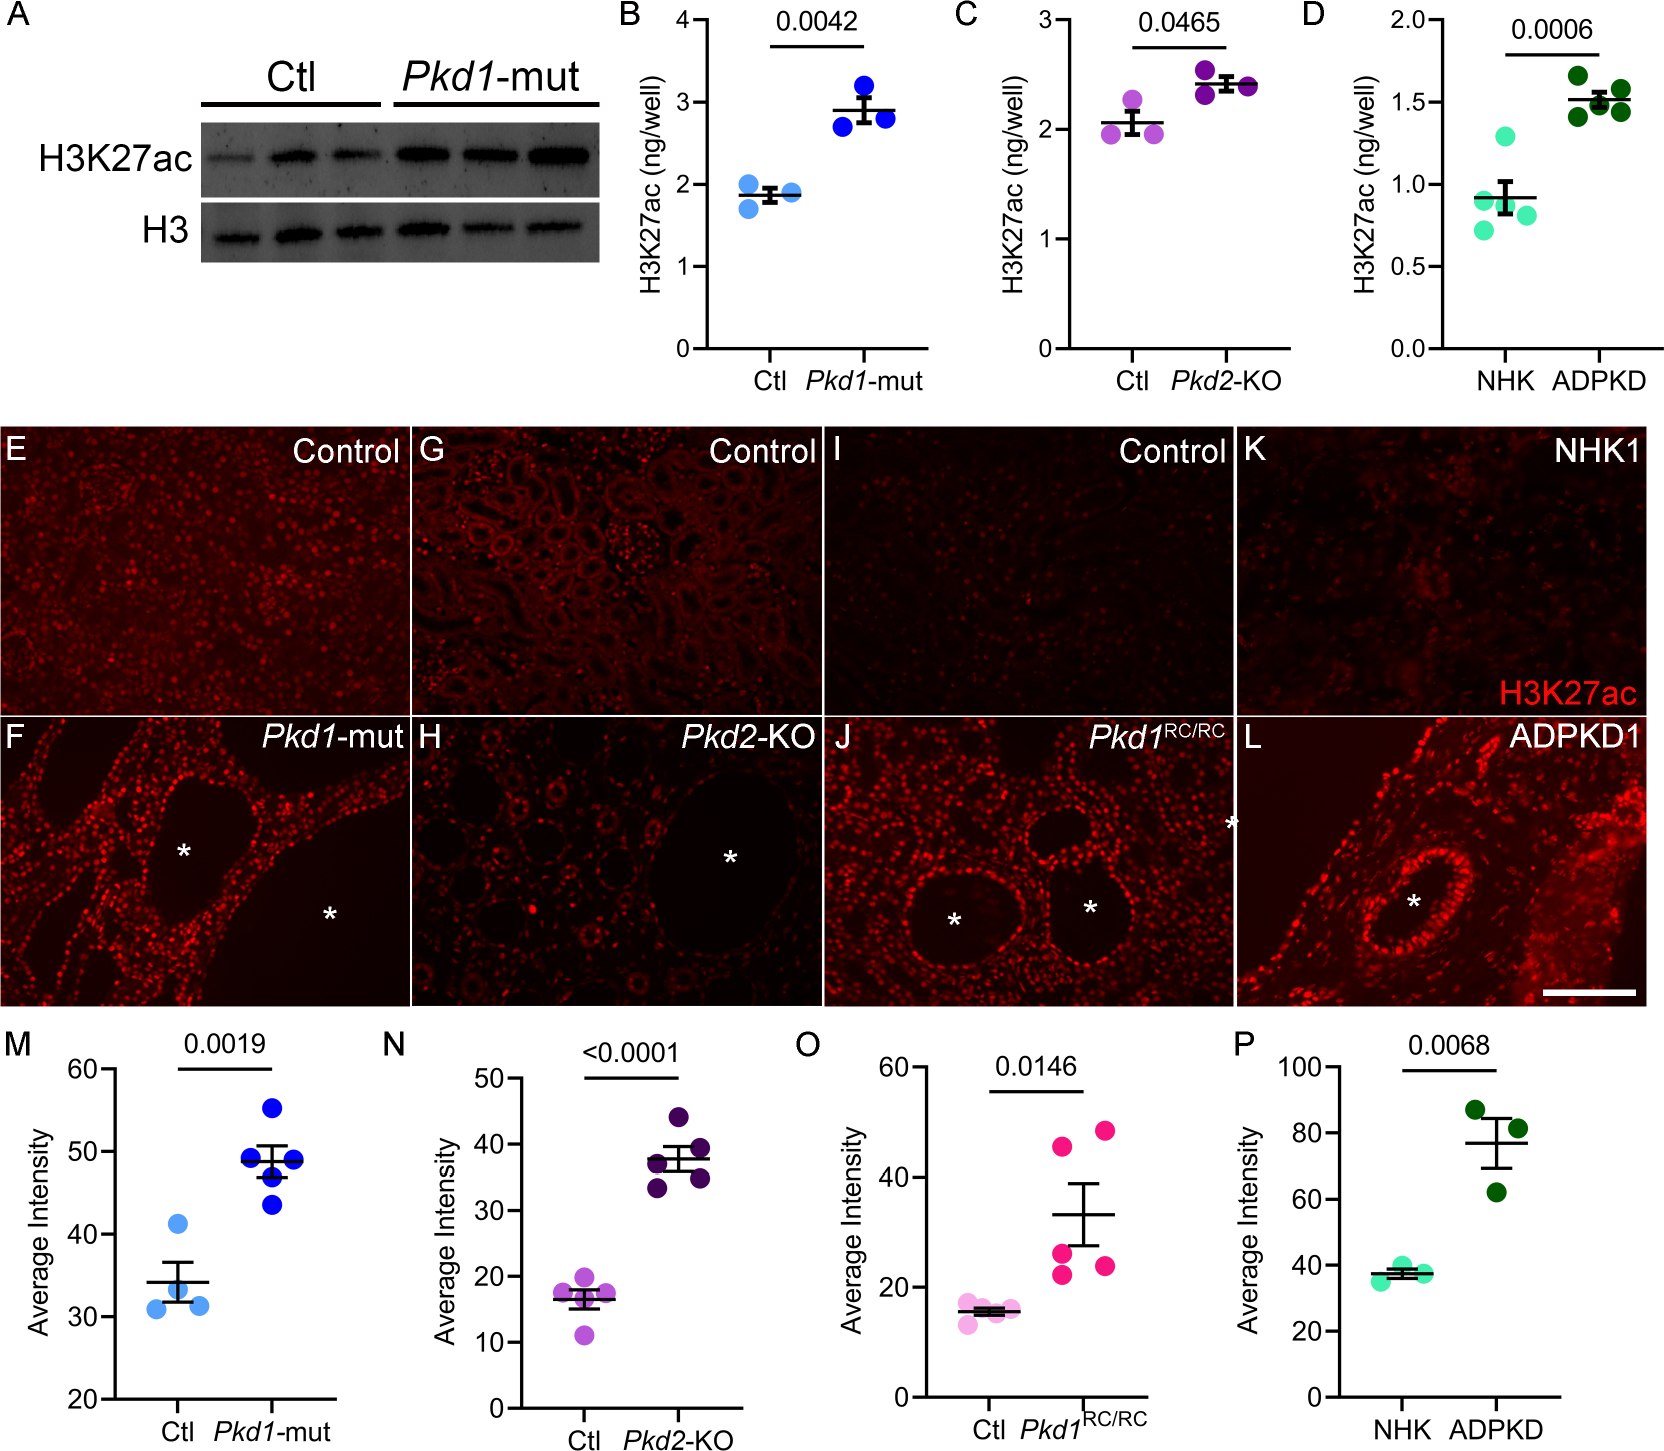
A. Western blot showing higher H3K27ac levels in kidneys of 18-day-old Pkd1-mutant mice compared to age matched control mice. Histone H3 serves as the loading control. B and C. ELISA showing higher H3K27ac levels in 18-day-old Pkd1-mutant and 21-day-old Pkd2-KO kidneys compared to their respective age-matched control kidneys (N=3). D. ELISA showing higher H3K27ac levels in human ADPKD samples compared to normal human kidney (NHK) samples (N=5). E-L Representative images of immunofluorescence staining with anti-H3K27ac antibody in kidney sections of 18-day-old Pkd1-mutant, 21-day-old Pkd2-KO, 160-day-old Pkd1RC/RC, and human ADPKD samples compared their respective controls. M-P. Quantification of the average H3K27ac intensity using the Image J software is shown. Error bars indicate SEM; * cyst; scale bar = 100 μM; Statistical analysis: Student’s t-test.
To determine whether our observations in mouse models are relevant to human ADPKD, we measured H3K27ac using ELISA and immunofluorescence in normal human kidney (NHK) samples and cystic kidney samples from individuals with ADPKD. Similar to murine ADPKD models, ELISA-measured H3K27ac level was increased in human ADPKD samples by 64% compared to NHK controls (Fig. 1C). Moreover, immunofluorescence staining of NHK and ADPKD kidney samples demonstrated higher H3K27ac signal primarily enriched in cyst epithelial cells (Fig. 1K,L, and P, Suppl Fig. 2). Thus, global H3K27ac levels are increased in mouse and human ADPKD.
Comparative H3K27ac ChIP-Seq uncovers the enhancer landscape of cystic kidneys:
Our observation of higher H3K27ac levels in ADPKD models points to substantial epigenetic rewiring in cystic kidneys. As the first step towards identifying the enhancer landscape of cystic kidneys, we immunoprecipitated and sequenced DNA (ChIP-Seq) bound to H3K27ac-modified histones in 16-day-old control and Pkd1-mutant kidneys (Fig. 2A). We used 16-day-old Pkd1-mutant kidneys because they are mildly cystic, allowing us to identify enhancers in the early stages of cystogenesis. Principal component analysis and correlation analysis revealed that control and Pkd1-mutant samples clustered separately (Suppl Fig. 3A, B). Direct visualization of ChIP-Seq tracks indicated equal H3K27ac signal at promoter loci of Umod and Bcl6 in control and Pkd1-mutant kidneys (Suppl Fig. 3C). We then cross-compared the H3K27ac-modified epigenome of control and cystic kidneys. In concordance with our findings of higher total H3K27ac levels, we found that 16560 regulatory elements were gained (increased H3K27ac), and 1552 were lost (decreased H3K27ac) in Pkd1-mutant compared to control kidneys (Fig. 2B, Suppl Fig. 3D, E). H3K27ac signal was not significantly changed in 104,273 peaks between control and Pkd1-mutant kidneys. Moreover, annotation of these regulatory elements revealed that 93% of the differentially enriched H3K27ac ChIP-seq peaks were located in intron or intergenic regions (Fig. 2C). Only 2.8% of differentially enriched peaks were found in promoter regions indicating that the gain in H3K27ac signal was primarily derived from the development of new enhancers. We next validated our ChIP-Seq results by performing ChIP-qPCR of arbitrarily selected gained and lost regulatory elements in a new cohort of control and Pkd1 mutant kidneys (Suppl Fig. 3F). Furthermore, to determine if our ChIP-Seq results can be extrapolated to other orthologous ADPKD models, we performed H3K27ac ChIP using 21-day-old control and Pkd2-KO kidneys. We were able to validate Pkd1-mutant ChIP-Seq data even in Pkd2-KO kidneys, suggesting similar epigenetic rewiring in both ADPKD models (Suppl Fig. 3G). Finally, we compared enhancers gained in Pkd1-mutant kidneys with the Registry of candidate of cis-Regulatory Elements (cCRE) from ENCODE. cCREs are designated by the presence of at least two markers specific to cis-regulatory elements (DNASE, H3K27ac, H3K4me3, or CTCF). We found that 40% of Pkd1-mutant gained enhancers are also designated as cCREs by ENCODE (Suppl Table 5).
Figure 2. Comparative H3K27ac ChIP-seq uncovering the enhancer landscape in Pkd1-mutant kidneys.
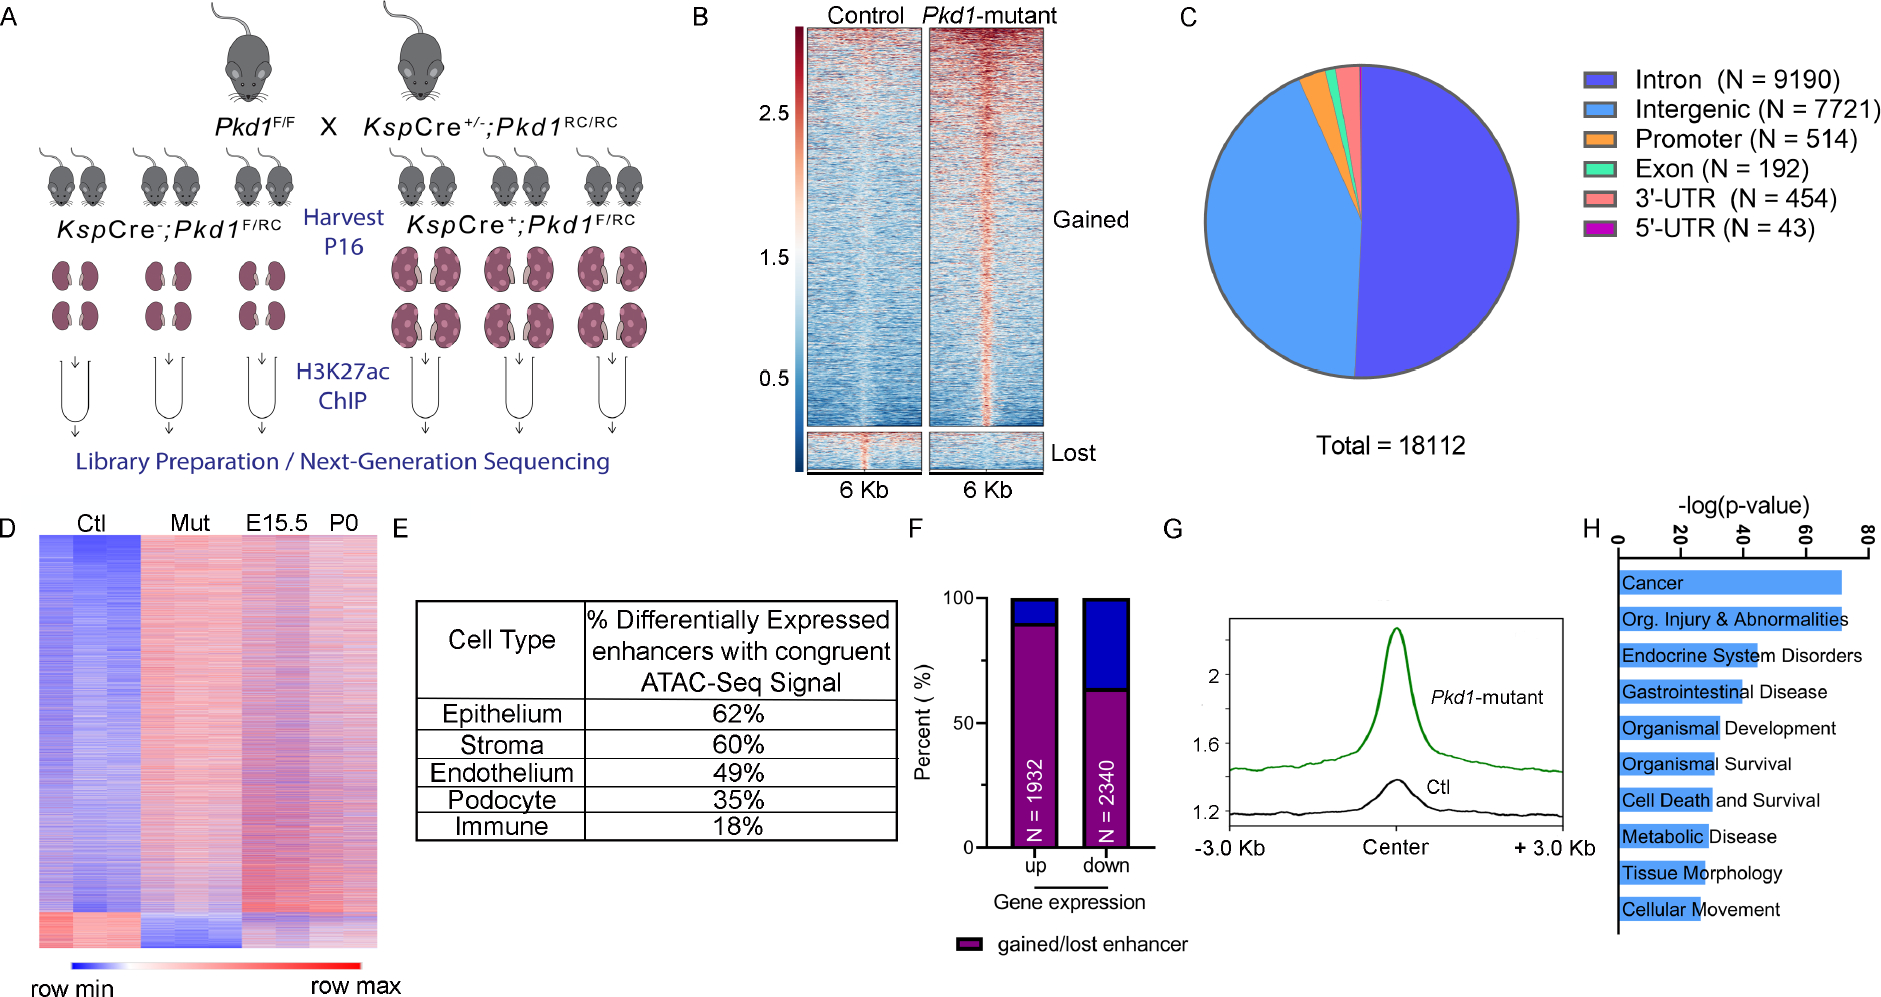
A. Graphic illustration of the comparative H3K27ac ChIP-Seq experimental design is shown. ChIP-seq was performed using three biological replicate samples, each containing pooled chromatin from four 16-day-old kidneys from control or Pkd1-mutant mice. B. Heatmap showing the signal intensity of H3K27ac (+/− 3kb) around the center of each differentially activated enhancer ordered by mean signal. Pkd1-mutant kidneys gained (higher H3K27ac level) 16560 enhancers and lost (lower H3K27ac level) 1552 enhancers. C. Pie chart depicting the genome-wide distribution of the differentially activated enhancers is shown. D. Heatmap shows the comparison of RPKM of differentially activated enhancers between control and Pkd1-mutant kidneys and wildtype E15.5 and P0 kidneys. E. The bulk H3K27Ac ChIP-seq data were deconvoluted using the E18.5 wildtype snATAC-seq dataset. The cellular distribution of activated enhancers is shown. F. Overlap of the Pkd1-mutant ChIP-Seq and RNA-Seq showing that >90% of upregulated genes are located in a TAD which co-houses an activated enhancer, whereas 64% of downregulated genes are located in a TAD which co-houses a lost enhancer. G. Average H3K27ac signal intensity of enhancer regions in control (black) and Pkd1-mutant (green) kidneys samples within TADs that houses upregulated genes. H. Ingenuity Pathway Analysis depicting the top pathways regulated by active enhancer upregulated gene pairs.
The transcriptomic profile of cystic kidneys has been likened to that of a developing kidney27. Therefore, we examined whether cystic and developing kidneys also share a similar epigenetic profile. We used ENCODE H3K27ac ChIP-Seq datasets and mapped enhancers in embryonic (E) 15.5 and postnatal day (P) 0 kidneys28,29. We then cross compared the ENCODE and our datasets and found that P16 non-cystic control kidneys have little resemblance to developing kidneys. In contrast, we noted that Pkd1-mutant kidneys share 42% and 32% of gained H3K27ac peaks with E15.5 and P0 kidneys, respectively (Fig. 2D, Suppl Fig. 4A–D, Suppl Tables 6–9). Next, we deconvoluted our bulk H3K27ac ChIP-Seq data by integrating a recently published single-cell ATAC-seq dataset of mouse E18.5 kidney30. In concordance with our findings of similarities with developing kidneys, 64% of active enhancers in Pkd1-mutant kidneys were found in regions with appropriately open/closed chromatin in the E18.5 kidneys (Suppl Fig. 4E, Suppl Table 5). Moreover, this analysis revealed that our bulk H3K27ac signal primarily mapped to open chromatin locations in tubular epithelial and stromal cells (Fig. 2E).
Enhancers regulate gene expression by interacting with nearby or very distant promoters. However, topological associated domain (TAD) boundaries serve as physical limits on the range of enhancer-promoter interaction31. To determine the influence of enhancers on dysregulated gene expression in PKD, we first overlapped the H3K27ac ChIP-Seq data with RNA-seq dataset from 22-day-old control and Pkd1-mutant kidneys23. Next, we examined the relationship between active enhancers and dysregulated genes located within the same TAD. 1671 TADs house Pkd1-mutant gained enhancers. 58% of these TADs also house genes that are upregulated. Moreover, we found that 90% of upregulated genes in Pkd1-mutant kidneys were located in a TAD that also housed a gained enhancer (Fig. 2F, G). Conversely, 64% of downregulated genes were found in a TAD that lost an enhancer. Finally, pathway analysis of the positively-correlated enhancer-dysregulated gene pairs revealed cancer signaling as the top influenced network (Fig. 2H). Closer examination of genes within the cancer signaling pathway identified c-Myc as the gene with the most associated enhancers. Taken together, our analysis has uncovered a large repertoire of regulatory enhancers in cystic kidneys.
Evolutionarily-conserved enhancer cluster transactivates c-Myc expression in cellular ADPKD model:
The proto-oncogene c-Myc is transactivated in mouse and human ADPKD, and its overexpression is sufficient to induce kidney cysts in mice23,32,33. However, how c-Myc expression is regulated in PKD is incompletely understood. We identified 30 regulatory elements spanning 2.5 Mbp surrounding the c-Myc gene that displayed significantly enriched H3K27ac signal in Pkd1-mutant kidneys compared to control kidneys (Fig. 3A,). A query of high-throughput chromatin conformation capture (Hi-C) datasets revealed that these 30 active enhancers physically interact with the c-Myc promotor (Fig. 3A)34. Similarly, PLAC-Seq mESC dataset indicate direct interaction of 20/30 enhancers with the c-Myc promoter (Suppl Figure 5A; Supplementary Table 10). We found that 22/30 enhancers are evolutionarily-conserved between mice and humans. Ten of these enhancers have not previously been reported (Supplementary Table 11)35. These observations suggest that the gained enhancers may underlie c-Myc upregulation in ADPKD and prompted us to validate this locus. We began by performing ChIP-qPCR in an independent cohort (biological replicates) of control and Pkd1-mutant kidneys and confirmed that 20 enhancers indeed display higher H3K27ac levels in cystic kidneys (Fig. 3B). As a pertinent negative control, we found several regions that exhibit equal H3K27ac signal in our ChIP-Seq data remained unchanged by ChIP-qPCR (Fig. 3B). Next, we asked which enhancers were also enriched in Pkd2-KO kidneys. ChIP-qPCR revealed that 13/20 enhancers have higher H3K27ac signal in Pkd2-KO kidneys compared to control kidneys (Fig. 3C). Finally, we examined whether these enhancers are relevant to human ADPKD. ChIP-qPCR showed that 12/20 enhancers exhibited higher H3K27ac modification in the human ADPKD samples (Fig. 3D). Taken together, our careful assessment of the c-Myc locus identified 12 evolutionarily-conserved enhancers that are activated in both mouse and human ADPKD samples.
Figure 3. Evolutionarily conserved enhancer cluster in the c-Myc locus is activated in ADPKD models.
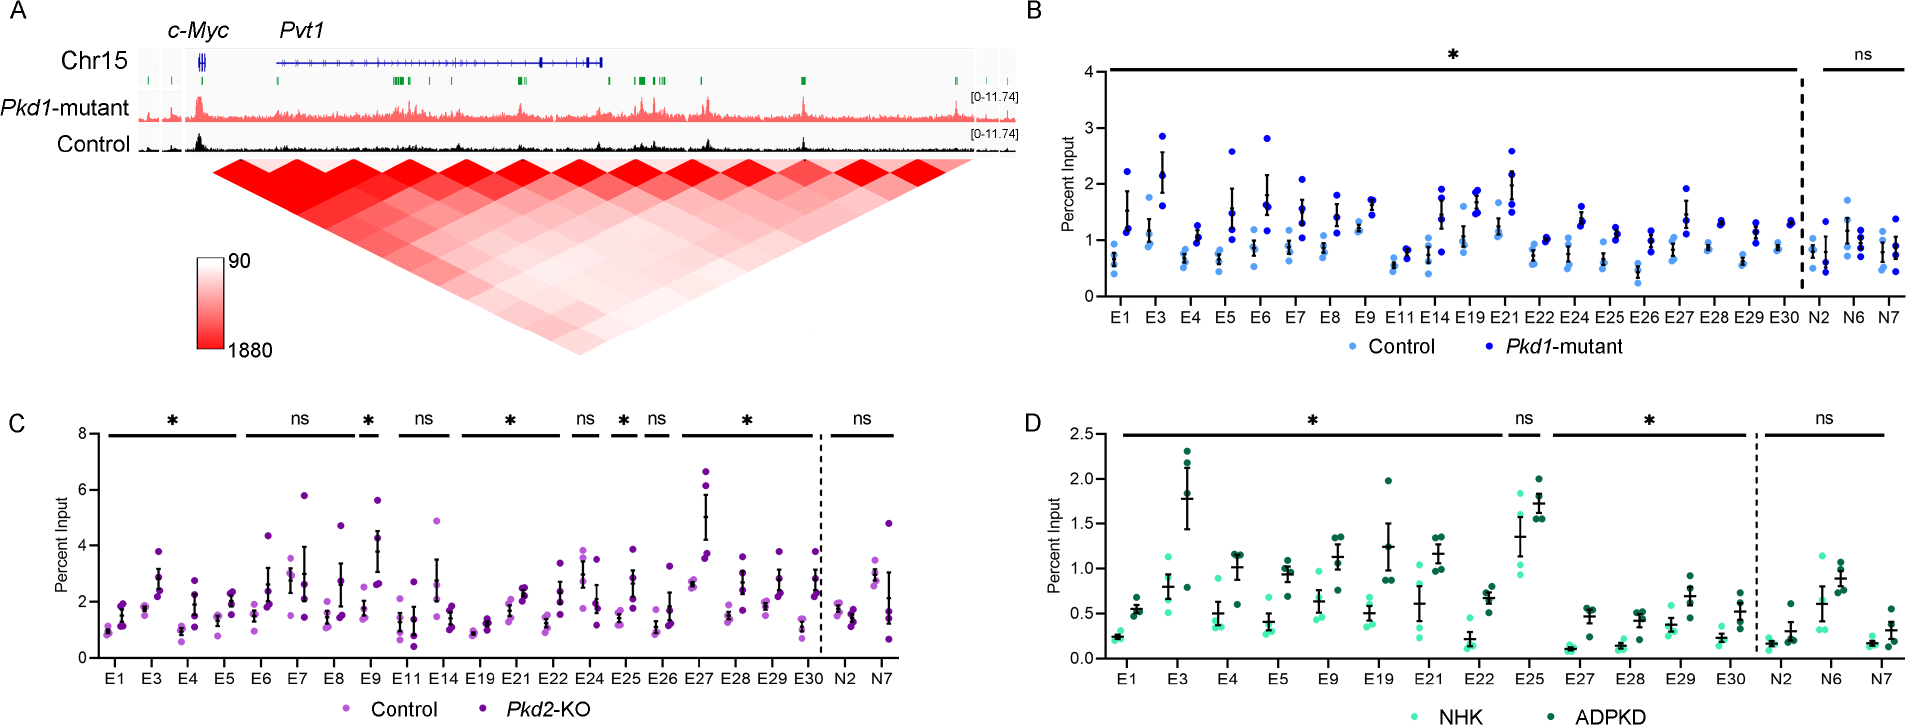
A. ChIP-seq tracks showing a higher H3K27ac signal within the c-Myc locus in 16-day-old Pkd1-mutant compared to control kidneys. The activated enhancers are marked as green rectangles and denoted as E1-E30 (numbered in 5’ to 3’ orientation). A chromatin contact map (red) for the c-Myc locus derived from Hi-C mouse embryonic stem cell dataset is shown. B-D. ChIP-qPCR validation of the E1-E30 enhancers in Pkd1-mutant (B), Pkd2-KO (C), and human ADPKD kidneys (D) compared to their respective controls. N=3–4 all groups; error bars indicate SEM; * P<0.05. ns P>0.05; Student’s t-test.
To determine if these enhancers drive c-Myc expression, we used CRISPR/Cas9 to delete them in a cellular Pkd1RC/− ADPKD model. The Pkd1RC/− cells are of collecting duct origin (see methods, Suppl Fig. 6A,B)36. Isogenic Pkd1RC/+ cells serve as controls. Our characterization of this new cellular model revealed that it recapitulates the key pathogenic hallmarks of Pkd1-mutant mice. We found that Pkd1RC/− cells have reduced Polycystin-1 (but not Polycystin-2) expression (Fig. 4A), higher 3D cyst growth (Fig. 4B), and proliferation rates (Fig. 4C) than Pkd1RC/+ cells. Importantly, we noted pathogenic ADPKD signaling, including higher c-Myc, Fos, and CREB expression in Pkd1RC/− compared to Pkd1RC/+ cells (Fig. 4A and Suppl. Fig 6B&C). Moreover, ELISA revealed 35% higher H3K27ac levels in Pkd1RC/− cells compared to Pkd1RC/+ cells (Fig. 4D). H3K27ac ChIP-Seq revealed that Pkd1RC/− cells possess 25% of enhancers gained in Pkd1-mutant kidneys including those in the c-Myc locus (Suppl Table 5, Suppl Fig. 7A). Notably, ChIP-qPCR validated increased H3K27ac modification on 10/22 conserved c-Myc-flanking enhancers in Pkd1RC/− cells compared to Pkd1RC/+ cells (Fig. 4E).
Figure 4. Enhancers activate c-Myc and regulate proliferation and cyst growth in Pkd1-mutant cells.
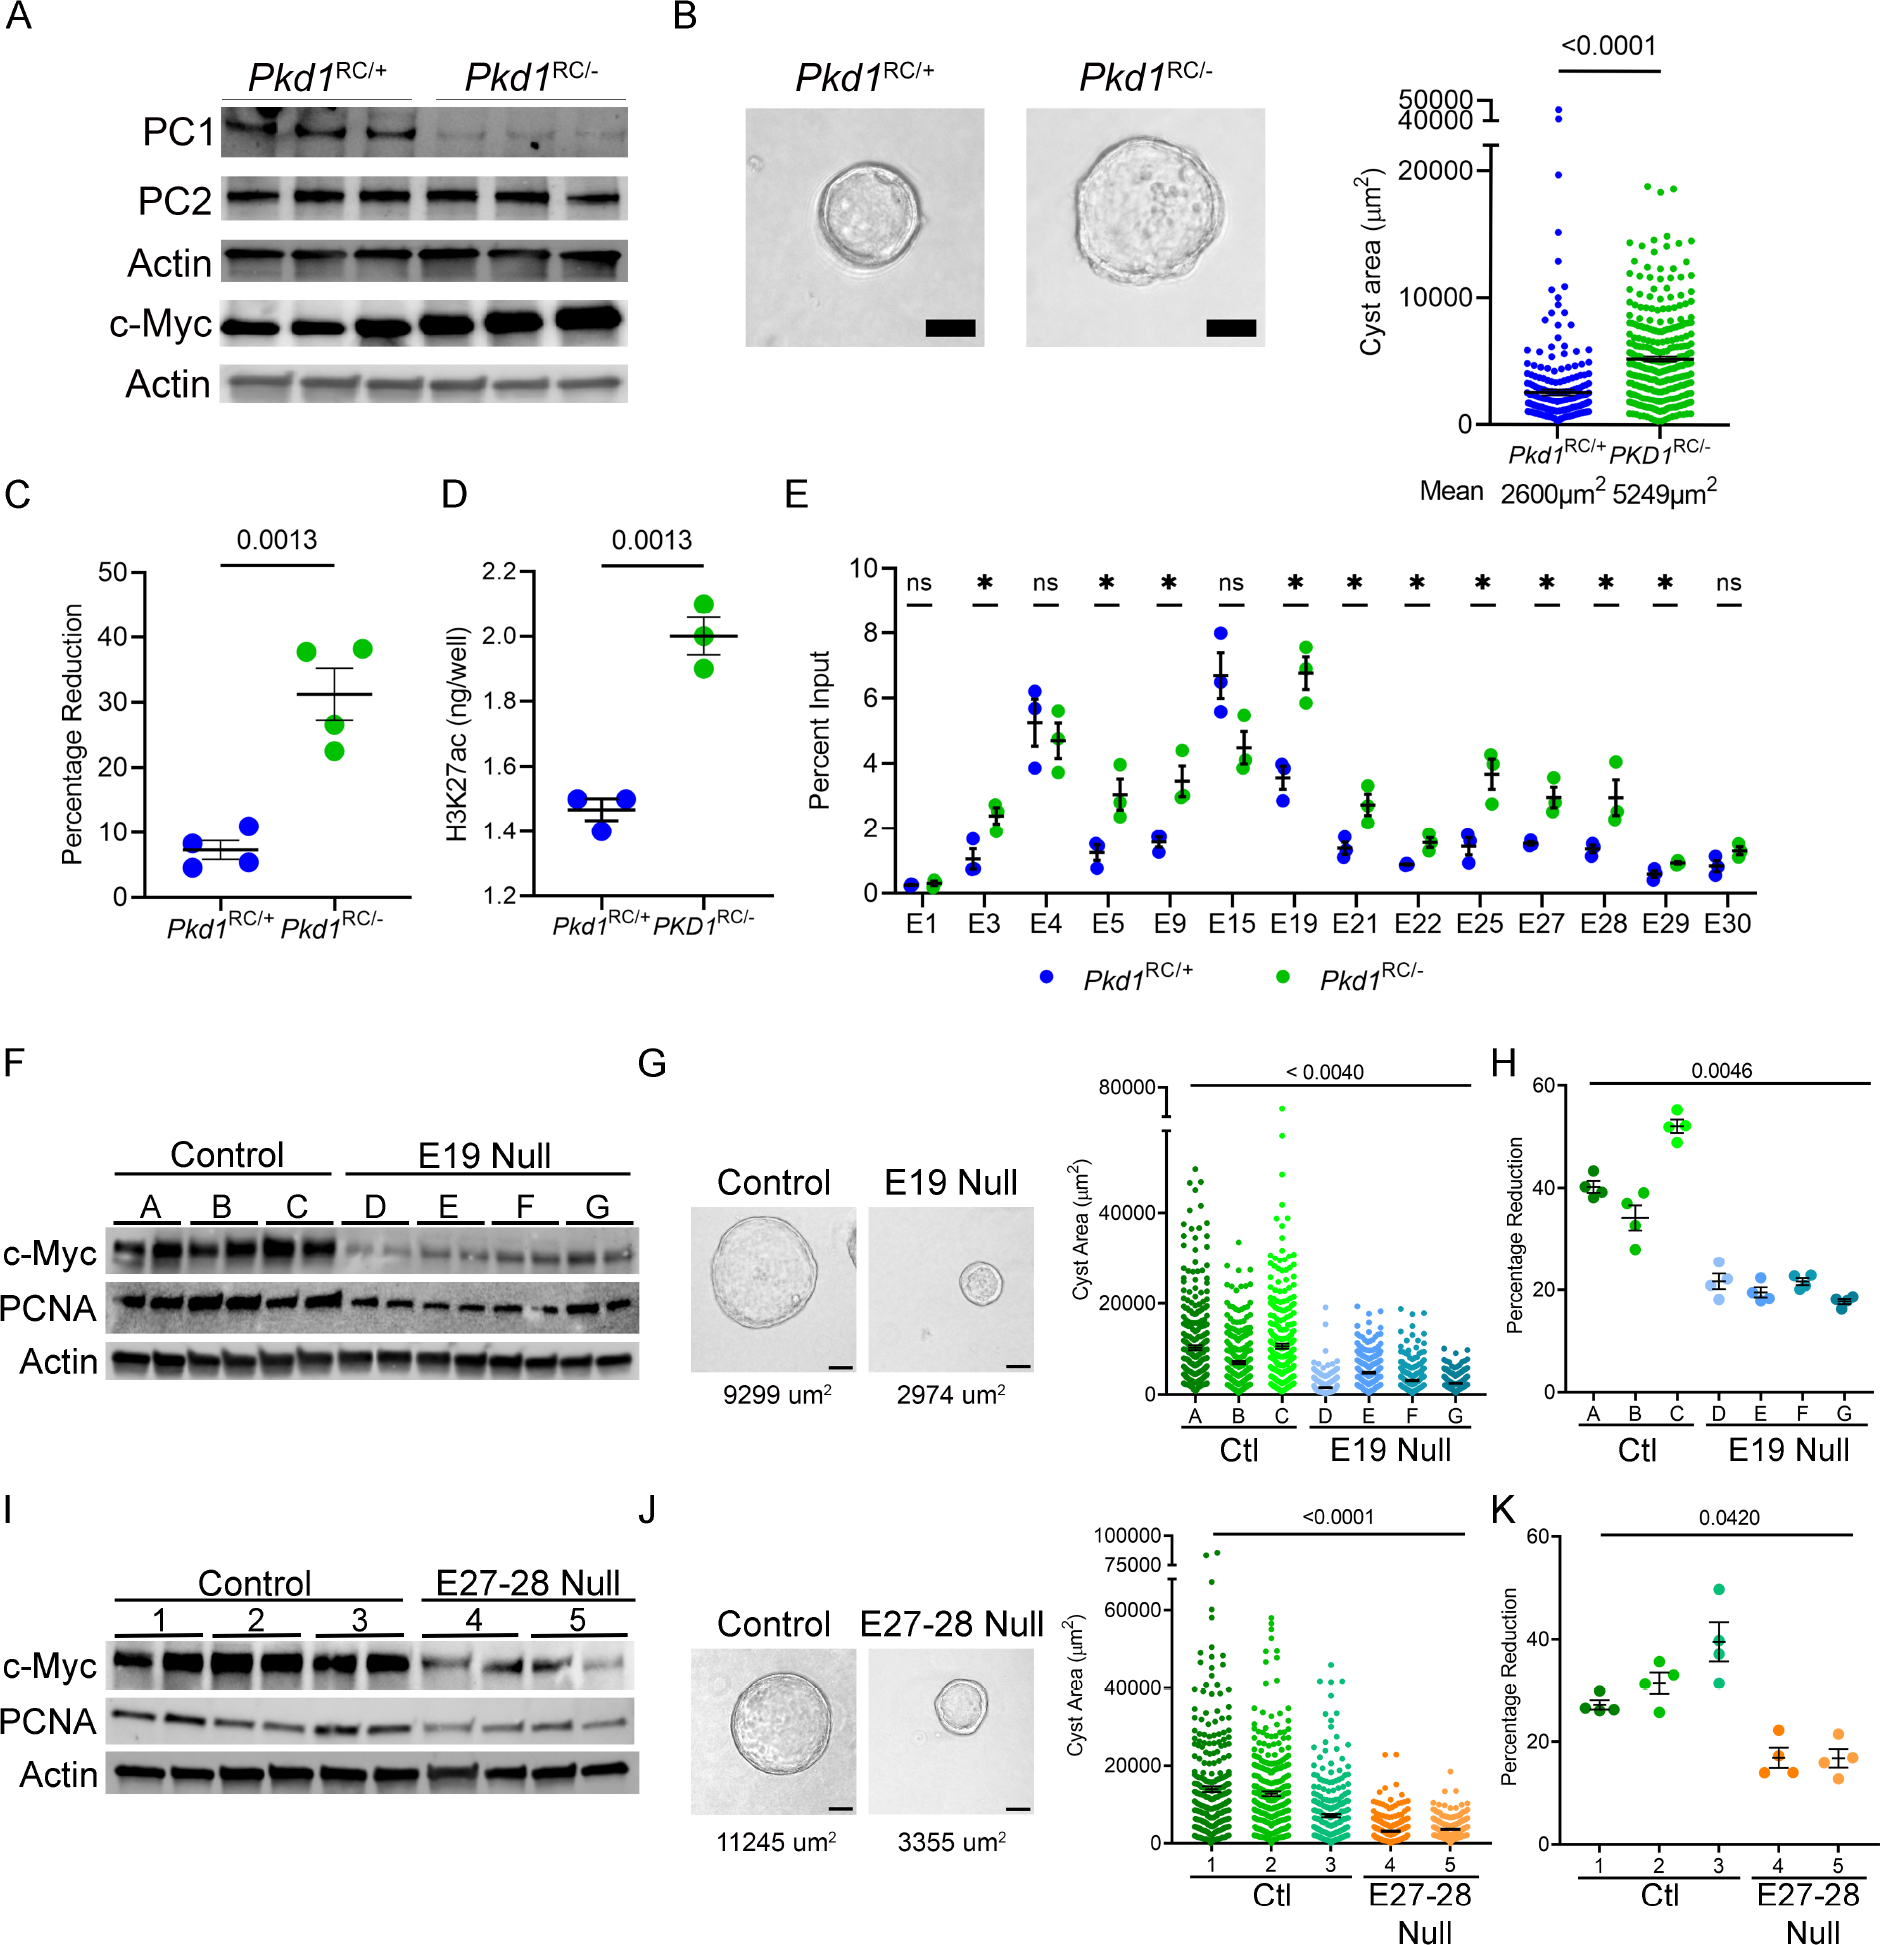
A. Western blot analysis showing reduced Polycystin1 (PC1) expression in Pkd1RC/− cells compared to parental Pkd1RC/+ cells. Polycystin2 (PC2) expression remained unchanged, whereas c-Myc expression was increased in Pkd1RC/− compared to Pkd1RC/+ cells. Actin serves as the normalizing loading control. B. Representative images and quantification showing increased cyst size of Pkd1RC/− compared to Pkd1RC/+ cells grown in 3D Matrigel for 7-days. C. Alamar Blue measurement 12 hours after incubation showing increased proliferation of Pkd1RC/− compared to Pkd1RC/+cells. D. ELISA showing higher global H3K27ac levels in Pkd1RC/− compared to Pkd1RC/+ cells. E. Comparative H3K27ac ChIP-qPCR validation of the c-Myc locus enhancers in Pkd1RC/− and Pkd1RC/+ cells. F. Western blot analysis showing reduced c-Myc expression in Pkd1RC/− cell lines lacking the E19 enhancer compared to the unedited Pkd1RC/− parental cells. G. Representative images and quantification showing reduced cyst size of E19-edited compared to unedited Pkd1RC/− cell lines grown 3D Matrigel for 7-days. Average cyst size for each group is reported. H. Alamar Blue-assessed proliferation rate of E19-edited and unedited Pkd1RC/− cells is shown. I-K. Western blot analysis, images and quantification of 3D cyst size, and Alamar Blue measurements showing reduced c-Myc expression, cyst size, and proliferation of Pkd1RC/− cells lacking the E27–28 enhancer cluster compared to the unedited parental Pkd1RC/− cells. Average cyst size for each group is reported. Images were taken at 20x magnification. N=300 (from 3 biological replicates) for all cyst measurements. N=4 biological replicates for all Alamar blue measurements. Error bars indicate SEM. * P < 0.05. ns = P > 0.05. Statistical analysis: Students t-test (B-E) and nested t-test (G, H) one-way ANOVA (J, K). Scale bars represent 25 μM.
The enhancer elements are referred to as E1 through E30, labeled based on their genomic position (in 5’–3’ orientation) within the TAD, which houses the c-Myc gene. First, we deleted the 3 kb region, encompassing the E19 enhancer in Pkd1RC/− cells. We generated four independent clonal cell lines lacking the E19 enhancer, and in all four cell lines, we noted a reduction in c-Myc expression (Fig. 4F, Suppl. Fig. 7B,C). We also noted that 3D cyst growth was reduced by 50% in E19 null clones compared to unedited Pkd1RC/− clones (Fig. 4G). Moreover, cellular proliferation as measured by Alamar Blue assay was reduced, and western blot analysis revealed lower PCNA levels in each E19 null clone compared to unedited clones (Fig. 4F,H). Next, we generated two clonal cell lines that lacked a 1.6 kb region encompassing E27 and E28 enhancers (Suppl Fig 7D,E). Again, we noted reduced c-Myc and PCNA expression (Fig. 4I), a 30% reduction in cyst size (Fig. 4J), and a lower proliferation rate (Fig. 4K) in E27–28 deleted Pkd1RC/− cell lines compared to their unedited counterparts. We also deleted the locus containing E5-E9 enhancers (Suppl Fig. 8A). However, this deletion was not sufficient to reduce Myc. Finally, we attempted to delete three additional loci containing E21–22, E25, and E29. However, we could only recover heterozygous deletions of E21–22 and E25 (Suppl Figure 8B,C), and we did not observe differences in c-Myc expression. Similarly, we did not obtain even heterozygous deletion E29 despite multiple attempts. Thus, genomic loci bearing E19, E27, and E28 enhancers promote c-Myc expression in cellular ADPKD models.
Super-enhancers promote Fos and Jun expression:
Super-enhancers are large genomic regions that contain multiple enhancers in close proximity to each other. We used the ROSE (Rank Ordering of Super-Enhancers) bioinformatic tool to map ADPKD-relevant super-enhancers from our H3K27ac ChIP-Seq dataset19,37. Using differential binding analysis, we found that Pkd1-mutant kidneys gained 101 (higher H3K27ac) and lost 5 (lower H3K27ac) super-enhancers compared to control kidneys (Fig. 5A–B, Suppl Fig 9A,B, Suppl Table 12). These super-enhancers, on average, were 71kb in length and exhibited >50-fold higher H3K27ac modification compared to a typical enhancer (Fig 5C and D). Moreover, average gene expression in TADs which house super-enhancers was 300% higher in Pkd1-mutant kidneys compared to gene expression in TADs without a super-enhancer (Fig 5E). Interestingly, cross-comparison with the dbSUPER super-enhancer database revealed that numerous gained super-enhancers were enriched in stromal and immune cells, suggesting epigenetic rewiring even in the cyst microenvironment (Fig. 5F). Finally, motif analysis revealed that the AP-1 binding element was significantly enriched amongst the gained super-enhancers (Fig 5G).
Figure 5. Super-enhancer landscape of ADPKD.
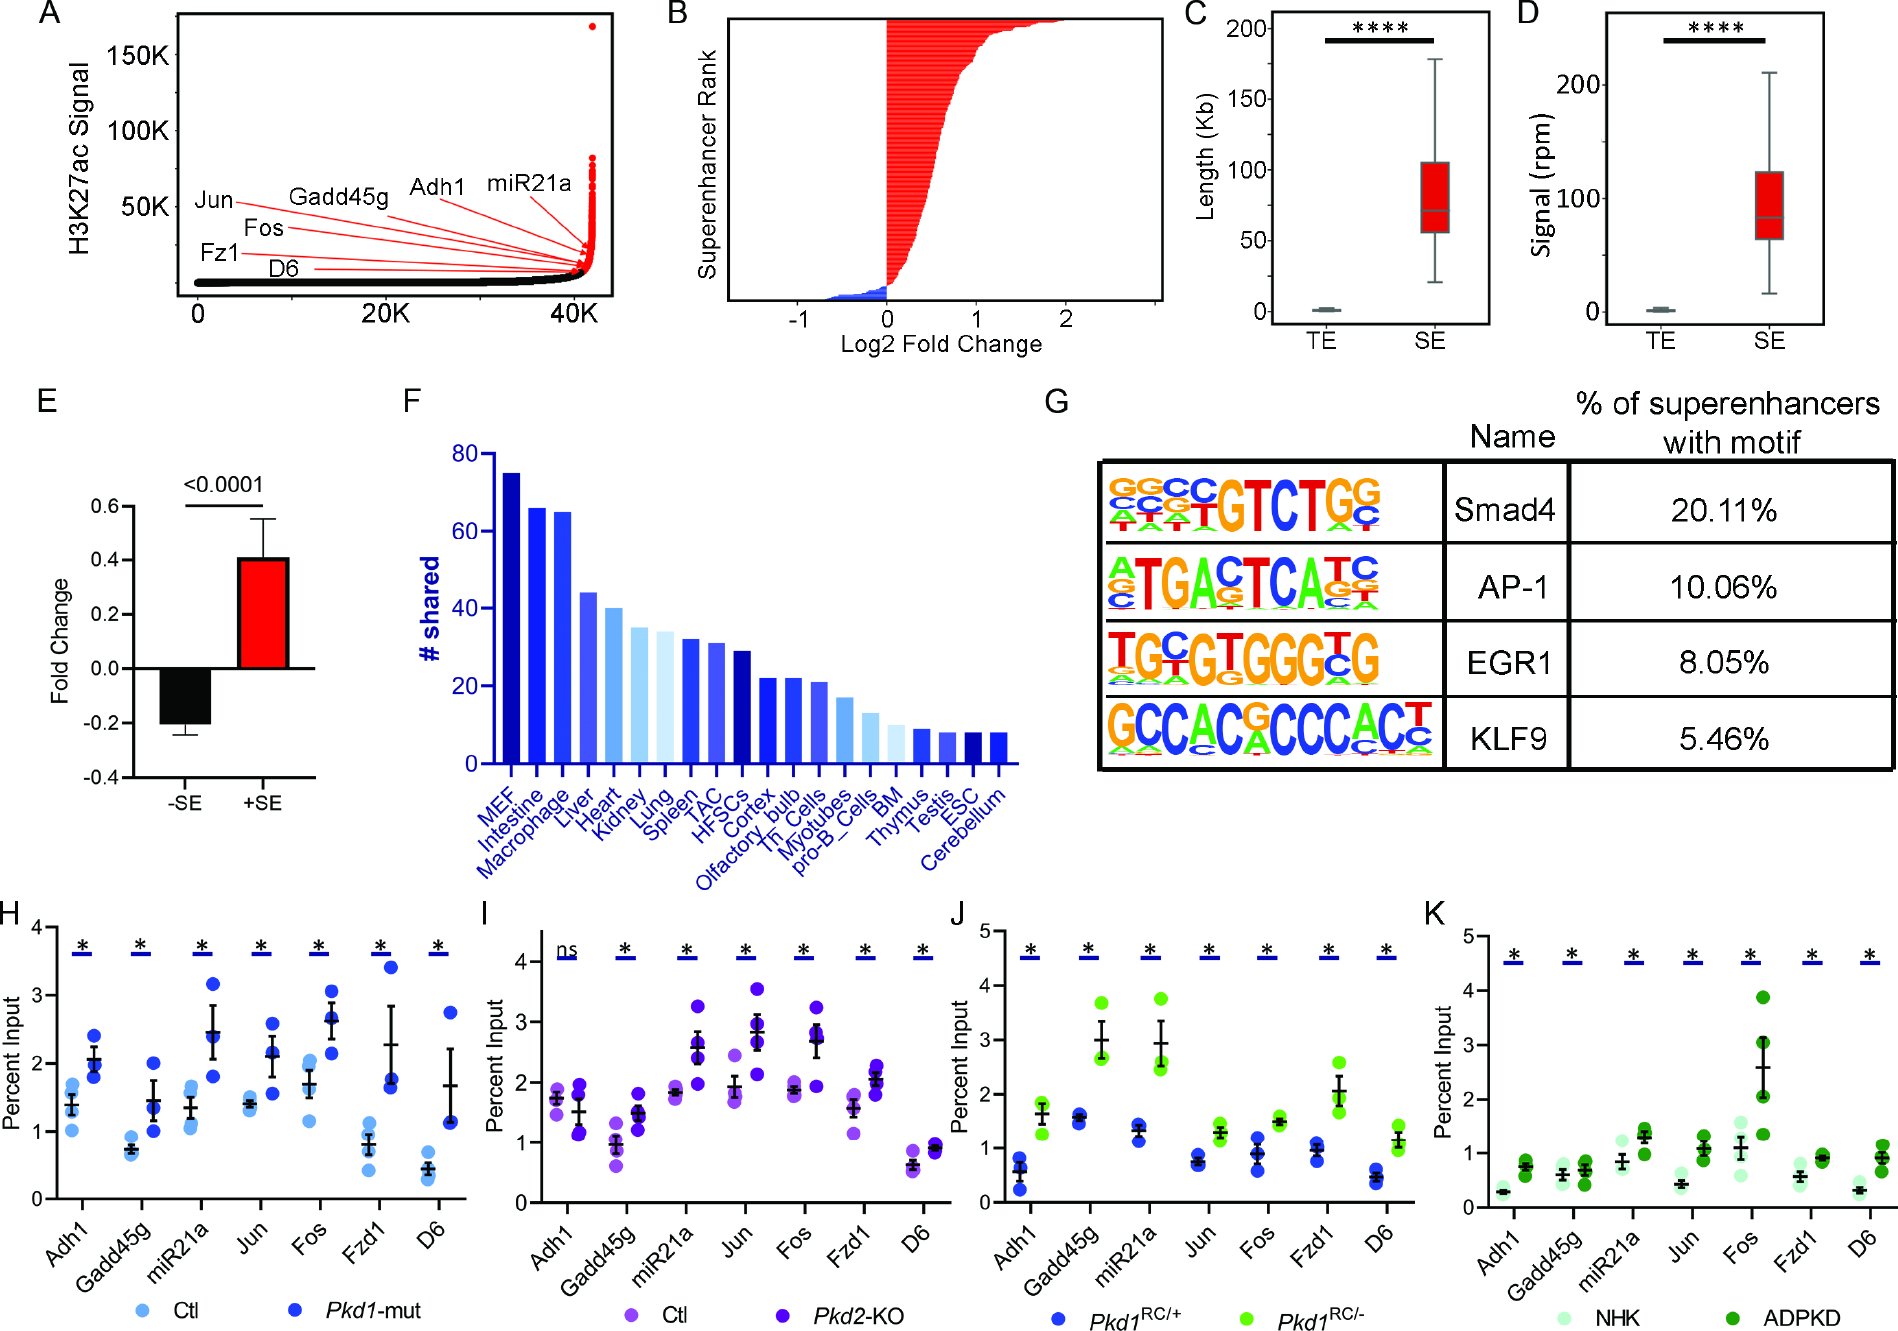
A. Hockey stick plot showing rank-ordered, input normalized H3K27ac signal in Pkd1-mutant and control kidneys. The CREs meeting the super-enhancer criteria are highlighted in red. Selected super-enhancers annotated based on nearest neighboring genes are shown. B. The graph depicts all differentially activated super-enhancers rank-ordered based on Log2 fold change in the H3K27ac signal in 16-day-old Pkd1-mutant compared to control kidneys. Red indicates super-enhancers with higher and blue indicates those with lower H3K27ac signal in Pkd1-mutant compared to control kidneys. One hundred five super-enhancers were gained, and five were lost in Pkd1-mutant compared to control kidneys. C and D. Quantification of genomic length and H3K27ac signal intensity of Pkd1-mutant gained super-enhancers (SE) versus total enhancers (TE) is shown. E. Average fold change of differentially expressed genes is 300% higher in TADs which house a gained super-enhancer compared to average fold change of genes which do not reside in a TAD with a gained super-enhancer. F. The Pkd1-mutant and dbSUPER super-enhancer datasets were cross-compared. The graph depicts the common super-enhancers found in both databases broken down based on cell and tissue type. G. Motif analysis of super-enhancers using the Homer software is shown. H-K. ChIP-qPCR validation of selected super-enhancers in Pkd1-mutant and Pkd2-KO kidneys, Pkd1RC/− cells, and human ADPKD samples compared to their respective controls. N = 3–4 all groups. * P < 0.05, **** P <0.001. ns = P > 0.05. Error bars indicate SEM. Statistical analysis: Nested t-test (C and D), Student’s t-test (H-K)
AP-1 is a tetramer transcription factor comprised of Jun and Fos. Interestingly, we noted that Jun and Fos themselves are flanked by gained super-enhancers. Considering both Jun and Fos are implicated in ADPKD, we asked whether these super-enhancers are relevant to cyst growth. First, ChIP-qPCR in control and Pkd1-mutant kidneys confirmed higher H3K27ac modification on Fos, Jun, and a series of other randomly selected super-enhancers (Fig. 5H). Moreover, we found this super-enhancer landscape was also observed in Pkd2-mutant kidneys, Pkd1RC/− cells, and human ADPKD samples compared to their respective controls (Fig. 5I–K). The Fos super-enhancer encompasses a 35 kb region upstream of the Fos gene promoter (Fig. 6A). We used CRISPR/Cas9 to delete the upstream super-enhancer while leaving the Fos promoter intact in Pkd1RC/− cells. Compared to unedited Pkd1RC/− cells, we found that Pkd1RC/− cells with a heterozygous deletion of the Fos super-enhancer had reduced Fos expression (Fig. 6B). Moreover, the edited Pkd1RC/− cells had lower cellular proliferation and cyst growth compared to unedited Pkd1RC/− cells (Fig. 6C and D).
Figure 6. Super-enhancers activate Fos and Jun and regulate proliferation and cyst growth in Pkd1-mutant cells.
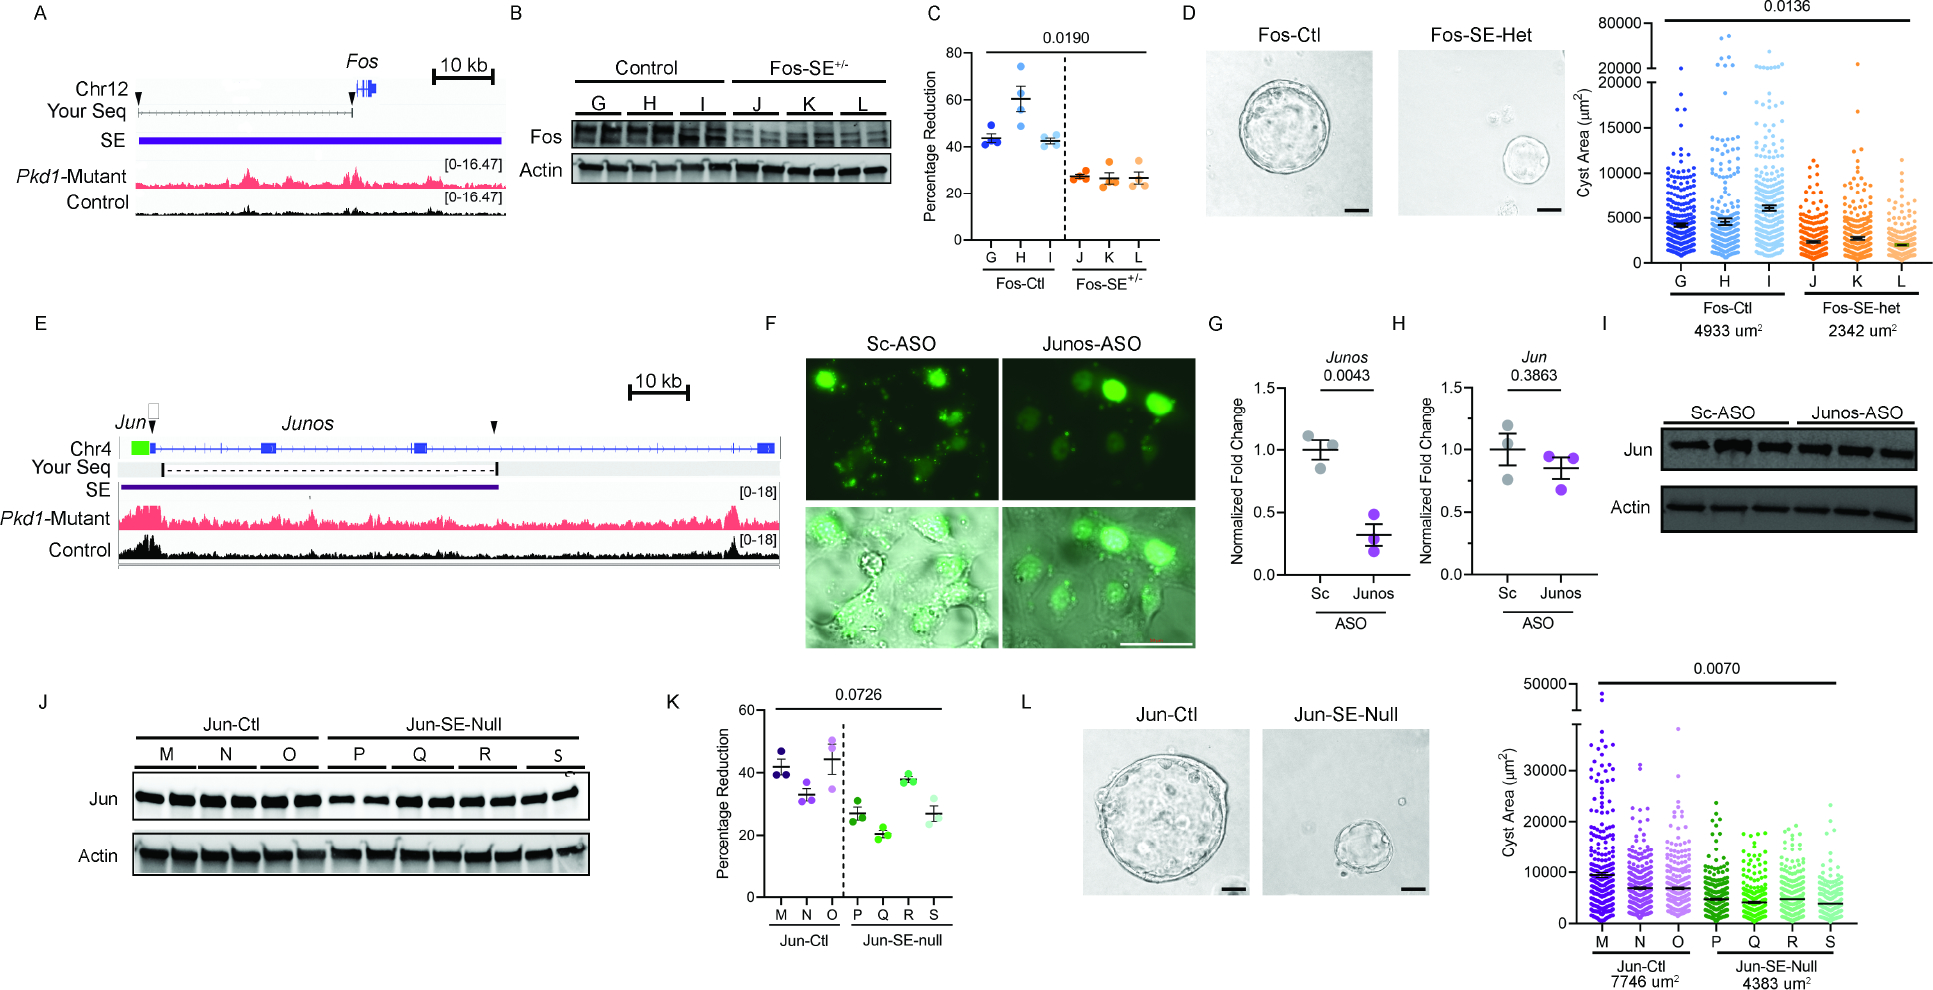
A. ChIP-seq tracks of the genomic locus encompassing the Fos gene showing higher H3K27ac modification in Pkd1-mutant compared to control kidneys. The Fos super-enhancer is denoted by the purple rectangle. SgRNA sites are indicated with black arrows. Blat-Seq result of purified DNA from deletion band of Fos-SE+/− cell line is shown as Your Seq. Arrows indicate sites of sgRNAs for CRISPR/Cas9 mediated deletion of the Fos super-enhancer. B. Western blot analysis showing reduced Fos abundance Pkd1RC/− cells with heterozygous deletion of the Fos super-enhancer (Fos-SE+/−) compared to the unedited parental cell lines (Control). C. Alamar Blue-assessed proliferation of control and Fos-SE+/− cell lines is shown. D. Representative images and quantification showing reduced cyst size in Fos-SE+/− cell lines compared to control cell lines. Average cyst size for each group is reported. E. ChIP-seq tracks of the Jun genomic locus showing higher H3K27ac modification in Pkd1-mutant compared to control kidneys. Jun gene is denoted by green rectangle, lncRNA Junos is denoted by blue, and the super-enhancer is denoted by a purple rectangle. Arrows indicate sgRNA targeted sites for super-enhancer deletion. Blat-Seq result of purified DNA from deletion band of Jun-SE-Null cell line is shown as Your Seq. F. Pkd1RC/− cells were transfected with fluorescein amidite (FAM) labeled control antisense oligonucleotide (ASO) or an ASO targeting Junos lncRNA. Fluorescent and bright-field microscopic images showing delivery of control and Junos ASOs into cells 24-hours after transfection. G. qPCR analysis demonstrated reduced Junos transcript abundance in Junos ASO-treated compared to control ASO-treated Pkd1RC/− cells. H and I. qPCR and western blot analysis showing that Jun expression was not different in Pkd1RC/− cells treated with control compared to Junos ASO. J. Western blot analysis showing reduced Jun expression in Pkd1RC/− cell lines lacking the 62kb super-enhancer (Jun-SE-null) compared to parental unedited Pkd1RC/− cells (Jun-ctl). K. Alamar Blue assay demonstrating reduced proliferation in Jun-SE-null compared to Jun-ctl Pkd1RC/− cells. L. Representative images and quantification showing reduced cyst size in Jun-SE-null compared to Jun-ctl cells. Average cyst size for each group is reported. Error bars indicate SEM; Statistical analysis: Nested t-test (C, D, K, and L) and Student’s t-test (G and H). Scale bars represent 25μM
The putative Jun super-enhancer is an uncharacterized 62kb region upstream of the Jun gene. Closer examination revealed that this super-enhancer region also encodes a long noncoding RNA (lncRNA) annotated as Junos (Fig. 6E). Therefore, the locus may act as a Jun super-enhancer, or it could regulate Jun expression via Junos. To determine whether the lncRNA regulates Jun expression, we inhibited Junos in Pkd1RC/− cells using antisense oligos (ASOs) (Fig. 6F). ASO treatment reduced Junos level by 68 percent (Fig. 6G). However, Jun expression remained unchanged, indicating that the lncRNA does not regulate Jun expression (Fig. 6H–I). Next, we generated three clonal cell lines with homozygous deletion of the 70 kb super-enhancer region. Compared to the unedited Pkd1RC/− cells, Jun expression was reduced in all Pkd1RC/− cell lines lacking the super-enhancer (Fig. 6J). Moreover, cellular proliferation and cyst size were also significantly reduced in cell lines with Jun super-enhancer deletion (Fig. 6K–L). Thus, both components of the AP-1 complex are trans-activated by super-enhancers in Pkd1-mutant cells.
ADPKD metabolic pathways influence H3K27ac levels.
Histone acetylation is a dynamic process tied to acetyl-CoA availability, which is controlled by the cellular metabolic state38–40. ADPKD is marked by extensive metabolic reprogramming, including the activation of aerobic glycolysis and glutaminolysis and inhibition of oxidative phosphorylation. Therefore, we asked whether the ADPKD metabolic pathways regulate H3K27ac levels. As a first sign of metabolic-epigenetic connection, we found that the acetyl CoA abundance was higher in Pkd1-mutant kidneys and Pkd1RC/− cells compared to their respective controls (Suppl Fig. 10). Next, we treated Pkd1RC/− cells with 2-deoxyglucose (2-DG) for 24 hours and then measured H3K27ac by ELISA. We noted that 2-DG treatment in Pkd1RC/− cells reduced H3K27ac levels by 30% (Fig. 7A). Moreover, H3K27ac modification was reduced at c-Myc enhancers with 2-DG treatment in Pkd1RC/− cells (Fig. 7B). Accordingly, c-Myc expression was reduced in 2-DG treated Pkd1RC/− cells compared to untreated Pkd1RC/− cells (Fig. 7C). Next, we treated Pkd1RC/− cells with BPTES, to turn off glutaminolysis or WY-14643, a Ppara agonist, to activate oxidative phosphorylation. We noted that compared to untreated Pkd1RC/− cells, total H3K27ac levels and H3K27ac abundance at c-Myc enhancers was also reduced in Pkd1RC/− cells treated with BPTES or WY-14643 (Fig 7D, E, G, and H). Accordingly, Western blot analysis revealed that treatment with both BPTES and WY-14643 reduced c-Myc expression (Fig 6F,I). Thus, the rewiring of the epigenetic profile is at least in part mediated by ADPKD metabolic reprogramming.
Figure 7. Metabolic pathways influence H3K27ac levels in Pkd1-mutant cells.
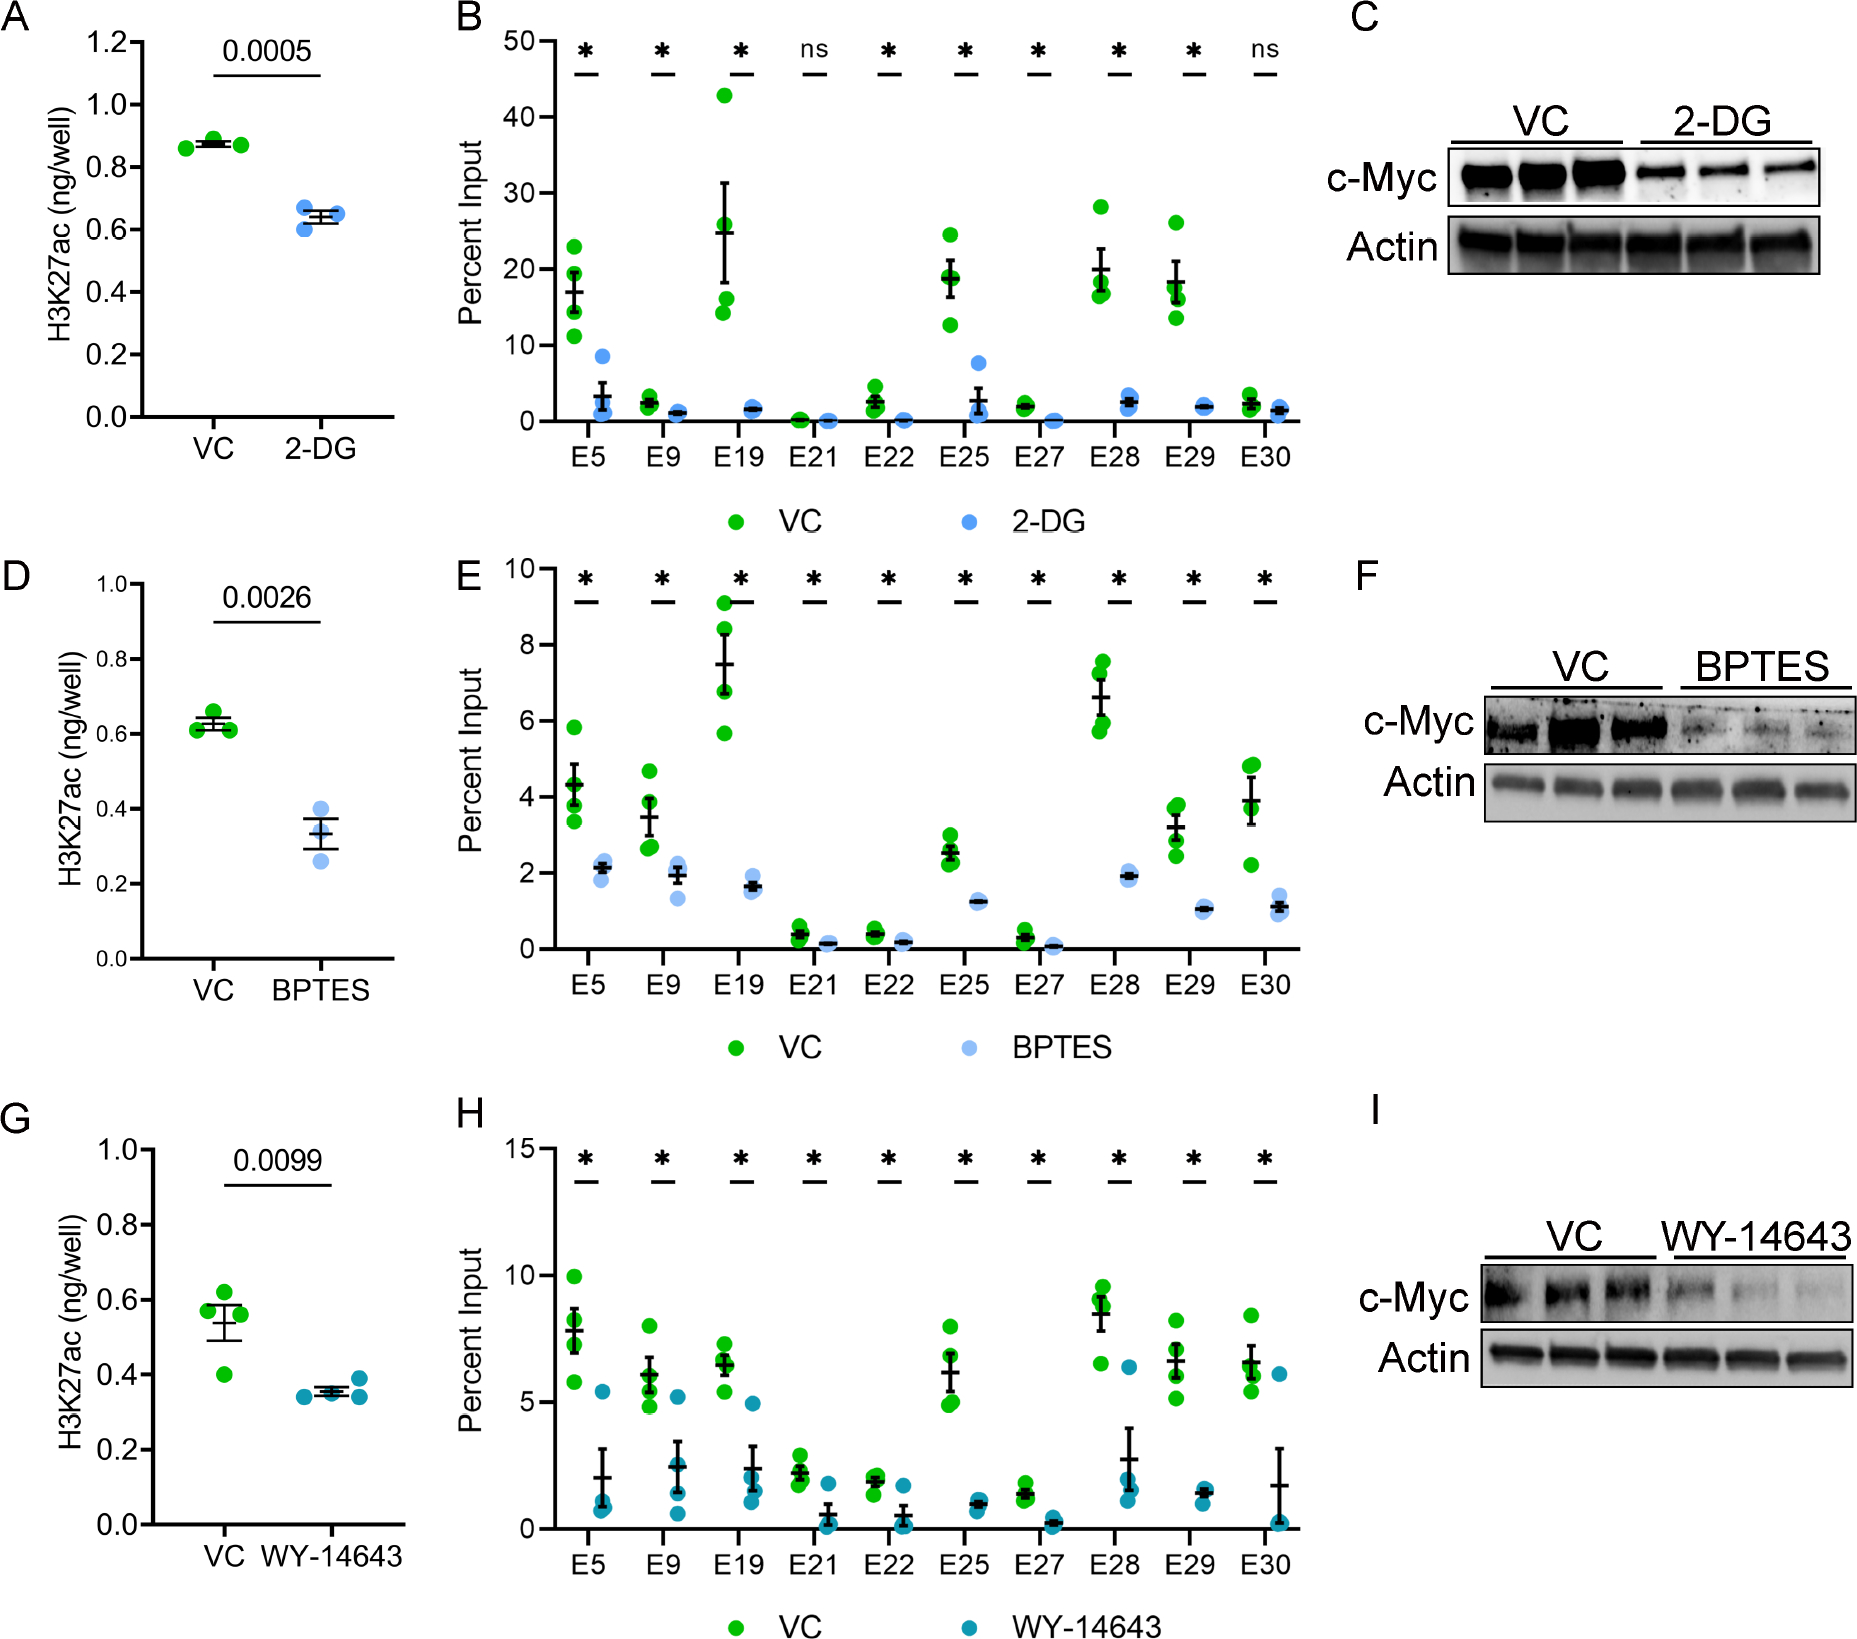
A. Pkd1RC/− cells were treated with 2-DG, an inhibitor of aerobic glycolysis, or vehicle control for 24 hours. ELISA revealed that histone extracts from 2-DG-treated cells had reduced H3K27ac levels compared to vehicle-treated cells. B. ChIP-qPCR showed reduced H3K27ac modification on c-Myc enhancers in Pkd1RC/− cells treated with 2-DG compared to vehicle control. C. Western blot analysis showing reduced c-Myc expression in 2-DG-treated compared to vehicle-treated Pkd1RC/− cells. D. Pkd1RC/− cells were treated for 48 hours with vehicle or BPTES to inhibit glutaminolysis. ELISA revealed that BPTES-treated cells had a reduced level of H3K27ac histone modification compared to vehicle-treated cells. E. ChIP-qPCR showing reduced H3K27ac modification on c-Myc locus enhancers in BPTES-treated compared to vehicle-treated Pkd1RC/− cells. F. Western blot analysis showing reduced c-Myc expression in Pkd1RC/− cells treated with BPTES compared to control vehicle. G-I. Pkd1RC/− cells were treated for 72 hours with the Ppara agonist WY-4643 or control vehicle. ELISA revealed reduced global H3K27ac levels, ChIP-qPCR showed lower H3K27ac signal on c-Myc enhancers, and Western blot analysis demonstrated c-Myc downregulation in WY-4643-treated compared to vehicle-treated Pkd1RC/− cells. N=3–4 all groups. * P < 0.05, ns = P >0.05. Error bars indicate SEM. Statistical analysis: Student’s t-test.
DISCUSSION
Large-scale transcriptomic rewiring is a prominent pathological feature of ADPKD. Here, we provide an in-depth view of the cystic kidney enhancer landscape that underlies this dysregulated gene expression. The first novel insight of our work is that there is a marked increase in global H3K27ac levels in mouse and human ADPKD tissues. Further, our findings suggest this increase, at least in part, is a consequence of ADPKD metabolic reprogramming involving aerobic glycolysis and glutaminolysis. Indeed, both metabolic pathways are known to replenish and exaggerate the cellular acetyl-CoA pool, which in turn is the critical determinant for histone acetylation38–40. Conversely, work from others suggests that super-enhancers propagate the aberrant expression of metabolic pathway genes in Pkd1-mutant cells41. Thus, there may be a vicious metabolism-epigenetics cycle in ADPKD, where the altered metabolism reshapes the epigenetic state of cyst epithelia, leading to a transcriptomic output conducive to sustained metabolic reprogramming.
The second and perhaps the most important outcome of our studies is identifying the genome-wide enhancer profile of Pkd1-mutant kidneys. The Pkd1-mutant mouse model develops substantial cystic disease by 22 days of age, yet >50% of mice live for over 75 days. We analyzed the epigenetic profile of this model at an early cystic time point to identify CREs which may directly modulate cyst growth. We uncovered >16,000 preferentially activated CRE, including 105 super-enhancers, providing the first glimpse of extensive epigenetic rewiring of cystic kidneys. Some noteworthy observations were that: (i) the activated CREs are located in intergenic and intronic regions, implying both long and short-range enhancer-promoter interactions in PKD. (ii) Deconvolution of our global H3K27ac ChIP-seq data using E18.5 kidney scATAC-seq data suggested that activated enhancers are observed both in cyst epithelia and cyst microenvironment component stromal and immune cells. While not fully representative of cyst epithelia in-vivo, we observed that 30% of enhancers gained in Pkd1-mutant kidneys are also present in our collecting duct-derived Pkd1RC/− cell line providing a glimpse of the epigenetic landscape of cyst epithelia. (iii) We noted that >90% of upregulated genes are located in TADs that also housed activated enhancers suggesting that majority of the dysregulated transcriptome is facilitated by the altered epigenetic landscape.
c-Myc, Fos, and Jun are transactivated in ADPKD models24. In turn, these transcription factors activate pro-proliferative gene networks that are thought to underlie cyst growth42,43. Our work provides several new mechanistic insights into the regulation of this transcriptional circuitry. Our data suggest that a series of intergenic enhancers are necessary to drive c-Myc upregulation in ADPKD. Consistent with these observations, enhancer-mediated upregulation of c-Myc has also been reported in malignancies35, albeit the enhancer choice appears to vary. Interestingly, 10/12 activated enhancers in both mouse and human ADPKD samples have not been reported in cancers, suggesting that c-Myc enhancer repertoire and choice may differ based on the tissue and disease. In support of this notion, deletion of a large enhancer 1.7 megabases downstream of the c-Myc gene abolishes c-Myc expression but only in hematopoietic stem cells and appears to be critical for leukemic transformation44. Therefore, it is tempting to speculate that the 10 ADPKD-enriched enhancers double as regulators of c-Myc expression during kidney development. Moreover, these enhancers could serve as novel targets to preferentially reduce c-Myc expression and slow cyst growth.
Thematically similar to the c-Myc locus, we found that super-enhancers are necessary to upregulate Jun and Fos in Pkd1-mutant cells. The Fos super-enhancer is also functional in neuronal cells suggesting that this CRE is active in diverse cell types45. In contrast, little was known about the 62 kb super-enhancer downstream of Jun. We report that this locus serves dual functions of a Jun super-enhancer and Junos lncRNA gene. Super-enhancer-associated lncRNAs are implicated in cis-activating nearby genes via mechanisms such as assisting in chromatin looping or transcription factor binding. Instead, we found that Junos was dispensable for Jun expression, implying an alternative biological role of this lncRNA, perhaps in trans-activating other genes.
There are caveats and limitations related to our work. First, the identified enhancer profile is from whole cystic kidneys, which include numerous other cell types besides the cyst epithelia. Second, TAD-specific active enhancer and upregulated gene pairs indicate positive correlation but do not imply a direct link. While we established causation for c-Myc, Fos, and Jun, all other enhancer-gene pairs remain unvalidated. High throughput CRISPR-based and massively parallel reporter assays have been recently described to study regulatory functions of enhancers46. Our dataset will be a valuable resource to apply these approaches. Third, integrating our H3K27ac ChIP-seq dataset with the Hi-C and PLAC-seq datasets provides a good view of the extensive chromatin looping in Pkd1-mutant kidneys. We have summarized all publicly available datasets interrogated in our work in Suppl Table 13. However, an independent Hi-C dataset is needed for a refined and accurate description of the 3D chromatin architecture in PKD. Fourth, we did not validate c-Myc, Jun, or Fos CREs in ADPKD mouse models. These studies will require new mouse models and are the focus of our future work. Finally, we observed congruent epigenetic signatures across the various ADPKD models and human samples based on ChIP-qPCR of arbitrarily selected enhancers. However, independent genome-wide datasets need to be developed in other ADPKD models, including human ADPKD tissues.
In summary, we provide the first insights into the enhancer map of Pkd1-mutant kidneys. We identify a series of enhancers near pro-proliferative transcription factors and demonstrate their ability to regulate cyst growth and gene expression. Our work also suggests that H3K27ac levels are regulated by rewired metabolism of Pkd1-mutant cells. Finally, developing pharmacological approaches to inhibit these enhancers could serve as a novel method to slow cyst growth.
Supplementary Material
TRANSLATIONAL STATEMENT.
ADPKD is the leading genetic cause of kidney failure. Transcriptional dysregulation is a prominent pathological feature of ADPKD, yet the mechanisms underlying these changes are unknown. Here we report the enhancer and super-enhancer landscape in ADPKD kidneys. Our findings suggest a link between enhancers and the regulation of known ADPKD pathogenic genes such as c-Myc, Jun, Fos.
Acknowledgments:
This work is dedicated to the memory of Ms. Peyton Johnson. We are grateful for her technical and intellectual contributions. We thank Chun-Mien Chang for technical assistance, the Kansas PKD Research and Translation Core Center for human tissue samples, and the McDermott Center and Bioinformatics Core Facility (BICF) at UT Southwestern Medical Center for critical services.
Work from the authors’ laboratory is supported by National Institute of Diabetes and Digestive and Kidney Diseases Grants K08DK117049 (to R.L) and R01 DK102572 (to V.P.). R. L. is also supported by grants from the PKD Foundation and American Society of Nephrology KidneyCure Grants Program. V.M. is supported by the Cancer Prevention and Research Institute of Texas (RP150596).
Footnotes
Disclosures: None
Supplementary Material
Supplementary material is available on Kidney International’s website
Publisher's Disclaimer: This is a PDF file of an unedited manuscript that has been accepted for publication. As a service to our customers we are providing this early version of the manuscript. The manuscript will undergo copyediting, typesetting, and review of the resulting proof before it is published in its final form. Please note that during the production process errors may be discovered which could affect the content, and all legal disclaimers that apply to the journal pertain.
REFERENCES:
- 1.Patel V, Chowdhury R & Igarashi P Advances in the pathogenesis and treatment of polycystic kidney disease. Curr Opin Nephrol Hypertens 18, 99–106, doi: 10.1097/MNH.0b013e3283262ab0 [doi] 00041552–200903000-00002 [pii] (2009). [DOI] [PMC free article] [PubMed] [Google Scholar]
- 2.Cloutier M et al. The societal economic burden of autosomal dominant polycystic kidney disease in the United States. BMC Health Serv Res 20, 126, doi: 10.1186/s12913-020-4974-4 (2020). [DOI] [PMC free article] [PubMed] [Google Scholar]
- 3.Rowe I et al. Defective glucose metabolism in polycystic kidney disease identifies a new therapeutic strategy. Nat Med 19, 488–493, doi: 10.1038/nm.3092 (2013). [DOI] [PMC free article] [PubMed] [Google Scholar]
- 4.Menezes LF, Lin CC, Zhou F & Germino GG Fatty Acid Oxidation is Impaired in An Orthologous Mouse Model of Autosomal Dominant Polycystic Kidney Disease. EBioMedicine 5, 183–192, doi: 10.1016/j.ebiom.2016.01.027 (2016). [DOI] [PMC free article] [PubMed] [Google Scholar]
- 5.Lakhia R et al. PPARA agonist fenofibrate enhances fatty acid beta-oxidation and attenuates polycystic kidney and liver disease in mice. Am J Physiol Renal Physiol, ajprenal 00352 02017, doi: 10.1152/ajprenal.00352.2017 (2017). [DOI] [PMC free article] [PubMed] [Google Scholar]
- 6.Flowers EM et al. Lkb1 deficiency confers glutamine dependency in polycystic kidney disease. Nat Commun 9, 814, doi: 10.1038/s41467-018-03036-y (2018). [DOI] [PMC free article] [PubMed] [Google Scholar]
- 7.Ramalingam H et al. A methionine-Mettl3-N(6)-methyladenosine axis promotes polycystic kidney disease. Cell Metab 33, 1234–1247 e1237, doi: 10.1016/j.cmet.2021.03.024 (2021). [DOI] [PMC free article] [PubMed] [Google Scholar]
- 8.Lakhia R et al. Interstitial microRNA miR-214 attenuates inflammation and polycystic kidney disease progression. JCI Insight 5, doi: 10.1172/jci.insight.133785 (2020). [DOI] [PMC free article] [PubMed] [Google Scholar]
- 9.Torres VE et al. Tolvaptan in Later-Stage Autosomal Dominant Polycystic Kidney Disease. N Engl J Med 377, 1930–1942, doi: 10.1056/NEJMoa1710030 (2017). [DOI] [PubMed] [Google Scholar]
- 10.Torres VE et al. Effect of Tolvaptan in Autosomal Dominant Polycystic Kidney Disease by CKD Stage: Results from the TEMPO 3:4 Trial. Clin J Am Soc Nephrol 11, 803–811, doi: 10.2215/CJN.06300615 (2016). [DOI] [PMC free article] [PubMed] [Google Scholar]
- 11.Lakhia R et al. PPARalpha agonist fenofibrate enhances fatty acid beta-oxidation and attenuates polycystic kidney and liver disease in mice. Am J Physiol Renal Physiol 314, F122–F131, doi: 10.1152/ajprenal.00352.2017 (2018). [DOI] [PMC free article] [PubMed] [Google Scholar]
- 12.Lee EC et al. Discovery and preclinical evaluation of anti-miR-17 oligonucleotide RGLS4326 for the treatment of polycystic kidney disease. Nat Commun 10, 4148, doi: 10.1038/s41467-019-11918-y (2019). [DOI] [PMC free article] [PubMed] [Google Scholar]
- 13.Yheskel M, Lakhia R, Cobo-Stark P, Flaten A & Patel V Anti-microRNA screen uncovers miR-17 family within miR-17~92 cluster as the primary driver of kidney cyst growth. Sci Rep 9, 1920, doi: 10.1038/s41598-019-38566-y (2019). [DOI] [PMC free article] [PubMed] [Google Scholar]
- 14.Ramalingam H, Yheskel M & Patel V Modulation of polycystic kidney disease by non-coding RNAs. Cell Signal 71, 109548, doi: 10.1016/j.cellsig.2020.109548 (2020). [DOI] [PMC free article] [PubMed] [Google Scholar]
- 15.Heinz S, Romanoski CE, Benner C & Glass CK The selection and function of cell type-specific enhancers. Nat Rev Mol Cell Biol 16, 144–154, doi: 10.1038/nrm3949 (2015). [DOI] [PMC free article] [PubMed] [Google Scholar]
- 16.Creyghton MP et al. Histone H3K27ac separates active from poised enhancers and predicts developmental state. Proc Natl Acad Sci U S A 107, 21931–21936, doi: 10.1073/pnas.1016071107 (2010). [DOI] [PMC free article] [PubMed] [Google Scholar]
- 17.Rada-Iglesias A et al. A unique chromatin signature uncovers early developmental enhancers in humans. Nature 470, 279–283, doi: 10.1038/nature09692 (2011). [DOI] [PMC free article] [PubMed] [Google Scholar]
- 18.Chapuy B et al. Discovery and characterization of super-enhancer-associated dependencies in diffuse large B cell lymphoma. Cancer Cell 24, 777–790, doi: 10.1016/j.ccr.2013.11.003 (2013). [DOI] [PMC free article] [PubMed] [Google Scholar]
- 19.Loven J et al. Selective inhibition of tumor oncogenes by disruption of super-enhancers. Cell 153, 320–334, doi: 10.1016/j.cell.2013.03.036 (2013). [DOI] [PMC free article] [PubMed] [Google Scholar]
- 20.Hnisz D et al. Super-enhancers in the control of cell identity and disease. Cell 155, 934–947, doi: 10.1016/j.cell.2013.09.053 (2013). [DOI] [PMC free article] [PubMed] [Google Scholar]
- 21.Martinez MF et al. Super-enhancers maintain renin-expressing cell identity and memory to preserve multi-system homeostasis. J Clin Invest 128, 4787–4803, doi: 10.1172/JCI121361 (2018). [DOI] [PMC free article] [PubMed] [Google Scholar]
- 22.Wilflingseder J et al. Enhancer and super-enhancer dynamics in repair after ischemic acute kidney injury. Nat Commun 11, 3383, doi: 10.1038/s41467-020-17205-5 (2020). [DOI] [PMC free article] [PubMed] [Google Scholar]
- 23.Hajarnis S et al. microRNA-17 family promotes polycystic kidney disease progression through modulation of mitochondrial metabolism. Nat Commun 8, 14395, doi: 10.1038/ncomms14395 (2017). [DOI] [PMC free article] [PubMed] [Google Scholar]
- 24.Le NH et al. Increased activity of activator protein-1 transcription factor components ATF2, c-Jun, and c-Fos in human and mouse autosomal dominant polycystic kidney disease. J Am Soc Nephrol 16, 2724–2731, doi: 10.1681/ASN.2004110913 (2005). [DOI] [PubMed] [Google Scholar]
- 25.Wang Q et al. Adenylyl cyclase 5 deficiency reduces renal cyclic AMP and cyst growth in an orthologous mouse model of polycystic kidney disease. Kidney Int 93, 403–415, doi: 10.1016/j.kint.2017.08.005 (2018). [DOI] [PMC free article] [PubMed] [Google Scholar]
- 26.Kharchenko PV et al. Comprehensive analysis of the chromatin landscape in Drosophila melanogaster. Nature 471, 480–485, doi: 10.1038/nature09725 (2011). [DOI] [PMC free article] [PubMed] [Google Scholar]
- 27.Piontek K, Menezes LF, Garcia-Gonzalez MA, Huso DL & Germino GG A critical developmental switch defines the kinetics of kidney cyst formation after loss of Pkd1. Nat Med 13, 1490–1495, doi:nm1675 [pii] 10.1038/nm1675 [doi] (2007). [DOI] [PMC free article] [PubMed] [Google Scholar]
- 28.Consortium EP An integrated encyclopedia of DNA elements in the human genome. Nature 489, 57–74, doi: 10.1038/nature11247 (2012). [DOI] [PMC free article] [PubMed] [Google Scholar]
- 29.Davis CA et al. The Encyclopedia of DNA elements (ENCODE): data portal update. Nucleic acids research 46, D794–D801, doi: 10.1093/nar/gkx1081 (2018). [DOI] [PMC free article] [PubMed] [Google Scholar]
- 30.Miao Z et al. Single cell regulatory landscape of the mouse kidney highlights cellular differentiation programs and disease targets. Nat Commun 12, 2277, doi: 10.1038/s41467-021-22266-1 (2021). [DOI] [PMC free article] [PubMed] [Google Scholar]
- 31.Dixon JR et al. Topological domains in mammalian genomes identified by analysis of chromatin interactions. Nature 485, 376–380, doi: 10.1038/nature11082 (2012). [DOI] [PMC free article] [PubMed] [Google Scholar]
- 32.Trudel M, Barisoni L, Lanoix J & D’Agati V Polycystic kidney disease in SBM transgenic mice: role of c-myc in disease induction and progression. Am J Path 152, 219–229 (1998). [PMC free article] [PubMed] [Google Scholar]
- 33.Trudel M, D’Agati V & Costantini F c-myc as an inducer of polycystic kidney disease in transgenic mice. Kidney International 39, 665–671 (1991). [DOI] [PubMed] [Google Scholar]
- 34.Bonev B et al. Multiscale 3D Genome Rewiring during Mouse Neural Development. Cell 171, 557–572 e524, doi: 10.1016/j.cell.2017.09.043 (2017). [DOI] [PMC free article] [PubMed] [Google Scholar]
- 35.Lancho O & Herranz D The MYC Enhancer-ome: Long-Range Transcriptional Regulation of MYC in Cancer. Trends Cancer 4, 810–822, doi: 10.1016/j.trecan.2018.10.003 (2018). [DOI] [PMC free article] [PubMed] [Google Scholar]
- 36.Rossetti S et al. Incompletely penetrant PKD1 alleles suggest a role for gene dosage in cyst initiation in polycystic kidney disease. Kidney Int 75, 848–855, doi: 10.1038/ki.2008.686 (2009). [DOI] [PMC free article] [PubMed] [Google Scholar]
- 37.Whyte WA et al. Master transcription factors and mediator establish super-enhancers at key cell identity genes. Cell 153, 307–319, doi: 10.1016/j.cell.2013.03.035 (2013). [DOI] [PMC free article] [PubMed] [Google Scholar]
- 38.Cai L, Sutter BM, Li B & Tu BP Acetyl-CoA induces cell growth and proliferation by promoting the acetylation of histones at growth genes. Mol Cell 42, 426–437, doi: 10.1016/j.molcel.2011.05.004 (2011). [DOI] [PMC free article] [PubMed] [Google Scholar]
- 39.Wellen KE et al. ATP-citrate lyase links cellular metabolism to histone acetylation. Science 324, 1076–1080, doi: 10.1126/science.1164097 (2009). [DOI] [PMC free article] [PubMed] [Google Scholar]
- 40.Lu C & Thompson CB Metabolic regulation of epigenetics. Cell Metab 16, 9–17, doi: 10.1016/j.cmet.2012.06.001 (2012). [DOI] [PMC free article] [PubMed] [Google Scholar]
- 41.Mi Z et al. Super-enhancer-driven metabolic reprogramming promotes cystogenesis in autosomal dominant polycystic kidney disease. Nat Metab 2, 717–731, doi: 10.1038/s42255-020-0227-4 (2020). [DOI] [PubMed] [Google Scholar]
- 42.Gazon H, Barbeau B, Mesnard JM & Peloponese JM Jr. Hijacking of the AP-1 Signaling Pathway during Development of ATL. Front Microbiol 8, 2686, doi: 10.3389/fmicb.2017.02686 (2017). [DOI] [PMC free article] [PubMed] [Google Scholar]
- 43.Angel P & Karin M The role of Jun, Fos and the AP-1 complex in cell-proliferation and transformation. Biochim Biophys Acta 1072, 129–157, doi: 10.1016/0304-419x(91)90011-9 (1991). [DOI] [PubMed] [Google Scholar]
- 44.Bahr C et al. A Myc enhancer cluster regulates normal and leukaemic haematopoietic stem cell hierarchies. Nature 553, 515–520, doi: 10.1038/nature25193 (2018). [DOI] [PubMed] [Google Scholar]
- 45.Joo JY, Schaukowitch K, Farbiak L, Kilaru G & Kim TK Stimulus-specific combinatorial functionality of neuronal c-fos enhancers. Nat Neurosci 19, 75–83, doi: 10.1038/nn.4170 (2016). [DOI] [PMC free article] [PubMed] [Google Scholar]
- 46.Santiago-Algarra D, Dao LTM, Pradel L, Espana A & Spicuglia S Recent advances in high-throughput approaches to dissect enhancer function. F1000Res 6, 939, doi: 10.12688/f1000research.11581.1 (2017). [DOI] [PMC free article] [PubMed] [Google Scholar]
Associated Data
This section collects any data citations, data availability statements, or supplementary materials included in this article.
Supplementary Materials
Data Availability Statement
ChIP-seq data are available at Geo Expression Omnibus GSE189153 and GSE202681.


