

Abstract
Background
Accumulated evidence indicates that cholesterol is offensive to bone metabolism. Therefore, we examined the real-world study among total cholesterol and total bone mineral density (BMD). We investigated the relationship between total cholesterol and total BMD among 10,039 US participants aged 20–59 years old over the period 2011–2018 from the NHANES.
Methods
To analyze the relationship among total cholesterol and total BMD, multivariate linear regression models were used. Fitted smoothing curves, generalized additive models, and threshold effect analysis were also conducted.
Results
After adjusting for additional covariates, weighted multivariable linear regression models indicated total cholesterol concentration levels exhibited a negative relationship with total BMD, particularly among participants aged 20–29 years. Concerning subgroup analysis, stratified by gender, race/ethnicity and age group, the negative correlation of total cholesterol with total BMD dwelled in both female and male as well as in whites and other races (including Hispanic and Multi-Racial), but not in non-Hispanic blacks and Mexican American. In other races, this relationship presented a nonlinear association (inflection point: 6.7 mmol/L) with a U-shaped curve. Among participants aged 40 to 49 years, this relationship also followed a nonlinear association (inflection point: 5.84 mmol/L), indicating a saturation effect. Moreover, the three types of diabetes status were found to have negative, U-shaped, and positive relationships. In participants with borderline diabetes status, the relationship of total cholesterol with total BMD was a U-shaped curve (inflection point: 4.65 mmol/L).
Conclusions
For US young adults (20–29 years old), our study revealed a negative relationship between total cholesterol and total BMD. This association followed a U-shaped curve (inflection point: 4.65 mmol/L) in borderline diabetes status participants, a saturation curve (inflection point: 5.84 mmol/L) in participants aged 40–49 years and a nonlinear curve (inflection point: 6.7 mmol/L) in other races (including Hispanic and Multi-Racial). Therefore, keeping total cholesterol concentration at a reasonable level for young adults and diabetic population might be an approach to prevent osteoporosis or osteopenia.
Keywords: Bone mineral density, Cholesterol, Osteopenia, Osteoporosis
Background
Cholesterol is a major lipid element of human organisms and plays a pivotal role in bile acid metabolism, steroid hormone synthesis, and bone cell metabolism [1]. In the past decades, serum cholesterol is considered being risky in a variety of diseases such as atherosclerosis, Parkinson’s disease, and osteoarthritis [2–4]. Recently, cholesterol toxicity, which globally influences organs, was put forward due to its activation of inflammation, endoplasmic reticulum stress, and mitochondrial dysfunction via blood circulation [5]. Some retrospective studies show that low-density lipoprotein (LDL-C) level of total cholesterol is negatively correlated with lumber BMD in women, while high-density lipoprotein (HDL-C) which is regarded to be favorable to health is positive [6–8]. Total cholesterol could be related to BMD, but the results reported from different research were disparate [9–11]. Therefore, the latest evidence about total cholesterol level associated with total BMD in adults is needed from a holistic perspective.
Osteoporosis, defined as a high rates chronic disease featured with reduced BMD of whole body, affects 9.9 million Americans [12, 13]. Concurrently, as the population ages and imbalanced dietary intake, the osteoporosis population is set to increase [14, 15]. Apart from senile osteoporosis or postmenopausal osteoporosis, adult osteopenia in men or women is a concern and maybe a stage to intervene [16–18]. According to a group of studies, the risk of osteoporotic fracture for males and females is roughly 30% and 50% in a lifetime, respectively [19–21]. Exploring influencing factors like total cholesterol may help to intervene early in adults. Some risk factors are considered to be related to osteoporosis, such as increasing age, white race, female sex, lipid metabolism and heredity in older people, but not in adults [22, 23]. Therefore, it is necessary to investigate the relationship between total cholesterol for adults aged 20 to 59 years to discover more valuable information.
Total cholesterol level was important in the evaluation of cardiovascular disease in adults and associated with mortality, but rarely noticed in total BMD [24, 25]. Accordingly, to explore if the total cholesterol could influence BMD and find an appropriate total cholesterol level avoiding osteoporosis, we used the 10,039 latest participants from NHANES 2011–2018. We also stratified participants by gender, race and age to determine specific effect on a nationally representative participates aged 20–59 years.
Materials and methods
Ethics statement
The study was approved by the National Center for Health Statistics' Ethics Review Board (https://www.cdc.gov/nchs/nhanes/irba98.htm), and informed consent was obtained from all NHANES participants for their data to be adopted in further study.
Study participants and inclusion criteria
The NHANES is an ongoing representative epidemiological study in the USA that intends to survey multifarious evidence about the nutrition and health statistics utilizing a multistage, complex, probability sampling design. Our analysis was based on data from 2011 to 2018, which represents four cycles of the NHANES datasets. All data of subjects was collected from the NHANES database, which is part of the U.S. Centers for Disease Control and Prevention. The inclusion criteria were: (i) individuals who had accessible total BMD data; (ii) individuals who had accessible total cholesterol data; and (iii) individuals aged 20 to 59 years old. Moreover, the subjects with cancer were excluded from the study. Of a total 39,156 participants, we excluded 21,282 subjects with missing total BMD data, 1,358 participants with missing total cholesterol data, 387 subjects with cancer diagnoses, and 6,090 subjects younger than 20 years or older than 59 years. Finally, 10,039 participants were used in the research (Fig. 1).
Fig. 1.
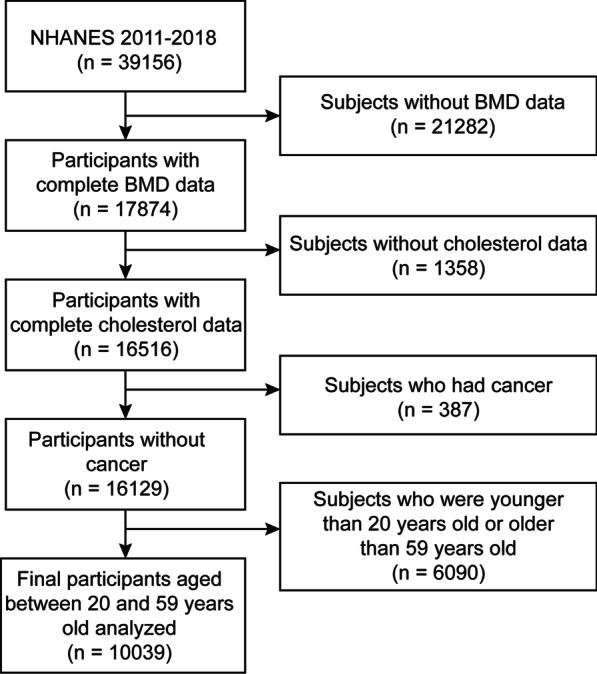
Flowchart of participants selection. NHANES National Health and Nutrition Examination Survey; BMD Bone mineral density
Variables
Total cholesterol as the exposure variable was measured via a serum sample by Roche Cobas 6000, which is an enzymatic method where esterified cholesterol is converted to cholesterol by cholesterol esterase and then acted upon by cholesterol oxidase to produce cholest-4-en-3-one and hydrogen peroxide. The hydrogen peroxide then reacts known as the Trinder reaction with 4-aminophenazone in the presence of peroxidase to produce a colored product that is measured at 505 nm (secondary wavelength = 700 nm). Total BMD testing was performed by Dual-energy X-ray absorptiometry (DEXA) by Hologic QDR 4500A bone densitometers and Apex software (version: 3.2) throughout by certified radiology technologists. For categorical variables, the study included the following covariates: gender, race/ethnicity, educational level, moderate activity, smoking, marital status, high blood pressure status, and diabetes status. The study included ratio of family income-to-poverty, waist circumference, BMI, calcium intake, serum calcium, alcohol consumption, ALT, AST, blood urea nitrogen, serum phosphorus, γ-glutamyl transferase, lactate dehydrogenase, serum uric acid and triglycerides as continuous covariates. The categories "other Hispanic" and "other multiracial race" from the original NHANES were assigned to the variable "other race/ethnicity" to lower the bias of sample quantity. The NHANES program (https://www.cdc.gov/nchs/nhanes/) describes more detailed information about how the variables were measured (Fig. 2).
Fig. 2.

Frequency histogram (bin = 0.5) of total cholesterol. A Grouped by gender; B Grouped by race/ ethnicity
Statistical analysis
We used weighted and variance estimation analysis to explain the significant differences in our data sets. Weighted multivariate logistic regression models were applied aiming to evaluate the link between total cholesterol and total BMD. We applied weighted multivariate linear regression models and weighted χ2 tests to assess the distinction among each group for the categorical and continuous variables. To subgroup analysis, stratified multivariate regression analysis was also made. Moreover, nonlinear associations between total cholesterol and total BMD were also discussed via smooth fitting curves and generalized additive models. For nonlinear models, if the nonlinearity was detected, then the two-piecewise linear regression models was performed on both parts of the inflection point using a recursive algorithm. All analyses were performed using EmpowerStats (version: 2.0, X&Y Solutions, Inc., Boston, MA. http://www.empowerstats.com) and R software (version: 4.0.3, http://www.R-project.org), with a P value < 0.05 considered significant, and the frequency histogram of total cholesterol was completed via ggplot2 package in R.
Results
Participants characteristics
The weighted characteristics of participants were separated into quartiles based on total cholesterol concentration (Q1: 1.50–4.20 mmol/L; Q2: 4.21–4.80 mmol/L; Q3: 4.81–5.51 mmol/L; and Q4: 5.52–21.02 mmol/L), as displayed in Table 1. A total of 10,039 participants aged 20–59 years old were covered in our study. Our study showed significant differences in baseline characteristics between the total cholesterol concentration quartiles (Table 1). Participants from the Q4 total cholesterol quartile were intended to be males, non-Hispanic whites, with greater values of BMI (29.39 ± 5.89 kg/m2), waist circumference, alcohol consumption, blood urea nitrogen, ALT, AST, serum phosphorus, serum calcium, γ-glutamyl transferase, lactate dehydrogenase, serum uric acid, triglycerides, and ratio of family income-to-poverty and lower total BMD, moderate activity, and low calcium intake compared to the other level groups.
Table 1.
Weighted characteristics of the study population based on total cholesterol quartiles
| Total cholesterol (mmol/L) | All | Q1 (1.50–4.20) | Q2 (4.21–4.80) | Q3 (4.81–5.51) | Q4 (5.52–21.02) | P value |
|---|---|---|---|---|---|---|
| Age (years, mean ± SD) | 39.1475 ± 11.6236 | 34.3632 ± 11.5422 | 37.8907 ± 11.3880 | 40.0022 ± 11.0128 | 43.9945 ± 10.4141 | < 0.001 |
| Race/ethnicity (n, %) | < 0.001 | |||||
| Non-Hispanic White | 60.6415 | 58.3164 | 60.1266 | 60.6492 | 63.3028 | |
| Non-Hispanic Black | 11.2247 | 14.3237 | 11.4634 | 9.9549 | 9.3376 | |
| Mexican American | 10.8656 | 10.1864 | 11.2935 | 11.8468 | 10.1315 | |
| Other race/ethnicitya | 17.2681 | 17.1735 | 17.1165 | 17.5491 | 17.2280 | |
| Gender (n, %) | < 0.001 | |||||
| Male | 50.5703 | 52.9875 | 47.5757 | 49.0817 | 52.6419 | |
| Female | 49.4297 | 47.0125 | 52.4243 | 50.9183 | 47.3581 | |
| Smoked at least 100 cigarettes in life (n, %) | < 0.001 | |||||
| Yes | 40.3948 | 36.4892 | 37.6179 | 41.3839 | 45.7500 | |
| No | 59.6052 | 63.5108 | 62.3821 | 58.6161 | 54.2500 | |
| Education Level (n, %) | 0.0222 | |||||
| Less than high school | 13.0264 | 11.7858 | 14.5282 | 12.4560 | 13.2998 | |
| High school | 21.8284 | 22.9680 | 20.2915 | 21.2498 | 22.8050 | |
| More than high school | 65.1452 | 65.2462 | 65.1803 | 66.2941 | 63.8952 | |
| Marital status (n, %) | < 0.001 | |||||
| Married | 62.3723 | 56.3314 | 60.5319 | 65.6445 | 66.5949 | |
| Not married | 37.6277 | 43.6686 | 39.4681 | 34.3555 | 33.4051 | |
| High blood pressure (n, %) | < 0.001 | |||||
| Yes | 21.9384 | 18.6004 | 19.0398 | 23.9792 | 25.8529 | |
| No | 78.0616 | 81.3996 | 80.9602 | 76.0208 | 74.1471 | |
| Diabetes (n, %) | < 0.001 | |||||
| Yes | 5.6877 | 7.6649 | 4.7825 | 4.7758 | 5.5993 | |
| No | 92.6495 | 90.5706 | 93.6912 | 94.2886 | 91.9918 | |
| Borderline | 1.6628 | 1.7645 | 1.5262 | 0.9356 | 2.4090 | |
| Moderate activity (n, %) | 0.0893 | |||||
| Yes | 43.6194 | 45.8512 | 43.0304 | 42.7664 | 42.9316 | |
| No | 56.3806 | 54.1488 | 56.9696 | 57.2336 | 57.0684 | |
| Ratio of family income-to-poverty | 2.8874 ± 1.6253 | 2.6719 ± 1.5960 | 2.8465 ± 1.6322 | 2.9634 ± 1.6149 | 3.0542 ± 1.6317 | < 0.001 |
| BMI (kg/m2, mean ± SD) | 28.8526 ± 6.7012 | 28.0736 ± 7.1665 | 28.6352 ± 6.9363 | 29.2626 ± 6.7060 | 29.3896 ± 5.8874 | < 0.001 |
| Waist circumference (cm, mean ± SD) | 97.6414 ± 16.1154 | 95.0032 ± 17.5097 | 96.7701 ± 16.9270 | 98.6266 ± 15.5517 | 99.9837 ± 13.9230 | < 0.001 |
| ALT (IU/L, mean ± SD) | 26.0021 ± 19.4809 | 23.4796 ± 17.3589 | 24.7621 ± 17.5185 | 26.2276 ± 20.2821 | 29.3324 ± 21.7419 | < 0.001 |
| AST (IU/L, mean ± SD) | 25.1347 ± 17.3020 | 24.2468 ± 22.0443 | 24.3868 ± 13.8280 | 25.0357 ± 15.4333 | 26.7806 ± 16.8691 | < 0.001 |
| Blood urea nitrogen (mmol/L, mean ± SD) | 4.5516 ± 1.5137 | 4.4731 ± 1.6319 | 4.4469 ± 1.4514 | 4.5913 ± 1.4617 | 4.6867 ± 1.4954 | < 0.001 |
| Serum Calcium (mmol/L, mean ± SD) | 2.3430 ± 0.0871 | 2.3321 ± 0.0884 | 2.3315 ± 0.0808 | 2.3430 ± 0.0833 | 2.3642 ± 0.0911 | < 0.001 |
| Serum Phosphorus (mmol/L, mean ± SD) | 1.2025 ± 0.1804 | 1.1977 ± 0.1880 | 1.1952 ± 0.1739 | 1.2026 ± 0.1774 | 1.2138 ± 0.1817 | 0.0011 |
| γ-glutamyl transferase (IU/L, mean ± SD) | 28.0757 ± 43.6617 | 21.6725 ± 25.0934 | 25.2668 ± 34.6625 | 27.8617 ± 33.8083 | 36.9717 ± 66.3157 | < 0.001 |
| Lactate dehydrogenase (IU/L, mean ± SD) | 129.7656 ± 28.6577 | 126.0251 ± 29.4127 | 128.6559 ± 28.2408 | 130.8497 ± 27.1949 | 133.2715 ± 29.2428 | < 0.001 |
| Serum uric acid (umol/L, mean ± SD) | 316.7172 ± 80.9951 | 307.3026 ± 78.3826 | 309.9944 ± 78.4733 | 318.2396 ± 82.0241 | 330.4958 ± 82.7881 | < 0.001 |
| Triglycerides (mmol/L, mean ± SD) | 1.6841 ± 1.5303 | 1.1937 ± 0.8179 | 1.3967 ± 0.8807 | 1.7269 ± 1.1597 | 2.3771 ± 2.3662 | < 0.001 |
| Calcium intake (g, mean ± SD) | 995.6707 ± 587.4266 | 1016.9967 ± 631.5901 | 1020.7488 ± 616.8048 | 976.4544 ± 547.3698 | 970.3876 ± 550.5259 | 0.0016 |
| Alcohol consumption (g, mean ± SD) | 13.1840 ± 32.2826 | 10.5123 ± 28.5117 | 11.8214 ± 29.5059 | 14.0598 ± 33.0252 | 16.1365 ± 36.8261 | < 0.001 |
| Total BMD (g/cm2, mean ± SD) | 1.1154 ± 0.1058 | 1.1252 ± 0.1059 | 1.1181 ± 0.1054 | 1.1138 ± 0.1034 | 1.1052 ± 0.1075 | < 0.001 |
ALT Alanine aminotransferase, AST Aspartate aminotransferase, BMI Body mass index, SD Standard deviation, n Numbers of subjects, %, weighted percentage, BMD bone mineral density; For continuous variables: the P value was calculated by the weighted linear regression model. For categorical variables: the P value was calculated by the weighted chi-square test
aOther race/ethnicity included Hispanic and multiracial participants
Overall, the mean age of participants was 39.15 ± 11.62 years, the male (50.57%) and female (49.43%) were almost equal, and non-Hispanic whites account for 60.64%. Most of participates had an above high marriage rate (62.37%), high school education level (65.15%) and the ratio of family income-to-poverty was 2.89 ± 1.63. The participants had an educational level over high school, high blood pressure, and diabetes, which accounted for 65.15%, 21.94%, and 5.69%, respectively. Moreover, the distribution of total cholesterol categorized by gender and race is presented in Fig. 3. The specific results and other baseline characteristics are displayed in Table 1.
Fig. 3.

The relationship between total cholesterol and total bone mineral density. A Each black hollow point exhibits one participant. B Solid red line illustrates the fitted smooth curve among variables. Two blue bands illustrate the 95% confidence interval of the fit. Gender, age, race/ethnicity, education level, marital status, ratio of family income-to-poverty, serum phosphorus, blood urea nitrogen, γ-glutamyl transferase, ALT, AST, lactate dehydrogenase, serum uric acid, triglycerides, BMI, waist circumference, calcium intake, serum calcium, alcohol consumption, high blood pressure, moderate activity, diabetes and smoking were adjusted
Relationship between total cholesterol and total BMD
The multivariate regression analysis results are presented in Table 2. When no covariates are adjusted, total cholesterol was negatively associated with total BMD in Model 1 (β = − 0.0070, 95%CI − 0.0090 to − 0.0051, P < 0.001). After covariates were adjusted, this negative relationship was still present in Model 2 (β = − 0.0038, 95%CI − 0.0058 to − 0.0019, P < 0.001) and Model 3 (β = − 0.0036, 95%CI − 0.0057 to − 0.0015, P < 0.001). Participants of the highest total cholesterol quartile (Q4) had a 0.0109 g/cm2 lower total BMD than those in the base total cholesterol quartile after total cholesterol had been transformed from a continuing variable to a quartile’s variable.
Table 2.
Association between total cholesterol (mmol/L) and total bone mineral density (g/cm2)
| Model 1, β (95%, CI) | Model 2, β (95%, CI) | Model 3, β (95%, CI) | |
|---|---|---|---|
| P value | P value | P value | |
| Serum cholesterol (mmol/L) | − 0.0070 (− 0.0090, − 0.0051) | − 0.0038 (− 0.0058, − 0.0019) | − 0.0036 (− 0.0057, − 0.0015) |
| < 0.001 | < 0.001 | < 0.001 | |
| Quintiles of cholesterol | |||
| Lowest quintiles (0.15–4.23 mmol/L) | Reference | Reference | Reference |
| Q2(1.50–4.20 mmol/L) | − 0.0072 (− 0.0131, − 0.0013) | 0.0005 (− 0.0050, 0.0059) | − 0.0001 (− 0.0055, 0.0053) |
| Q3(4.81–5.51 mmol/L) | − 0.0114 (− 0.0173, − 0.0055) | − 0.0025 (− 0.0080, 0.0030) | − 0.0040 (− 0.0095, 0.0015) |
| Q4(5.52–21.02 mmol/L) | − 0.0201 (− 0.0259, − 0.0142) | − 0.0112 (− 0.0169, − 0.0056) | − 0.0109 (− 0.0168, − 0.0050) |
| P for trend | < 0.001 | < 0.001 | < 0.001 |
| Stratified by gender | |||
| Men | − 0.0053 (− 0.0081, -0.0025) | − 0.0030 (− 0.0058, − 0.0002) | − 0.0037 (− 0.0067, − 0.0006) |
| < 0.001 | 0.0198 | 0.020 | |
| Women | − 0.0086 (− 0.0112, − 0.0061) | − 0.0041 (− 0.0068, − 0.0015) | − 0.0037 (− 0.0065, − 0.0008) |
| < 0.001 | 0.002 | 0.011 | |
| Stratified by race/ethnicity | |||
| Non-Hispanic White | − 0.0065 (− 0.0098, − 0.0032) | − 0.0044 (− 0.0076, − 0.0011) | − 0.0040 (− 0.0075, − 0.0004) |
| < 0.001 | 0.009 | 0.028 | |
| Non-Hispanic Black | − 0.0061 (− 0.0111, − 0.0012) | − 0.0012 (− 0.0060, 0.0037) | − 0.0005 (− 0.0056, 0.0046) |
| 0.014 | 0.632 | 0.844 | |
| Mexican American | − 0.0014 (− 0.0062, 0.0035) | − 0.0024 (− 0.0072, 0.0024) | − 0.0028 (− 0.0081, 0.0026) |
| 0.584 | 0.329 | 0.316 | |
| Other race/ethnicity | − 0.0064 (− 0.0100, − 0.0028) | − 0.0045 (− 0.0080, − 0.0010) | − 0.0047 (− 0.0086, − 0.0008) |
| < 0.001 | 0.0126 | 0.017 | |
| Stratified by age | |||
| 20 ≤ Age < 30 | − 0.0033 (− 0.0079, 0.0012) | − 0.0017 (− 0.0059, 0.0025) | − 0.0040 (− 0.0086, 0.0006) |
| 0.152 | 0.437 | 0.086 | |
| 30 ≤ Age < 40 | − 0.0012 (− 0.0054, 0.0030) | − 0.0046 (− 0.0086, − 0.0007) | − 0.0030 (− 0.0073, 0.0013) |
| 0.575 | 0.020 | 0.168 | |
| 40 ≤ Age < 50 | − 0.0008 (− 0.0045, 0.0030) | − 0.0008 (− 0.0043, 0.0027) | − 0.0006 (− 0.0045, 0.0033) |
| 0.689 | 0.6617 | 0.770 | |
| 50 ≤ Age < 60 | − 0.0166 (− 0.0208, − 0.0124) | − 0.0049 (− 0.0068, − 0.0030) | − 0.0048 (− 0.0069, − 0.0028) |
| < 0.001 | < 0.001 | < 0.001 | |
Model 1: No covariates were adjusted. Model 2: Age, gender and race/ethnicity were adjusted. Model 3: Age, gender, race/ethnicity, ratio of family income-to-poverty, education level, marital status, blood urea nitrogen, serum phosphorus, γ-glutamyl transferase, ALT, AST, lactate dehydrogenase, serum uric acid, triglycerides, BMI, waist circumference, serum calcium, calcium intake, alcohol consumption, high blood pressure, moderate activity, diabetes and smoking were adjusted. In the subset analysis stratified by sex, race/ethnicity, and age, the model is not adjusted for sex, race/ethnicity and age, respectively
Subgroup analysis
Subgroup analyses, stratified by gender, age, and, race/ethnicity, are presented in Table 2. The adverse connection of total cholesterol with total BMD remained in both females (β = − 0.0037, 95%CI − 0.0065 to − 0.0008, P = 0.011) and males (β = − 0.0037, 95%CI − 0.0067 to -0.0006, P = 0.020), as well as in non-Hispanic white (β = − 0.0040, 95%CI − 0.0075 to − 0.0004, P = 0.028) and other races (β = − 0.0047, 95%CI − 0.0086 to − 0.0008, P = 0.017), but not in Mexican Americans and non-Hispanic blacks. Moreover, the significant negative correlation still existed in participants aged 50–59 years (β = − 0.0048, 95%CI − 0.0069 to − 0.0028, P < 0.001).
Figures 4, 5, 6, and 7 illustrate fitted smooth curve and generalized additive model applied to describe the linear or nonlinear relationship between total cholesterol and total BMD. In other races (including Hispanic and Multi-Racial), the relationship between total cholesterol and total BMD was a reverse-L-curve, and the inflection point was 6.7 mmol/L (Table 3). Among participants aged 40–49 years, the association between total cholesterol and total BMD was a U-shaped curve (Table 4). For a total cholesterol < 5.84 mmol/L, every 1 mmol/L increase in total cholesterol was associated with a 0.0063 g/cm decrease in total BMD (95%CI − 0.0117 to − 0.0009); by comparison, for individuals with a total cholesterol > 5.84 mmol/L, a 1 mmol/L increase in total cholesterol was associated with a 0.0092 g/cm increase in total BMD (95%CI 0.0017 to 0.0167). Among participants at borderline diabetes status (Table 5), a U-shaped curve (inflection point: 4.65 mmol/L) was presented. For total cholesterol < 4.65 mmol/L, every 1 mmol/L growth was related to a 0.0504 g/cm2 lower total BMD (95%CI − 0.0941 to − 0.0068); on contrast, for participants with a total cholesterol > 4.65 mmol/L, a 1 mmol/L increase in total cholesterol was linked with a 0.0293 g/cm2 increase in total BMD (95%CI 0.0093 to 0.0493).
Fig. 4.
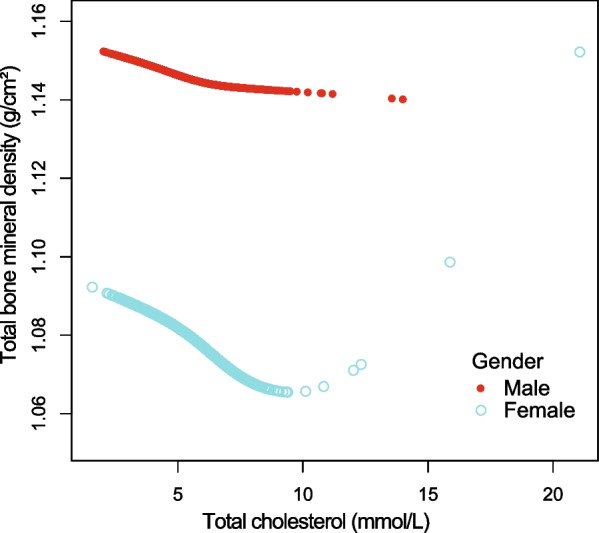
The relationship between total cholesterol and total bone mineral density stratified by gender. Age, gender, race/ethnicity, ratio of family income-to-poverty, education level, marital status, blood urea nitrogen, serum phosphorus, γ-glutamyl transferase, ALT, AST, lactate dehydrogenase, serum uric acid, triglycerides, BMI, waist circumference, calcium intake, serum calcium, alcohol consumption, high blood pressure, moderate activity, diabetes, and smoking were adjusted
Fig. 5.
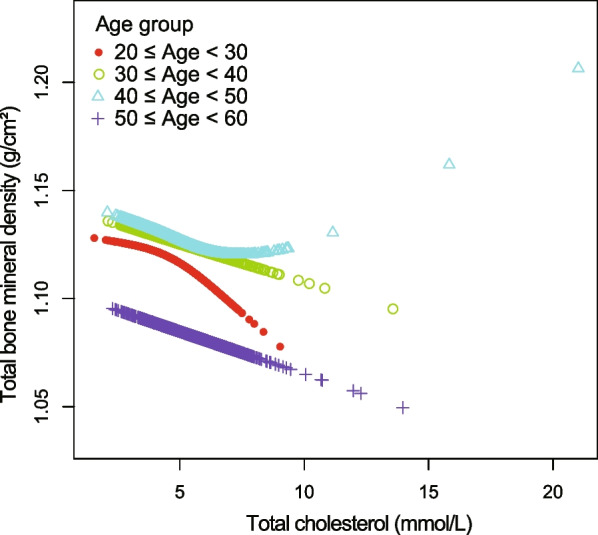
The relationship between total cholesterol and total bone mineral density stratified by age. Gender, race/ethnicity, ratio of family income-to-poverty, education level, marital status, blood urea nitrogen, serum calcium, serum phosphorus, γ-glutamyl transferase, ALT, AST, lactate dehydrogenase, serum uric acid, triglycerides, BMI, waist circumference, calcium intake, alcohol consumption, high blood pressure, moderate activity, diabetes, and smoking were adjusted
Fig. 6.
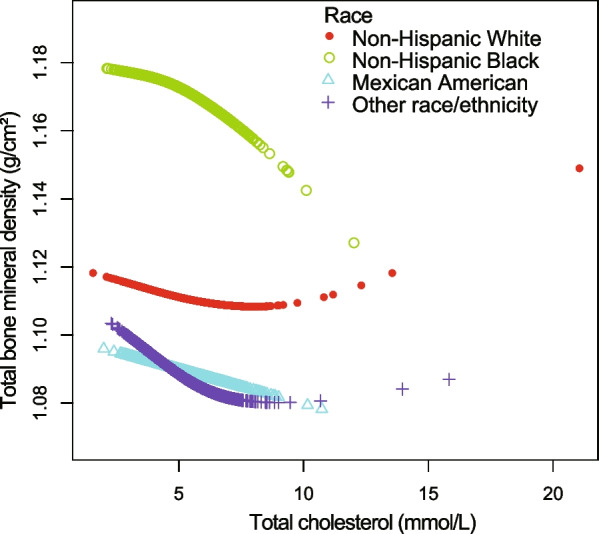
The relationship between total cholesterol and total bone mineral density stratified by race/ethnicity. Age, gender, marital status, ratio of family income-to-poverty, education level, blood urea nitrogen, serum phosphorus, γ-glutamyl transferase, ALT, AST, lactate dehydrogenase, serum uric acid, triglycerides, BMI, waist circumference, calcium intake, serum calcium, alcohol consumption, high blood pressure, moderate activity, diabetes, and smoking were adjusted
Fig. 7.

The relationship between total cholesterol and total bone mineral density stratified by diabetes. Age, gender, race/ethnicity, ratio of family income-to-poverty, education level, marital status, blood urea nitrogen, serum phosphorus, γ-glutamyl transferase, ALT, AST, lactate dehydrogenase, serum uric acid, triglycerides, BMI, waist circumference, calcium intake, serum calcium, alcohol consumption, high blood pressure, moderate activity, and smoking were adjusted
Table 3.
Threshold effect analysis of total cholesterol on total bone mineral density in other race (including Hispanic and Multi-Racial) using the two-piecewise linear regression model
| Total bone mineral density | Adjusted β (95% CI) P value |
|---|---|
| Other races | |
| Fitting by the standard linear model | − 0.0049 (− 0.0087, − 0.0010) 0.0136 |
| Fitting by the two-piecewise linear model | |
| Inflection point | 6.7 |
| Serum cholesterol < 6.7 mmol/L | − 0.0064 (− 0.0105, − 0.0023) 0.0021 |
| Serum cholesterol > 6.7 mmol/L | 0.0121 (− 0.0029, 0.0272) 0.1149 |
| Log likelihood ratio | 0.022 |
Age, gender, ratio of family income-to-poverty, education level, marital status, blood urea nitrogen, serum phosphorus, γ-glutamyl transferase, ALT, AST, lactate dehydrogenase, serum uric acid, triglycerides, BMI, waist circumference, serum calcium, calcium intake, alcohol consumption, high blood pressure, moderate activity, diabetes and smoking were adjusted
Table 4.
Threshold effect analysis of total cholesterol on total bone mineral density in 40–49 years old group using the two-piecewise linear regression model
| Total bone mineral density | Adjusted β (95% CI) P value |
|---|---|
| Aged 40–49 years old | |
| Fitting by the standard linear model | − 0.0006 (− 0.0045, 0.0033) 0.7696 |
| Fitting by the two-piecewise linear model | |
| Inflection point | 5.84 |
| Serum cholesterol < 5.84 mmol/L | − 0.0063 (− 0.0117, − 0.0009) 0.0225 |
| Serum cholesterol > 5.84 mmol/L | 0.0092 (0.0017, 0.0167) 0.0161 |
| Log likelihood ratio | 0.003 |
Age, gender, race/ethnicity, ratio of family income-to-poverty, education level, marital status, blood urea nitrogen, serum phosphorus, γ-glutamyl transferase, ALT, AST, lactate dehydrogenase, serum uric acid, triglycerides, BMI, waist circumference, serum calcium, calcium intake, alcohol consumption, high blood pressure, moderate activity, diabetes and smoking were adjusted
Table 5.
Threshold effect analysis of total cholesterol on total bone mineral density in borderline diabetes status using the two-piecewise linear regression model
| Total bone mineral density | Adjusted β (95% CI) P value |
|---|---|
| Borderline diabetes status | |
| Fitting by the standard linear model | 0.0087 (− 0.0055, 0.0230) 0.2295 |
| Fitting by the two-piecewise linear model | |
| Inflection point | 4.65 |
| Serum cholesterol < 4.65 mmol/L | − 0.0504 (− 0.0941, − 0.0068) 0.0251 |
| Serum cholesterol > 4.65 mmol/L | 0.0293 (0.0093, 0.0493) 0.0047 |
| Log likelihood ratio | 0.003 |
Age, gender, race/ethnicity, ratio of family income-to-poverty, education level, marital status, blood urea nitrogen, serum phosphorus, γ-glutamyl transferase, ALT, AST, lactate dehydrogenase, serum uric acid, triglycerides, BMI, waist circumference, serum calcium, calcium intake, alcohol consumption, high blood pressure, moderate activity and smoking were adjusted
Discussion
In our multivariate linear regression analyses, total cholesterol was negatively correlated with total BMD. Nevertheless, among borderline diabetes status participants, participants aged 40–49 years, and races including Hispanic and Multi-Racial, we discovered a nonlinear relationship between total cholesterol and total BMD, with inflection points 4.65 mmol/L, 5.84 mmol/L, and 6.7 mmol/L, respectively.
At present, the evidence of a relationship between total cholesterol and BMD among adults is lacking. In the past decades, epidemiological studies have shown a trend in adults that total cholesterol in plasma is increasing [26]. Age and total cholesterol concentration are widely recognized atherosclerotic cardiovascular disease (ASCVD) risk factors worldwide according to different functions that have been devised in order to provide an estimation of the possibility to bear fatal cardiovascular events [27]. But the relative influence of total cholesterol tends to be less prominent in the older adults because age itself is prevail over the other risk factors [28]. Recently, accumulated studies suggested that high cholesterol inhibits osteoblast differentiation and enhances osteoclastogenesis, thereby decreasing BMD, but the process various in different body sites [29–31]. Panagiotis Anagnostis et al. considered that serum cholesterol directly affects bone dyslipidemia via inhibiting osteoblast differentiation, accumulating in the subendothelial area of bone arteries, and activating oxidative stress in bone marrow microcirculation [32]. Among our representative US participants, a higher total cholesterol was tied with a lower total BMD in participants aged 20–59 years. Taking this relationship into account, total cholesterol may affect bone metabolism via skeletal microenvironment, and manage total cholesterol level may prevent osteoporosis or osteopenia.
Prior studies have noted the importance of total cholesterol in cardiovascular risk and osteopenia in adolescents, older people, and postmenopausal women [33, 34]. Han Hyuk Lim reported that serum total cholesterol in participants aged 10 to 18 years was significantly linked with lower BMD after adjusting for age, gender, height, and weight in Korea [35]. Joanna Makovey et al. reported that the association between total cholesterol and lumber BMD was significant negative in postmenopausal female after adjusting for age, BMI, smoke and alcohol consumption [6]. However, some follow-up research from Greece and the USA denied this negative association [36, 37]. Heterogeneity between these researches, such as different study designs, sampling methodologies, the confounding variables controlled for, and the distribution of race, may explain the debatable results. It is necessary to investigate more comprehensively the influence of total cholesterol due to high total cholesterol affecting 17.4% US adults [27].
After adjusting for covariates, our results suggested that higher total cholesterol was linked with a lower total BMD in participants aged 20–59 years in weighted multiple linear regression models. As recommended by the STROBE statement, we further performed subgroup analysis to determine a special group with diverse trends [26]. We discovered a U-shaped curve with an inflection point (4.65 mmol/L) between total cholesterol and total BMD in in borderline diabetes status participants. It is interesting to note that in participants aged 40–49 years, a saturation effect with an inflection point (5.84 mmol/L) was found, and a nonlinear curve for other races (including Hispanic and Multi-Racial) with an inflection point (6.7 mmol/L) was found.
In a population sample aged 20–59 years, the relationship between total cholesterol and total BMD is poorly known. As we administered a national representative sample, the findings of our study were extremely relevant to the US population. Moreover, the large sample size was feasible to conduct subgroup analyses, reporting on the association between total cholesterol and total BMD among different genders, race/ethnicity, age groups, and diabetes status. However, it is critical to acclaim the limitations in our study. First, participants with cancer or malignancy were excluded because cancer may influence the total cholesterol or total BMD, which may influence the extensibility of the conclusion. Second, the endocrine indicators like estrogen were not accessible or were absent in the NHANES 2011–2018, our findings cannot include these covariates in the present population. Third, our findings restricted the determination of causality between total cholesterol and total BMD in adults because NHANES uses a cross-sectional methodology. More bone metabolism researches and large participates prospective study is essential to comprehend the distinct mechanism of the relation among total cholesterol and total BMD.
Acknowledgements
Not Applicable.
Abbreviations
- DEXA
Dual-energy X-ray absorptiometry
- BMD
Bone mineral density
- NHANES
National Health and Nutrition Examination Survey
- ASCVD
Atherosclerotic cardiovascular disease
- ALT
Alanine aminotransferase
- AST
Aspartate aminotransferase
Author contributions
LC contributed to data collection, analysis and writing of the manuscript. WW, XD HG FP and ZS contributed to study design and writing of the manuscript. All authors read and approved the final manuscript.
Funding
The study was financed by The National Natural Science Foundation of China (No. 81904231).
Availability of data and materials
The survey data are publicly available on the interest for data users and researchers throughout the world (www.cdc.gov/nchs/nhanes/).
Declarations
Ethics approval and consent to participate
The ethics review board of the National Center for Health Statistics approved all NHANES protocols.
Consent for publication
Not Applicable.
Competing interests
The authors declare that they have no competing interests.
Footnotes
Publisher's Note
Springer Nature remains neutral with regard to jurisdictional claims in published maps and institutional affiliations.
References
- 1.Tian L, Yu X. Lipid metabolism disorders and bone dysfunction–interrelated and mutually regulated (review) Mol Med Rep. 2015;12(1):783–794. doi: 10.3892/mmr.2015.3472. [DOI] [PMC free article] [PubMed] [Google Scholar]
- 2.Fu X, Wang Y, He X, et al. A systematic review and meta-analysis of serum cholesterol and triglyceride levels in patients with Parkinson's disease. Lipids Health Dis. 2020;19(1):97–97. doi: 10.1186/s12944-020-01284-w. [DOI] [PMC free article] [PubMed] [Google Scholar]
- 3.Papathanasiou I, Anastasopoulou L, Tsezou A. Cholesterol metabolism related genes in osteoarthritis. Bone. 2021;152:116076. doi: 10.1016/j.bone.2021.116076. [DOI] [PubMed] [Google Scholar]
- 4.Choy PC, Siow YL, Mymin D, et al. Lipids and atherosclerosis. Biochem Cell Biol. 2004;82(1):212–224. doi: 10.1139/o03-085. [DOI] [PubMed] [Google Scholar]
- 5.Song Y, Liu J, Zhao K, et al. Cholesterol-induced toxicity: an integrated view of the role of cholesterol in multiple diseases. Cell Metab. 2021;33(10):1911–1925. doi: 10.1016/j.cmet.2021.09.001. [DOI] [PubMed] [Google Scholar]
- 6.Makovey J, Chen JS, Hayward C, et al. Association between serum cholesterol and bone mineral density. Bone. 2009;44(2):208–213. doi: 10.1016/j.bone.2008.09.020. [DOI] [PubMed] [Google Scholar]
- 7.Cui LH, Shin MH, Chung EK, et al. Association between bone mineral densities and serum lipid profiles of pre- and post-menopausal rural women in South Korea. Osteoporos Int. 2005;16(12):1975–1981. doi: 10.1007/s00198-005-1977-2. [DOI] [PubMed] [Google Scholar]
- 8.Adami S, Braga V, Zamboni M, et al. Relationship between lipids and bone mass in 2 cohorts of healthy women and men. Calcif Tissue Int. 2004;74(2):136–142. doi: 10.1007/s00223-003-0050-4. [DOI] [PubMed] [Google Scholar]
- 9.Cui R, Zhou L, Li Z, et al. Assessment risk of osteoporosis in Chinese people: relationship among body mass index, serum lipid profiles, blood glucose, and bone mineral density. Clin Interv Aging. 2016;11:887–895. doi: 10.2147/CIA.S103845. [DOI] [PMC free article] [PubMed] [Google Scholar]
- 10.Orozco P. Atherogenic lipid profile and elevated lipoprotein (a) are associated with lower bone mineral density in early postmenopausal overweight women. Eur J Epidemiol. 2004;19(12):1105–1112. doi: 10.1007/s10654-004-1706-8. [DOI] [PubMed] [Google Scholar]
- 11.You L, Sheng ZY, Tang CL, et al. High cholesterol diet increases osteoporosis risk via inhibiting bone formation in rats. Acta Pharmacol Sin. 2011;32(12):1498–1504. doi: 10.1038/aps.2011.135. [DOI] [PMC free article] [PubMed] [Google Scholar]
- 12.Miller PD. Management of severe osteoporosis. Expert Opin Pharmacother. 2016;17(4):473–488. doi: 10.1517/14656566.2016.1124856. [DOI] [PubMed] [Google Scholar]
- 13.Wright NC, Looker AC, Saag KG, et al. The recent prevalence of osteoporosis and low bone mass in the United States based on bone mineral density at the femoral neck or lumbar spine. J Bone Miner Res. 2014;29(11):2520–2526. doi: 10.1002/jbmr.2269. [DOI] [PMC free article] [PubMed] [Google Scholar]
- 14.Ström O, Borgström F, Kanis JA, et al. Osteoporosis: burden, health care provision and opportunities in the EU: a report prepared in collaboration with the International Osteoporosis foundation (IOF) and the European federation of pharmaceutical industry associations (EFPIA) Arch Osteoporos. 2011;6:59–155. doi: 10.1007/s11657-011-0060-1. [DOI] [PubMed] [Google Scholar]
- 15.Papadopoulou SK, Papadimitriou K, Voulgaridou G, et al. Exercise and nutrition impact on osteoporosis and sarcopenia-the incidence of osteosarcopenia: a narrative review. Nutrients. 2021;13(12):4499. doi: 10.3390/nu13124499. [DOI] [PMC free article] [PubMed] [Google Scholar]
- 16.Gennari L, Bilezikian JP. Idiopathic osteoporosis in men. Curr Osteoporos Rep. 2013;11(4):286–298. doi: 10.1007/s11914-013-0164-1. [DOI] [PubMed] [Google Scholar]
- 17.Zhai T, Chen Q, Xu J, et al. Prevalence and trends in low bone density, osteopenia and osteoporosis in U.S. adults with non-alcoholic fatty liver disease, 2005–2014. Front Endocrinol (Lausanne) 2021;12:825448. doi: 10.3389/fendo.2021.825448. [DOI] [PMC free article] [PubMed] [Google Scholar]
- 18.Chen C, Chen Q, Nie B, et al. Trends in bone mineral density, osteoporosis, and osteopenia among US adults with prediabetes, 2005–2014. Diabetes Care. 2020;43(5):1008–1015. doi: 10.2337/dc19-1807. [DOI] [PubMed] [Google Scholar]
- 19.Malgo F, Appelman-Dijkstra NM, Termaat MF, et al. High prevalence of secondary factors for bone fragility in patients with a recent fracture independently of BMD. Arch Osteoporos. 2016;11(1):12. doi: 10.1007/s11657-016-0258-3. [DOI] [PMC free article] [PubMed] [Google Scholar]
- 20.Lacombe J, Cairns BJ, Green J, et al. The effects of age, adiposity, and physical activity on the risk of seven site-specific fractures in postmenopausal women. J Bone Miner Res. 2016;31(8):1559–1568. doi: 10.1002/jbmr.2826. [DOI] [PMC free article] [PubMed] [Google Scholar]
- 21.van Staa TP, Dennison EM, Leufkens HG, et al. Epidemiology of fractures in England and wales. Bone. 2001;29(6):517–522. doi: 10.1016/S8756-3282(01)00614-7. [DOI] [PubMed] [Google Scholar]
- 22.Kelsey J L Risk factors for osteoporosis and associated fractures [J]. Public health reports (Washington, DC)1974; 1989, 104 Suppl(Suppl): 14–20. [PMC free article] [PubMed]
- 23.Andrew T, Macgregor AJ. Genes and osteoporosis. Curr Osteoporos Rep. 2004;2(3):79–89. doi: 10.1007/s11914-004-0015-1. [DOI] [PubMed] [Google Scholar]
- 24.Jeong SM, Choi S, Kim K, et al. Effect of change in total cholesterol levels on cardiovascular disease among young adults. J Am Heart Assoc. 2018;7(12):008819. doi: 10.1161/JAHA.118.008819. [DOI] [PMC free article] [PubMed] [Google Scholar]
- 25.He GD, Liu XC, Liu L, et al. A nonlinear association of total cholesterol with all-cause and cause-specific mortality. Nutr Metab (Lond) 2021;18(1):25. doi: 10.1186/s12986-021-00548-1. [DOI] [PMC free article] [PubMed] [Google Scholar]
- 26.von Elm E, Altman DG, Egger M, et al. The strengthening the reporting of observational studies in epidemiology (STROBE) statement: guidelines for reporting observational studies. J Clin Epidemiol. 2008;61(4):344–349. doi: 10.1016/j.jclinepi.2007.11.008. [DOI] [PubMed] [Google Scholar]
- 27.Virani SS, Alonso A, Aparicio HJ, et al. Heart disease and stroke statistics-2021 update: a report from the American heart association. Circulation. 2021;143(8):e254–e743. doi: 10.1161/CIR.0000000000000950. [DOI] [PubMed] [Google Scholar]
- 28.Catapano AL, Graham I, De Backer G, et al. 2016 ESC/EAS guidelines for the management of dyslipidaemias. Eur Heart J. 2016;37(39):2999–3058. doi: 10.1093/eurheartj/ehw272. [DOI] [PubMed] [Google Scholar]
- 29.Pelton K, Krieder J, Joiner D, et al. Hypercholesterolemia promotes an osteoporotic phenotype. Am J Pathol. 2012;181(3):928–936. doi: 10.1016/j.ajpath.2012.05.034. [DOI] [PMC free article] [PubMed] [Google Scholar]
- 30.Mandal CC. High cholesterol deteriorates bone health: new insights into molecular mechanisms. Front Endocrinol (Lausanne) 2015;6:165. doi: 10.3389/fendo.2015.00165. [DOI] [PMC free article] [PubMed] [Google Scholar]
- 31.Papachristou NI, Blair HC, Kypreos KE, et al. High-density lipoprotein (HDL) metabolism and bone mass. J Endocrinol. 2017;233(2):R95–R107. doi: 10.1530/JOE-16-0657. [DOI] [PMC free article] [PubMed] [Google Scholar]
- 32.Anagnostis P, Florentin M, Livadas S, et al. Bone health in patients with dyslipidemias: an underestimated aspect. Int J Mol Sci. 2022;23(3):1639. doi: 10.3390/ijms23031639. [DOI] [PMC free article] [PubMed] [Google Scholar]
- 33.Kapourchali FR, Surendiran G, Goulet A, et al. The role of dietary cholesterol in lipoprotein metabolism and related metabolic abnormalities: a mini-review. Crit Rev Food Sci Nutr. 2016;56(14):2408–2415. doi: 10.1080/10408398.2013.842887. [DOI] [PubMed] [Google Scholar]
- 34.Ackert-Bicknell CL. HDL cholesterol and bone mineral density: is there a genetic link? Bone. 2012;50(2):525–533. doi: 10.1016/j.bone.2011.07.002. [DOI] [PMC free article] [PubMed] [Google Scholar]
- 35.Lim HH. Effect of serum cholesterol on bone mineral density in normal-weight children and adolescents. J Pediatr Endocrinol Metab. 2015;28(11–12):1313–1319. doi: 10.1515/jpem-2014-0360. [DOI] [PubMed] [Google Scholar]
- 36.Pliatsika P, Antoniou A, Alexandrou A, et al. Serum lipid levels and bone mineral density in Greek postmenopausal women. Gynecol Endocrinol. 2012;28(8):655–660. doi: 10.3109/09513590.2011.650766. [DOI] [PubMed] [Google Scholar]
- 37.Samelson EJ, Cupples LA, Hannan MT, et al. Long-term effects of serum cholesterol on bone mineral density in women and men: the Framingham osteoporosis study. Bone. 2004;34(3):557–561. doi: 10.1016/j.bone.2003.11.024. [DOI] [PubMed] [Google Scholar]
Associated Data
This section collects any data citations, data availability statements, or supplementary materials included in this article.
Data Availability Statement
The survey data are publicly available on the interest for data users and researchers throughout the world (www.cdc.gov/nchs/nhanes/).