Abstract
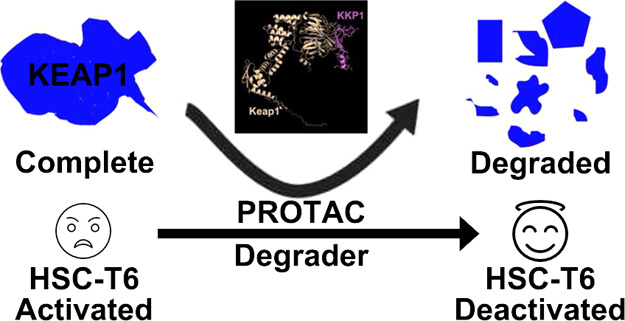
Accumulating evidence indicates that oxidative stress and inflammation are involved in the physiopathology of liver fibrogenesis. Nuclear factor erythroid 2-related factor 2 (Nrf2) is a key transcription factor, which regulates the expression of redox regulators to establish cellular redox homeostasis. The Nrf2 modulator can serve as a primary cellular defense against the cytotoxic effects of oxidative stress. We designed a chimeric Keap1–Keap1 peptide (KKP1) based on the proteolysis-targeting chimera technology. The KKP1 peptide not only can efficiently penetrate into the rat hepatic stellate cell line (HSC-T6) cells but also can induce Keap1 protein degradation by the ubiquitination–proteasome degradation pathway, which releases Nrf2 and promotes the transcriptional activity of the Nrf2/antioxidant response element pathway. It then activates the protein expression of the downstream antioxidant factors, the glutamate-cysteine ligase catalytic subunit and heme oxygenase-1 (HO-1). Finally, Keap1 protein degradation inhibits the nuclear factor-kappaB inflammatory signal pathway, the downstream inflammatory factor tumor necrosis factor alpha, and the interleukin-1beta protein expression and further inhibits the expression of the fibrosis biomarker gene. The current research suggests that our designed KKP1 may provide a new avenue for the future treatment of liver fibrosis.
Keywords: Keap1, Nrf2, PROTAC, cell penetrating peptide, hepatic stellate cells, fibrosis
Liver fibrosis is a common liver pathological process in which excessive precipitation of the diffusive liver extracellular matrix (ECM) occurs because of the intrahepatic connective tissue dysplasia caused by a variety of factors, such as viral infection, autoimmunity, drugs, cholestasis, and metabolic diseases.1−4 Activated hepatic stellate cells (HSCs) are the main ECM-producing cells in the injured liver and the key mediators of liver fibrosis.5−8
Chronic damaged liver cells trigger inflammation and activate Kupffer cells. Inflammatory factors and reactive oxygen species (ROS)-activated HSCs up-regulate the expression of alpha smooth muscle actin (α-SMA) and collagen and further promote the production of intracellular ROS.9,10 Oxidative stress can simultaneously activate the transcription factor nuclear factor erythroid 2-related factor 2 (Nrf2) anti-oxidative stress and the nuclear factor-kappaB (NF-κB) signaling pathway. The Nrf2 pathway inhibits the activity of NF-κB by preventing the degradation of IκB-α and neutralizing the cellular ROS. On the other hand, NF-κB-mediated transcription reduces the antioxidant response element (ARE) gene transcription and free cAMP response element-binding protein by competing with Nrf2 for CBP, thereby inhibiting the Nrf2 pathway activation.11 Nrf2 translocation into the nucleus binds to the Maf protein to form a heterodimer and then binds to ARE, which initiates the transcription of the downstream HO-1, quinine oxidoreductase 1 (NQO-1), GSH synthase [glutamate-cysteine ligase catalytic (GCLC), glutamate-cysteine ligase catalytic modifier (GCLM)], and other antioxidant stress protein genes.12
The key to the activation of the Nrf2 signaling pathway is the uncoupling of Nrf2 and Keap1, releasing Nrf2, and inducing the degradation of Keap1, which can promote anti-inflammatory and antioxidant properties. In recent years, the proteolysis-targeting chimera (PROTAC) technology uses the ubiquitin–proteasome pathway to perform post-translational degradation of target proteins, which has become a promising strategy for targeted drug development.13,14 One of the keys to the PROTAC technology is the linking ligand that connects the target protein to the E3 ubiquitin ligase.14−18 Winter et al. reported that the bromodomain-containing protein 4 (BRD4) inhibitor JQ1 was linked to the E3 small molecule ligand thalidomide by linking the ligands to target the PROTAC small molecule dBET1 (bromodomain and extraterminal domain) that degrades BRD4.19 Ramani et al. used JQ1 and the von Hippel-Lindau (VHL) small molecule ligand VHL-2 to design and synthesize the PROTAC molecule ARV-771 that targets the degradation of the BET protein to inhibit tumor growth in the castration-resistant prostate cancer mouse models.20
Here, we designed the KKP peptide to specifically degrade Keap1 and enhance the transcriptional activity of Nrf2, which will help improve the antioxidant capacity of HSCs, inhibit the inflammatory response, and then inhibit the HSC activation. Considering the chimeric molecule size and weight, a cell-penetrating peptide (CPP) sequence called hPP10,21−24 which has the ability of macromolecule delivery similar to that of other known CPPs, was fused to the C-terminal of the designed chimeric peptide, which was expected to efficiently penetrate the cytoplasm to accomplish its function. In this experimental study, the designed and synthesized fusion Keap1–Keap1 peptide (KKP1) was used as a linking ligand in PROTAC technology to recruit Keap1 target proteins and connect to the E3 ubiquitin ligase, thereby degrading the total amount of Keap1 protein. These findings indicated that our designed KKP1 can be used to achieve the purpose of inhibiting liver fibrosis.
Materials and Methods
Bioinformatic Analysis
Amino acid sequences of the designed peptides KKP1, KKP2, and KKPs were submitted to the TASSR (https://zhanglab.ccmb.med.umich.edu/I-TASSER/),25,26 Raptor X (http://raptorx.uchicago.edu/),27,28 PEP-FOLD3 (https://bioserv.rpbs.univ-paris-diderot.fr/services/PEP-FOLD3/),29,30 and RoseTTAFold (https://robetta.bakerlab.org/)31,32 online web servers to predict their secondary structures. The three dimensional (3D) models’ validations using PROCHECK,33 ERRAT,34 and ProSA35 were also performed. The predicted structures, hydrophobicity, energy map, and surface electrostatics were illustrated using the Molegro Molecular Viewer.
To further predict the penetration property of the designed peptides KKP1, KKP2, and KKPs, sequence-based penetration property predictors including CellPPD-MOD (https://webs.iiitd.edu.in/raghava/cellppdmod/),36 C2Pred (http://lin-group.cn/server/C2Pred),37 and MLCPP (http://www.thegleelab.org/MLCPP/)38 were used to predict whether these three peptides are CPP or non-CPP.
Before the computational molecular docking studies on KKP1–KEAP1 interactions, the rat KEAP1 protein structure was generated using AlphaFold,39 a web server ClusPro 2.0 for KKP1, and rat KEAP1 docking was used in this study.40 The docked complex of KKP1–KEAP1 with the lowest binding energy was selected and illustrated by PyMOL.
Peptide Synthesis, Plasmids, Cell Lines, and Cell Culture
The fluorescein isothiocyanate (FITC)-labeled peptide KKP was synthesized by Wuhan Baiyixin Biotechnology Co., Ltd. with a purity of 93.42%. The synthesized peptides were dissolved with phosphate-buffered saline (PBS), diluted to 0.5 mM in a solution, and stored at −80 °C until use.
The immortalized rat HSC-T6 was kindly gifted by Professor Liu Chenghai (Shanghai University of Traditional Chinese Medicine) and maintained in the Hubei Key Laboratory of Tumor Microenvironment and Immunotherapy, China Three Gorges University. HSC-T6 cells were grown in Dulbecco’s modified Eagle’s medium with the addition of 10% heated-inactivated fetal bovine serum and 1% penicillin–streptomycin at 37 °C and 5% CO2.
The ARE luciferase reporter gene plasmid (ARE-Luc) was purchased from Beijing Biolab Technology Co., Ltd., and the NF-κB response reporter plasmid NF-κB luciferase reporter (V15-Luc) was ordered from New England Biolabs. (R)-MG132 (GC41233) was obtained from GLPBIO (Montclair, CA, USA).
Fluorescent Microscopy and Fluorescent Quantification
HSC-T6 cells (1.8 × 10⁵ cells per well) were seeded in a 24-well plate and cultured overnight. A serum-free medium (about 800 μL) supplemented with 5% dimethyl sulfoxide (DMSO) was added to each well for 30 min of incubation. The supernatant medium was discarded and supplied with 800 μL of a medium containing different concentrations of peptide KKP1, KKP2, or KKPs and incubated with different points. After washing three times with PBS, the cells were observed under a fluorescence microscope (Nikon, Tokyo, Japan).
To determine the cellular uptake of KKP, multimode spectrophotometry was used to quantify the fluorescence in the cell. After peptide incubation, the cells in the plate were washed three times using PBS. The cell lysate collection with a 0.3 mL/well-lysing buffer (0.1 M NaOH) was performed, and then, it was centrifuged at 110 g for 5 min. The fluorescence intensity of the supernatant was read by a plate-reader spectrophotometer (Tecan, Mannedorf, Switzerland) to quantify the fluorescence intensity at the wavelengths of 485 nm in excitation and 535 nm in emission. Normalization was performed by the protein concentration. Three replicate experiments were conducted for the quantification.
Cytotoxicity Assay
HSC-T6 cells were seeded in a 96-well plate with 104 cells per well overnight. After washing with PBS, the cells were treated with peptides KKP1, KKP2, and KKPs for different time points. A Cell Counting Kit (CCK)-8 assay was performed by following the manufacturer’s instructions, and the absorbance of formazan was read in a Multiskan Spectrum (Thermo Fisher Scientific, Waltham, MA, USA) reader at 460 nm.
Western Blotting
HSC-T6 cells were plated in a six-well plate with 104 cells per well and cultured overnight. HSC-T6 cells were treated with different concentrations of peptides KKP1, KKP2, and KKPs for different time points. After washing with PBS, the total protein was extracted from the HSC-T6 cells by using the RIPA lysis buffer with PMSF. Equal amounts of proteins (10 μg) in the loading buffer were separated by sodium dodecyl sulfate polyacrylamide gel electrophoresis and transferred to a polyvinylidene difluoride membrane. After blocking with 5% non-fat milk for 1 h, the membrane was incubated with anti-Keap1 (Santa Cruz Biotechnology, sc-365626, 1:1000), COX2 (Santa Cruz Biotechnology, sc-19999, 1:1000), NQO-1 (Proteintech, 11451-1-AP, 1:4000), HO-1 (Proteintech, 10701-1-AP, 1:2000), GCLC (Santa Cruz Biotechnology, sc-22755, 1:1000), IL-6 (Santa Cruz Biotechnology, sc-57315, 1:1000), interleukin-1beta (IL-1β) (Proteintech, 16806-1-AP, 1:1000), tumor necrosis factor alpha (TNF-α) (Santa Cruz Biotechnology, sc-52746, 1:1000), Col1α1 (Proteintech, 25870-1-AP, 1:3000), Col1α2 (Santa Cruz Biotechnology, sc-166865, 1:1000), α-SMA (Proteintech, 14395-1-AP, 1:2000), β-actin (Santa Cruz Biotechnology, sc-517582, 1:1000), or GAPDH (Proteintech, 10494-1-AP, 1:5000). All treatments had at least three independent replicates for the Western blot.
Luciferase Reporter Gene Assay
The ARE response element plasmid ARE-Luc and the NF-κB response element plasmid NF-κB luciferase reporter (V15) were co-transfected into HSC-T6 cells using a Turbofect transfection reagent (Thermo Fisher). After 24 h of culture, the HSC-T6 cells were treated with peptides KKP1, KKP2, and KKPs for 24 h. After carefully washing with PBS, the cells were lysed with RIPA buffer. According to the manufacturer’s instructions of the luciferase activity detection kit, 30 μL of the substrate per sample was added into a 96-well plate, mixed well, and placed in a luminometer to measure the fluorescence intensity. The protein concentration of the cell lysates was examined with a bicinchoninic acid Protein Assay Kit, and the final luciferase activity was normalized by the protein concentration.
Statistical Analysis
All the present control and experimental values are expressed as mean ± standard error of the mean (SEM). Significance analysis was conducted using the GraphPad software Prism 6.0 (GraphPad Software, San Diego, CA, USA). Statistical analyses were performed by one-way ANOVA followed by Turkey’s multiple comparison test. The p value of 0.05 or less was considered as a statistically significant difference.
Results
Peptide Design and Its Bioinformatic Prediction
Previous references proved that interfering with the expression of Keap1 has an obvious protection effect against the carbon tetrachloride (CCl4)-induced hepatic fibrosis,41 which suggests that targeting Keap1 may represent as an alternative strategy for fibrosis treatment. The PROTAC technology developed in recent years has been recognized as a useful tool for targeted protein degradation. Therefore, we designed three peptides shown in Figure 1A. Considering the length and molecular weight of the peptide designed, it may lead to a low efficiency for entering the cytoplasm to accomplish its functions; thus, we fused the ETGE motif (essential for the interactions with Keap1) from Nrf2 with a CPP sequence hPP10 in the C-terminal end. Simultaneously, as shown in Figure 1A, we also designed mutants in the ETGE motif (KKP2 and KKPs) as the control for the rest of the treatments.
Figure 1.
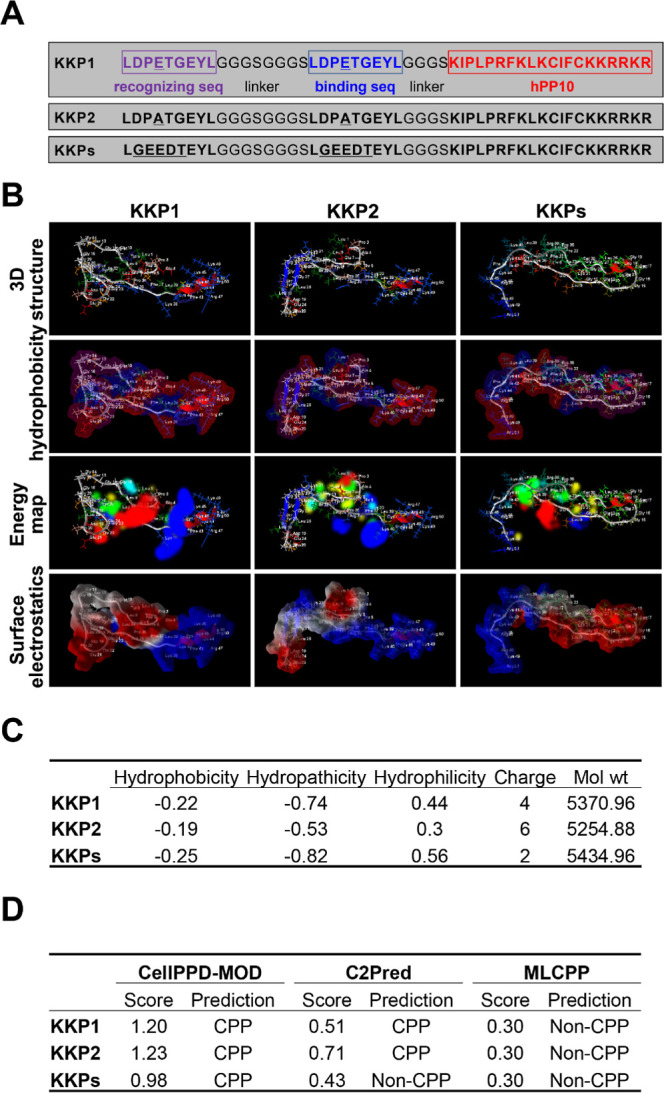
Peptide KKP secondary structure prediction. (A) Sequence of the designed PROTAC degrader KKP, residues in purple and the red text correspond to the recognition site and the binding site, respectively, and residues highlighted in red correspond to CPP-hPP10. (B) RoseTTAFold-predicted three-dimensional structure, hydrophobicity, energy map, and surface electrostatics of the peptide KKP illustrated using a Molegro Molecular Viewer. (C) Key physicochemical properties including the hydrophobicity, hydropathicity, and hydrophilicity of the peptide KKP predicted using a CellPPD-MOD online server. (D) Cell penetration property prediction of the peptide KKP conducted using CellPPD-MOD, C2Pred, and MLCPP.
The Neh2 domain of Nrf2 contains two motifs, ETGE and DLG, which can bind to the Kelch domain on the Kelch-like ECH-related protein-1 (Keap1). The ETGE motif has a higher affinity than that of the DLG motif. Keap1 is an adaptor to the E3 ligase that targets Nrf2 for ubiquitin-dependent degradation.42
Then, several sequence-based structure prediction online servers (TASSR, Raptor X, PEP-FOLD3, and RoseTTAFold) were used to predict the secondary structure, and we also conducted the structure quality validation using ERRAT, PROCHECK, and ProSA online tools, as shown in Figure S1. Among these four predicted structures of KKP1, KKP2, and KKPs, the RoseTTAFold-generated structures have a higher accuracy, examined by ERRAT, PROCHECK, and ProSA (overall and local quality). Thus, the secondary structures of KKP1, KKP2, and KKPs predicted by the RoseTTAFold server were used in the further study. The 3D structure, hydrophobicity, energy map, and surface electrostatics of peptides KKP1, KKP2, and KKPs are shown in Figure 1B, which shows a mild difference of appearance in the overall surface, which may have different interaction abilities with Keap1.
Before we started to perform the experimental validation of the penetration efficiency of KKP1, KKP2, and KKPs, CellPPD-MOD was used to calculate the hydrophobicity, hydropathicity, hydrophilicity, charge, and molecule weight of KKP1, KKP2, and KKPs (Figure 1C); KKP1 has a moderate hydrophobicity, hydropathicity, hydrophilicity, and charge compared with KKP2 and KKPs. KKP1, KKP2, and KKPs as CPPs predicted by CellPPD-MOD and C2Pred (expect KKPs) are shown in Figure 1D; although the penetration property prediction using the MLCPP server was entirely different with CellPPD-MOD and C2Pred servers’ prediction (Figure 1D), this result may be due to the sensitivities of the different prediction servers, and thus, we need further experimental validation.
KKP1 and Keap1 Docking
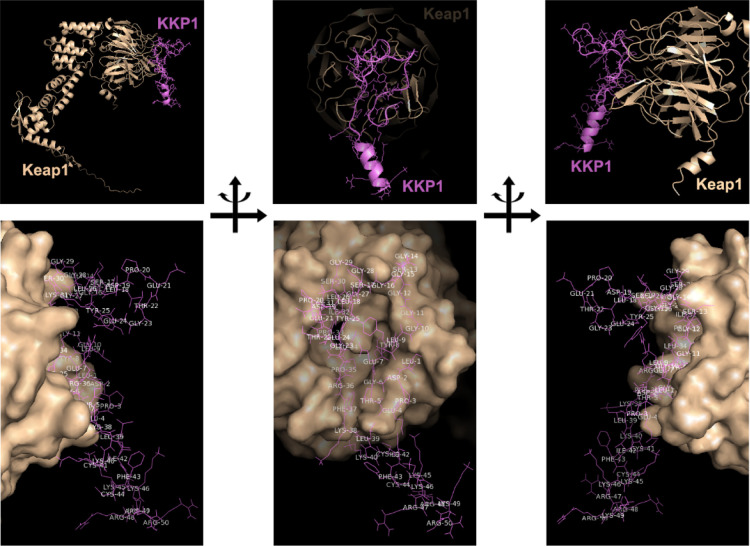
To investigate whether KKP1 associates with Keap1, a molecular docking by using ClusPro 2.0 server was conducted to predict the possible binding patterns between the Kelch domains of Keap1 and KKP1. To date, although the available crystal structures of Keap1 are of human and mouse origins, there is no available rat Keap1 structure described in the Protein Data Bank database. Therefore, AlphaFold was used to predict the rat Keap1 structure as shown in Figure S2A. It suggested that the DC domain possesses a highly certain prediction, which is consistent with the local quality estimation shown in Figure S2B and the aligned position errors’ heatmap in Figure S2C.
Then, we used this rat Keap1 structure to conduct the docking study. The prepared targeted receptor rat Keap1 was uploaded in the ClusPro molecular docking interface. Using the clustering techniques, the ClusPro server finds the near-native conformations and determines which is the best conformation with the lowest energy score. As shown in Figure 2 with different orientations, KKP1 was found to form strong interactions with rat Keap1 with weighted lowest energy scores of −914.0 and −770.6 kcal/mol in the center.
Figure 2.
Molecular docking of KKP1 binding with Keap1 using ClusPro 2.0. The top panel shows a cartoon representation of the obtained complex with different orientations between KKP1 and Keap1 predicted by docker ClusPro 2.0. Degrader KKP1 is shown in purple, while Keap1 is colored in light orange. The bottom panel shows the Keap1 surface binding with KKP1 with different orientations.
High Penetration Efficiency of KKP and Low Toxicity in HSC-T6 Cells
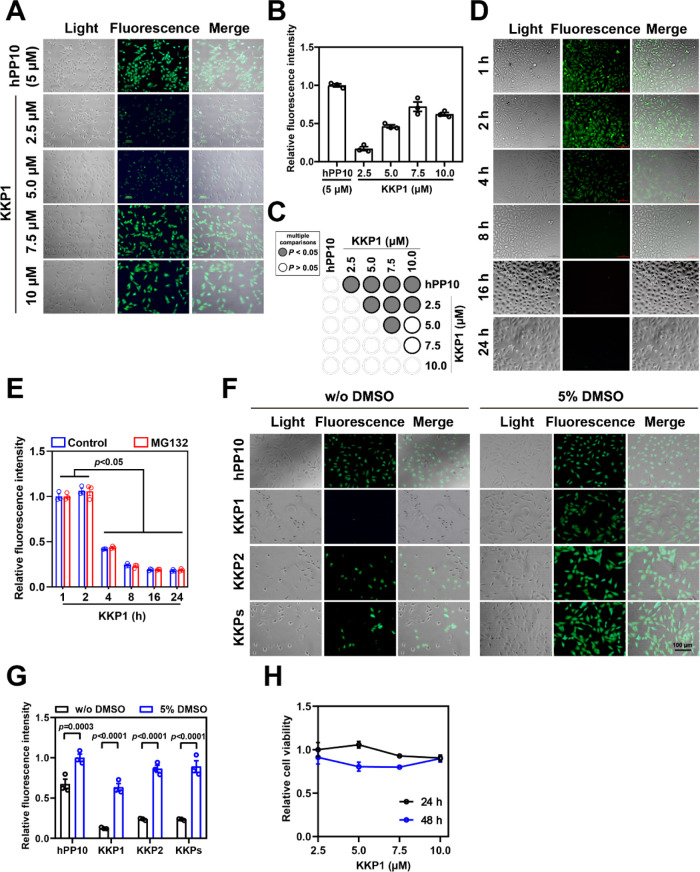
To further validate the penetration property of KKP1, KKP2, and KKPs, we treated HSC-T6 cells with the indicated concentrations of KKP1 and different incubations as well. The results shown in Figure 3A–C suggest that KKP1 has the highest penetration efficiency at 7.5 μM. FITC-labeled KKP1 in the cell has the strongest fluorescence intensity during the initial 1 and 2 h of treatment and gradually decreased after 4, 8, 16, and 24 h (Figures 3D,E and S3). Our previous publications suggest that a penetration enhancer43−45 can significantly enhance the penetration efficiency of the well-known different CPPs including hPP3,23 hPP10,21,46 MT23,47 Scp01-b,48 Dot1l,49 P2,50 and P1.51 We wanted to address whether the penetration efficiency of KKP can further be enhanced. Therefore, we used treatments with or without 5% DMSO in the HSC-T6 cells and then examined the efficiency of KKP (Figure 3F,G). We found that 5% DMSO also can significantly enhance the KKP penetration efficiency. Finally, the cell viability of HSC-T6 was measured after 24 or 48 h of treatment with KKP1. We did not observe significant inhibition of the HSC-T6 cell growth after 24 and 48 h of treatment (Figure 3H).
Figure 3.
Penetration efficiency of peptide KKP. (A) Fluorescence microscopy of the FITC-labeled peptide KKP penetration at the indicated peptide concentration; FITC-labeled hPP10 at 5 μM was used as the control. (B) Fluorescence intensity quantification of FITC-labeled KKP1 treated at the indicated peptide concentration corresponding to the fluorescence microscopy shown in (A). (C) Corresponding p value plot between data pairs presented in (B). ANOVA was used to compare the differences between the control and experimental values. (D) Fluorescence microscopy of FITC-labeled KKP1 at a 7.5 μM incubation with different time points. (E) Fluorescence intensity quantification of FITC-labeled KKP1 (7.5 μM) treated with different time points (with or without the MG132 treatment) corresponding to the fluorescence microscopy shown in (D). The value represents means ± SEM. The groups from KKP1 incubation for 1 and 2 h were compared with the 4, 8, 16, and 24 h groups. (F) Fluorescence microscopy of the FITC-labeled KKP peptide (7.5 μM) in HSC-T6 cells pretreated with or without 5% DMSO. (G) Fluorescence intensity quantification of the FITC-labeled KKP peptide in HSC-T6 cells pretreated with or without 5% DMSO. Comparisons were made between with or without 5% DMSO treatment using ANOVA. (H) The cell viability of HSC-T6 was examined by a CCK-8 test at the indicated concentration for 24 or 48 h.
Keap1 Protein Efficiently Degraded by KKP1 in HSC-T6 Cells
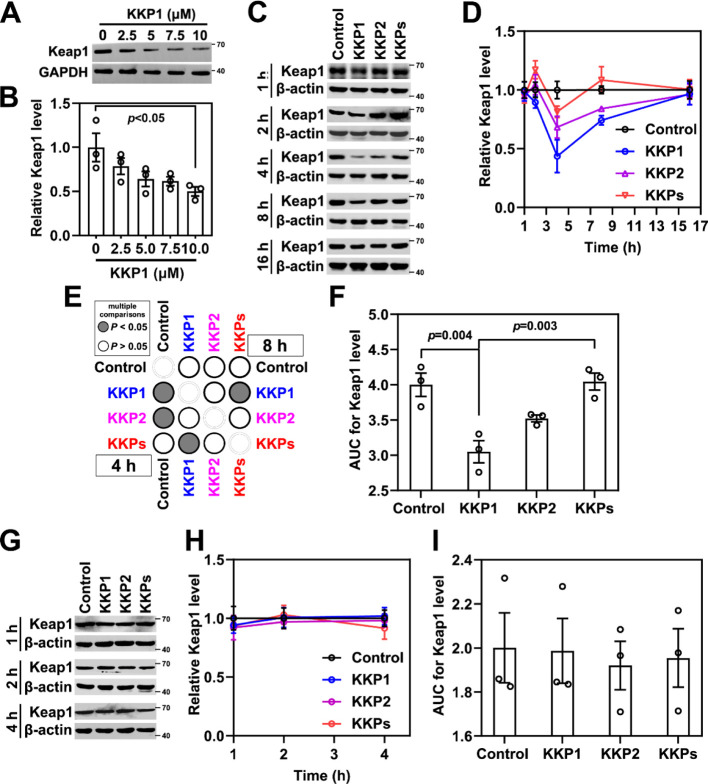
To address whether the designed KKP peptide can induce Keap1 degradation, we assessed the endogenous Keap1 protein level in HSC-T6 cells in the presence of different doses of KKP1 (from 2.5 to 10 μM). A Western blotting evaluation showed that the Keap1 protein gradually decreased upon different KKP1 peptide treatments (Figure 4A,B).
Figure 4.
Peptide KKP effectively degrades the Keap1 protein. (A) Western blot analysis of the Keap1 protein level in HSC-T6 cells treated with different concentrations of KKP1 for 4 h. (B) Densitometric quantification of the Keap1 protein in the blots shown in (A); the data in the graph are means ± SEM of three independent measurements. (C) Western blot analysis of the Keap1 protein level in HSC-T6 cells incubated with 0.75 μM of KKP1, KKP2, and KKPs at 1, 2, 4, 8, and 16 h respectively. (D) Densitometric quantification of the Keap1 protein in the blots shown in (C). The data in the graph are means ± SEM of three independent measurements. (E) Corresponding p-value plot between data pairs presented in (C). ANOVA was used to compare the differences between the control and experimental values in the 4 and 8 h treatment groups. (F) Bar graph showing the AUC analysis of (D). (G) Western blot analysis of the Keap1 protein level in the HSC-T6 cells incubated with the proteasome inhibitor MG132 (10 μM, 4 h) before 7.5 μM of KKP1, KKP2, and KKPs treatment. (H) Densitometric quantification of the Keap1 protein in the blots shown in (E). The data in the graph are means ± SEM of three independent measurements. (I) The bar graph shows the AUC analysis of (F).
Next, we examined the Keap1 levels at different time points (1, 2, 4, 8, 16, and 24 h) after KKP1, KKP2, and KKPs treatment. As shown in Figure 4C–F, the Keap1 protein level was slightly downregulated at the initial 1 and 2 h after the KKP1 treatment. As noted, we found that KKP1 can significantly induce Keap1 protein degradation in 4 h of treatment (Figure 4C–E). The area under the curve (AUC) bar graph suggests that KKP1 significantly induced 25% of Keap1 degradation in total, while KKP2 and KKPs did not (Figure 4F).
To prove that the decreased levels of the Keap1 protein were due to the ubiquitin–proteasome degradation pathway, we treated HSC-T6 cells with MG132 (inhibitor of proteasome activity). As shown in Figure 4G–I, the KKP1-induced Keap1 protein degradation was completely abolished after MG132 addition. These results suggest that KKP1 induces Keap1 degradation via ubiquitination and the proteasome pathway.
KKP1 Treatment Induces Antioxidant Gene Expression via the Nrf2/ARE Signaling Pathway
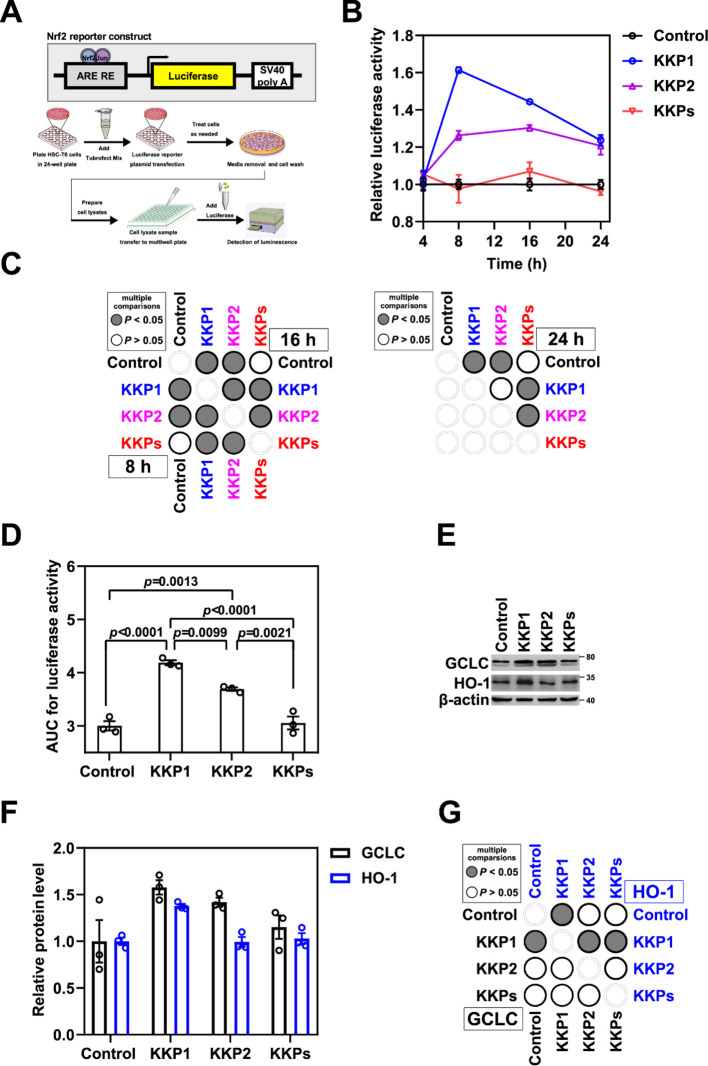
To address whether the Nrf2/ARE signaling pathway is involved after the Keap1 degradation induced by KKP1, we first transiently transfected the ARE luciferase plasmid in the HSC-T6 cells using TurboFect (Figure 5A). After 8 or 16 h of transfection, the luciferase activity in the KKP1 group was significantly increased than that of the control group and the KKP group, although the luciferase activity of the KKP2 group also increased to a certain extent (Figure 5B–D). Thus, this result suggests that KKP1-induced Keap1 degradation may lead to the release of Nrf2, thereby activating the ARE.
Figure 5.
Peptide KKP1 treatment induces the transcriptional activity of the Nrf2/ARE signaling pathway. (A) Schematic representation of the Nrf2 luciferase reporter constructs shown in the top panel, while the bottom panel represents the experimental protocol of this assay. (B) Relative luciferase activity in HSC-T6 cells transfected with the Nrf2/ARE reporter constructs undergoing KKP1, KKP2, and KKPs treatment for 4, 8, 16, and 24 h. (C) Corresponding p-value plot of the data pairs shown in (B). No significance of the 4 h treatment was shown. (D) Bar graph shows the AUC analysis of (B). (E) Western blot analysis of the GCLC and HO-1 protein levels in HSC-T6 cells incubated with KKP1, KKP2, and KKPs for 8 h. (F) Densitometric quantification of the GCLC and HO-1 proteins in the blots shown in (E). Data in the graph are means ± SEM of three independent measurements. (G) Corresponding p-value plot of the data pairs shown in (F).
The subunit of the GCLC enzyme activity is a component of the rate-limiting enzyme that synthesizes the GSH in cells, and its expression is regulated by complex mechanisms of signal transduction mediated by Nrf2 and NF-κB. Ramani et al. reported that the expression of GCLC and the level of GSH in the quiescent HSCs were higher and decreased during the HSC activation process.20 Our group found that the endogeneous and exogeneous expression of GCLC in the HSCs can increase the intracellular level of GSH and inhibit HSC activation.21 Thus, we examined the expression level of Nrf2/ARE downstream of the target gene GCLC and HO-1 (Figure 5E–G). We found that the GCLC and HO-1 levels were significantly increased when compared within the groups. These results suggest that KKP1-induced Keap1 protein degradation can activate the Nrf2 pathway and further up-regulate the downstream target genes including GCLC and HO-1. Additionally, the levels of the Nrf2/ARE downstream genes COX2 and NQO-1 were also examined, although we found that only COX2 was significantly decreased after the KKP1 treatment (Figure S4A–C).
KKP1 Treatment Inhibits the NF-κB Signaling Pathway
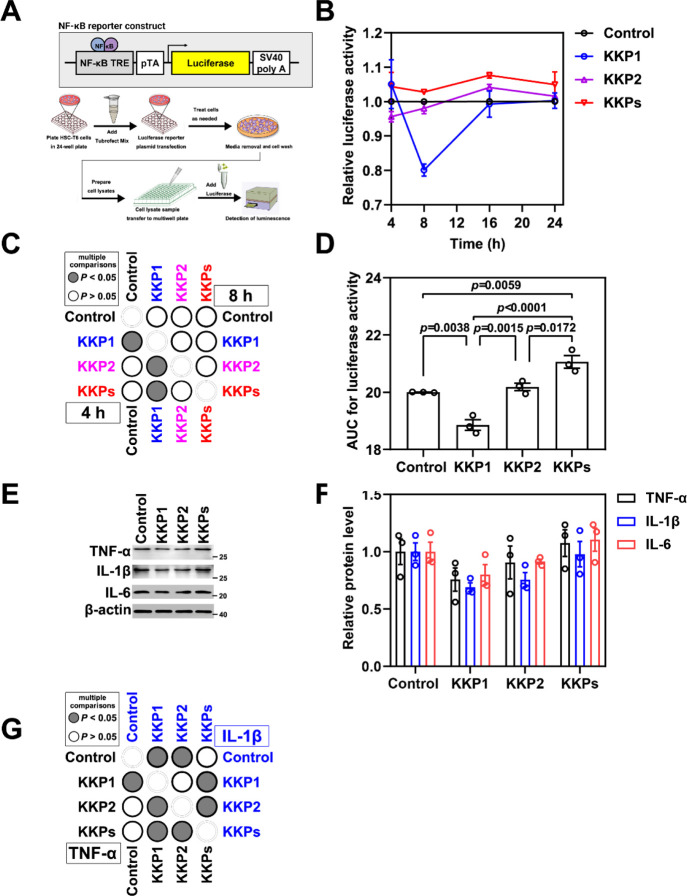
The activated NF-κB pathway in the HSCs is an important signal pathway involved in regulating the immune and inflammatory responses.52−55 The main signal target genes downstream of NF-κB signal transduction include the encoding pro-inflammatory factors (such as TNFα, IL-1β, and IL-6), COX2, and anti-apoptotic proteins.56−59 Thus, following the same strategy as that of the Nrf2/ARE signaling pathway, we transiently transfect the NF-κB luciferase vector (V15) in HSC-T6 cells (Figure 6A). We found that the luciferase activity driven by the NF-κB promoter decreased by 40% in the KKP1 treatment group (Figure 6B–D). Furthermore, we examined the protein level of the inflammatory factors TNF-α, IL-1β, and IL-6, and we found that KKP1 treatment can significantly down-regulate the TNF-α and IL-1β protein level and the observed trend of IL-6 downregulation as well (Figure 6E–G).
Figure 6.
Peptide KKP1 treatment inhibits the transcriptional activity of the NF-κB signaling pathway. (A)Schematic representation of the NF-κB reporter constructs shown in the top panel, while the bottom panel represents the experimental protocol of this assay. (B) Relative luciferase activity in the HSC-T6 cells transfected with the NF-κB reporter constructs undergoing KKP1, KKP2, and KKP treatment for 4 and 8 h. (C)Corresponding p-value plot of the data pairs shown in (B). No significance of 16 and 24 h of treatment was shown. (D) The bar graph shows the AUC analysis of (B). (E) Western blot analysis of TNF-α, IL-1β, and IL-6 protein levels in the HSC-T6 cells incubated with KKP1, KKP2, and KKPs for 8 h. (F) Densitometric quantification of TNF-α, IL-1β, and IL-6 proteins in the blots shown in (E). The data in the graph are means ± SEM of three independent measurements. (G) Corresponding p-value plot of the data pairs shown in (F).
KKP1 Treatment Downregulates the Expression of the Fibrosis Markers
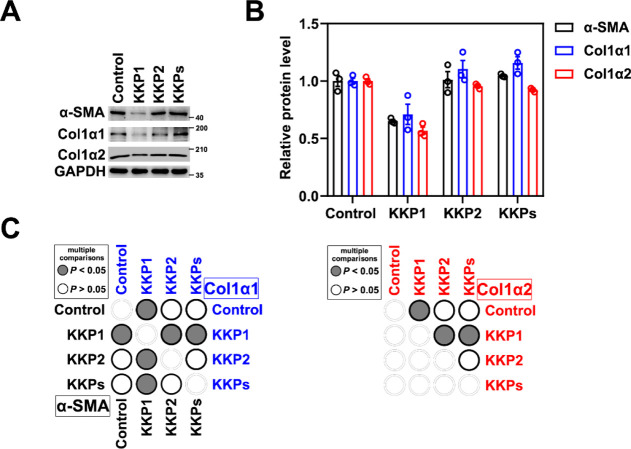
To directly address whether the KKP1-induced Keap1 degradation can reverse the expression of the fibrosis markers, we examined the protein levels of Col1α1, Col1α2, and α-SMA. As shown in Figure 7A–C, , KKP1 can significantly inhibit Col1α1, Col1α2, and α-SMA gene expression, which leads to hepatic stellate cell activation in fibrosis.
Figure 7.
Peptide KKP1 treatment attenuates fibrosis marker gene expression. (A) Western blot analysis of Col1α1, Col1α2, and α-SMA protein levels in the HSC-T6 cells incubated with KKP1, KKP2, and KKPs for 8 h. (B) Densitometric quantification of Col1α1, Col1α2, and α-SMA proteins in the blots shown in (B). The data in the graph are means ± SEM of three independent measurements. (C) Corresponding p-Value plot of the data pairs shown in (B).
Discussion
E3 ubiquitin ligases are the key enzymes within proteostasis, also known as the required component of PROTAC to induce the ubiquitination and subsequent proteasomal degradation of the protein of interest. E3 ligases are also involved in the regulation of several diseases including metabolic diseases, cancer, and neurological dysfunction.60 Therefore, modulating the activities of the E3 ligase can serve as a potential strategy for therapeutic intervention. In 2017, Dr. Ciulli’s group reported an approach named homo-PROTACs, which can effectively trigger a VHL E3 ligase suicide-type chemical knockdown inside the cells,61 and they later report on homobifunctional CRBN degraders that were developed.62 As an extension of the homo-PROTAC approach, hetero-bifunctional PROTACs were designed and provided a proof of principle for dimerizing two different E3 ligases as a novel approach to inducing one ligase to degrade another one.63,64 On the other hand, traditional inhibitors of E3, substrate interaction and homo- and heterobifunctional PROTAC approaches, undoubtedly indicated that the chemical modalities to target the E3 ligases open powerful new avenues to drugging the E3 ubiquitin ligases in various diseases and biological processes in ways that are not possible with inhibitors alone.
PROTAC is now attracting increasing attention because of its great potential in developing bio-therapeutics for undruggable targets, such as transcription factors, scaffold proteins, non-enzymatic proteins, and ubiquitin ligases summarized above. However, small-molecular PROTACs have several limitations, including difficult-to-chemical synthesis, off-target toxicity, poor oral absorption, and weak transmembrane properties. However, a previous study suggests that the peptide-based PROTACs have some disadvantages such as high molecular weight, poor cell penetration, and so forth.65 These shortcomings may hinder the role of peptide-PROTACs as pharmaceutical candidates. Thus, effective therapeutic strategies are still in urgent demand. We successfully developed a variety of delivery vectors of CPPs to deliver biotherapeutics into intracellular in vitro cultured cells and the in vivo mouse model.21−24,43,45,47−49,51,66,67 Thus, with our combined expertise, we attempted to develop a CPP-based PROTAC.
In the current study, a CPP hPP10-based PROTAC has been reported. Here, we found that the fusion peptide KKP1 can efficiently penetrate into the HSC-T6 cells and induce Keap1 degradation within a few hours of treatment and then lead to Nrf2 release and induce antioxidant gene expression via the Nrf2/ARE signaling pathway. Moreover, KKP1 treatment can inhibit the NF-κB inflammatory signaling pathway and further down-regulate the expression of its downstream genes and fibrosis markers. Our data suggested that KKP1 represents a promising therapeutic peptide for anti-fibrosis therapy.
Although we found that KKP1 was effective in inducing Keap1 degradation and further in alleviating the fibrosis effect in the in vitro-cultured HSC-T6 cell model in the initial 4 h, its degrader function gradually became ineffective as the incubation time increasing. We speculated that this may be due to the low half-life of KKP1. Previous studies suggested that residue modification (e.g., PEG)68 and d-amino acid substitution69 may enhance the half-life of the peptide in the serum and thus extend the therapeutic proteins’ stability. These strategies may open a new avenue for us to enhance the pharmacological function of KKP1 in in vitro and in vivo mouse models in later studies, which will provide more pre-clinical evidence to confirm the effectiveness of the KKP1-mediated anti-fibrosis effect.
Conclusions
It is suggested that the fusion peptide KKP1 can induce the degradation of Keap1 to promote Nrf2 signal transduction, inhibit the NF-κB inflammation signal pathway, and thereby inhibit the activation of hepatic stellate cells.
Supporting Information Available
The Supporting Information is available free of charge at https://pubs.acs.org/doi/10.1021/acsptsci.2c00165.
Structure validation; prediction quality assay; fluorescence microscopy; and protein expression level measurement (PDF)
Author Contributions
F.W., Y.Z. , and M.L. contributed equally to this study. F.W. performed the investigation, formal analysis, data curation, and writing—original draft. Y.Z. took care of the investigation and formal analysis. M.L. participated in the investigation, data curation, and formal analysis. L.W. conducted the investigation and procured the resources. A.Z. did the writing—review and editing. C.L. executed the conceptualization, project administration, supervision, and obtained the resources. H.W. carried out the conceptualization, methodology, project administration, supervision, and writing—review and editing. T.W. implemented the conceptualization, project administration, supervision, and funding acquisition.
This work was supported by the National Natural Science Foundation of China (81801068).
The authors declare no competing financial interest.
Notes
The data generated during this work can be available upon request from the corresponding authors H.W. and T.W.
Supplementary Material
References
- Kisseleva T.; Brenner D. A. Role of hepatic stellate cells in fibrogenesis and the reversal of fibrosis. J. Gastroenterol. Hepatol. 2007, 22, S73–S78. 10.1111/j.1440-1746.2006.04658.x. [DOI] [PubMed] [Google Scholar]
- Cohen-Naftaly M.; Friedman S. L. Current status of novel antifibrotic therapies in patients with chro1nic liver disease. Ther. Adv. Gastroenterol. 2011, 4, 391–417. 10.1177/1756283X11413002. [DOI] [PMC free article] [PubMed] [Google Scholar]
- Kang K. H.; Qian Z. J.; Ryu B.; Karadeniz F.; Kim D.; Kim S. K. Hepatic Fibrosis Inhibitory Effect of Peptides Isolated from Navicula incerta on TGF-β Induced Activation of LX-2 Human Hepatic Stellate Cells. Prev. Nutr. Food Sci. 2013, 18, 124–132. 10.3746/pnf.2013.18.2.124. [DOI] [PMC free article] [PubMed] [Google Scholar]
- Tacke F.; Trautwein C. Mechanisms of liver fibrosis resolution. J. Hepatol. 2015, 63, 1038–1039. 10.1016/j.jhep.2015.03.039. [DOI] [PubMed] [Google Scholar]
- Chrostek L.; Panasiuk A. Liver fibrosis markers in alcoholic liver disease. World J. Gastroenterol. 2014, 20, 8018–8023. 10.3748/wjg.v20.i25.8018. [DOI] [PMC free article] [PubMed] [Google Scholar]
- Bellezza I.; Giambanco I.; Minelli A.; Donato R. Nrf2-Keap1 signaling in oxidative and reductive stress. Biochim. Biophys. Acta Mol. Cell Res. 2018, 1865, 721–733. 10.1016/j.bbamcr.2018.02.010. [DOI] [PubMed] [Google Scholar]
- Yin C.; Evason K. J.; Asahina K.; Stainier D. Y. Hepatic stellate cells in liver development, regeneration, and cancer. J. Clin. Invest. 2013, 123, 1902–1910. 10.1172/JCI66369. [DOI] [PMC free article] [PubMed] [Google Scholar]
- Zeng X. Y.; Zhang Y. Q.; He X. M.; Wan L. Y.; Wang H.; Ni Y. R.; Wang J.; Wu J. F.; Liu C. B. Suppression of hepatic stellate cell activation through downregulation of gremlin1 expression by the miR-23b/27b cluster. Oncotarget 2016, 7, 86198–86210. 10.18632/oncotarget.13365. [DOI] [PMC free article] [PubMed] [Google Scholar]
- Alegre F.; Pelegrin P.; Feldstein A. E. Inflammasomes in Liver Fibrosis. Semin. Liver Dis. 2017, 37, 119–127. 10.1055/s-0037-1601350. [DOI] [PubMed] [Google Scholar]
- Tsuchida T.; Friedman S. L. Mechanisms of hepatic stellate cell activation. Nat. Rev. Gastroenterol. Hepatol. 2017, 14, 397–411. 10.1038/nrgastro.2017.38. [DOI] [PubMed] [Google Scholar]
- Ahmed S. M.; Luo L.; Namani A.; Wang X. J.; Tang X. Nrf2 signaling pathway: Pivotal roles in inflammation. Biochim. Biophys. Acta, Mol. Basis Dis. 2017, 1863, 585–597. 10.1016/j.bbadis.2016.11.005. [DOI] [PubMed] [Google Scholar]
- Magesh S.; Chen Y.; Hu L. Small molecule modulators of Keap1-Nrf2-ARE pathway as potential preventive and therapeutic agents. Med. Res. Rev. 2012, 32, 687–726. 10.1002/med.21257. [DOI] [PMC free article] [PubMed] [Google Scholar]
- Bondeson D. P.; Mares A.; Smith I. E.; Ko E.; Campos S.; Miah A. H.; Mulholland K. E.; Routly N.; Buckley D. L.; Gustafson J. L.; et al. Catalytic in vivo protein knockdown by small-molecule PROTACs. Nat. Chem. Biol. 2015, 11, 611–617. 10.1038/nchembio.1858. [DOI] [PMC free article] [PubMed] [Google Scholar]
- Bondeson D. P.; Smith B. E.; Burslem G. M.; Buhimschi A. D.; Hines J.; Jaime-Figueroa S.; Wang J.; Hamman B. D.; Ishchenko A.; Crews C. M. Lessons in PROTAC Design from Selective Degradation with a Promiscuous Warhead. Cell Chem. Biol. 2018, 25, 78–87. 10.1016/j.chembiol.2017.09.010. [DOI] [PMC free article] [PubMed] [Google Scholar]
- Carmony K. C.; Kim K. B. PROTAC-induced proteolytic targeting. Methods Mol. Biol. 2012, 832, 627–638. 10.1007/978-1-61779-474-2_44. [DOI] [PMC free article] [PubMed] [Google Scholar]
- Buckley D. L.; Van Molle I.; Gareiss P. C.; Tae H. S.; Michel J.; Noblin D. J.; Jorgensen W. L.; Ciulli A.; Crews C. M. Targeting the von Hippel-Lindau E3 Ubiquitin Ligase Using Small Molecules To Disrupt the VHL/HIF-1α Interaction. J. Am. Chem. Soc. 2012, 134, 4465–4468. 10.1021/ja209924v. [DOI] [PMC free article] [PubMed] [Google Scholar]
- Lu J.; Qian Y.; Altieri M.; Dong H.; Wang J.; Raina K.; Hines J.; Winkler J. D.; Crew A. P.; Coleman K.; et al. Hijacking the E3 Ubiquitin Ligase Cereblon to Efficiently Target BRD4. Chem. Biol. 2015, 22, 755–763. 10.1016/j.chembiol.2015.05.009. [DOI] [PMC free article] [PubMed] [Google Scholar]
- Roeten M. S. F.; Cloos J.; Jansen G. Positioning of proteasome inhibitors in therapy of solid malignancies. Cancer Chemother. Pharmacol 2018, 81, 227–243. 10.1007/s00280-017-3489-0. [DOI] [PMC free article] [PubMed] [Google Scholar]
- Winter G. E.; Buckley D. L.; Paulk J.; Roberts J. M.; Souza A.; Dhe-Paganon S.; Bradner J. E. Phthalimide conjugation as a strategy for in vivo target protein degradation. Science 2015, 348, 1376–1381. 10.1126/science.aab1433. [DOI] [PMC free article] [PubMed] [Google Scholar]
- Ramani K.; Tomasi M. L.; Yang H.; Ko K.; Lu S. C. Mechanism and significance of changes in glutamate-cysteine ligase expression during hepatic fibrogenesis. J. Biol. Chem. 2012, 287, 36341–36355. 10.1074/jbc.M112.370775. [DOI] [PMC free article] [PubMed] [Google Scholar]
- Wang H.; Ma J. L.; Yang Y. G.; Song Y.; Wu J.; Qin Y. Y.; Zhao X. L.; Wang J.; Zou L. L.; Wu J. F.; et al. Efficient therapeutic delivery by a novel cell-permeant peptide derived from KDM4A protein for antitumor and antifibrosis. Oncotarget 2016, 7, 49075–49090. 10.18632/oncotarget.8682. [DOI] [PMC free article] [PubMed] [Google Scholar]
- Geng J.; Xia X.; Teng L.; Wang L.; Chen L.; Guo X.; Belingon B.; Li J.; Feng X.; Li X.; et al. Emerging landscape of cell-penetrating peptide-mediated nucleic acid delivery and their utility in imaging, gene-editing, and RNA-sequencing. J. Controlled Release 2022, 341, 166–183. 10.1016/j.jconrel.2021.11.032. [DOI] [PubMed] [Google Scholar]
- Wang H.; Ma J.; Yang Y.; Zeng F.; Liu C. Highly Efficient Delivery of Functional Cargoes by a Novel Cell-Penetrating Peptide Derived from SP140-Like Protein. Bioconjug Chem 2016, 27, 1373–1381. 10.1021/acs.bioconjchem.6b00161. [DOI] [PubMed] [Google Scholar]
- Wu J.; Li J.; Wang H.; Liu C. B. Mitochondrial-targeted penetrating peptide delivery for cancer therapy. Expet Opin. Drug Deliv. 2018, 15, 951–964. 10.1080/17425247.2018.1517750. [DOI] [PubMed] [Google Scholar]
- Yang J.; Zhang Y. I-TASSER server: new development for protein structure and function predictions. Nucleic Acids Res. 2015, 43, W174–W181. 10.1093/nar/gkv342. [DOI] [PMC free article] [PubMed] [Google Scholar]
- Yang J.; Yan R.; Roy A.; Xu D.; Poisson J.; Zhang Y. The I-TASSER Suite: protein structure and function prediction. Nat. Methods 2015, 12, 7–8. 10.1038/nmeth.3213. [DOI] [PMC free article] [PubMed] [Google Scholar]
- Wang S.; Sun S.; Li Z.; Zhang R.; Xu J. Accurate De Novo Prediction of Protein Contact Map by Ultra-Deep Learning Model. PLoS Comput. Biol. 2017, 13, e1005324 10.1371/journal.pcbi.1005324. [DOI] [PMC free article] [PubMed] [Google Scholar]
- Xu J.; Wang S. Analysis of distance-based protein structure prediction by deep learning in CASP13. Proteins 2019, 87, 1069–1081. 10.1002/prot.25810. [DOI] [PubMed] [Google Scholar]
- Kaur H.; Garg A.; Raghava G. P. S. PEPstr: a de novo method for tertiary structure prediction of small bioactive peptides. Protein Pept. Lett. 2007, 14, 626–631. 10.2174/092986607781483859. [DOI] [PubMed] [Google Scholar]
- Beaufays J.; Lins L.; Thomas A.; Brasseur R. In silico predictions of 3D structures of linear and cyclic peptides with natural and non-proteinogenic residues. J. Pept. Sci. 2012, 18, 17–24. 10.1002/psc.1410. [DOI] [PubMed] [Google Scholar]
- Baek M.; DiMaio F.; Anishchenko I.; Dauparas J.; Ovchinnikov S.; Lee G. R.; Wang J.; Cong Q.; Kinch L. N.; Schaeffer R. D.; et al. Accurate prediction of protein structures and interactions using a three-track neural network. Science 2021, 373, 871–876. 10.1126/science.abj8754. [DOI] [PMC free article] [PubMed] [Google Scholar]
- Humphreys I. R.; Pei J.; Baek M.; Krishnakumar A.; Anishchenko I.; Ovchinnikov S.; Zhang J.; Ness T. J.; Banjade S.; Bagde S. R.; et al. Computed structures of core eukaryotic protein complexes. Science 2021, 374, eabm4805 10.1126/science.abm4805. [DOI] [PMC free article] [PubMed] [Google Scholar]
- Laskowski R. A.; MacArthur M. W.; Moss D. S.; Thornton J. M. PROCHECK: a program to check the stereochemical quality of protein structures. J. Appl. Crystallogr. 1993, 26, 283–291. 10.1107/S0021889892009944. [DOI] [Google Scholar]
- Colovos C.; Yeates T. O. Verification of protein structures: patterns of nonbonded atomic interactions. Protein Sci. 1993, 2, 1511–1519. 10.1002/pro.5560020916. [DOI] [PMC free article] [PubMed] [Google Scholar]
- Wiederstein M.; Sippl M. J. ProSA-web: interactive web service for the recognition of errors in three-dimensional structures of proteins. Nucleic Acids Res. 2007, 35, W407–W410. 10.1093/nar/gkm290. [DOI] [PMC free article] [PubMed] [Google Scholar]
- Kumar V.; Agrawal P.; Kumar R.; Bhalla S.; Usmani S. S.; Varshney G. C.; Raghava G. P. S. Prediction of Cell-Penetrating Potential of Modified Peptides Containing Natural and Chemically Modified Residues. Front. Microbiol. 2018, 9, 725. 10.3389/fmicb.2018.00725. [DOI] [PMC free article] [PubMed] [Google Scholar]
- Tang H.; Su Z. D.; Wei H. H.; Chen W.; Lin H. Prediction of cell-penetrating peptides with feature selection techniques. Biochem. Biophys. Res. Commun. 2016, 477, 150–154. 10.1016/j.bbrc.2016.06.035. [DOI] [PubMed] [Google Scholar]
- Manavalan B.; Subramaniyam S.; Shin T. H.; Kim M. O.; Lee G. Machine-Learning-Based Prediction of Cell-Penetrating Peptides and Their Uptake Efficiency with Improved Accuracy. J. Proteome Res. 2018, 17, 2715–2726. 10.1021/acs.jproteome.8b00148. [DOI] [PubMed] [Google Scholar]
- Tunyasuvunakool K.; Adler J.; Wu Z.; Green T.; Zielinski M.; Žídek A.; Bridgland A.; Cowie A.; Meyer C.; Laydon A.; et al. Highly accurate protein structure prediction for the human proteome. Nature 2021, 596, 590–596. 10.1038/s41586-021-03828-1. [DOI] [PMC free article] [PubMed] [Google Scholar]
- Kozakov D.; Hall D. R.; Xia B.; Porter K. A.; Padhorny D.; Yueh C.; Beglov D.; Vajda S. The ClusPro web server for protein-protein docking. Nat. Protoc. 2017, 12, 255–278. 10.1038/nprot.2016.169. [DOI] [PMC free article] [PubMed] [Google Scholar]
- Liu J.; Li W.; Limbu M. H.; Li Y.; Wang Z.; Cheng Z.; Zhang X.; Chen P. Effects of Simultaneous Downregulation of PHD1 and Keap1 on Prevention and Reversal of Liver Fibrosis in Mice. Front. Pharmacol. 2018, 9, 555. 10.3389/fphar.2018.00555. [DOI] [PMC free article] [PubMed] [Google Scholar]
- Lu M. C.; Ji J. A.; Jiang Z. Y.; You Q. D. The Keap1-Nrf2-ARE Pathway As a Potential Preventive and Therapeutic Target: An Update. Med. Res. Rev. 2016, 36, 924–963. 10.1002/med.21396. [DOI] [PubMed] [Google Scholar]
- Ma J. L.; Wang H.; Wang Y. L.; Luo Y. H.; Liu C. B. Enhanced Peptide delivery into cells by using the synergistic effects of a cell-penetrating Peptide and a chemical drug to alter cell permeability. Mol. Pharm. 2015, 12, 2040–2048. 10.1021/mp500838r. [DOI] [PubMed] [Google Scholar]
- Wang H.; Zhong C. Y.; Wu J. F.; Huang Y. B.; Liu C. B. Enhancement of TAT cell membrane penetration efficiency by dimethyl sulphoxide. J. Controlled Release 2010, 143, 64–70. 10.1016/j.jconrel.2009.12.003. [DOI] [PubMed] [Google Scholar]
- Wang H.; Zhang M.; Zeng F.; Liu C. Hyperosmotic treatment synergistically boost efficiency of cell-permeable peptides. Oncotarget 2016, 7, 74648–74657. 10.18632/oncotarget.9448. [DOI] [PMC free article] [PubMed] [Google Scholar]
- Ding Y.; Zhao X.; Geng J.; Guo X.; Ma J.; Wang H.; Liu C. Intracellular delivery of nucleic acid by cell-permeable hPP10 peptide. J. Cell. Physiol. 2019, 234, 11670–11678. 10.1002/jcp.27826. [DOI] [PubMed] [Google Scholar]
- Zhou N.; Wu J.; Qin Y. Y.; Zhao X. L.; Ding Y.; Sun L. S.; He T.; Huang X. W.; Liu C. B.; Wang H. Novel peptide MT23 for potent penetrating and selective targeting in mouse melanoma cancer cells. Eur. J. Pharm. Biopharm. 2017, 120, 80–88. 10.1016/j.ejpb.2017.08.011. [DOI] [PubMed] [Google Scholar]
- Zhang M.; Zhao X.; Geng J.; Liu H.; Zeng F.; Qin Y.; Li J.; Liu C.; Wang H. Efficient penetration of Scp01-b and its DNA transfer abilities into cells. J. Cell. Physiol. 2019, 234, 6539–6547. 10.1002/jcp.27392. [DOI] [PubMed] [Google Scholar]
- Geng J.; Guo X.; Wang L.; Nguyen R. Q.; Wang F.; Liu C.; Wang H. Intracellular Delivery of DNA and Protein by a Novel Cell-Permeable Peptide Derived from DOT1L. Biomolecules 2020, 10, 217. 10.3390/biom10020217. [DOI] [PMC free article] [PubMed] [Google Scholar]
- Guo X.; Chen L.; Wang L.; Geng J.; Wang T.; Hu J.; Li J.; Liu C.; Wang H. In silico identification and experimental validation of cellular uptake and intracellular labeling by a new cell penetrating peptide derived from CDN1. Drug Deliv. 2021, 28, 1722–1736. 10.1080/10717544.2021.1963352. [DOI] [PMC free article] [PubMed] [Google Scholar]
- Chen L.; Guo X.; Wang L.; Geng J.; Wu J.; Hu B.; Wang T.; Li J.; Liu C.; Wang H. In silico identification and experimental validation of cellular uptake by a new cell penetrating peptide P1 derived from MARCKS. Drug Deliv. 2021, 28, 1637–1648. 10.1080/10717544.2021.1960922. [DOI] [PMC free article] [PubMed] [Google Scholar]
- Taniguchi K.; Karin M. NF-κB, inflammation, immunity and cancer: coming of age. Nat. Rev. Immunol. 2018, 18, 309–324. 10.1038/nri.2017.142. [DOI] [PubMed] [Google Scholar]
- Anuja G. I.; Shine V. J.; Latha P. G.; Suja S. R. Protective effect of ethyl acetate fraction of Drynaria quercifolia against CCl4 induced rat liver fibrosis via Nrf2/ARE and NFkappaB signalling pathway. J. Ethnopharmacol. 2018, 216, 79–88. 10.1016/j.jep.2017.11.015. [DOI] [PubMed] [Google Scholar]
- Li Z.; Zhang Q.; Zhang Q.; Xu M.; Qu Y.; Cai X.; Lu L. CXCL6 promotes human hepatocyte proliferation through the CXCR1-NFkappaB pathway and inhibits collagen I secretion by hepatic stellate cells. Biochem. Cell Biol. 2016, 94, 229–235. 10.1139/bcb-2015-0136. [DOI] [PubMed] [Google Scholar]
- Mitchell S.; Vargas J.; Hoffmann A. Signaling via the NFkappaB system. Wiley Interdiscip. Rev.: Syst. Biol. Med. 2016, 8, 227–241. 10.1002/wsbm.1331. [DOI] [PMC free article] [PubMed] [Google Scholar]
- Novitskiy G.; Potter J. J.; Rennie-Tankersley L.; Mezey E. Identification of a novel NF-kappaB-binding site with regulation of the murine alpha2(I) collagen promoter. J. Biol. Chem. 2004, 279, 15639–15644. 10.1074/jbc.M311499200. [DOI] [PubMed] [Google Scholar]
- Szuster-Ciesielska A.; Mizerska-Dudka M.; Daniluk J.; Kandefer-Szerszeń M. Butein inhibits ethanol-induced activation of liver stellate cells through TGF-beta, NFkappaB, p38, and JNK signaling pathways and inhibition of oxidative stress. J. Gastroenterol. 2013, 48, 222–237. 10.1007/s00535-012-0619-7. [DOI] [PMC free article] [PubMed] [Google Scholar]
- Hu Z.; You P.; Xiong S.; Gao J.; Tang Y.; Ye X.; Xia Y.; Zhang D.; Liu Y. Carapax Trionycis extracts inhibit fibrogenesis of activated hepatic stellate cells via TGF-beta1/Smad and NFkappaB signaling. Biomed. Pharmacother. 2017, 95, 11–17. 10.1016/j.biopha.2017.08.011. [DOI] [PubMed] [Google Scholar]
- Chen L.; Wu J.; Hu B.; Liu C.; Wang H. The Role of Cell Division Autoantigen 1 (CDA1) in Renal Fibrosis of Diabetic Nephropathy. BioMed Res. Int. 2021, 2021, 6651075. 10.1155/2021/6651075. [DOI] [PMC free article] [PubMed] [Google Scholar]
- Saravanan K. M.; Kannan M.; Meera P.; Bharathkumar N.; Anand T. E3 ligases: a potential multi-drug target for different types of cancers and neurological disorders. Future Med. Chem. 2022, 14, 187–201. 10.4155/fmc-2021-0157. [DOI] [PubMed] [Google Scholar]
- Maniaci C.; Hughes S. J.; Testa A.; Chen W.; Lamont D. J.; Rocha S.; Alessi D. R.; Romeo R.; Ciulli A. Homo-PROTACs: bivalent small-molecule dimerizers of the VHL E3 ubiquitin ligase to induce self-degradation. Nat. Commun. 2017, 8, 830. 10.1038/s41467-017-00954-1. [DOI] [PMC free article] [PubMed] [Google Scholar]
- Steinebach C.; Lindner S.; Udeshi N. D.; Mani D. C.; Kehm H.; Köpff S.; Carr S. A.; Gütschow M.; Krönke J. Homo-PROTACs for the Chemical Knockdown of Cereblon. ACS Chem. Biol. 2018, 13, 2771–2782. 10.1021/acschembio.8b00693. [DOI] [PubMed] [Google Scholar]
- Girardini M.; Maniaci C.; Hughes S. J.; Testa A.; Ciulli A. Cereblon versus VHL: Hijacking E3 ligases against each other using PROTACs. Bioorg. Med. Chem. 2019, 27, 2466–2479. 10.1016/j.bmc.2019.02.048. [DOI] [PMC free article] [PubMed] [Google Scholar]
- Steinebach C.; Kehm H.; Lindner S.; Vu L. P.; Köpff S.; López Mármol Á.; Weiler C.; Wagner K. G.; Reichenzeller M.; Krönke J.; et al. PROTAC-mediated crosstalk between E3 ligases. Chem. Commun. 2019, 55, 1821–1824. 10.1039/c8cc09541h. [DOI] [PubMed] [Google Scholar]
- An S.; Fu L. Small-molecule PROTACs: An emerging and promising approach for the development of targeted therapy drugs. EBioMedicine 2018, 36, 553–562. 10.1016/j.ebiom.2018.09.005. [DOI] [PMC free article] [PubMed] [Google Scholar]
- Wang L.; Geng J.; Chen L.; Guo X.; Wang T.; Fang Y.; Belingon B.; Wu J.; Li M.; Zhan Y.; et al. Improved transfer efficiency of supercharged 36 + GFP protein mediate nucleic acid delivery. Drug Deliv. 2022, 29, 386–398. 10.1080/10717544.2022.2030430. [DOI] [PMC free article] [PubMed] [Google Scholar]
- Liu H.; Zeng F.; Zhang M.; Huang F.; Wang J.; Guo J.; Liu C.; Wang H. Emerging landscape of cell penetrating peptide in reprogramming and gene editing. J. Controlled Release 2016, 226, 124–137. 10.1016/j.jconrel.2016.02.002. [DOI] [PubMed] [Google Scholar]
- Zaman R.; Islam R. A.; Ibnat N.; Othman I.; Zaini A.; Lee C. Y.; Chowdhury E. H. Current strategies in extending half-lives of therapeutic proteins. J. Controlled Release 2019, 301, 176–189. 10.1016/j.jconrel.2019.02.016. [DOI] [PubMed] [Google Scholar]
- Martin E. B.; Williams A.; Richey T.; Wooliver C.; Stuckey A.; Foster J. S.; Kennel S. J.; Wall J. S. Evaluation of the effect of D-amino acid incorporation into amyloid-reactive peptides. J. Transl. Med. 2017, 15, 247. 10.1186/s12967-017-1351-0. [DOI] [PMC free article] [PubMed] [Google Scholar]
Associated Data
This section collects any data citations, data availability statements, or supplementary materials included in this article.


