Abstract
Fracture healing is a complex biological process. Severe bone loss and ischemia from traumatic fractures lead to inflammation and accumulation of damaging reactive oxygen species (ROS). Fixative devices that not only provide mechanical support but also stimulate antioxidants such as superoxide dismutase (SOD1) and influence signaling pathways for extracellular matrix (ECM) mineralization, are critical for normal healing of such fractures. In this study, we report a novel biomaterial, silicon oxynitrophosphide (SiONP) that provides sustained release of ionic silicon (Si+4) and phosphorous (P) over few weeks under physiological conditions. Anti-oxidant role of Si+4 and augmented ECM mineralization by P ions lead to enhanced osteogenesis coupled with quick revascularization for rapid bone regeneration. Plasma enhanced chemical vapor deposition (PECVD) provided a conformal, well adherent and highly reproducible surface chemistry overlaid onto nanofabricated bioinspired surfaces. The Nitrogen to P and O content ratio was observed to change the dissolution rate and the release kinetics of the overlaid film. The SiONP films with optimal release kinetics promoted anti-oxidant expression via enhanced SOD1, which downstream upregulated other osteogenic markers with MC3T3-E1 cells. These surfaces also promoted angiogenesis evident by formation of thicker tubules by Human umbilical vein endothelial cells (HUVEC). In-vivo evaluation using a rat critical-sized calvarial defect model showed rapid bone-regeneration for these nanofabricated biomaterials as compared to control groups, and opens new horizon for future clinical trials of new antioxidant materials on biomedical devices that can reduce healing time, lower medical care cost, and increase the quality of newly formed bone in critical size defects.
Keywords: Superoxide dismutase, osteoblast, antioxidant, nanofabrication, angiogenesis
1. Introduction
Traumatic fractures, age-related fragility or disorders have dramatically increased the use of permanent and semi-permanent osseous implants in recent years. Various approaches have been deployed to enhance the bone regeneration via tissue engineering or implant surface modifications. Despite today’s advancements and technology, 5–10% of all fractures are either nonunion or delayed.1 Therefore, the need for a material that provides favorable host-tissue interactions and adheres well to the bone in vivo has become critical. Bioglass™, generally composed of SiO2, Na2O, CaO, and P2O5 in various proportions, is well-known to form a layer of apatite on the glass-tissue interface2 and thus avoid problems associated with fibrous encapsulation that had previously been noted around less biocompatible implant surfaces.3 Similarly, hydrogels with good mechanical properties have shown great potential for sub-chondral bone-cartilage interfacial regeneration.4–5 Other studies of 3D nano-fibrous graphene scaffolds also demonstrated advantageous scaffold properties for bone tissue engineering.6 However, these types of materials are rarely used in load-bearing osseous applications where Ti metal implants are required for mechanical support.7 Calcium phosphate based coatings onto Ti implants have shown great potential to enhance bone regeneration capability of the implant surface, however, these coatings do not form a miscible interface with Ti/TiO2 due to the covalent structure of calcium phosphate and ionic structure of Ti/TiO2.8–9 More recent work on bioactive glasses has looked at modifying their chemical structure with MgO and K2O to create a chemistry that can be coated onto Ti surface and form a bond at both the metal-glass and glass-bone interfaces and therefore be used to coat the Ti implants that are used in load-bearing applications.10–13 While these glasses show promising results in terms of TiO2-glass bonding, Mg2+ has recently been shown to delay mineralization and partially down regulate osteoblast markers in combination with Si4+ and Ca2+.14 The potential to alter the silica network by incorporating additional elements leads to ionic treatment strategy from an elemental perspective.
From an elemental standpoint, interface reactions based on the release and exchange of the primary cations in bioactive glasses—Si, Ca, P, and Na ions—are known to promote favorable cellular responses and rapid osseointegration.14–16 Si4+ and Ca2+ in particular have been shown to enhance osteoblast markers in vitro.17 A reasonable approach to creating a bioactive glassy Ti-coating for improved osseointegration is to first develop a biomaterial that bonds well to the TiO2 surface. This improved interface can be achieved via plasma enhanced chemical vapor deposition (PECVD) coating process as explained in our previous works.9, 18 PECVD is commonly used to deposit silica layers onto metal interconnects in the semiconductor industry while simultaneously attempting to incorporate one or more of the primary cationic species of interest into the coating—namely N and P can make the surface bioactive. PECVD provides a very conformal, well adherent and uniform layer on the surface as shown in our previous work.9 Therefore, in this study PECVD-based amorphous silicon oxynitrophosphide (SiONP) thin films were used as an overlay onto test samples and N/P/O ratio was tailored for optimal release kinetics for osseous applications. Ionic dissolution products from inorganic materials have gained key interest from researchers to better understand the cell-surface interactions in-vitro and in-vivo.
In our previous study, we have shown that ionic silicon Si+4 plays an antioxidant role in such fractures and upregulates SOD1, which induced downstream expression of the osteoblast differentiation markers including Runx2, osteocalcin (OCN), and collagen type 1 required for new bone formation.18–19 On the other hand, previous studies20–22 show that Si4+ directly links to the enhancement of collagen type 1 expression and mineralized tissue synthesis. It also plays a role in enhancing the mechanical properties of bone femurs in mice,23 suggesting that Si4+ may play an essential role in influencing matrix physical properties. Similarly, ionic P, being the major component of biological apatite, plays a key role in ECM mineralization. Ionic P induces calcium deposition leading to early biomineralization via upregulation of dentin matrix protein 1 (Dmp1), which is an extracellular matrix protein involved in phosphate metabolism and biomineralization.24–25 Recent studies also show that P ions are regarded as pro-angiogenic elements that stimulate pro-angiogenic genes such as forkhead box protein C2 (FOXC2), osteopontin, and Vegfα, among others, leading to enhanced angiogenesis and neovascularization.26–27 Another study reveals the role of P as a mitogen resulting in improved proliferation and matrix regulation.28 These studies demonstrate the significance of silicon and phosphorous ions for fracture healing and bone regeneration applications.
Bio-inspired surface structures at micro/nanometer scales significantly enhance the cell-surface interactions such as cell adhesion, growth, migration and differentiation.29–32 We have previously shown as much as 16 times higher cell growth and attachment on a structured surface when compared to a flat surface.31 The microscale features that have gained the maximum attention are regular ridge and groove pattern (micrograting) topographies due to its simple design.29 Surface structures separated by a distance within the reach of filopodia extension are readily perceived by cells and they make contact between adjacent topographic islands and create new adhesions.33 Moderately irregular surfaces (1–2 μm) exhibit stronger bone responses than the flatter or rougher surfaces.32 Recently marketed oral implants are moderately rough and allow bone ingrowth into minor surface irregularities, promoting osseointegration.32 Therefore, in this study, we also integrated micrograting patterns to make the surface moderately rough (1–2 μm) for enhanced cell-surface interactions.
Here we hypothesize that SiONP surfaces provide sustained ionic Si and P release in physiological conditions. Ionic Si enhances antioxidant activity while elevated levels of phosphate upregulate several genes during osteoblast differentiation and cause rapid mineral deposition and vascular formation,34–35 resulting in faster regeneration of vascularized bone. Thus, SiONP-modified devices will promote antioxidant expression, reduce ROS, induce mineral deposition and stimulate bone and vascular tissue formation. To test this hypothesis, PECVD-based amorphous silicon oxynitrophosphide (SiONP) films were overlaid onto patterned surfaces and test samples were studied for their osteogenic and angiogenic behavior. Film degradation rate, in-vitro gene expression and in-vivo bone regeneration capabilities for varying N to P ratio were studied for different film chemistries.
2. Materials and Methods
All the chemicals used in this study were obtained from Sigma-Aldrich (St Louis, MO, USA) unless mentioned otherwise. Single-side polished, p-type (100) orientation 4” silicon wafers were purchased from Nova Electronic Materials, Flower Mound, TX whereas single-element high purity Al and Si standards (1000 μg/L) were purchased from Ultra Scientific. Matrigel® Matrix (Basement Membrane Phenol-red free), Endothelail cell Basal media (EBM), Endothelail cell growth media (EGM-2), Human umbilical vein endothelial cells (HUVECS) were purchased from Lonza Wakersville, Inc., while Glutaraldehaide 2% and Dulbecco’s phosphate buffer solution were obtained from Sigma Life Science.
Study design
The first part of this study focused on the fabrication of SiONP coated test samples using the PECVD process. PECVD-based amorphous silicon oxynitrophosphide (SiONP) overlays with varying levels of N/P/O ratios were thoroughly characterized (EDS, Raman, XANES analysis). In the second part of this study, SiONP coated test samples were investigated for cell-surface interactions and their in-vitro osteogenic and angiogenic behavior using osteoprogenitor cells (MC3T3) and Human umbilical vein endothelial cells (HUVEC) respectively. The third important part of this study contained in-vivo evaluation of these coated samples for their bone-regeneration capability in a rat critical size calvarial defect model using control samples (substrate only, empty defect).
2.1. Fabrication of SiONP Coated Samples and Thin Film Characterization
2.1.1. Preparation of Nanofabricated SiONP Samples
Using conventional photolithography and PECVD process, amorphous silica based SiONP overlays onto patterned surface samples were prepared. The fabrication process started with the test grade silicon wafer (Nova Electronic Materials, Flower Mound, TX). Following standard RCA cleaning protocol, Microposit HMDS primer, an adhesion promoter between the substrate and eventual photoresist, was spin coated for 30 sec at 3000 rpm and baked at 150°C for 90 seconds on hot plate. After baking, positive photoresist (Shipley S1813) was spin coated for 30 sec at 4000 rpm to obtain a uniform layer ~1.35 μm thick. The wafer was then exposed to UV light using EVG Aligner (I-line 365) at a dose of 139 mJ/cm2 in constant intensity mode, developed in MF-319 developer for 43 sec and hard-baked at 115°C for 60 sec to obtain a micrograting pattern on the wafer surface (see Figure 1). After photolithography, deep reactive ion etching (DRIE) was used to etch the exposed Si surface (200 nm etch depth) in order to transfer the photoresist patterns into the underlying Si surface. TRION Deep Reactive Ion Etching System was used to attain the Si etch rate of 86.25 nm/min using CF4 gas at 25 sccm flow rate, 25 mTorr pressure, 3 kW ICP power and 100W RIE power. Immersion in acetone followed by a piranha (3 H2SO4 : 1 H2O2) clean at 95°C for 10 min completely removed the remaining photoresist from the surface. Finally, the wafer was rinsed in DI water and blown-dry with nitrogen.
Figure 1.
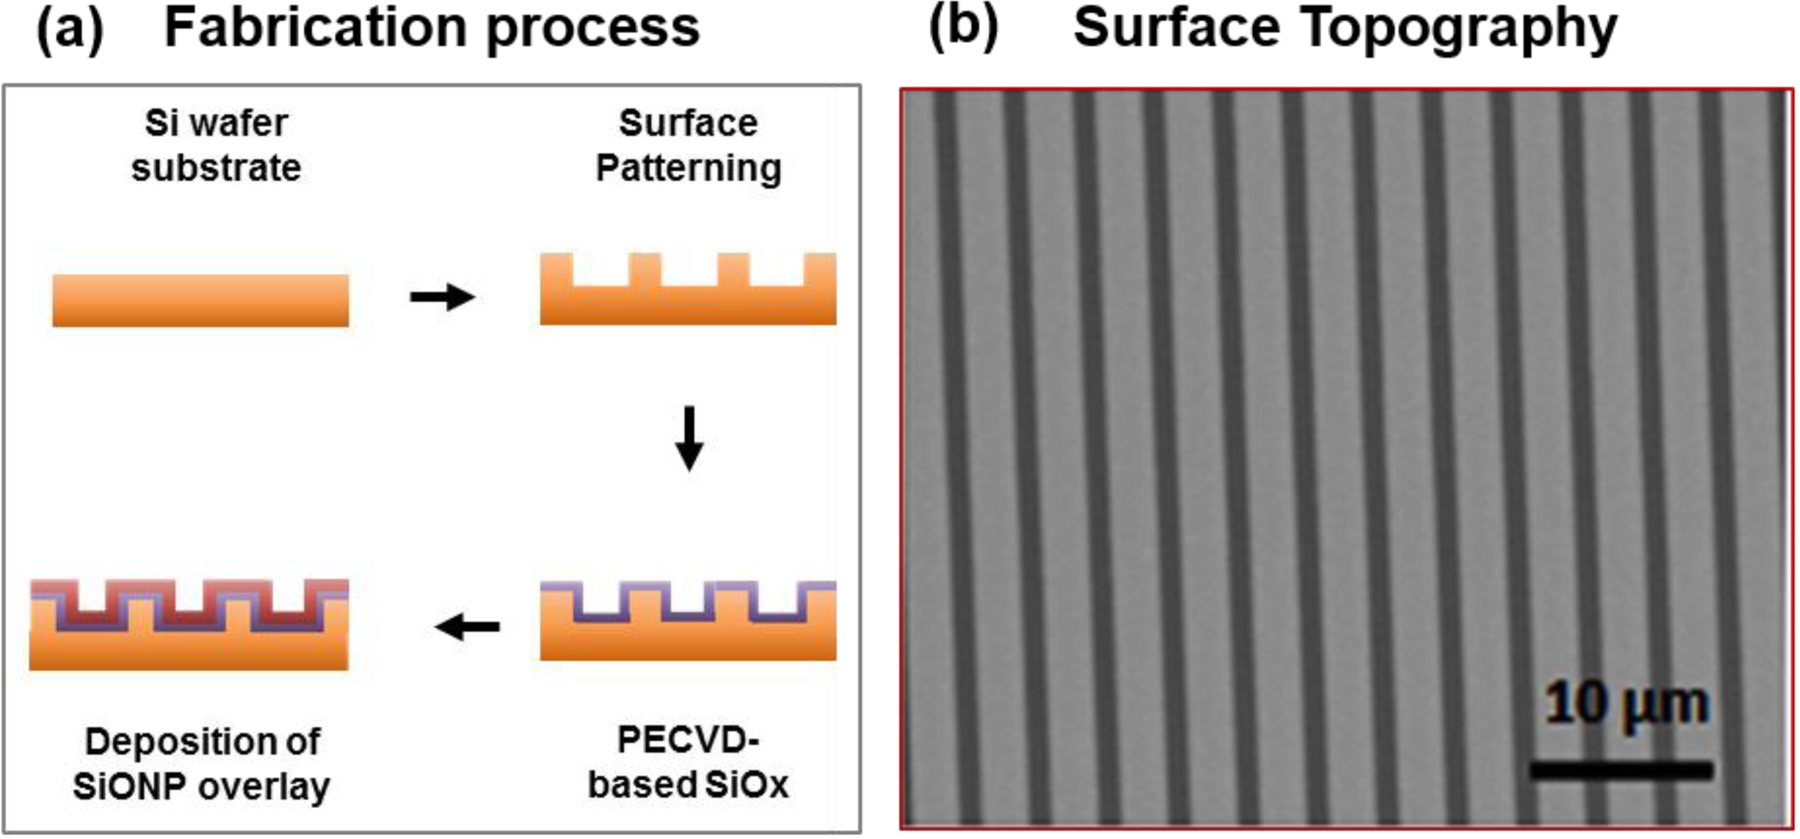
Fabrication of SiONP overlays (a) A schematic diagram to illustrate the fabrication process for PECVD amorphous silicon oxynitrophosphide (SiONP) overlays with Si wafer substrate. (b) SEM micrograph shows the surface topography of a representative sample after photolithography, etching and PECVD deposition of SiONP (feature size 2 μm).
With substrate temperature of 400 °C, chamber pressure of 900 mTorr, and ICP power of 30W with 13.56 MHz excitation frequency applied, a 100 nm thick uniform (non-uniformity < 1%) oxide layer was deposited via PECVD process using TRION ORION II PECVD/LPCVD system and then overlaid with a 100 nm of amorphous silicon oxynitrophosphide (SiONP). Source gases included silane (SiH4) and phosphine (PH3) diluted in argon (Ar) (15% SiH4/ 2% PH3/ 85%Ar), nitrous oxide (N2O), nitrogen (N2), and ammonia (NH3). To prevent undesirable gas-phase reactions, a silane flow rate of 25 sccm (15% SiH4) was used; the silane to phosphine ratio was kept constant due to source gas limitations. The nitrogen and ammonia flow rates were kept high at 225 sccm and 50 sccm, respectively. Variation in the nitrous oxide flow rate resulted in six different types of coatings as shown in Table I. The thickness and refractive indices of the coatings were measured using ellipsometry at a wavelength of 632.8 nm (LS300, Gaertner Scientific Corporation, Skokie, IL, USA). The deposition rates were calculated from thickness measurements and plasma-on times. For post-process characterization and in-vitro testing, the wafer was cut into 12 × 12 mm2 sections.
Table I.
Gas flow rates for the deposition of six different SiONP coating chemistries
| Sample | Gas Flow Rates (sccm) | |||
|---|---|---|---|---|
| 15%SiH4/2%PH3/83%Ar | N2O:SiH4 | N2 | NH3 | |
| 1 | 24 | 0 | 225 | 50 |
| 2 | 24 | 3 | 225 | 50 |
| 3 | 24 | 5 | 225 | 50 |
| 4 | 24 | 16 | 225 | 50 |
| 5 | 24 | 155 | 225 | 50 |
| 6 | 24 | 160 | 225 | 50 |
2.1.2. SEM and EDS Evaluation
Surface morphology, film composition, and film thickness were examined using scanning electron microscopy (Hitachi S-3000N Variable Pressure SEM) equipped with an energy dispersive X-ray spectrometry system (EDAX). SEM micrographs were captured at an acceleration voltage of 20 keV and scans for EDX mapping and compositional studies were performed at lower excitation voltage (12 keV) to prevent interference from sub-coating layers. Compositional information for defined regions of interest (ROIs) corresponding to O/Si, N/Si, and P/Si ratios were calculated using EDAX’s proprietary ZAF method.
2.1.3. Surface Dissolution Studies
Inductively coupled plasma optical emission spectrometry (ICP-OES) analysis was performed at the Shimadzu Center for Advanced Analytical Chemistry using the Shimadzu ICPE-9000 ICP-OES system. Wafer sections (12 mm × 12 mm) were placed in 4 mL of α-MEM at 37°C and 5% CO2 for 0, 6, 12, 24, 48, 96, and 192 hours. Post-soaking, silicon content in the supernatant fluid was examined (dilutions of 25x, 50x and 100x used) with aluminum (Al) as an internal standard. Single-element high purity Al provides intense lines due to relatively high ionization potential.36 To evaluate surface degradation kinetics of the coatings, concentration measurements were taken from the α-MEM dissolution media. Single-element high purity ICP Al and Si standards (1000 μg/L) were purchased from Ultra Scientific.
2.2. In-vitro cell culture and cell-surface interactions for SiONP samples
2.2.1. Osteogenic Behavior Studies
MC3T3-E1 cells were seeded on the SiONP test samples and the glass cover slips (control surfaces) placed in the 6-well plate (BD, Franklin Lakes, NJ, USA). The test samples and the glass cover slips were sterilized (tissue culture treated) using standard bacti-cinerator, which was used to apply a dry heat inside the biosafety cabinet. The samples were allowed to cool down for 1–2 minutes before seeding the cells on the surface. Cells at 100,000/cm2 were seeded for triplicate samples and were synchronized (α-MEM, 1% FBS, 1% streptomycin/penicillin) for 48 hours. The synchronization media was then exchanged for growth media (α-MEM, 10% FBS, 1% streptomycin/penicillin) with 50ppm ascorbic acid-2-phosphate (AA2P, Sigma-Aldrich Corp., St. Louis, MO, USA) to induce differentiation. Cells were cultured for 6, 24, 48, and 72 hours before they were lysed to study relative expression of GAPDH, SOD1, OCN, RUNX2, Osterix (Sp7), and COL(Ⅰ)-α1 genes using qRT-PCR analysis.
2.2.2. qRT-PCR Analysis
In accordance with the manufacturer’s protocol, lysing of cells was performed using buffer RLT (guanidinium thiocyanate) as a lysis buffer (10 μl ß-Mercaptoethanol per 1 ml Buffer RLT) and lysate was purified to collect mRNA (RNeasy Mini Kit, Qiagen, Valencia, CA, USA), then converted to cDNA using qRT-PCR method (Reverse Transcription System, Promega, Madison, WI, USA). Using a microvolume UV-Vis spectrophotometer (Nano Drop 2000c, Thermo Fisher Scientific Inc., Waltham, MA, USA), absorbance measurements of mRNA and cDNA samples were gathered. GAPDH was used as internal reference (housekeeping) gene to evaluate relative quantification of gene expression using the comparative cycle threshold (CT) method as explained in our previous work.21 Data were normalized to GAPDH (internal reference gene) within each independent experiment and represented as relative induction of control at corresponding time-point.
2.2.3. Angiogenic Behavior Studies
HUVEC cells were cultured in 75 cm2 flasks with vent caps and allowed to grow for one passage. After that, the cells were dissociated from the surface and used for the capillary tube formation study. Overnight, materials – 12 well plate, 100 μl pipette tips and iced histology plate – were left at −20 °C while the Matrigel (1 ml aliquot tubes) originally stored at −20 °C were placed on ice at 4 °C.
The capillary tube formation assay experiments were performed as per manufacturer’s protocol and Arnaoutova and Kleinman’s/Robertson’s work.37 Triplicate samples for three different study groups: glass cover slip (control, 1.5 cm diameter), silicon oxynitride (SiON) and silicon oxynitrophosphide (SiONP) coated wafer (test samples, 1.2 × 1.2 cm). SiON and SiONP samples were compared to study the effect of added P on angiogenic potential of the novel SiONP surface. The test samples were sterilized using the bacti-cinerator 24 hours before cell seeding and placed in 4 °C overnight. Prior to cell seeding, the samples were placed into histology cooled plate inside the cell culture hood and exposed to UV light for 30 minutes. After that the 50 μl of Matrigel® was placed on top of each sample surface and glass cover slip in a way that the entire top surface was covered, without bubbles. The plate was put inside an incubator for 30 minutes at 37 °C and 5% CO2 humidified atmosphere followed by seeding of 65,000 cells/cm2 on the Matrigel® in 100 μl of EGM. After 30 minutes in the incubator, the wells were filled with 2 ml of EGM.
After 6 h, the wells were washed with PBS followed by deionized (DI) water and fixed with Glutaraldehyde 2.5%. Ethanol was used for gradual dehydration using refined aspiration of solutions by 30 G needles to prevent Matrigel® and cells removal. To prevent attachment to the well-bottom, samples were removed and dried at room temperature for 24 h. They were then coated with gold for 30 sec. SEM micrographs were captured using Hitachi S-3000N variable pressure scanning electron microscopy (SEM) using high vacuum at a working distance of 12.8 mm and beam acceleration voltage of 15.0 KV. Image J software was used to measure the total tubule length and thickness. Two SEM micrographs/sample were processed by Neuron J, (image J plug-in) to measure total tubule length while ten micrographs/sample were used to measure the thickness.
2.3. In-vivo Testing of SiONP samples using Rat Cranial Defect Model
2.3.1. Surgical and Postoperative Procedure
All procedures involving animals were performed in accordance with a protocol approved by the Institutional Animal Care and Use Committee at College of Dentistry, Texas A&M University. Using the rat model explained in our previous work,18 in-vivo bone healing efficiency of SiONP coated materials as compared to control surfaces (substrate only group and no implant group) was studied. A total of 9 rats (3 for each test group) were used in this study and one sample per animal was implanted to have triplicate samples for evaluation. Adult male rats (about 430 g each) were selected to study the bone regeneration capability of the SiONP materials when placed in biological environment of relatively slower bone-healing subjects. The rat was weighed, placed into an anesthesia induction chamber of 5% isoflurane in oxygen for 2–3 minutes, and shaved on the calvaria. Its head was held on a stereotaxic frame for the surgery. Following a 1.5 cm incision, the scalpel blade was used to scratch the periosteum layer with sterile saline iteratively applied to the incision site. All was followed by drying the exposed skull bone via air blowing. The sterilized SiONP coated test sample (3 mm × 5 mm) was placed at the ideal defect site (maximum flat surface with minimum sutures involved) and its edges were marked on the dry skull. Using a dental bur (#1 or #2) with about 0.5 mm diameter tip, the calvaria bone was cut, without damaging the dura, along the drawn edges to create the critical sized calvarial defect and then thoroughly washed with sterile saline and blown dry. To prevent the implant from moving during healing, a small amount (~1–2 μl) of gel glue was applied to the sample surface and placed it upside down in the defect so that it is glued to the dura. The incision site was sutured using a monofilament taper point suture needle; square knots were made ensuring adequate space to allow skin healing followed by a thorough cleaning and the delivery of a small volume (80–100 μl) of painkiller/sedative medicine (nalbuphine) injected intramuscularly using a 1 ml syringe. For the next few days, the rat’s behavior was monitored for signs of pain/distress. The animals were allowed to heal for 5 weeks and then euthanized to extract the implants with surrounding bone for the in-vivo bone regeneration analysis.
2.3.2. Micro-level Computerized Tomography (μCT) Analysis
After 5 weeks of recovery time, the implants and surrounding calvarial bone were extracted and analyzed using an X-ray microCT imaging system (μCT 35, Scanco Medical, Basserdorf, Switzerland). The μCT imaging system contained a specimen holder for the bone-implant samples and an x-ray source directed towards it. Serial tomographic imaging at an energy level of 55 kV and intensity of 145 μA was performed. 3D micrographs were generated to evaluate bone regeneration efficiency of different surface materials after the same recovery time. The μCT analysis was performed at the lower and upper threshold values of 280 and 1000 respectively.
2.3.3. X-ray Absorbance Near Edge Structure (XANES) Spectroscopy
XANES spectroscopy was performed at the Canadian Light Source at the University of Saskatchewan in Saskatoon, Saskatchewan, Canada. By utilizing the fine structural features at the absorption edge, XANES is a very sensitive and advanced technique to characterize the local coordination of individual elements.38 As bone mineral is mainly composed of calcium phosphate apatite so mostly calcium (Ca) and phosphorous (P) edges are examined to study the nature and local coordination of Ca and P in bone.39–41 Using soft X-ray beam-line for the micro-characterization of materials (SXRMB) that operates in the high-energy range from 1700 to 10,000 eV, the Ca K-edge spectra were obtained over energy ranges of 4000–4130 eV, with step sizes of 0.3. Operating at the low energy range between 5–250 eV and a step size of 0.1 eV, Plane Grating Monochromator (PGM) beam-line was used to acquire the P L-edge spectra in the region of 130–155 eV.
2.3.4. Raman Spectroscopy
To characterize the extracted bone sample, a Microspot Raman spectroscopy (DXR, Thermo Scientific) with 780 nm laser source and 100 mW power was employed. To evaluate the newly grown bone chemistry in comparison to the surrounding bone, various regions (a, b, c, d) on the extracted sample were analyzed. To measure the mineral content and bone phosphorylation, the phosphates, amides and other significant peak intensities were studied and compared.
2.3.5. Histology
The extracted bone samples were embedded in methyl methacrylate and sectioned using slow speed diamond saw. The sections were stained using Stevenel’s Blue stain and Van Gieson Picro-Fuchsin counterstain and then imaged using Leica TCS SP5-II upright microscope.
2.4. Statistical analysis
Data was presented as the mean ± standard error with parametric analyses shown via one-way analysis of variance (ANOVA) and posthoc Tukey’s test. A value of p < 0.05 was used to establish statistical significance.
3. RESULTS
The refractive indices and deposition rates for each set of gas flow conditions were determined using ellipsometry. Refractive index inhomogeneity was determined to be less than 0.007 and the thickness non-uniformity as measured at 15 points on each 4” wafer in the range of 1.6–2.8%. The refractive indices ranged from near that of silicon nitride (Si3N4: n=2.0) to near that of silicon dioxide (SiO2: n=1.46).42 Deposition rate decreased and refractive index increased as flow of nitrous oxide (N2O) decreased which is expected as N2O is the primary source of oxygen that is incorporated into the film. Figure 2 gives the refractive indices and deposition rates for the sample set. Refractive index of the samples as a function of the ratio of the flow rates of the primary reactive gases, N2O and SiH4, has been plotted in Figure 2b. Note that the SiH4:PH3 ratio is a constant, so a similar general trend of index vs. N2O:PH3 flow rate also exists.
Figure 2.
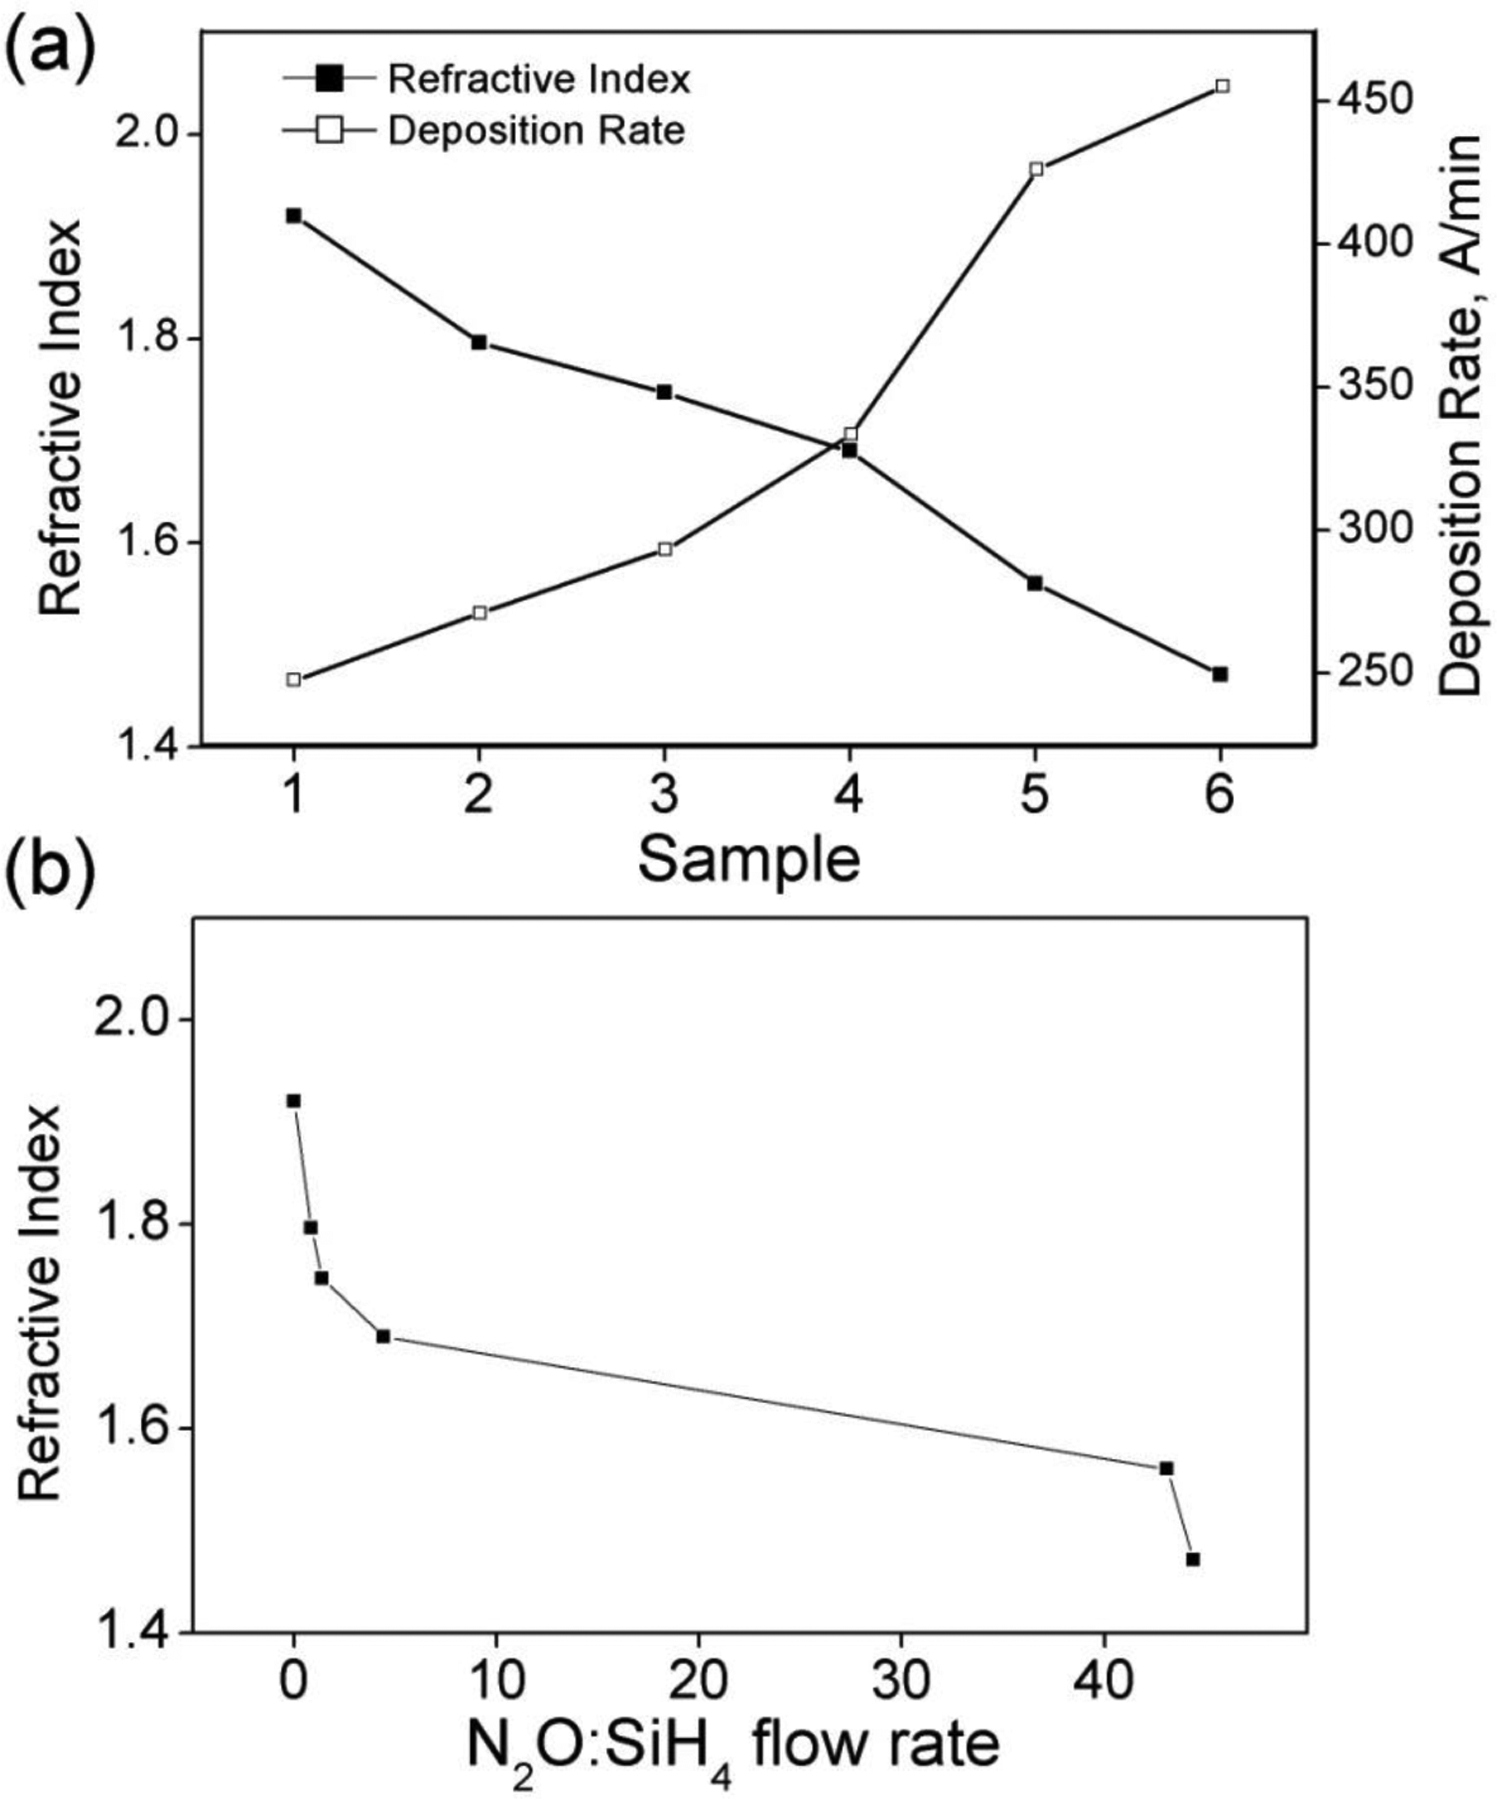
(a) Refractive indices for six different SiONP sample chemistires and their deposition rate (b) Refractive index as a function of N2O:SiH4 flow rate. Samples are plotted in order from left (Sample1) to right (Sample 6).
EDS analysis showed no major carbon or other contaminants and a uniform elemental distribution normal to the wafer surface. A ZAF quantification method was used to determine the N/Si, O/Si and P/Si atomic ratios in the coating. Figure 3 shows the film composition of the SiONP coatings in terms of N/Si, O/Si and P/Si atomic ratios. Increasing N2O:SiH4 flow ratio increased O to N content as well as an unanticipated modest increase in the P content of the coatings. In the sample deposited with 0 sccm N2O flow, some oxygen is still observed in the coating. This may be due to oxidation of the surface post-deposition, or contamination from the component gases or the deposition chamber itself. For the sample range studied, Si content was found to be similar to that of SiON films explained in our previous works.9, 18
Figure 3.
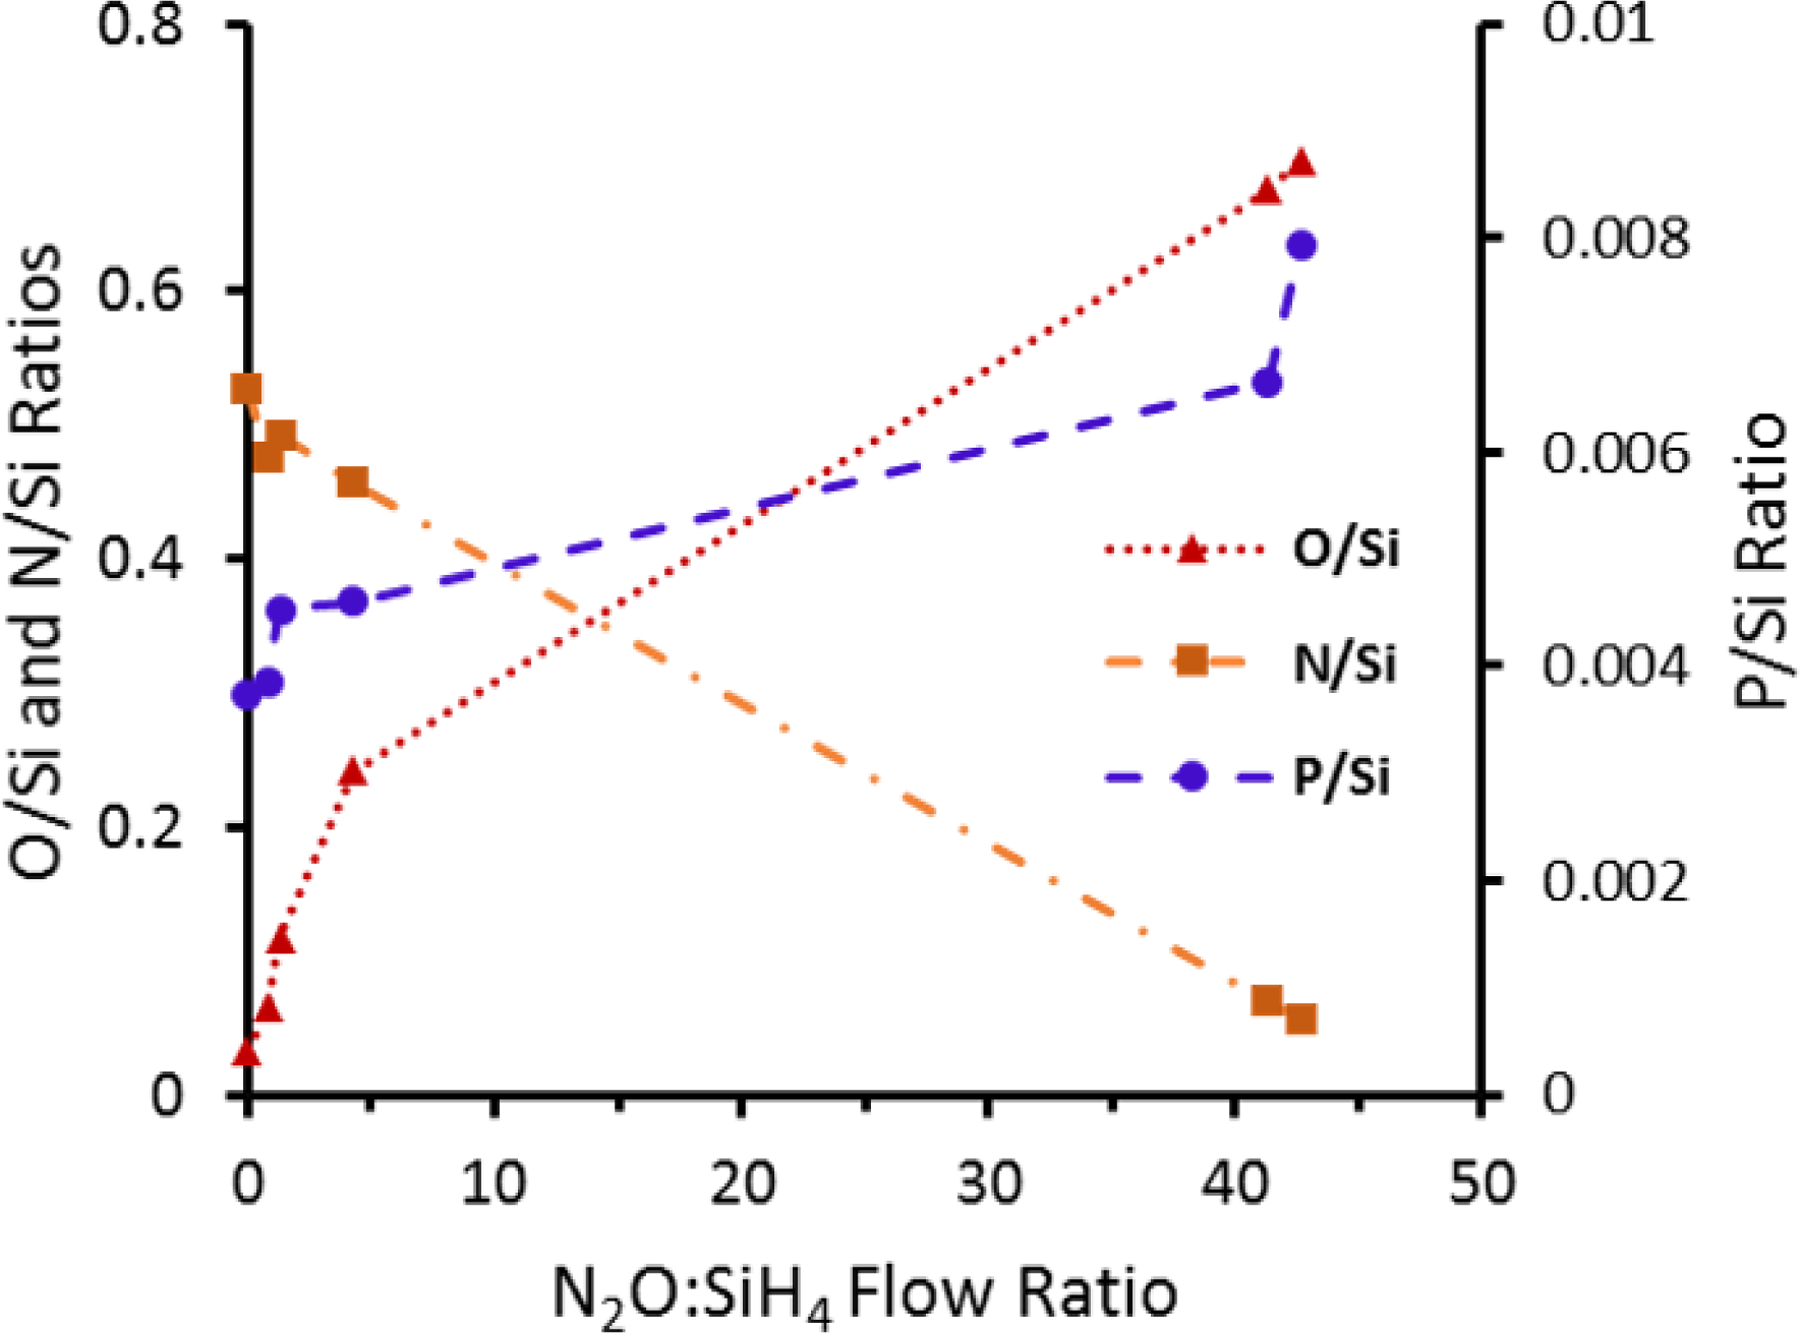
Atomic ratios of SiONP coatings determined by EDS spectra as a function of N2O:SiH4 flow rate. Samples are plotted in order from left (Sample1) to right (Sample 6).
ICP-OES analysis (Figure 4) shows that initially, there was little silicon in αMEM solution, however, all samples rapidly (<30 mins) begin to release silicon into solution. Sample 6 (low nitrogen) appears to undergo the most rapid release and completely releases all silicon after 8 hours in solution. Sample 5 appears to completely release all silicon after 96 hours in solution while samples 1 and 2 (nitrogen rich) appear to mostly release their silicon only after 192 hours in solution. It indicates that the low nitrogen-content samples appear to have more rapid release rates than the higher nitrogen-content samples. It should be noted that the low nitrogen-content samples also contain more phosphate, which is known to be a network modifier in amorphous silica formulations to modify short and long range ordering in the amorphous silica network and promotes dissolution rate.43
Figure 4.
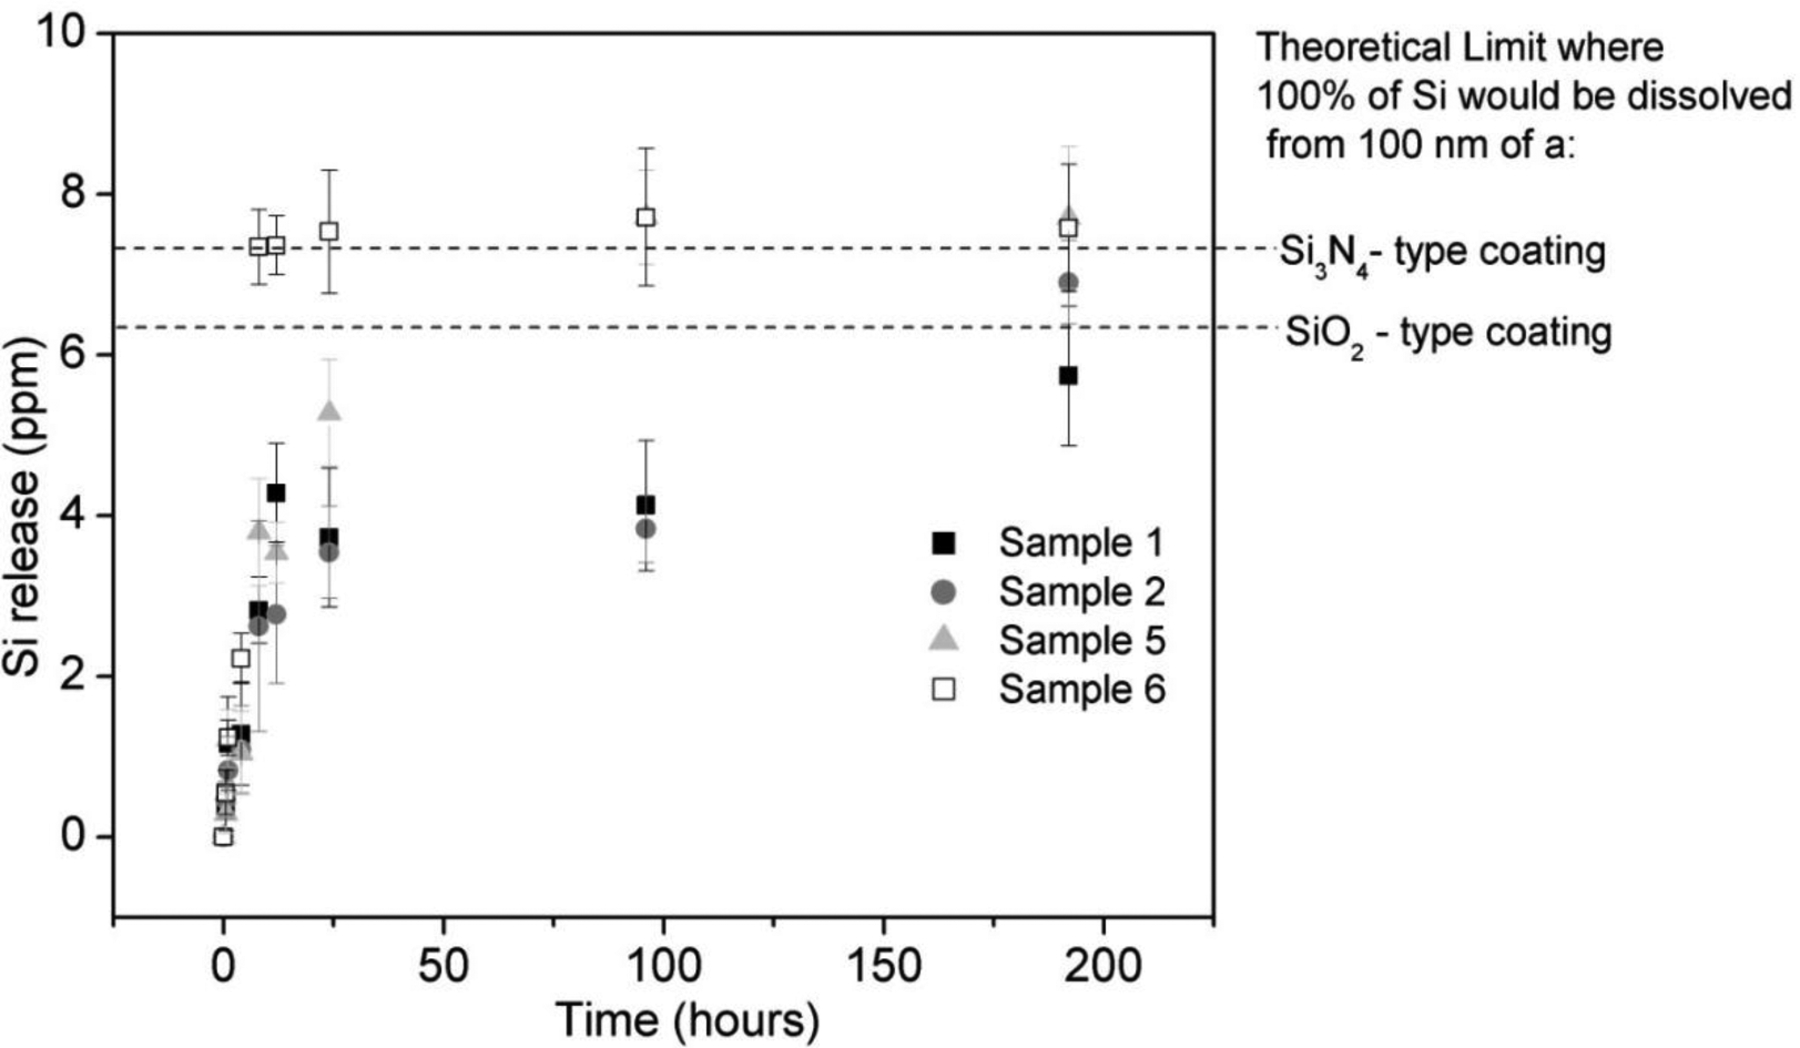
Ionic Silicon (Si+4) release from four SiONP sample chemistries immersed in αMEM as determined by ICP-OES analysis.
It was instructive to look at silicon release in terms of the percentage of the thickness of the coating dissolved; however, in order to estimate this quantity some simplifying assumptions were made. First of all, the coatings were assumed to be chemically and structurally uniform in the direction normal to the surface. Secondly, since the exact densities of the coatings were unknown, a reasonable approximation was to use the density of similar low-temperature fabricated PECVD coatings. According to MIT’s material property database, low-temperature PECVD deposited silica has a density of about 2.3 g/cm3 while similarly fabricated nitride has a density of about 2.5 g/cm3.44 SiONP coatings have a known composition that is intermediate to PECVD deposited silica and nitride (two extremes). Therefore, density values of these two extremes could be used to calculate the total amount of silicon that was able to go into solution and a % of coating thickness lost as a function of time could be determined. Table II lists coating thickness dissolved for four of the sample chemistries as a function of time in dissolution calculated according to this method. Results showed that a 100 nm thick layer of SiONP gave a sustained release of Si+4 over 8 days of time period. Sample chemistries 5 and 6 showed faster dissolution rate facilitated by higher P content present and silicon release more than the theoretical maximum (100 nm) after 8 days immersion of sample 5 and 6 was likely due to the simplifying assumptions discussed above.
Table II.
Coating thickness dissolved after immersion in αMEM determined by Si release
| Time (hours) | Thickness dissolved (nm) | |||
|---|---|---|---|---|
| Sample 1 | Sample 2 | Sample 5 | Sample 6 | |
| 0 | 0 | 0 | 0 | 0 |
| 0.5 | 5 | 6.6 | 4.2 | 7.9 |
| 1 | 16.6 | 11.9 | 17.4 | 17.6 |
| 4 | 18.3 | 15.6 | 14.9 | 31.7 |
| 8 | 40.3 | 37.4 | 54.2 | 104.9 |
| 12 | 61.2 | 39.6 | 50.5 | 105.2 |
| 24 | 53.2 | 50.6 | 75.4 | 107.6 |
| 96 | 58.9 | 54.7 | 110.2 | 110.2 |
| 192 | 82 | 98.6 | 110.1 | 108.3 |
The relative expression of several genes associated with osteoblast differentiation using MC3T3 cells demonstrated the effect of the surface chemistry on osteogenic markers. The results (Figure 5) showed that SOD1 was significantly overexpressed (Fig. 5a, 4 to 6 times relative to control glass cover slip group), at 6 h after induction of differentiation and reduced to same level after 24 h. Since the osteoblastic differentiation and mineralization strongly depend upon the transcription factors Runx2 and Sp7, their relative expression were also measured. The transcription factors Runx2 and Sp7 showed the same trend as SOD1 gene expression, but their reduction was moderate compared to SOD1. Similarly, smad1 and smad5 also showed much enhanced expression at 6h time point but were gradually settled down at later time points. The gene expression of OCN on SiONP surface was markedly increased at 6 h, and continued until 48 h after induction of differentiation. The gene expression of Col(I)-α1 showed alternate up-regulation and down-regulation at these time points but maximal enhancement was observed at 6 h time point. Thus, the qPCR studies revealed that SiONP chemistry with moderate levels of N, O and P (sample 4) showed the maximum enhancement for these osteogenic markers and should be considered as optimal surface chemistry, which was used for all further investigations to study angiogenic behavior of SiONP test samples in-vitro and finally its in-vivo testing.
Figure 5.
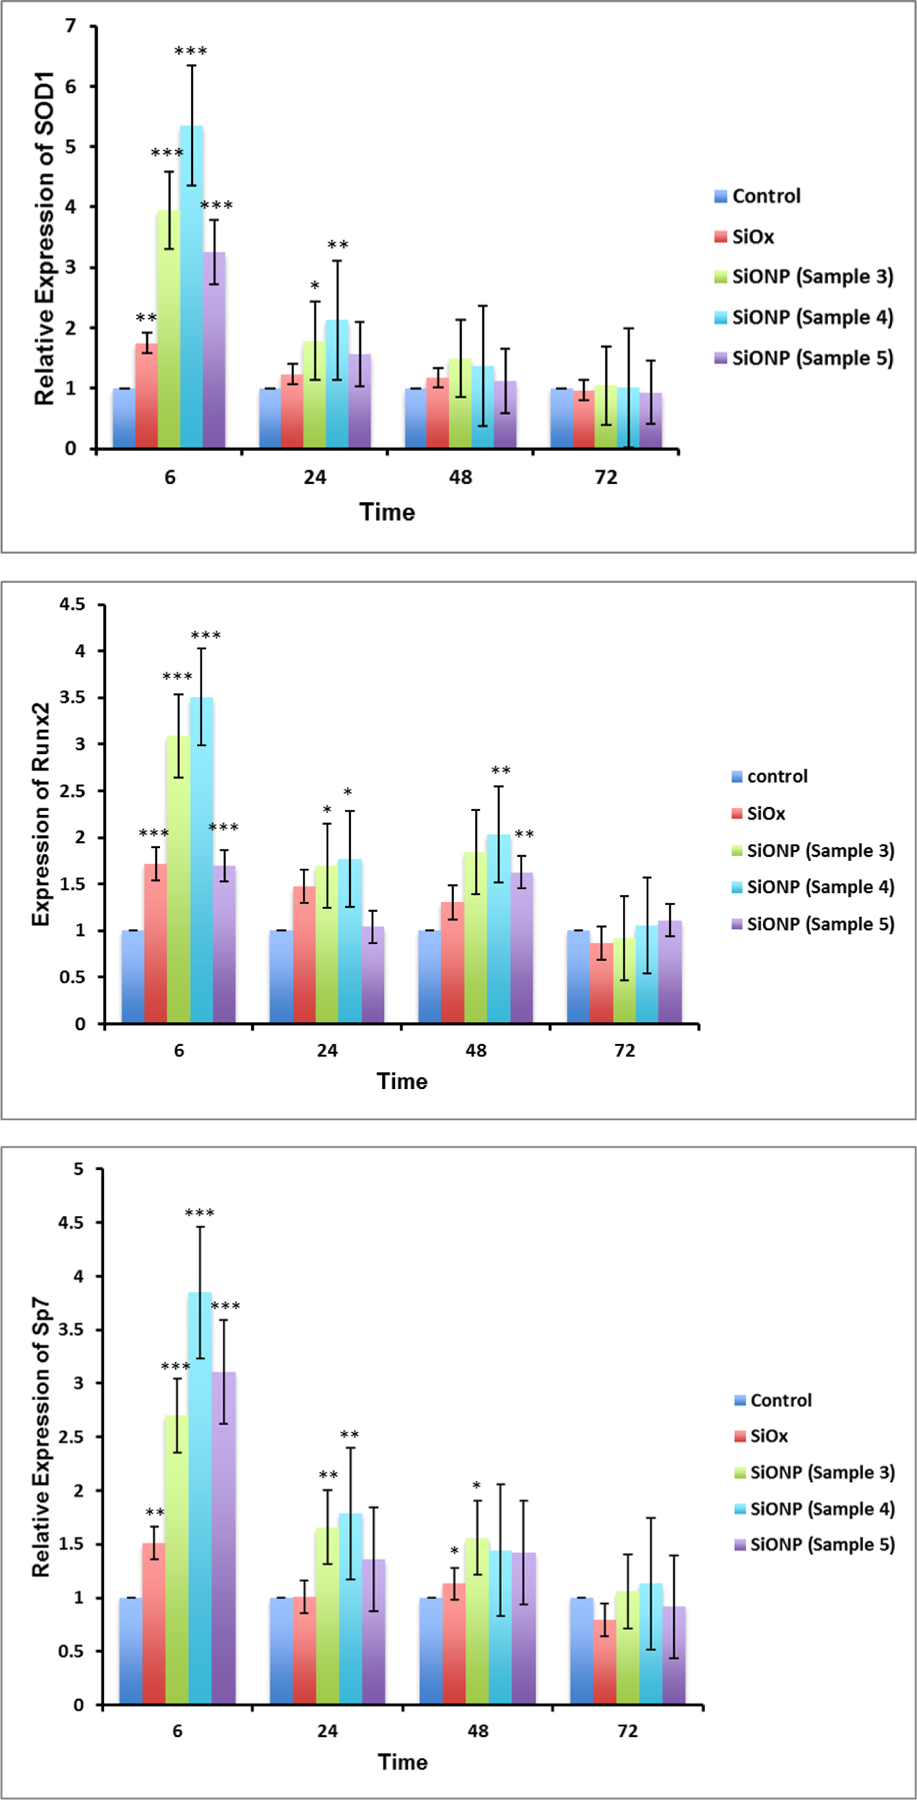
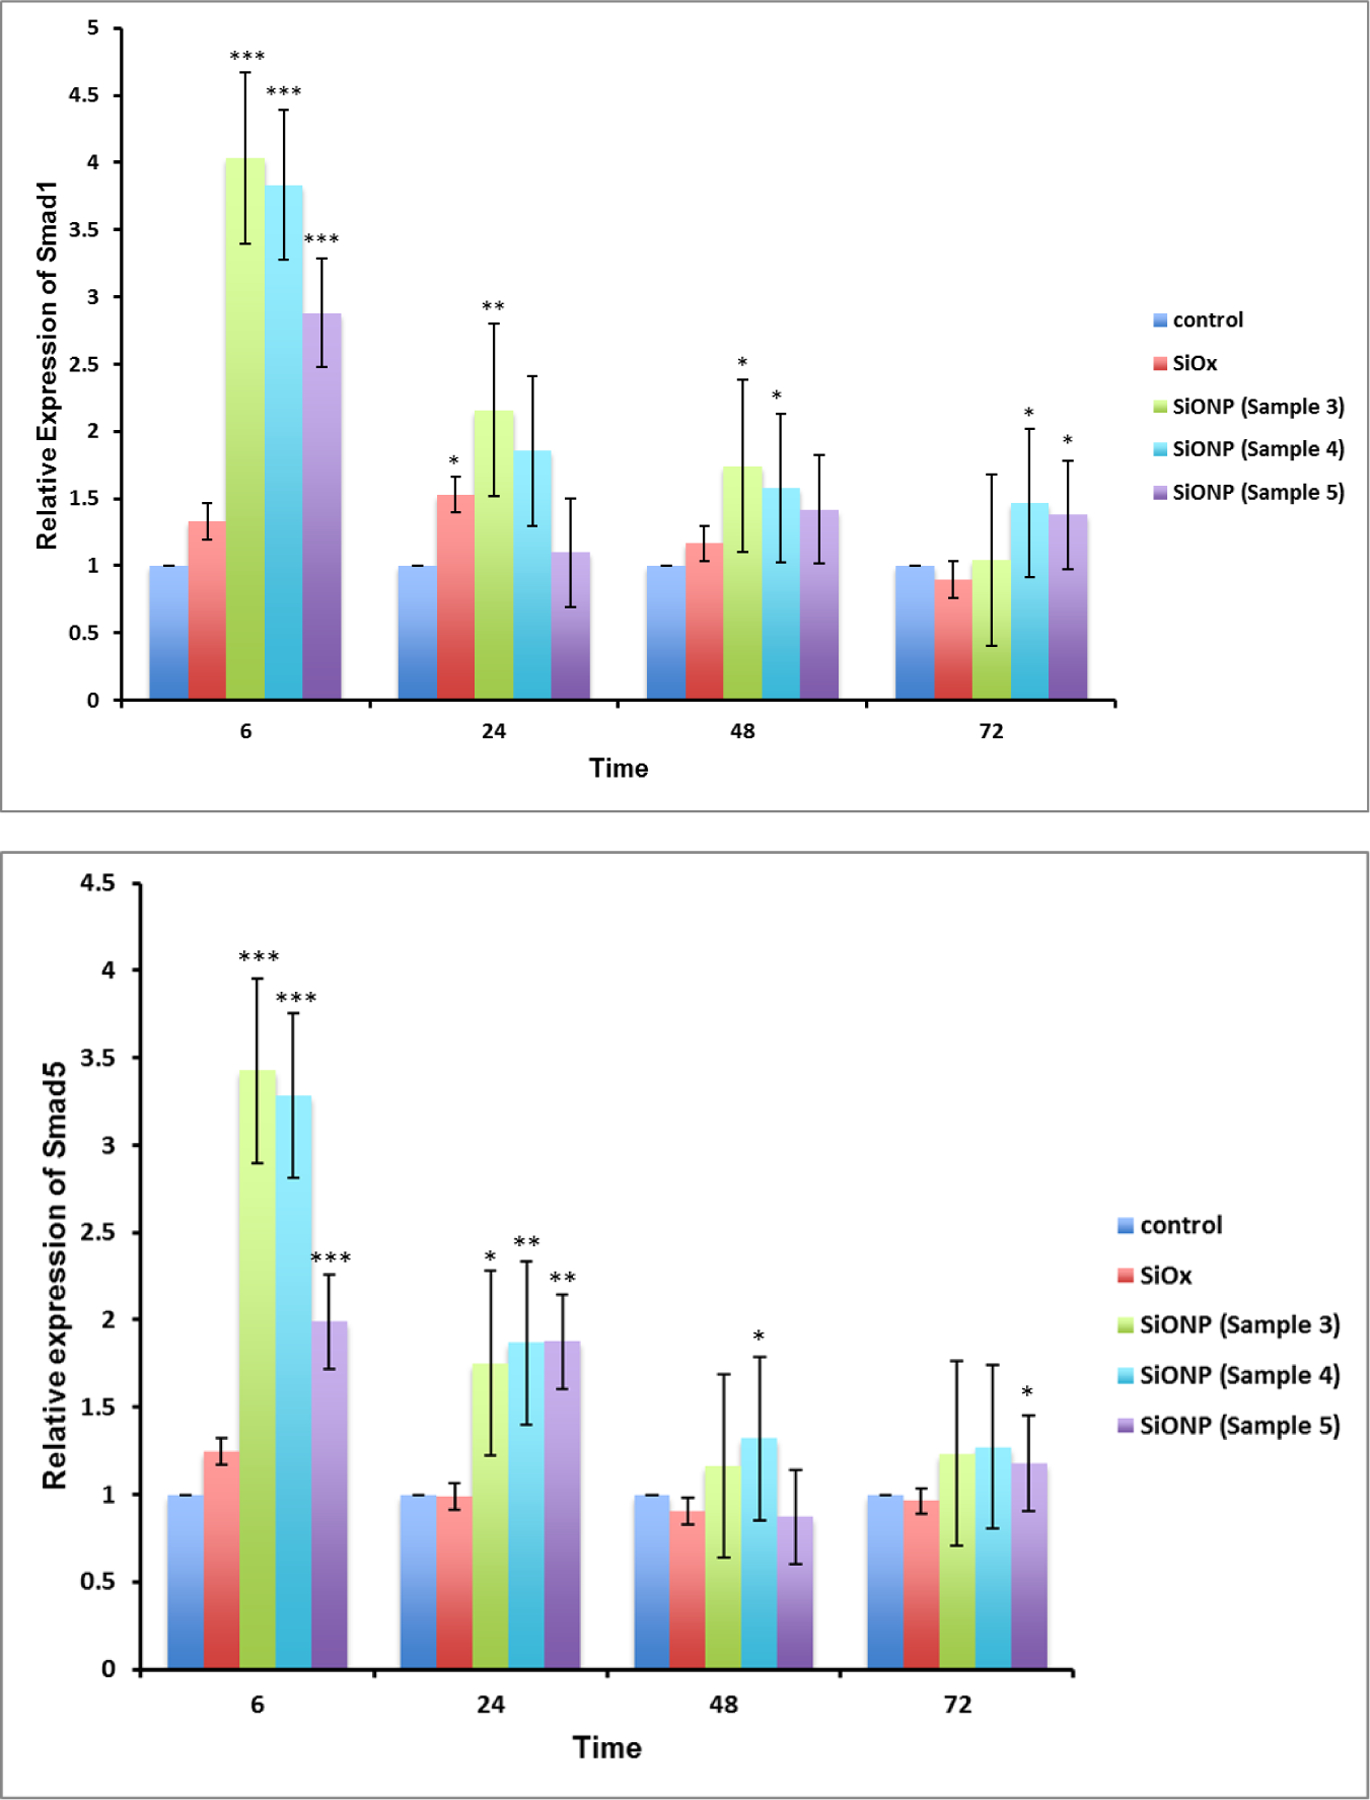
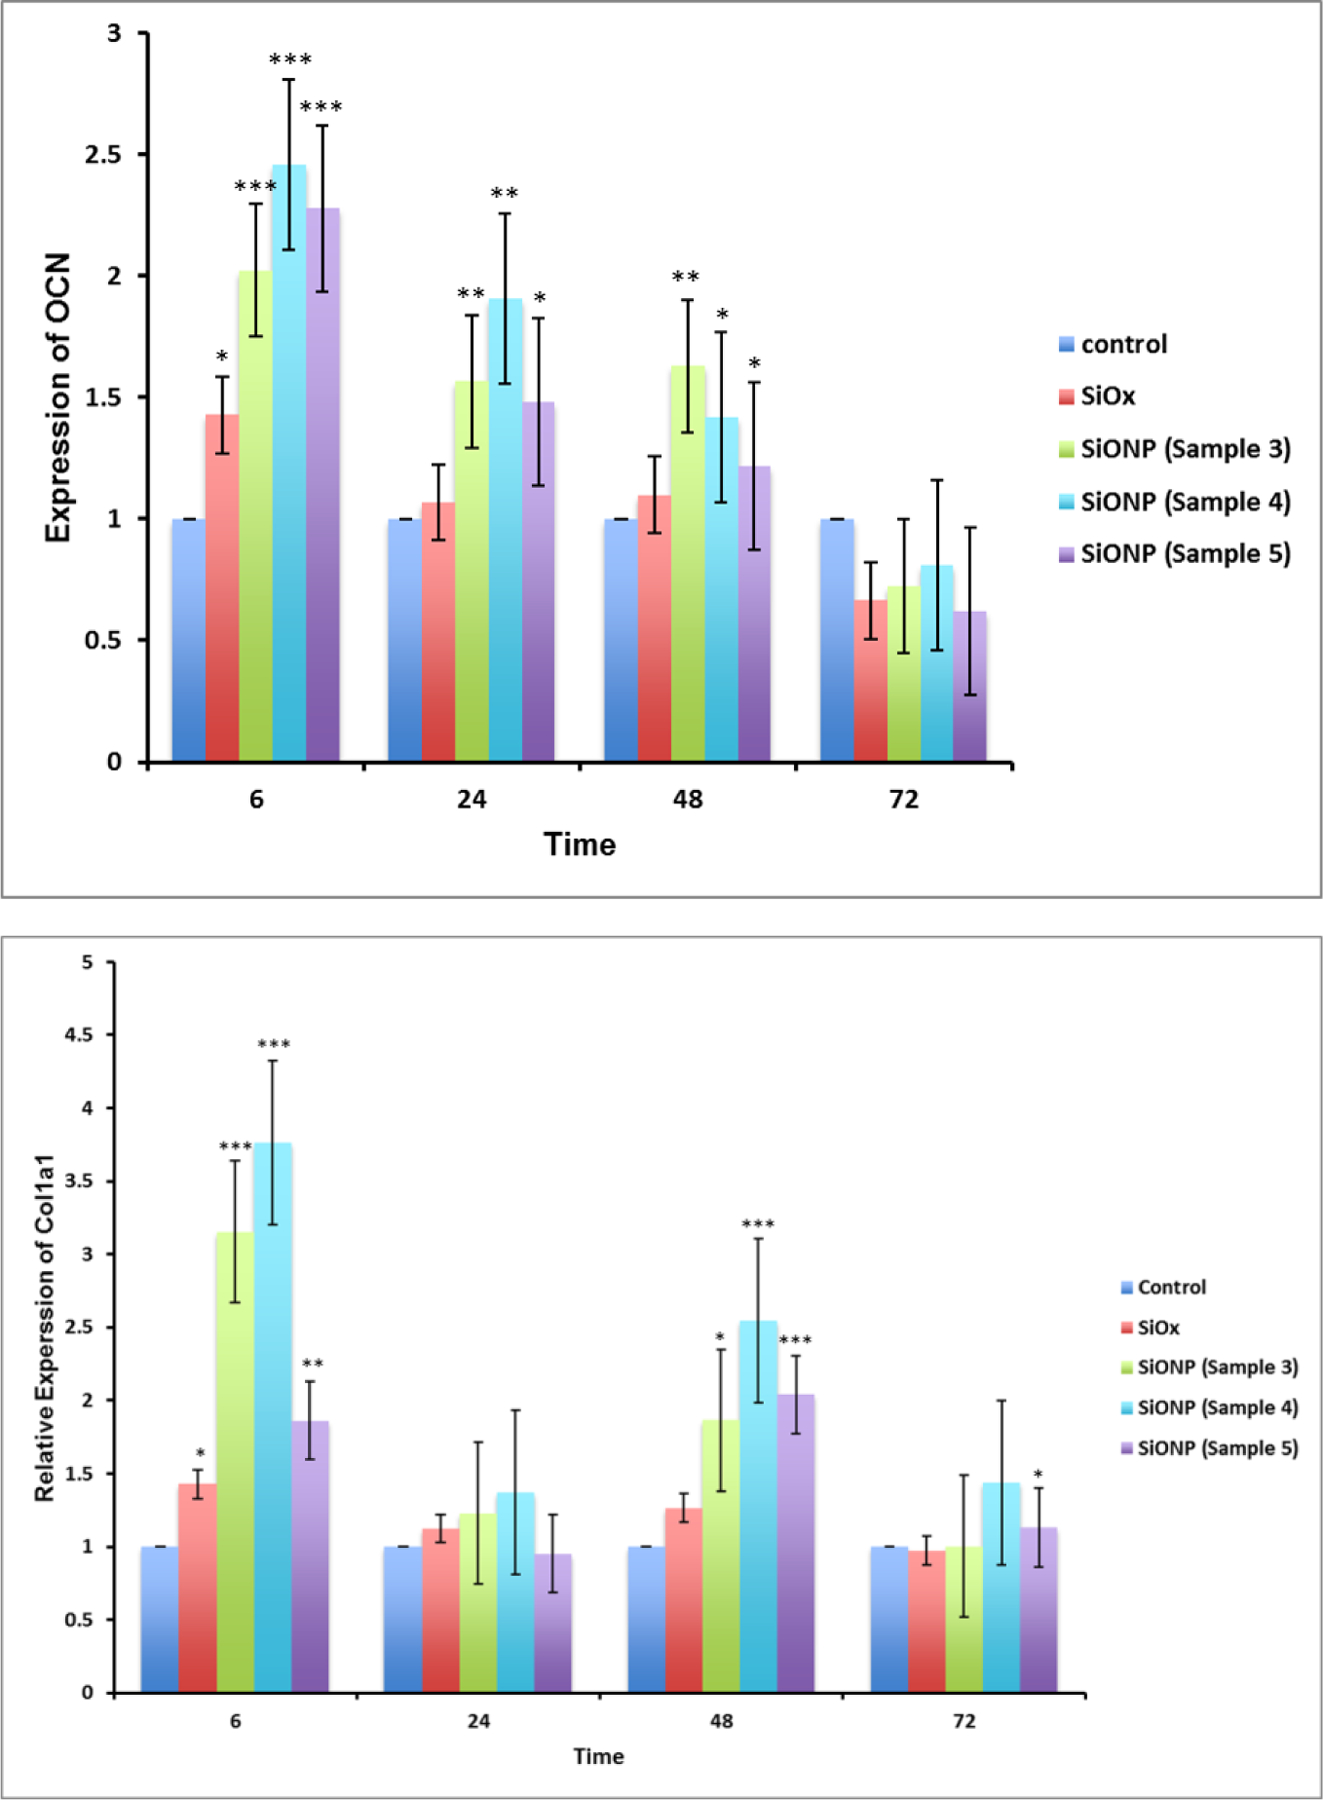
SiONP surfaces showed an enhanced expression of (a) SOD1 (b) Runx2 (c) Sp7 (d) Smad1 (e) Smad5 (f) OCN and (g) Col(Ⅰ)-α1 osteogenic markers for MC3T3 cells when compared to control surfaces. Maximal enhancement was observed when both the N and O were present in adequate quantities in the layer (sample 4). Moreover, MC3T3 cells showed maximum enhancement to the SiONP surface at the very initial time point (6h).
The angiogenic studies showed that after 6 h, the HUVECS formed tubules on top of glass cover slip, and PECVD-based SiON and SiONP test samples. Statistical differences of total tubule length among the groups were not verified; however the thickness of the tubules showed statistically significant differences among the test samples. SiONP surfaces exhibited about 2.5-fold increased thickness of tubules when compared with SiON or glass cover slip samples (Figure 6). Moreover, the tubules on SiONP samples showed well-defined circular structures without incomplete branches whereas we could observe incomplete tubules on glass cover slip and SiON surfaces.
Figure 6.
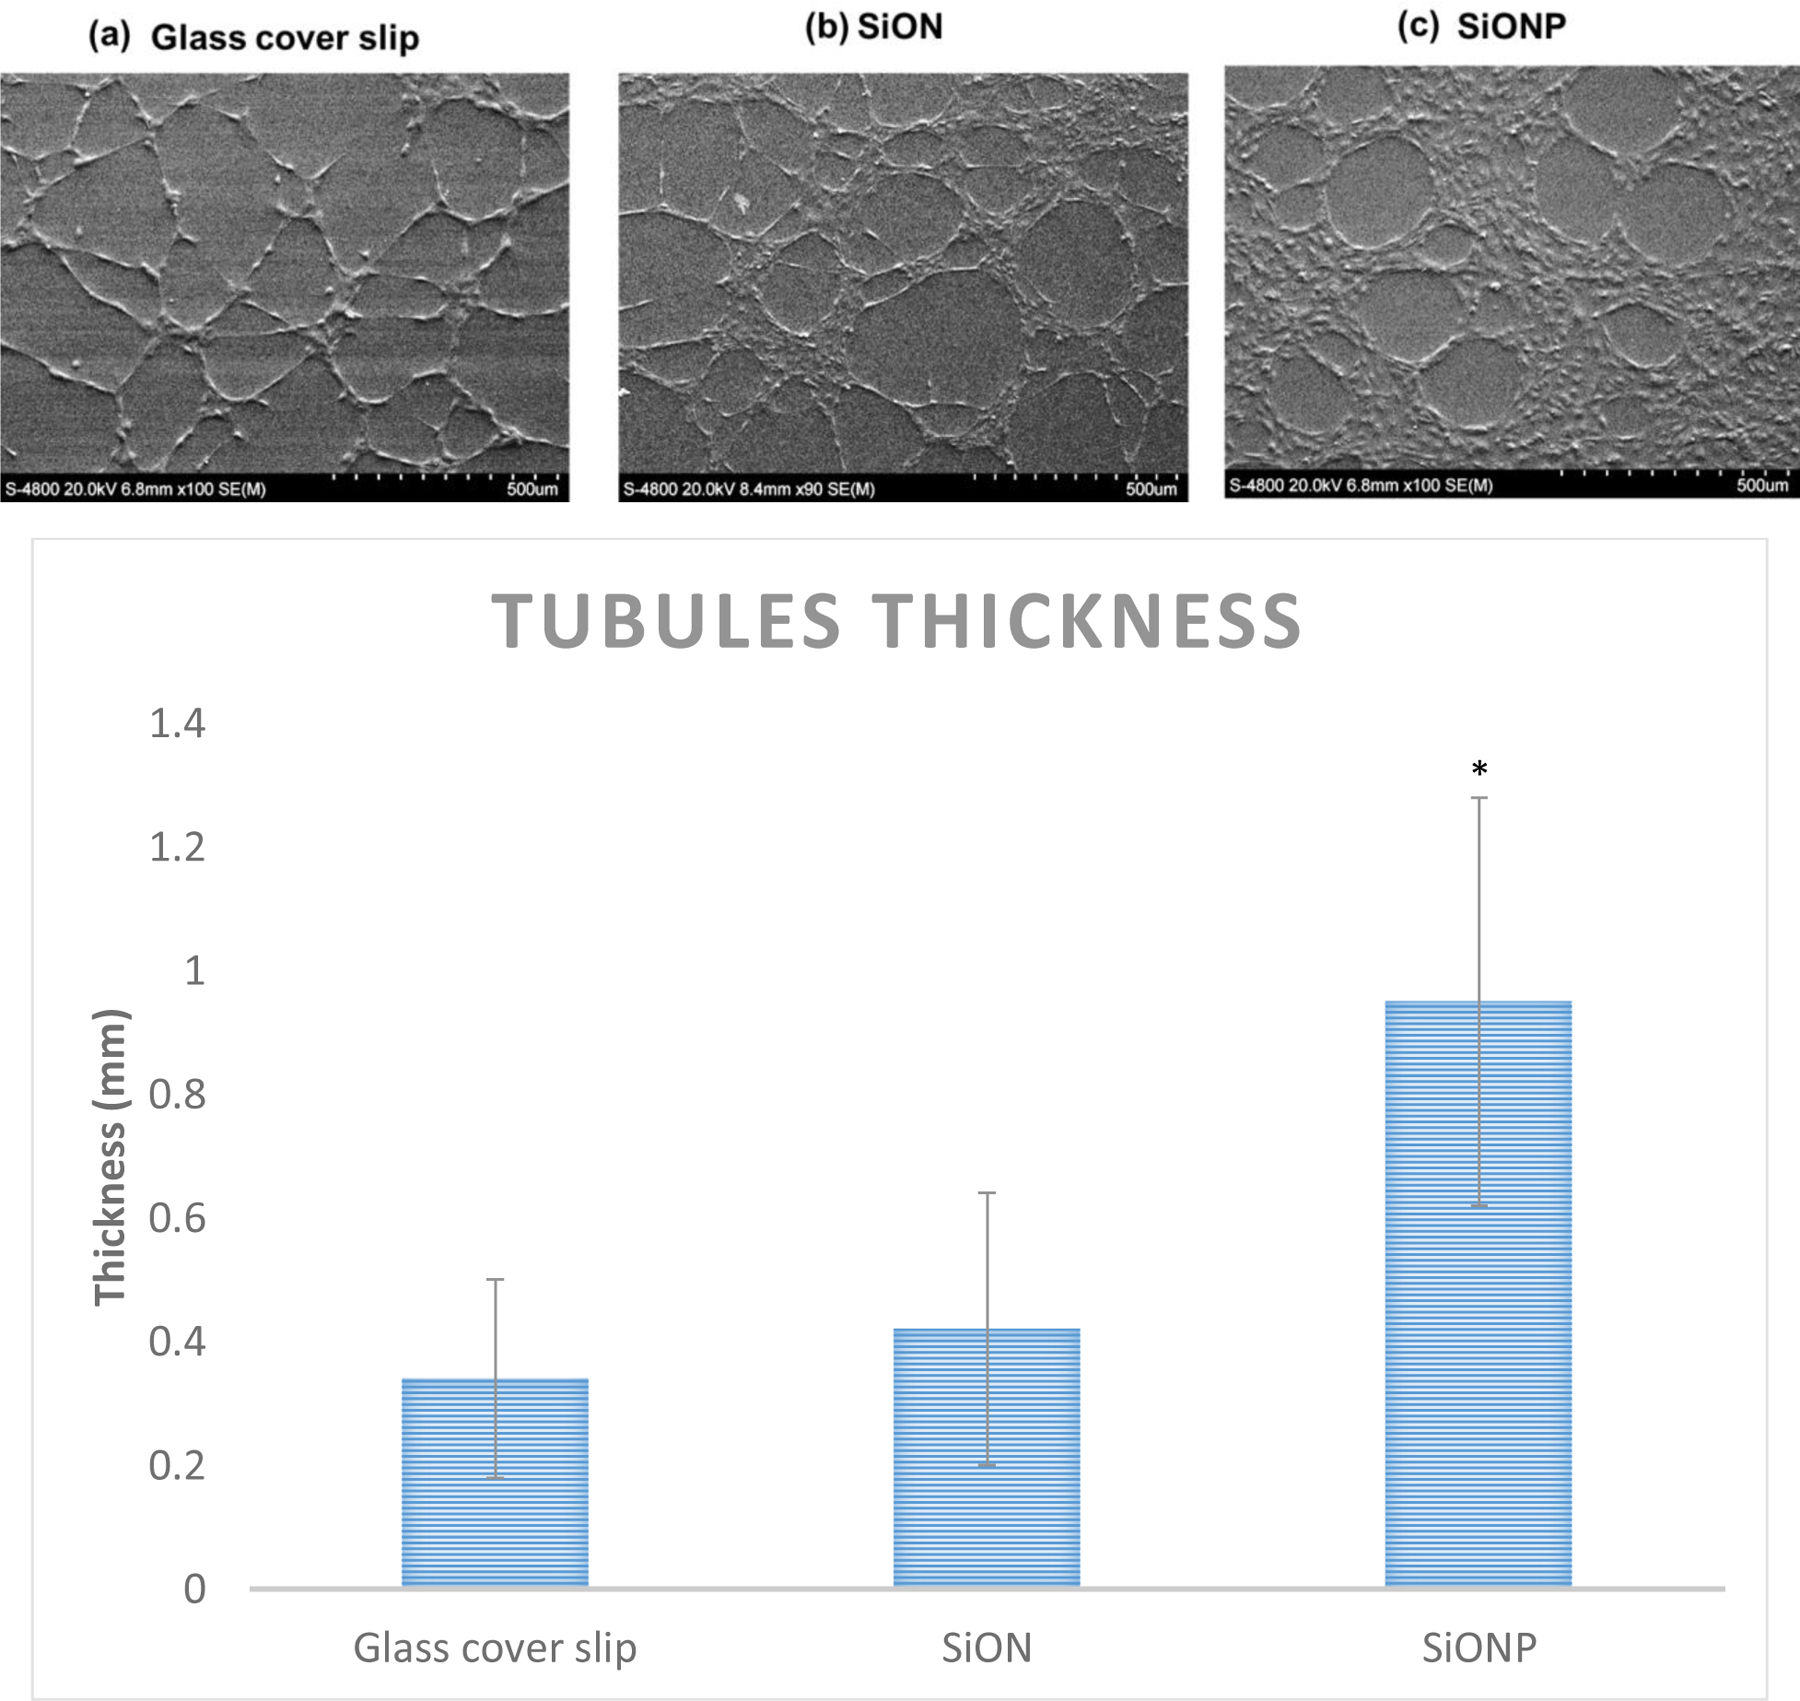
(a) SEM micrographs show show that HUVECS formed thicker tubules with well define circular structure without incomplete branches (b) SiONP surfaces showed more than 2 times thick tubules formed on the surfaces in comparison to control surfaces after 6h in Matrigel.
For in-vivo evaluation of the SiONP coated test samples, the implants were extracted out after 5 weeks post-surgery. The extracted bone-implant sample exhibited a strong fixation of the implant with the surrounding bone whereas μCT scan confirmed the presence of hard mineralized regenerated bone that almost completely filled the space around the SiONP coated implant (Figure 7). Whereas, control samples (substrate with no coating) were found loosely attached to the surrounding bone via soft tissue when extracted out after 5 weeks. The μCT data also confirmed that no significant regeneration of new bone occurred at the bone-implant interface to fill the gaps for these control samples during the same recovery time. The negative control (empty defect) also showed no signs of ample regeneration of bone and confirmed that the defect was critical size and would not heal at its own. The formation of fully mineralized bone at the bone-implant interface for SiONP test samples was also verified by histology analysis using Stevenel’s Blue stain and Van Gieson Picro-Fuchsin counterstain. While the control samples showed less mineral formation with mostly collagenous fiber around the implant as shown in Figure 8. The presence of blood vessels in the newly generated bone and well-oriented collagenous fibers with osteoblasts sitting along the bone edges were also observed in the histology data that emphasizes the healing stimulus of the SiONP surface.
Figure 7.
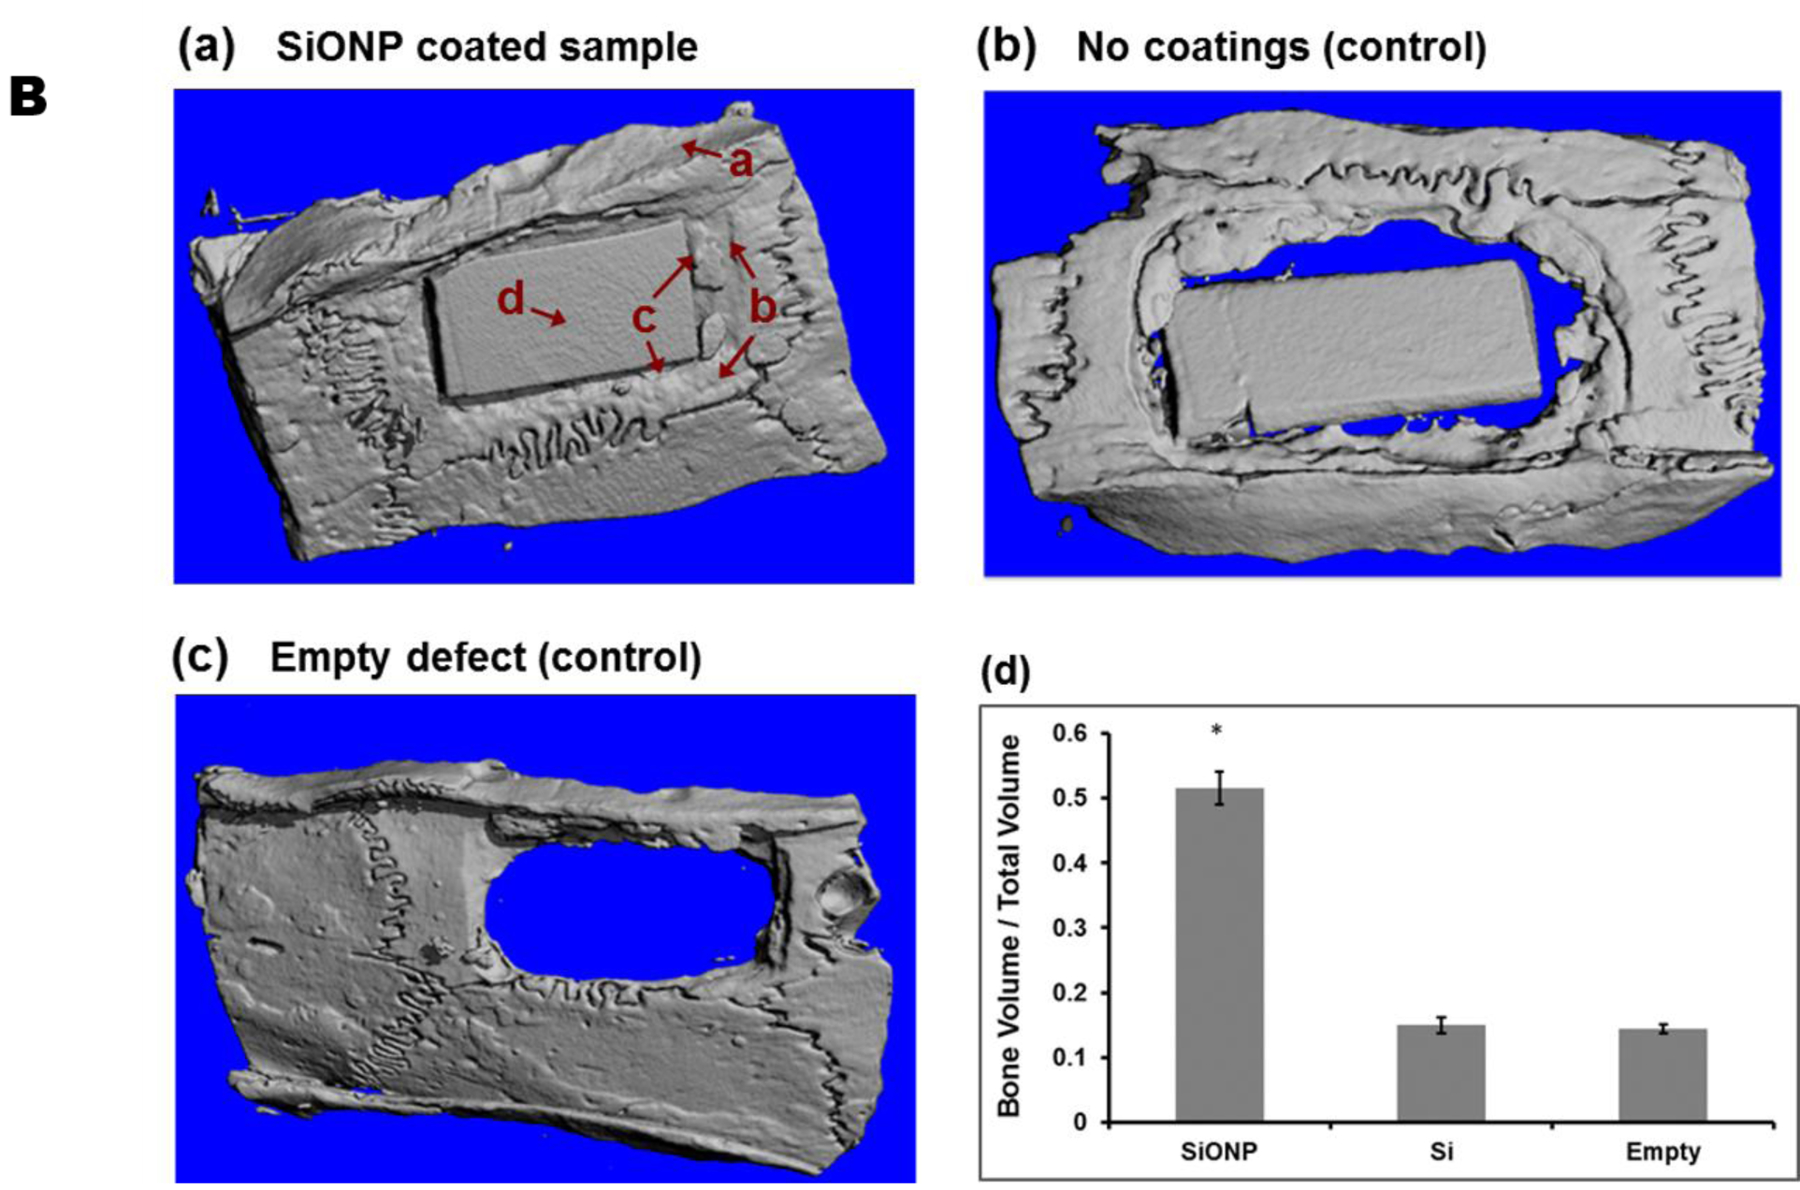
MicroCT micrographs showed that (a) SiONP samples induced rapid bone-regeneration process and nearly completely filled interfacial gap within 5 weeks in-vivo whereas the control samples (b) and (c) didn’t show much bone to fill the gap over the same time period. (d) Quantitative analysis shows larger volume of mineralized bone regenerated for the SiONP surfaces, exhibited by larger bone to volume (B/V) ratio (5 folds) when compared to control surfaces. The arrows associated with a, b, c, and d in part (a) represent four different regions as we move from surrounding bone toward the center of the implant.
Figure 8.
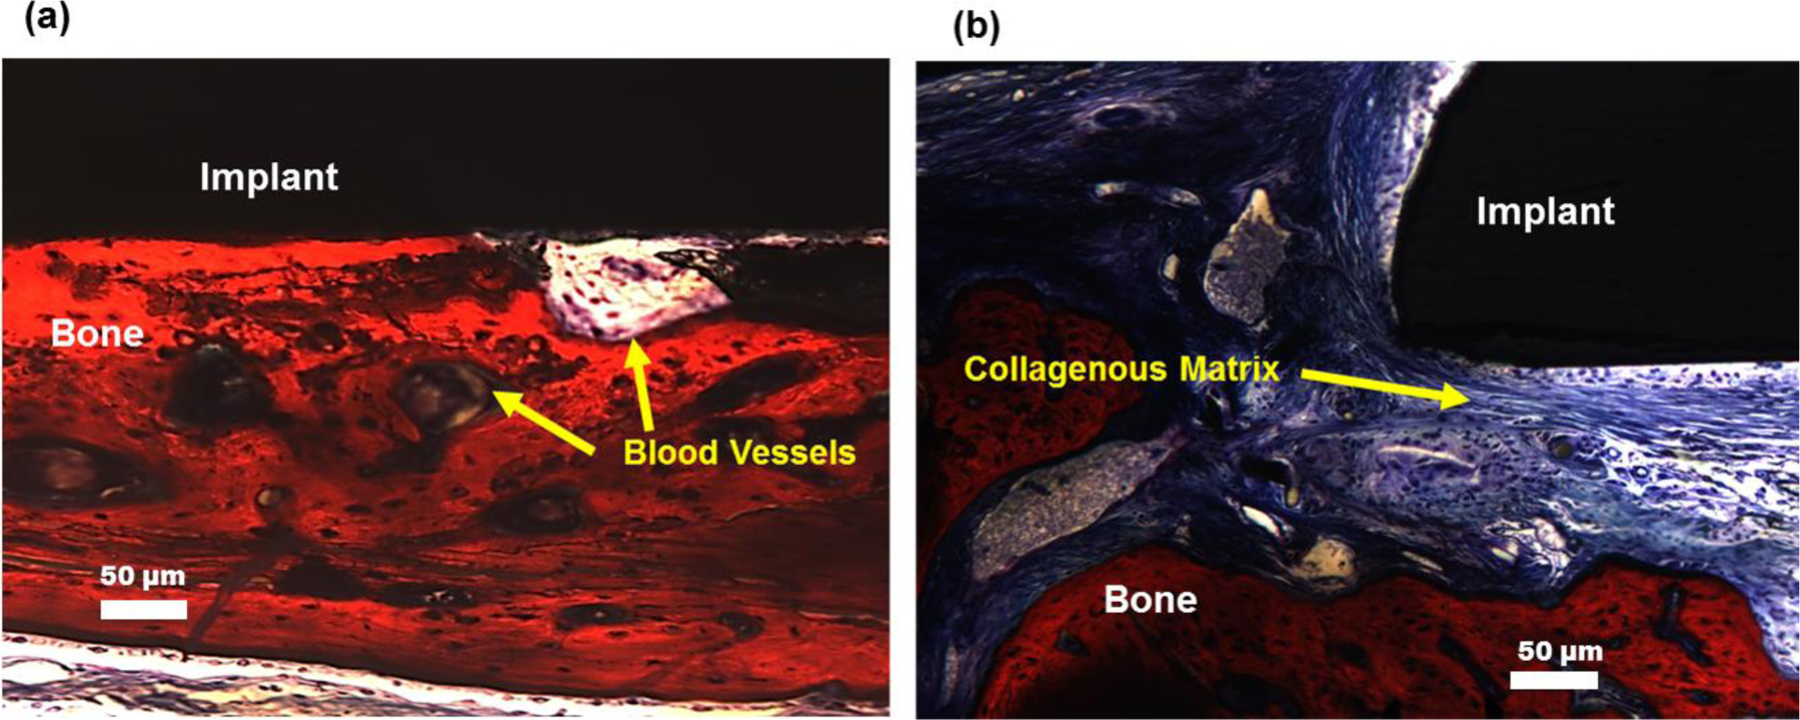
Histology of extracted samples after 5 weeks of recovery demonstrate that (a) SiONP surfaces showed fully mineralized bone at the bone implant interface whereas (b) the control samples didn’t show much mineral formation but mostly collagenous fiber at the bone-implant interface.
The composition and the maturity (mineralization) of the newly formed bone after 5 weeks of recovery time was determined via Raman spectroscopy data. Mineralized content of the bone is indicated by the PO43- peak at 950cm−1 and its intensity is proportional to the mineralized content present. Peaks at 955cm−1 and 957cm−1 correspond to transient bone mineral phase from the immature bone. Peak at 853cm−1 is indicative of collagen proline and 872cm−1 peak represents hydroxyproline. Peaks at 1242 and 1272cm−1 correspond to Amide III, protein β sheet, and protein α helix respectively. Peak at 1446cm−1 represents protein CH2 deformation and 1660cm−1 corresponds to the strongest Amide I peak with high polarisation sensitivity. The shoulder at 1690cm−1 indicates the presence of immature cross links, β sheets and disordered secondary structure. The results (Figure 9) showed that the surrounding bone (a), non-defected original surrounding bone, exhibited all the peaks projected to be present in a mature rat bone. The newly formed bone (b), at the edges of the initially created defect (adjoining surrounding bone), appeared fully mineralized indicated by the v1PO43- peak intensity and presented almost the same peaks exhibited by the surrounding bone. The full width half maximum of v1PO43- represents c-axis length of crystal and hence proportional to maturity of the crystal. The intensity of v1PO43- peak decreased as we moved towards the center of the defect, which indicated a drop in the content of mineralization. At the far end of the newly formed bone towards SiONP sample (c), distinct peaks for collagen presence as well Amide III and Amide I formation and CH2 deformation were found. This indicates the presence of protein and some immature mineralized content. While in the middle of the SiONP sample (d), we observed the peaks for Amide III, Amide I and CH2 deformation and poorly crystalline phosphate-carbonate which are indicative of immature mineralization and/or P coordinated with O on SiONP surface. A distinct peak corresponding to Si-Si bond was also seen, which might have stemmed from the underlying silicon substrate.
Figure 9.
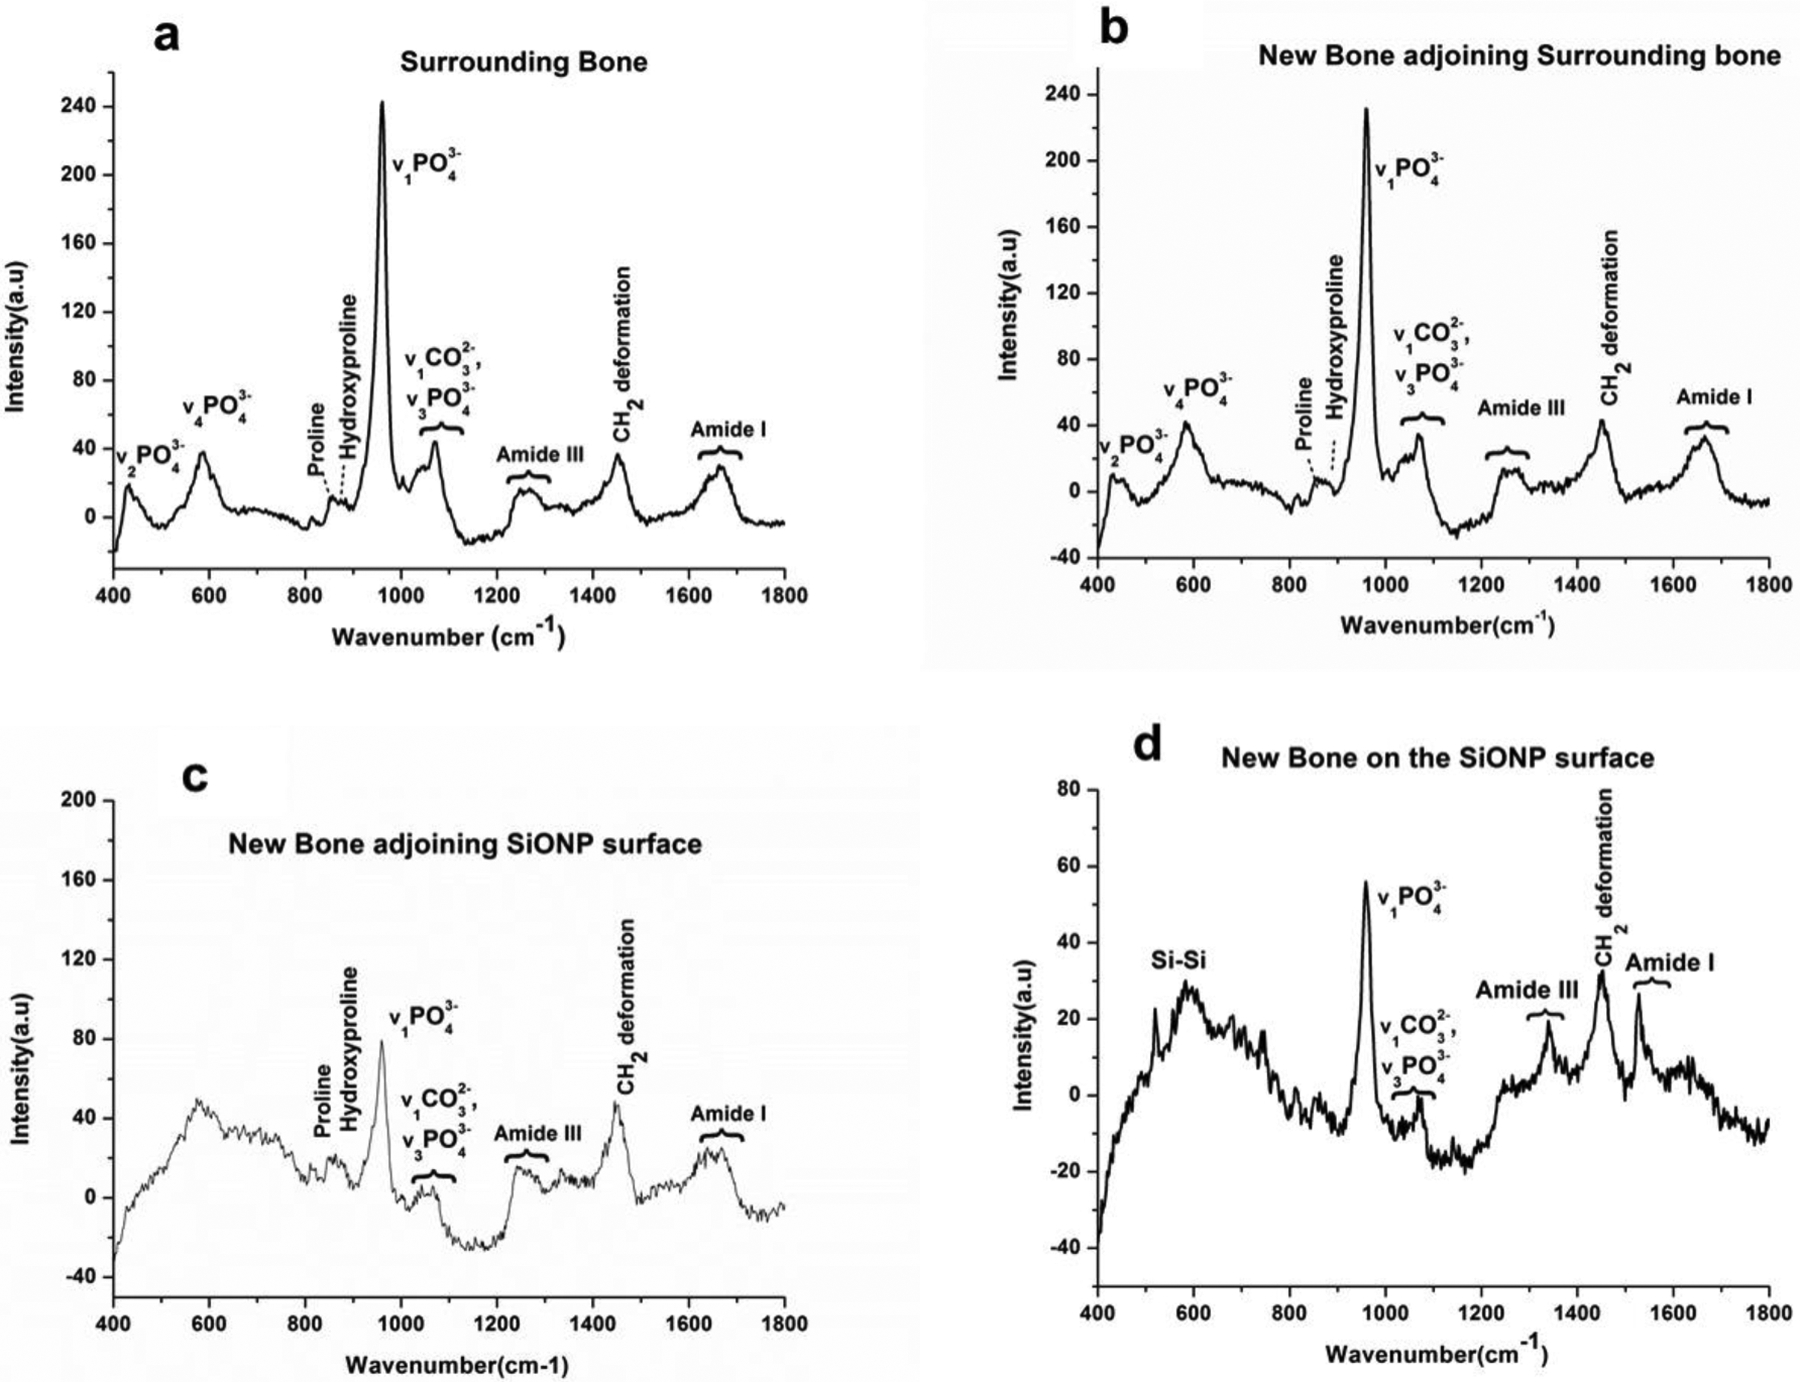
Raman spectra compares the presence of mineralized content in the newly formed bone on the calvarial bone-implant extract surface as we move from surrounding (non-defected) bone towards the middle of the implant (SiONP). (a) Surrounding bone representing the non-defected original bone shows all the peaks expected to be present in a mature rat bone. (b) High intensity of v1PO43- peak indicates the complete mineralization of the newly formed bone at the interface of new/surrounding bone. (c) A drop in v1PO43- peak intensity and presence of distinct peaks for collagen, Amide III, Amide I and CH2 deformation indicate the presence of collagenous matrix and some immature mineralized content whereas (d) presence of peaks for Amide III, Amide I, CH2 deformation and poorly crystalline phosphate-carbonate are indicative of immature mineralization and/or P coordinated with O on SiONP surface. The regions a,b,c, and d are marked in Figure 7(a).
X-ray absorbance near edge structure (XANES) data (Figure 10) were analyzed to compare the coordination chemistry of the newly grown bone with the original surrounding bone. It can be seen that SiONP samples after in vivo implantation and recovery from the rat cranium show the presence of Ca-P phases consistent with new bone formation.
Figure 10.
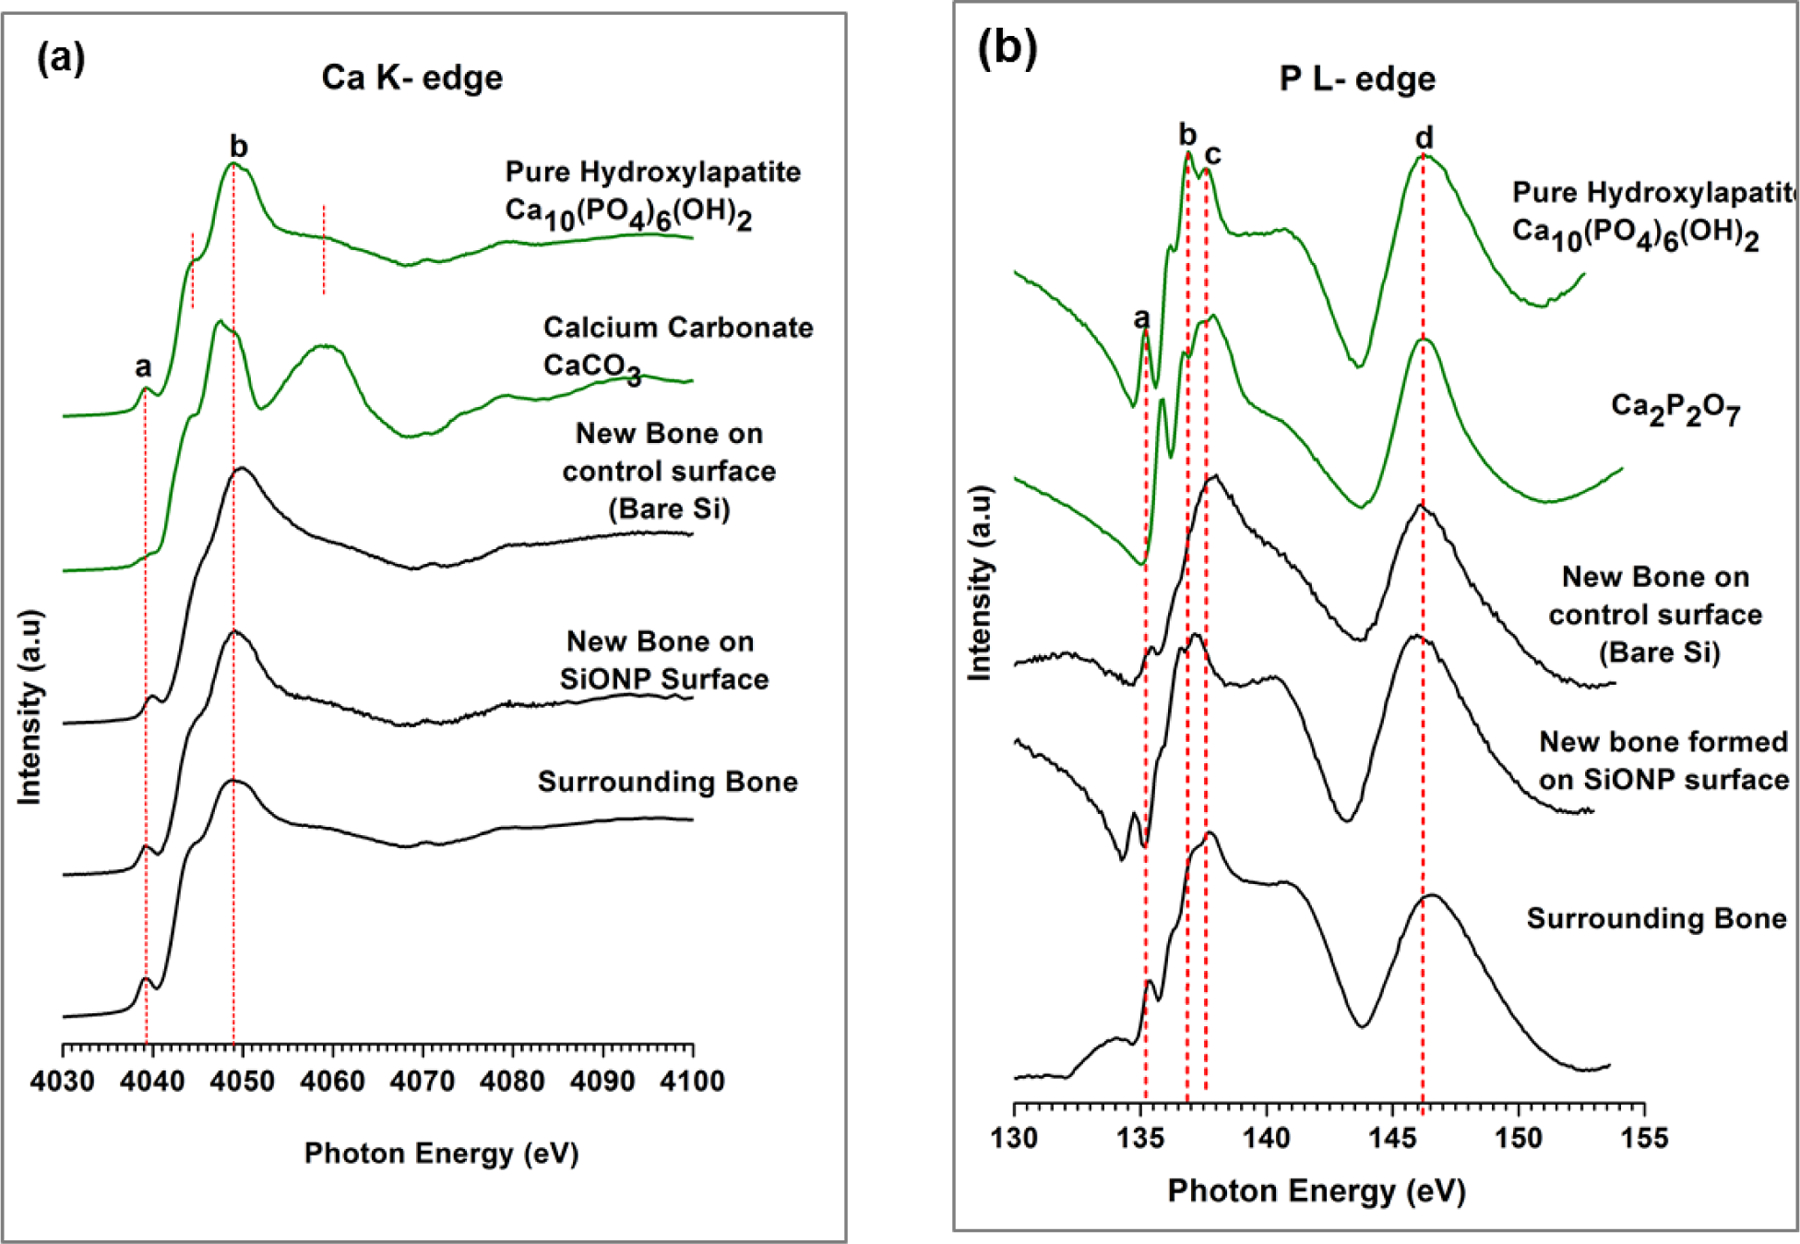
X-ray absorbance near edge structure (XANES) spectroscopy comparative data for newly formed bone and the surrounding bone with respect to HA model compounds. Bone-implant test samples were examined to determine the presence of calcium and phosphorus. XANES data shows the presence of Ca phosphates on the implant surface with newly grown bone. The data analysis also confirms that coordination chemistry for the newly grown bone exactly matches the surrounding bone.
The Ca K-edge data revealed that large abundance of Ca was present on the newly formed bone surface. The dominant chemistry of the found Ca was similar to hydroxyapatite (HA), which was apparent by the distinct peaks specific to HA. The Ca K edge peak of HA is different from other model compounds with a pre edge peak at 4039.1ev. It has a pre edge shoulder at 4044.4 and main peak b at 4048.27ev. The post edge shoulder represents transition to unoccupied states, mainly 5s states. The main edge peak b is assigned to 1s to 4p transition. The P L-edge data showed that the newly formed bone on SiONP samples was more like stable HA as evidenced by the intensity of phosphate specific peak d at 146.7eV. The shoulder after peak c (137.8 eV) is specific to Ca-phosphates, resulting from transitions from 2p of P to empty 3d orbitals of Ca. The presence of this shoulder indicates that the phosphates present on the surface are in the form of calcium phosphates/HA. It can be seen that control samples (substrate only) after in vivo implantation and recovery from the rat cranium showed a very weak post edge shoulder indicating that the Ca was not all coordinated in the form of HA, that was also evident from the smaller peak a. Whereas, the SiONP surfaces exhibited strong post-edge shoulder, which illustrates that the Ca was coordinated in the form of HA, indicating rapid mineralization impact of P and emphasizes the efficacy of SiONP coated surfaces for craniofacial implant applications.
4. Discussion
In this study, we tested the hypothesis that a novel SiONP-based silica network overlay can be used as an ion treatment strategy to enhance local tissue antioxidant production and calcium phosphate formation for angiogenic and osteogenic stimulation. In the first part of this study, we found that PECVD provided highly conformal and well-controlled SiONP thin film coatings where gas flows could be varied to control the N/P/O content ratios in the deposited film. Cell free in-vitro testing showed that film degradation rate was controlled by the surface chemistry (N/P/O ratio) formulated by PECVD process under optimized conditions and the ionic release period depended upon the thickness of the film. Higher N (lower O and P) content slows down the film degradation rate in physiological conditions. This may possibly be due to tightly packed trigonal structures formed by excessive N whereas higher O content contains predominately tetrahedral network that allow easy release of ionic species under physiological settings. Table II indicates that more silicon is found in solution than is found in the original SiONP coating for sample 5 and 6; this may be likely due to the simplified assumptions used for the thickness measurement. Despite its limitations, this simplified model of dissolution coating thickness allowed for the observation of interesting trends in the degradation rates of SiONP film with varying N/P/O ratios in surface chemistries.
In-vitro cell culture studies using SiONP coated test samples showed that these materials up-regulated the expression of SOD1, which induced downstream expression of other osteogenic markers including Runx2, Sp7, Smad1, Smad5 and collagen type 1. Though all the SiONP test surfaces showed enhanced expression of osteogenic markers when compared to glass cover slip or PECVD based amorphous silica (SiOx) but osteogenic markers expression was maximally enhanced at an optimal SiONP composition (sample 4) in which both the N and O were present in adequate amounts (moderate levels of N and O). Other surfaces where N or O content was too low didn’t show such an enhanced expression of osteogenic markers. Angiogenic cell-surface interaction using HUVEC cells also revealed that this optimal composition of SiONP formed thick and well-defined circular structures without incomplete branches on the surface within 6 hours. The increased thickness of vascular tubules formed on the SiONP surface possibly stemmed from the potent stimulation of pro-angiogenic genes including vegfa and enhancement of cell proliferation on the surface. This indicated that the presence of P promoted vascular tubules formation, which is also critically significant for normal and rapid healing of bone fractures. Moreover, bio-inspired surface topography enhanced the cell-surface interactions to have improved cell-attachment, cell-growth and differentiation. Therefore, the amorphous silica patterned surfaces showed a higher density of cells adhered as compared to flat glass surfaces. These results show that PECVD process can be tuned and tweaked to acquire amorphous silica-based biomaterial for an optimized release of Si and P that enhance osteogenic and angiogenic responses during bone healing process while the surface morphology augments bio-mechanical benefits to the bio-chemical impact of SiONP coated implants.
In-vivo testing showed that amorphous silica material SiONP (with moderate levels of N and O) coated onto implant surfaces induced rapid regeneration of bone within rat calvarial critical-sized fractures. The newly regenerated bone nearly completely closed the defect within 5 weeks (more than 50% of bone volume regenerated) whereas the control group showed no sufficient regeneration of bone over the same recovery time under similar conditions. The empty defect (fracture with no implant) also didn’t show any signs of healing and established that the defect was critical-sized defect and did require an external implant for complete bony union healing. XANES data showed the presence of Ca coordinated with phosphates indicated by characteristic peaks for HA. It also confirmed that the newly formed bone matched the coordination chemistry of the surrounding bone. Ca K-edge (Figure 10a) showed the presence of Ca on both sample surfaces after in vivo implantation for 5 weeks but P L-edge data revealed interesting information about the coordination of Ca with Phosphates. P L-edge data indicated that Ca was coordinated in the form of HA (indicated by strong shoulder after peak c) on SiONP test samples whereas the control surfaces didn’t show the presence of this shoulder, which is specific to HA formation. Though XANES provided valuable information on the coordination chemistry, it lacked quantitative comparison of the species present on the surface. This is where the Raman was employed to study, quantify and compare the content of phosphates and other species. While Raman spectroscopy permits analysis of biological samples without need for staining, fixation or sample preparation, but a relatively high-power laser beam is required to overcome the inherent low Raman scattering efficacy of biological molecules.45–46 The Raman data showed interesting results on bone maturity by quantifying the phosphate content indicated by proportional changes to v1PO43- peak intensity. As stated above, the full width half maximum of v1PO43- corresponds to c-axis length of crystal and hence relates to the maturity of the crystal. Raman spectra revealed that the mineralized content (v1PO43- peak intensity) was maximal at the boundaries of the surrounding bone with the newly generated bone and decreased as we moved towards the middle of the implanted sample. It also showed the presence of collagen specific peaks, Amide III, Amide I formation and CH2 deformation in the center of the implanted sample illustrating that new bone started growing over the implant surface. Altogether, Raman analysis confirmed the XANES data on the presence of phosphates and assessed the maturity of the newly grown bone by quantifying the mineralized content. It also implied the mechanism of bone regeneration for SiONP surface where early formation of HA stimulated the collagen synthesis followed by biomineralization leading to mature bone formation.
In this study, we have shown the effectiveness of PECVD-based SiONP material to enhance bone-healing in-vivo. Previously, we showed that PECVD-based amorphous silica materials were well-adherent to metal surfaces like titanium (Ti), which is the most commonly used material for permanent fixtures in fracture healing.9 Comparing XANES analysis for local coordination of new bone on silicon oxynitride surface SiON reported previously,18 the SiONP surfaces exhibited much stronger post-edge shoulder (after peak c (137.8 eV), specific to Ca-phosphates in P L-ege data) and indicated rapid mineralization impact of P present in the amorphous silica network. The osteogenic and angiogenic stimulation by ionic Si and P via SiONP coated metal implants can be used as an ion treatment strategy to hasten the healing phase of bone formation. The fixative metal implants that not only provide mechanical support but also enhance local tissue antioxidant production and calcium phosphate formation, can improve the efficacy of such overlaid implants in bone-implant systems. This study shows the first evidence of the combinatorial effect that ionic Si and P have on linking osteogenic and angeogenic responses to bone healing. This study will open a new horizon into our understanding of cations (like Si and P) and their role in bone regeneration when released in vivo from implant surfaces at optimized rates.
5. Conclusions
This study shows that incorporation of P and N into PECVD based amorphous silica network promotes osteogenesis and angiogenesis during critical-sized defect healing. The PECVD process gave conformal and well adherent SiONP overlays onto bioinspired patterned surfaces with moderate roughness (~1–2 μm). In-vitro evaluation of these SiONP-modified surfaces showed sustained ionic release for Si and P, and enhanced antioxidant activity by stimulating SOD1 which downstream upregulated several other osteogenic markers. SiONP surfaces also showed the formation of dense tubules with HUVEC cells that indicated the angiogenic support by these surfaces. In-vivo testing showed that SiONP-modified test samples were able to generate hard mineralized tissue to fill the interfacial gap between the bone and the implant surface whereas control surfaces (no coating) showed very less mineralized tissue with mostly collagenous fibers filling the interfacial gaps. The newly formed bone showed the formation of blood vessels and its coordination chemistry matched the surrounding bone, which designate that SiONP-modified implant surfaces promote osteogenesis and angiogenesis for rapid bone regeneration in critical size defects.
Acknowledgements
The authors would like to thank Ayano Shinohara and Tetsuro Odatsu for their assistance on cell culture studies. We also thank Philip Kramer, Gerald Hill and Priscilla Hooks for their help with animal studies and Connie Tillberg for her aid on histology. The authors are also thankful to the staff at Nanotechnology Research Center, University of Texas at Arlington for their assistance on device fabrication and characterization. XANES experiments were performed at the Canadian Light Source, Saskatoon, Canada, which is supported by NSERC, NRC, CIHR, and the University of Saskatchewan. The work was supported by a grant from National Institutes of Health (1R03DE023872–01A1) to V. G. Varanasi and partially supported by Departmental startup.
References:
- 1.Victoria G; Petrisor B; Drew B; Dick D, Bone stimulation for fracture healing: What’s all the fuss? Indian journal of orthopaedics 43, 2, 117 (2009). [DOI] [PMC free article] [PubMed] [Google Scholar]
- 2.Padilla S; Roman J; Sánchez-Salcedo S; Vallet-Regi M, Hydroxyapatite/SiO 2–CaO–P 2 O 5 glass materials: In vitro bioactivity and biocompatibility. Acta Biomater. 2, 3, 331–342 (2006). [DOI] [PubMed] [Google Scholar]
- 3.Feng J; Huang H; Lu Y; Ye L; Xie Y; Tsutsui T; Kunieda T; Castranio T; Scott G; Bonewald L, The Dentin matrix protein 1 (Dmp1) is specifically expressed in mineralized, but not soft, tissues during development. Journal of dental research 82, 10, 776–780 (2003). [DOI] [PubMed] [Google Scholar]
- 4.Liao J; Tian T; Shi S; Xie X; Ma Q; Li G; Lin Y, The fabrication of biomimetic biphasic CAN-PAC hydrogel with a seamless interfacial layer applied in osteochondral defect repair. Bone research 5, 17018 (2017). [DOI] [PMC free article] [PubMed] [Google Scholar]
- 5.Liao J; Shi K; Ding Q; Qu Y; Luo F; Qian Z, Recent developments in scaffold-guided cartilage tissue regeneration. Journal of biomedical nanotechnology 10, 10, 3085–3104 (2014). [DOI] [PubMed] [Google Scholar]
- 6.Zhou T; Li G; Lin S; Shi S; Liao J; Tian T; Huang Q; Lin Y, Fabrication of Electrospun 3D Nanofibrous Poly (3-Hydroxybutyrate-Co-4-Hydroxybutyrate)/Graphene Scaffolds for Potential Bone Tissue Engineering: Effects of Graphene on Scaffold Properties and Cellular Behaviors. Journal of Biomedical Nanotechnology 13, 7, 822–834 (2017). [Google Scholar]
- 7.Varanasi V; Velten M; Odatsu T; Ilyas A; Iqbal S; Aswath P, Surface Modifications and Surface Characterization of Biomaterials Used in Bone Healing. In Materials for Bone Disorders, Elsevier: 2017; pp 405–452. [Google Scholar]
- 8.Ma Q; Liao J; Tian T; Zhang Q; Cai X, A potential flower-like coating consisting of calcium-phosphate nanosheets on titanium surface. Chin. Chem. Lett 28, 9, 1893–1896 (2017). [Google Scholar]
- 9.Ilyas A; Lavrik NV; Kim HK; Aswath PB; Varanasi VG, Enhanced Interfacial Adhesion and Osteogenesis for Rapid “Bone-like” Biomineralization by PECVD-Based Silicon Oxynitride Overlays. ACS applied materials & interfaces 7, 28, 15368–15379 (2015). [DOI] [PMC free article] [PubMed] [Google Scholar]
- 10.Behrens K-M; Klinkenberg E-D; Finster J; Meiwes-Broer K-H, Geometric structure of thin SiO x N y films on Si (100). Surf. Sci 402, 729–733 (1998). [Google Scholar]
- 11.Ay F; Aydinli A, Comparative investigation of hydrogen bonding in silicon based PECVD grown dielectrics for optical waveguides. Opt. Mater 26, 1, 33–46 (2004). [Google Scholar]
- 12.Zachariasen WH, The atomic arrangement in glass. J. Am. Chem. Soc 54, 10, 3841–3851 (1932). [Google Scholar]
- 13.Kuiper A; Koo S; Habraken F; Tamminga Y, Deposition and composition of silicon oxynitride films. Journal of Vacuum Science & Technology B 1, 1, 62–66 (1983). [Google Scholar]
- 14.Varanasi VG; Leong KK; Dominia LM; Jue SM; Loomer PM; Marshall GW, Si and Ca individually and combinatorially target enhanced MC3T3-E1 subclone 4 early osteogenic marker expression. Journal of Oral Implantology 38, 4, 325–336 (2012). [DOI] [PMC free article] [PubMed] [Google Scholar]
- 15.Ling Y; Rios HF; Myers ER; Lu Y; Feng JQ; Boskey AL, DMP1 depletion decreases bone mineralization in vivo: an FTIR imaging analysis. Journal of Bone and Mineral Research 20, 12, 2169–2177 (2005). [DOI] [PMC free article] [PubMed] [Google Scholar]
- 16.Liebschner M; Wettergreen M, Optimization of bone scaffold engineering for load bearing applications. Topics in tissue engineering, 1–39 (2003). [Google Scholar]
- 17.Varanasi VG; Owyoung JB; Saiz E; Marshall SJ; Marshall GW; Loomer PM, The ionic products of bioactive glass particle dissolution enhance periodontal ligament fibroblast osteocalcin expression and enhance early mineralized tissue development. J. Biomed. Mater. Res., A 98, 2, 177–184 (2011). [DOI] [PMC free article] [PubMed] [Google Scholar]
- 18.Ilyas A; Odatsu T; Shah A; Monte F; Kim HK; Kramer P; Aswath PB; Varanasi VG, Amorphous Silica: A New Antioxidant Role for Rapid Critical‐Sized Bone Defect Healing. Advanced healthcare materials 5, 17, 2199–2213 (2016). [DOI] [PMC free article] [PubMed] [Google Scholar]
- 19.Varanasi VG; Ilyas A; Velten MF; Shah A; Lanford WA; Aswath PB, Role of Hydrogen and Nitrogen on the Surface Chemical Structure of Bioactive Amorphous Silicon Oxynitride Films. The Journal of Physical Chemistry B 121, 38, 8991–9005 (2017). [DOI] [PMC free article] [PubMed] [Google Scholar]
- 20.Reffitt D; Ogston N; Jugdaohsingh R; Cheung H; Evans BAJ; Thompson R; Powell J; Hampson G, Orthosilicic acid stimulates collagen type 1 synthesis and osteoblastic differentiation in human osteoblast-like cells in vitro. Bone 32, 2, 127–135 (2003). [DOI] [PubMed] [Google Scholar]
- 21.Varanasi V; Saiz E; Loomer P; Ancheta B; Uritani N; Ho S; Tomsia A; Marshall S; Marshall G, Enhanced osteocalcin expression by osteoblast-like cells (MC3T3-E1) exposed to bioactive coating glass (SiO 2–CaO–P 2 O 5–MgO–K 2 O–Na 2 O system) ions. Acta biomaterialia 5, 9, 3536–3547 (2009). [DOI] [PMC free article] [PubMed] [Google Scholar]
- 22.Hoppe A; Güldal NS; Boccaccini AR, A review of the biological response to ionic dissolution products from bioactive glasses and glass-ceramics. Biomaterials 32, 11, 2757–2774 (2011). [DOI] [PubMed] [Google Scholar]
- 23.Maehira F; Iinuma Y; Eguchi Y; Miyagi I; Teruya S, Effects of soluble silicon compound and deep-sea water on biochemical and mechanical properties of bone and the related gene expression in mice. Journal of bone and mineral metabolism 26, 5, 446–455 (2008). [DOI] [PubMed] [Google Scholar]
- 24.Julien M; Magne D; Masson M; Rolli-Derkinderen M; Chassande O; Cario-Toumaniantz C; Cherel Y; Weiss P; Guicheux J, Phosphate stimulates matrix Gla protein expression in chondrocytes through the extracellular signal regulated kinase signaling pathway. Endocrinology 148, 2, 530–537 (2007). [DOI] [PMC free article] [PubMed] [Google Scholar]
- 25.Nishino J; Yamazaki M; Kawai M; Tachikawa K; Yamamoto K; Miyagawa K; Kogo M; Ozono K; Michigami T, Extracellular Phosphate Induces the Expression of Dentin Matrix Protein 1 Through the FGF Receptor in Osteoblasts. J. Cell. Biochem 118, 5, 1151–1163 (2017). [DOI] [PubMed] [Google Scholar]
- 26.Saghiri MA; Asatourian A; Orangi J; Sorenson CM; Sheibani N, Functional role of inorganic trace elements in angiogenesis—Part I: N, Fe, Se, P, Au, and Ca. Critical reviews in oncology/hematology 96, 1, 129–142 (2015). [DOI] [PubMed] [Google Scholar]
- 27.Lin Y; McKinnon KE; Ha SW; Beck GR, Inorganic phosphate induces cancer cell mediated angiogenesis dependent on forkhead box protein C2 (FOXC2) regulated osteopontin expression. Molecular carcinogenesis 54, 9, 926–934 (2015). [DOI] [PMC free article] [PubMed] [Google Scholar]
- 28.Camalier CE; Yi M; Yu LR; Hood BL; Conrads KA; Lee YJ; Lin Y; Garneys LM; Bouloux GF; Young MR, An integrated understanding of the physiological response to elevated extracellular phosphate. J. Cell. Physiol 228, 7, 1536–1550 (2013). [DOI] [PMC free article] [PubMed] [Google Scholar]
- 29.Jeon H; Simon CG; Kim G, A mini‐review: Cell response to microscale, nanoscale, and hierarchical patterning of surface structure. Journal of Biomedical Materials Research Part B: Applied Biomaterials 102, 7, 1580–1594 (2014). [DOI] [PubMed] [Google Scholar]
- 30.Seunarine K; Curtis AS; Meredith D; Wilkinson CD; Riehle M; Gadegaard N, A hierarchical response of cells to perpendicular micro-and nanometric textural cues. NanoBioscience, IEEE Transactions on 8, 3, 219–225 (2009). [DOI] [PubMed] [Google Scholar]
- 31.Asghar W; Kim Y-T; Ilyas A; Sankaran J; Wan Y; Iqbal SM, Synthesis of nano-textured biocompatible scaffolds from chicken eggshells. Nanotechnology 23, 47, 475601 (2012). [DOI] [PubMed] [Google Scholar]
- 32.Albrektsson T; Wennerberg A, Oral implant surfaces: Part 1--review focusing on topographic and chemical properties of different surfaces and in vivo responses to them. The International journal of prosthodontics 17, 5, 536–543 (2003). [PubMed] [Google Scholar]
- 33.Ventre M; Natale CF; Rianna C; Netti PA, Topographic cell instructive patterns to control cell adhesion, polarization and migration. Journal of The Royal Society Interface 11, 100, 20140687 (2014). [DOI] [PMC free article] [PubMed] [Google Scholar]
- 34.Beck GR; Moran E; Knecht N, Inorganic phosphate regulates multiple genes during osteoblast differentiation, including Nrf2. Experimental cell research 288, 2, 288–300 (2003). [DOI] [PubMed] [Google Scholar]
- 35.Chung C-H; Golub EE; Forbes E; Tokuoka T; Shapiro IM, Mechanism of action of β-glycerophosphate on bone cell mineralization. Calcified Tissue International 51, 4, 305–311 (1992). [DOI] [PubMed] [Google Scholar]
- 36.Olesik JW, Elemental analysis using ICP-OES and ICP/MS. Anal. Chem 63, 1, 12A–21A (1991). [Google Scholar]
- 37.Robertson Z An in vitro study of the effect of silicon and magnesium ions on bone repair and angiogenesis. University of Aberdeen, 2009. [Google Scholar]
- 38.Demirkiran H; Hu Y; Zuin L; Appathurai N; Aswath PB, XANES analysis of calcium and sodium phosphates and silicates and hydroxyapatite–Bioglass® 45S5 co-sintered bioceramics. Materials Science and Engineering: C 31, 2, 134–143 (2011). [Google Scholar]
- 39.Eiden-Assmann S; Viertelhaus M, In-situ XANES spectroscopy at the Ca K edge of calcium phosphate compounds. HASYLAB-Jahresbericht: (1999). [Google Scholar]
- 40.Wang C; Eisa M; Jin W; Shen H; Mi Y; Gao J; Zhou Y; Yao H; Zhao Y, Age-related elemental change in bones. Nuclear Instruments and Methods in Physics Research Section B: Beam Interactions with Materials and Atoms 266, 8, 1619–1622 (2008). [Google Scholar]
- 41.Kruse J; Leinweber P; Eckhardt K-U; Godlinski F; Hu Y; Zuin L, Phosphorus L2, 3-edge XANES: overview of reference compounds. Journal of synchrotron radiation 16, 2, 247–259 (2009). [DOI] [PubMed] [Google Scholar]
- 42.Philipp H, Optical properties of non-crystalline Si, SiO, SiOx and SiO2. J. Phys. Chem. Solids 32, 8, 1935–1945 (1971). [Google Scholar]
- 43.Jones JR; Sepulveda P; Hench LL, Dose‐dependent behavior of bioactive glass dissolution. Journal of biomedical materials research 58, 6, 720–726 (2001). [DOI] [PubMed] [Google Scholar]
- 44.Idris I; Sugiura O, Film characteristics of low-temperature plasma-enhanced chemical vapor deposition silicon dioxide using tetraisocyanatesilane and oxygen. Japanese journal of applied physics 37, 12R, 6562 (1998). [Google Scholar]
- 45.Notingher I; Jell G; Notingher PL; Bisson I; Tsigkou O; Polak JM; Stevens MM; Hench LL, Multivariate analysis of Raman spectra for in vitro non-invasive studies of living cells. Journal of molecular structure 744, 179–185 (2005). [Google Scholar]
- 46.Puppels G; De Mul F; Otto C; Greve J; Robert-Nicoud M; Arndt-Jovin D; Jovin T, Studying single living cells and chromosomes by confocal Raman microspectroscopy. nature 347, 301–303 (1990). [DOI] [PubMed] [Google Scholar]


