

Abstract

Severe acute respiratory syndrome coronavirus 2 (SARS-CoV-2) is the viral agent that is responsible for the coronavirus disease-2019 (COVID-19) pandemic. One of the live virus vaccine candidates Merck and Co., Inc. was developing to help combat the pandemic was V590. V590 was a live-attenuated, replication-competent, recombinant vesicular stomatitis virus (rVSV) in which the envelope VSV glycoprotein (G protein) gene was replaced with the gene for the SARS-CoV-2 spike protein (S protein), the protein responsible for viral binding and fusion to the cell membrane. To assist with product and process development, a quantitative Simple Western (SW) assay was successfully developed and phase-appropriately qualified to quantitate the concentration of S protein expressed in V590 samples. A strong correlation was established between potency and S-protein concentration, which suggested that the S-protein SW assay could be used as a proxy for virus productivity optimization with faster data turnaround time (3 h vs 3 days). In addition, unlike potency, the SW assay was able to provide a qualitative profile assessment of the forms of S protein (S protein, S1 subunit, and S multimer) to ensure appropriate levels of S protein were maintained throughout process and product development. Finally, V590 stressed stability studies suggested that time and temperature contributed to the instability of S protein demonstrated by cleavage into its subunits, S1 and S2, and aggregation into S multimer. Both of which could potentially have a deleterious effect on the vaccine immunogenicity.
1. Introduction
Severe acute respiratory syndrome coronavirus 2 (SARS-CoV-2), the causative agent for coronavirus disease-2019 (COVID-19), is responsible for the COVID-19 pandemic. From December 2019 to June 2022, SARS-CoV-2 has caused ∼542 million confirmed cases of COVID-19 and ∼6.3 million deaths making it one of the most infectious, but not lethal, diseases in human history.1
SARS-CoV-2 is an enveloped, positive-sense single-stranded RNA virus with a genome size of ∼26 to 32 kilobases.2 SARS-CoV-2 is a member of the family Coronaviridae and genus Betacoronavirus which includes SARS-CoV.3,4 SARS-CoV-2 is slightly distant from SARS-CoV sharing ∼79% genomic identity.3,4 SARS viruses gain entrance to the host via epithelial cells lining the respiratory tract. Upon infection, the clinical manifestations of the viruses can vary from asymptomatic to severe disease with possible symptoms including, but not limited to, fever, fatigue, dry cough, pneumonia, dyspnea, multiorgan failure, and death.5
SARS-CoV-2 uses a trimeric, heavily N-glycosylated, surface spike glycoprotein (S protein) to mediate cellular binding, via the angiotensin-converting enzyme 2 receptor (ACE2), and cell fusion.6,7 Each S-protein monomer is made up of two domains, S1 and S2, where S1 is required for viral attachment and S2 is used for membrane fusion.6,8 The S1 domain contains the receptor-binding domain (RBD) that binds to the ACE2 receptor attaching the virus to the cell.9,10 Before cell fusion via S2, the S2 subunit must be “primed.” The S protein contains two cleavage sites important for infection, a multibasic arginine-rich area between S1/S2 and a site within S2 known as S2′, that must be cleaved for successful cell fusion and infection.11−15 Upon successful cleavage, the fusion peptide, located within S2, will insert into the host cell membrane and initiate the viral and cell membrane fusion process.16
Since the S protein is used for virus attachment and fusion, it is a prime target for therapeutics and vaccines to treat or prevent infection. During Merck & Co, Inc.’s COVID vaccine development, one of the live virus candidates being pursued was V590. V590 utilized the same chimeric vaccine technology as our successful ERVEBO program, also known as V920, that has already been previously described.17 In short, V590 utilized a live-attenuated, replication-competent, recombinant vesicular stomatitis virus (rVSV) where the envelope VSV glycoprotein (G protein) gene was replaced with the S-protein gene to express the S protein on the surface of virions to try to elicit a strong immune response.18 V920 is considered a safe and well-tolerated vaccine that elicits a strong immunogenicity response translating to a very efficacious vaccine, >95% efficacy.17,19,20 The strong immunogenicity response is maintained for 24 months, suggesting potential lasting immunity.19 As V920 is a very safe and efficacious vaccine with a relatively long-lasting response, the rVSV approach could be utilized for SARS-CoV-2 to provide a similar strong, long-lasting humoral response that could help limit SARS-CoV-2 infection. Since the S protein was the immunogen in this vaccine, an assay needed to be developed to characterize the S protein in the product.
Western blotting is an important immunoassay technique that is used to qualitatively determine the relative amount of a protein in a sample. However, absolute quantitation of the S protein is required and absolute quantitative data from a traditional western blot is unreliable due to protein recovery problems when transferring proteins from a sodium dodecyl sulfate-polyacrylamide gel electrophoresis (SDS-PAGE) gel to a membrane. A relatively new technology called Simple Western (SW), developed by ProteinSimple, eliminates the recovery issue by performing all traditional western blot steps in a capillary.21 The SW technology has been previously described and has been applied for various vaccine developments.22−26 Major advantages of SW technology over previous methodologies are it is fast, automated, and quantitative. In short, samples are loaded directly into a capillary via hydrodynamic injection and all subsequent steps (protein separation, blocking, antibody probing, substrate detection) are performed in the capillary effectively eliminating the recovery issue from a traditional western blot. This makes the SW technology a truly quantitative western blot assay that can be used to measure the concentration of a particular protein in a sample.
Drancourt et al. developed a qualitative SARS-CoV-2 Simple Western assay to determine if human serum samples contained anti-SARS-CoV-2 antibodies.27 However, it lacks the ability to quantify the amount of S protein in a sample nor can it be used to understand the relative quantities of the various states of the S protein. In this paper, we discuss the successful development and qualification of a quantitative SW assay to measure the concentration of S protein in V590 drug substance (DS), drug product (DP), and process intermediates. In addition, we discuss the ability of the assay to measure the relative quantities of S protein, its subunit S1, and S multimer in the V590 vaccine candidate and its connection to process and product development. Finally, the correlation between S protein and potency is discussed and its relationship to product stability.
2. Experimental Section
2.1. V590 COVID-19 Vaccine and Commercial Reagents
The downstream purification process for V590 production has been previously described.28 In brief, the V590 COVID-19 vaccine replaced the G-protein gene in rVSV with the S-protein gene and it was produced in Vero cells in a single-use bioreactor containing Cytodex-1 γ-irradiated microcarriers (Cytiva) and GIBCO VP-SFM media (Thermo Fisher Scientific, Inc.) supplemented with l-glutamine and P-188. Ninety min before harvest, Benzonase endonuclease (MilliporeSigma, MA) and magnesium chloride were added directly to the bioreactor to final concentrations of 60 U/mL and 2 mM, respectively. Forty-eight h post infection, the material was harvested using a Harvestainer microcarrier separation system (Thermo Fisher Scientific Inc.). The cell culture harvested viral fluids (HVFs) were clarified using a Sartoclean CA 3 μm|0.8 μm filter (Sartorius Stedim Biotech GmbH, Goettingen, Germany). The clarified bulk material (CB) was purified using Capto Core 700 resin chromatography (Cytiva). The Capto Core flowthrough product pool (CCP) underwent a ultrafiltration/diafiltration (UF/DF) step where the material was concentrated, ultrafiltration concentrated retentate (UFCR), and buffer exchanged, ultrafiltration product (UFP). The permeate produced from the UF/DF step was ultrafiltration concentrated permeate (UFCP). Proprietary stabilizers were added to the UFP material to produce the formulated product (FP). Finally, if all previous steps were performed aseptically or with sterile, closed processing, FP material is considered DS. Otherwise, FP was filtered twice; first through a nominal 0.4 μm bioburden reduction filter (BRFP), followed by a nominal 0.2 μm sterile filter (SFP) to make the DS (i.e., SFP is the DS). A flowchart has been provided for reference (see Figure S1).
Secondary antibodies (goat anti-rabbit-HRP conjugate, goat anti-mouse-HRP conjugate), dithiothreitol (DTT), molecular weight fluorescent standards, luminol-S, hydrogen peroxide, 10× sample buffer, antibody diluent II, wash buffer, 12–230 kDa plate prefilled with stacking matrix and separation buffer, and capillaries were purchased from ProteinSimple (Santa Clara, CA). The recombinant SARS-CoV-2 spike protein S1 and S2 subunits expressed in Escherichia coli were purchased from RayBiotech (Peachtree Corners, GA), while S1 and S2 subunits plus S protein expressed in HEK293 were purchased from ABclonal (Woburn, MA). The anti-S1 rabbit pAb and anti-S2 rabbit pAb were purchased from Sino Biological US (Wayne, PA). Peptide-N-glycosidase-F enzyme (PNGase-F) was purchased from Sigma (St. Louis, MO). Additional S-protein antibodies screened were purchased from Genetex (Irvine, CA), ProSci (Fort Collins, CA), and Active Motif (Carlsbad, CA).
2.2. S-Protein Simple Western Assay
S-protein reference standard material (ABclonal, Cat # RP01260MT) and vaccine samples were treated with 2× master mix solution prepared from the EZ Std kit Pack 1 12–230 kDa (ProteinSimple), which contains SDS and DTT. Treated samples were heated at 90 °C for 10 min to denature samples.
Undiluted antibody diluent 2 (ProteinSimple) was used for blocking nonspecific binding. Diluted primary anti-S-protein antibodies (Genetex, Sino Biological, ProSci, and Active Motif) and undiluted horseradish peroxidase conjugated secondary mouse/rabbit antibodies were used for probing the S protein. Luminol and peroxide substrate reagents were diluted 1:1 and used for detection.
All samples and reagents were loaded onto 12–230 kDa separation plates and hydrodynamically injected into capillary cartridges. Plates were analyzed using the Wes and Jess Simple Western instrument models, and data were acquired via a CCD camera. All data were analyzed using the Compass for Simple Western software (ProteinSimple). Appropriate exposure times were set to ensure maximum signal while avoiding burnout.
2.3. PNGase Treatment Conditions
V590 sample or wild-type recombinant S protein was mixed with 500 units/mL PNGase-F solution or water in a 2:1 ratio and incubated at 37 °C for 2 h. After incubation, samples were mixed with 2× master mix solution prepared from the EZ Std kit Pack 1 12–230 kDa and heated at 90 °C for 10 min to denature samples and inactivate PNGase enzyme. Simple Western was performed as stated in Section 2.2.
2.4. Qualification Summary and Statistical Analysis
A summary of the overall qualification study design is displayed (Table 1). The following parameters were evaluated in the qualification of the quantitative S-protein Simple Western assay: repeatability, intermediate precision, linearity, accuracy, specificity, range, and limit of quantitation (LOQ). A reportable result is defined as the average of three individually prepared replicates.
Table 1. Summary of the S-Protein SW Qualification Designa.
| parameter evaluated | no. of reportable results | brief execution plan |
|---|---|---|
| linearity | 18 | V590 DS sample was diluted across the entire range of the standard curve and the linearity of the assay was assessed via coefficient of determination and dilution bias |
| accuracy | 12 (3 per spike level) | known concentrations of S protein were spiked into the V590 DS vaccine sample and the percent recovery was evaluated |
| repeatability | 18 | V590 DS sample was repeatedly tested with minimal interassay variations (i.e., same analyst, same day) to assess intra-assay variability |
| intermediate precision | 24 | V590 DS sample was tested in four separate runs conducted across four different days (one each day) varying analyst, instrument, and primary antibody lot |
| specificity | 2 | substituted DS and DP matrix placebo buffers for sample to observe for matrix interference effects |
Range and LOQ were determined based on the results from linearity, accuracy, and repeatability.
The precision of an analytical procedure expresses the closeness of agreement (degree of scatter) between a series of measurements obtained from multiple sampling of the same homogeneous sample under the prescribed conditions.29 In this qualification, it included repeatability (within-in plate variability, denoted sintra2) and intermediate precision (total variability, denoted stotal2, which includes repeatability plus variability associated with changes in day, analyst, plate, instrument, and antibody lot). A variance component analysis on the logarithm-transformed concentrations was performed to estimate repeatability and intermediate precision, expressed as % relative standard deviation (%RSD), using the following formulas:
The linearity of an analytical procedure is its ability (within a given range) to obtain test results which are directly proportional to the concentration (amount) of the analyte in the sample.29 A V590 DS sample was diluted across the entire range of the standard curve, and the linearity of the assay was assessed in two ways. First, the raw signal from each reportable result at each dilution level across the standard curve was plotted against 1/dilution factor. The coefficient of determination (R2) was calculated across all runs. Second, a linear regression analysis was performed using log-transformed interpolated concentrations as the dependent variable and log-transformed reciprocal of the dilution as the independent variable to determine the intercept, slope, and coefficient of determination. Dilution bias was calculated as % proportional bias, which is defined as
where b is the estimated slope from the linear regression analysis described above.
The accuracy of an analytical procedure expresses the closeness of agreement between values accepted either as the conventional true value or as an accepted reference value and the value found.29 To assess accuracy, known levels of S protein were spiked into the V590 DS vaccine sample and the percent recovery was calculated for each spike level using the following formula:
where Cspike is the measured S-protein concentration of the spiked sample, Cendogeneous is the measured S-protein concentration of the endogeneous level in the sample, and Ctheoretical spike is the theoretical S-protein concentration spiked into the sample.
Upon completion of the qualification testing, all statistical analyses were performed utilizing JMP version 14, SAS Institute.
2.5. Stability of V590 COVID-19 Vaccine
V590 DS material aliquots were stored at various temperatures (−70, 4, 22, 37, and 45 °C) and pulled at various time points (3, 5, 13, 15, 19, 37, 60, 150, and 240 days) for testing. The qualitative profile assessment of the S protein was monitored by the Simple Western assay described herein.
2.6. V590 Vaccine Potency by μPlaque Assay Cell Culture
The African green monkey kidney Vero cell line was sourced from internal cell banks, grown and maintained in T175 flasks (Corning) cultured with Dulbecco’s modified Eagle media (DMEM)/high glucose (Gibco) supplemented with 10% fetal bovine serum (FBS) (ATCC) and 1% Pen-Strep (Gibco) in a >90% relative humidified incubator at 37 °C with 5% pCO2. Cells were dissociated using 0.25% Trypsin-EDTA for 4 ± 2 min at 37 °C, 5% pCO2, and >90% rH and quenched with DMEM/high glucose (10% FBS, 1% Pen-Strep). Dissociated cells from multiple flasks were pooled and resuspended in DMEM/high glucose (10% FBS, 1% Pen-Strep). Cell viability was determined before seeding or passaging with a Cedex automated cell counter and trypan blue (Roche).
2.7. μPlaque Assay
Viral potency measurements were determined using a μplaque method, an automated, miniaturized plaque assay, where viral plaques are grown and then counted using fluorescence microscopy. Vero cells were seeded in DMEM/high glucose (2% FBS, 1% Pen-Strep) at 40 000 cells per well in 96-well tissue culture microplates (Corning). Cells were allowed to attach overnight and incubated at 37 °C, 5% pCO2, and >90% rH. Plant media were aspirated from tissue culture plates before infection. Viral inoculum (serially diluted virus) was transferred to the 96-well plate containing a confluent cell layer (target >90% confluence) and incubated at 37 °C, 5% pCO2, and >90% rH. After 4 h viral attachment, overlay medium comprised of DMEM/high glucose (10% FBS, 1% Pen-Strep, 1% methyl cellulose (Fisher Chemical)) was added to inhibit viral secretion and spread. Following an additional 24 h infection incubation at 37 °C, 5% pCO2, and >90% rH, the overlay medium was aspirated from the plate, followed by cell fixation using 3.7% formaldehyde (Sigma) for 30 min at ambient temperature. Formaldehyde was aspirated from the plate and phosphate-buffered saline (Cytiva HyClone) added and held at ambient temperature. Cells were permeabilized with 0.5% Triton for 20 min at ambient temperature. Permeabilization buffer was aspirated from the plate and simultaneously blocked with 0.1% Tween-20 and 1% bovine serum albumin in PBS (Teknova) and stained with 1 μg/mL Hoechst 33342 for nuclear DNA (Invitrogen) for 30 min at ambient temperature. Hoechst stain was aspirated, and cells were immunostained with 1 μg/mL SARS-CoV-2 spike neutralizing rabbit monoclonal antibody (Sino Biological) and incubated for 1 h at ambient temperature. Plates were washed with 0.1% Tween-20 in PBS (Sigma) for three cycles and then 1:100 diluted Alexa Fluor 488 AffiniPure Donkey Anti-Rabbit IgG (Jackson Immunoresearch) was added and incubated for 1 h at ambient temperature. Plates were washed with 0.1% Tween-20 in PBS (Sigma) for three cycles and PBS was added to plates following immunostaining. Automated image acquisition was completed using a PerkinElmer EnSight reader, and plaques partitioned and counted using Kaleido software. Plaque titer calculated using the equation as described
where PFU is equivalent to the plaque forming units and DF is the dilution factor.
3. Results and Discussion
3.1. S-Protein Simple Western Assay Development
The primary antibody is critical for a successful quantitative Simple Western assay. Hence, several commercial anti-spike protein antibodies were screened against V590 material (see Table S1 and Figure S2A–F). Anti-SARS-CoV-2 spike/receptor-binding domain rabbit polyclonal antibody (Sino Biological/40592-T62) generated the strongest response against neat V590 material with three peaks at 170 kDa (S1 subunit), 230 kDa (S protein), and 312 kDa (S multimer) and was selected for further analysis (Figure 1B top trace). This antibody will be referred to herein as anti-S1-protein antibody. Similarly, several anti-S2 antibodies were screened against the V590 vaccine material, and rabbit polyclonal antibody (Sino Biological/40590-T62) produced the strongest signal with peaks at 135 kDa (S2 subunit), 230 kDa (S protein), and 312 kDa (S multimer) (Figure 1B middle trace). This antibody will be referred to herein as anti-S2-protein antibody. V590 material was probed with both anti-S1 and anti-S2 antibodies and the S multimer, S, S1, and S2 peaks were all detected (Figure 1B bottom trace). A virtual blot-like image for the electropherograms from Figure 1B is included (Figure 1A).
Figure 1.
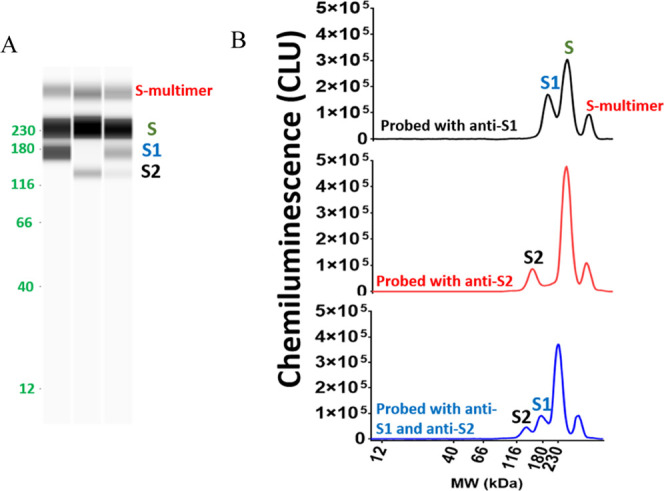
V590 vaccine HVF material was assayed with anti-S1 and/or anti-S2 using the Simple Western technology to confirm the presence of S protein and its subunits, S1 and S2, in rVSV; (A) virtual blot-like image and (B) electropherograms of S protein in V590 samples. Peak assignments were confirmed using recombinant forms of S protein, S1 subunit, and S2 subunit (Figure S3). CLU: chemiluminescence units.
The observed peak assignments were confirmed by antibody epitope binding to recombinant S1 subunit, S2 subunit, and S protein. S1 recombinant protein, recombinant spike protein receptor-binding domain (RBD) and S2 recombinant protein were assessed with anti-S1-protein antibody to determine the antibody’s epitope binding region within the S protein. A clear signal was observed in the S1 protein and RBD protein but not the S2 recombinant protein, suggesting that the antibody binds to the RBD within the S1 subunit of the S protein (see Table S2 and Figure S3). A similar experiment was performed to confirm the specificity of the anti-S2 antibody. A clear signal was observed in the S2 recombinant protein, but not the S1 recombinant protein nor the RBD, suggesting that the antibody binds to the S2 subunit of the S protein (see Table S2 and Figure S3).
Furthermore, peak identifications were assessed through molecular weight (MW) alignment and PNGase-F enzyme treatment. The MWs of the peaks identified in the V590 material were much larger than the theoretical molecular weights of S protein or S-protein subunits. This was not unexpected as glycoproteins do not bind the same detergent/protein constant ratio as glycan-free proteins resulting in slower migration in the gel.30−33 The extent of this MW shift is governed by the number of glycan sites, and since the S protein contains a total of 22 N-linked glycosylation sites (S1 has 13 N-linked glycans and S2 has 9 N-linked glycans), a large shift is likely.6 V590 material was treated with PNGase-F to remove N-linked oligosaccharides to determine the extent to which the N-linked glycans influenced the migration of the proteins in the separation matrix. The apparent MWs of the S protein, S1 subunit, and S2 subunit from the glycosylated V590 material shifted to lower MW after PNGase-F treatment (Figure 2). In addition, this was demonstrated in wild-type recombinant S protein as well (Figure S4A). Importantly, the MWs of the S protein, S1 protein, and S2 protein from V590 after deglycosylation aligned well with their expected theoretical MWs confirming the S, S1, and S2 protein peak identities in the V590 material (Table 2).34
Figure 2.
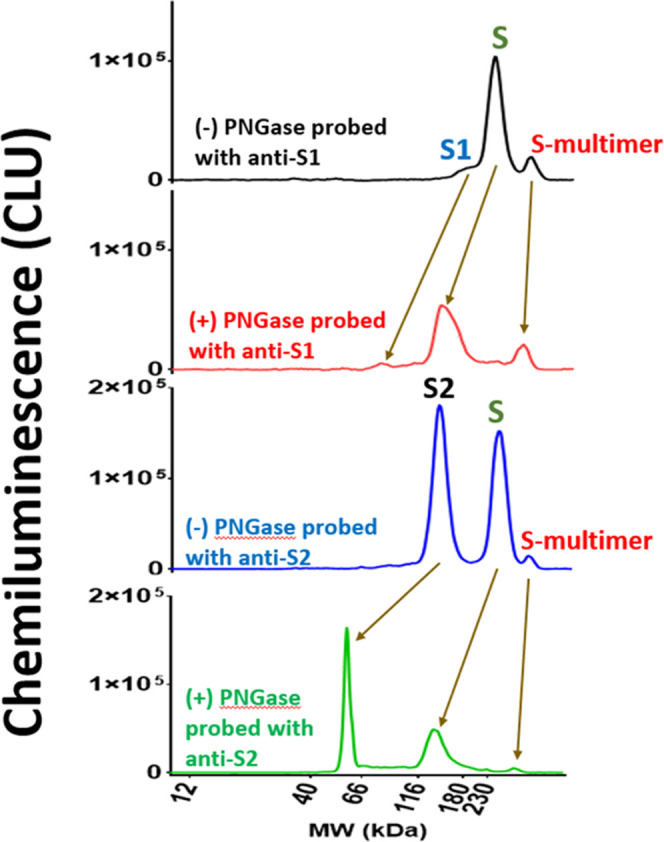
V590 DS material was treated with 500 U/mL PNGase-F treatment to remove the N-linked glycans. Electropherograms of control and PNGase-treated material assayed with anti-S1 and anti-S2 antibodies are displayed. Similar experiment was conducted for glycosylated recombinant S protein (Figure S4). CLU: chemiluminescence units.
Table 2. Molecular Weights of Theoretical, Glycosylated, and Deglycosylated S Protein, S1, and S2 Subunits in the V590 Material.
| peak identity | glycosylated V590 MW – control (kDa) | deglycosylated V590 MW – PNGase treated (kDa) | approximate deglycosylated theoretical MW (kDa) | no. of N-linked glycan sites |
|---|---|---|---|---|
| S protein | 227 | 136 | 135 | 22 |
| S1 subunit | 167 | 72 | 75 | 13 |
| S2 subunit | 135 | 60 | 64.5 | 9 |
Importantly, it has been reported that there is an increase in apparent MW by 8–9 kDa per N-linked glycan using this Simple Western technology.35 As a result, the observed MW for S protein at 230 kDa might not reflect the true apparent MW since it is close to the upper limit of the separation matrix (12–230 kDa). V590 was run using a separation matrix with a higher MW limit (66–440 kDa) which, indeed, showed a larger apparent MW for the S protein (see Figure S4B). The MW shift of deglycosylated S1 subunit and S protein using the 66–440 kDa separation matrix was ∼8 kDa per N-linked glycan which is in relatively close agreement with the 8–9 kDa/N-linked glycan shift previously observed using the Simple Western technology.35 This data suggests that the S protein in V590 contains all expected 22 N-linked glycans.
3.2. S-Protein Assay Qualification
Upon completion of assay development, the S-protein Simple Western assay using the anti-S1 antibody was qualified to support the characterization testing of V590 DS, DP, and process intermediate samples. The following parameters were evaluated during the qualification: precision (repeatability and intermediate precision), linearity, accuracy, specificity, and limit of quantitation (LOQ).
3.2.1. Precision
The overall precision of the method was evaluated which included repeatability and intermediate precision. For repeatability, V590 DS material was diluted along the entire range of the standard curve to assess variability of the curve. For intermediate precision, V590 DS material was assayed varying the day, analyst, plate, instrument, and antibody lot. The calculations for repeatability and intermediate precisiona can be found in Section 2.4. At the completion of the qualification studies, the method generated a 12.3% RSD for repeatability and 13.8% RSD for intermediate precision. This precision is good for an immunoassay in vaccine production as the typical precision criterion for a ligand-binding assay (i.e., immunoassay) is ≤20% RSD.36 Therefore, this method generated acceptable precision data further ensuring the reliability of the method (Table 3).
Table 3. Summary of S-Protein SW Qualification Results.
| performance characteristic | results | |
|---|---|---|
| repeatability | 12.3% RSD | |
| intermediate precision (including day, analyst, instrument, and primary antibody lot) | 13.8% RSD | |
| linearity | R2 = 0.997 | |
| % proportional bias = 6.62% | ||
| accuracy | spike level (ng/mL) | average % recovery |
| 6.25 | 62% | |
| 12.5 | 84% | |
| 50 | 102% | |
| 100 | 95% | |
| specificity | no peaks present in DS or DP placebo sample electropherogram ≥6.25 ng/mL standard | |
| range (ng/mL) | 6.25–100 | |
| limit of quantitation (LOQ) (ng/mL) | 6.25 | |
3.2.2. Linearity
After confirmation of peak identities, the linear range of this assay needed to be established to quantitate the concentration of S protein in V590 samples. Proline-stabilized mutant S protein (ABclonal, cat # RP01260MT) was used as the S-protein reference standard since the S protein is stabilized from cleavage. A range from 6.25 to 100 ng/mL of S protein was established as the standard curve range with a strong linear relationship (Figure 3). At the completion of the qualification studies, the method generated acceptable linearity data (Table 3).
Figure 3.
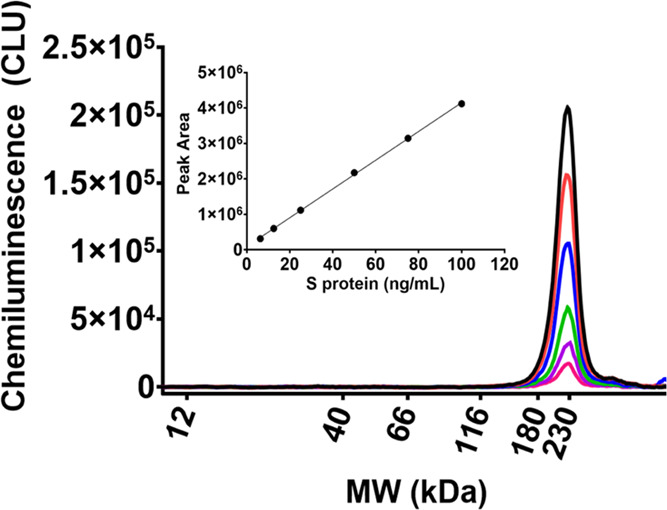
Stabilized recombinant S protein was used as the reference standard for the S-protein mass assay to quantify S protein in V590 samples. A standard curve was established from 6.25 to 100 ng/mL CLU: chemiluminescence units.
3.2.3. Accuracy
A spiking study was conducted to measure the accuracyb of this method over the entire standard curve range. V590 DS material was spiked with known concentrations of the S-protein reference standard and % accuracy was calculated as per Section 2.4. The method generated outstanding recovery between 80 and 120% from 12.5 up to 100 ng/mL. However, the recovery at 6.25 ng/mL, the lower end of the curve, had a lower recovery of 62%. This recovery was still acceptable because the concentrations of spike protein in the drug substance and drug product are >3 logs higher in concentration than this point. Additional statistical analysis was performed on the % recoveries at each spike level, including the standard deviation and the 95% confidence intervals, providing further support for the accuracy of this method (Table S3). Therefore, at the completion of the qualification studies, the method generated acceptable accuracy data over the entire standard curve range (Table 3).
3.2.4. Specificity
V590 DS and DP sample matrix buffer solutions were probed with anti-S1-protein antibody to observe any possible cross reactivity with buffer components. V590 material and V590 DS and DP sample matrix placebos were diluted by the same factor and probed with anti-S1-protein antibody. No signal was observed for the placebo, but a strong signal was observed for the V590 material, providing further evidence that the anti-S1-protein antibody is specific for S protein and there is no matrix interference (see Figure S5B).
3.2.5. Limit of Quantitation (LOQ)
At the completion of the qualification studies, 6.25 ng/mL was the lowest quantity that could be measured with suitable precision and accuracy (Table 3). Therefore, 6.25 ng/mL was set as the LOQ for this assay.
3.2.6. Summary
The acceptance criteria for all performance characteristics were satisfied (Table 3) indicating that this S-protein Simple Western assay was suitable to test V590 samples to support product release, stability, and process characterization work for early clinical trials.
3.3. S-Protein Assay to Support V590 Process Development
The qualified S-protein assay using Simple Western was subsequently used to support V590 process development. During the upstream cell culture process, the S protein expressed in rVSV increased after infection from 0 day post infection (dpi) to 1.87 dpi and plateaued at 2 dpi correlating very strongly with the potency results as measured by μplaque assay (Figure 4A). Similarly, during downstream purification of HVF through BRFP the S-protein mass profile agreed with the potency data (Figure 4B). The cumulative downstream process yield for the S-protein mass, potency, and rVSV protein massc agreed well across all downstream purification process steps suggesting that the S protein is likely associated with the rVSV virions in the final DS (Figure 4C). Since the S protein is likely expressed on the surface of the rVSV (it replaced the surface-expressed G protein), the potency of the virion would be dependent, in part, on the S protein for binding ACE2 receptor and cell fusion. Despite the well-known complexities of virus infectivity, the strong agreement between potency and S protein across the upstream and downstream processes suggests that higher S-protein concentrations would equate to higher potency. Therefore, the S-protein Simple Western mass assay was used as a surrogate assay for virus productivity optimization with the added benefit of faster data turnaround time compared to the μplaque potency assay (3 h vs 3 days).
Figure 4.

S-protein mass assay, μplaque assay, and/or rVSV protein mass assay were used to analyze both upstream and downstream V590 samples to understand the S-protein concentration, infectious particle concentration, and rVSV protein concentration throughout the downstream purification steps, respectively. (A) Semi-log plot of S-protein concentration and potency for HVF material from 0 to 3 dpi. (B) Plot of S protein and potency at each process step normalized to HVF. (C) Percent cumulative mass yield plot of S protein, potency, and rVSV protein across all downstream purification steps.
In addition, since the S-protein mass assay is able to detect S1 subunit, S protein, and S multimer, it was utilized as a process analytical tool (PAT) to provide a rapid qualitative S-protein profiling assessment across all steps in the process (Figure 5). The electropherogram of the CB intermediate shows that the clarification step removed some of the undesirable S1 and S multimer, but it also caused a 10–20% loss of S protein. The electropherogram of the CCP intermediate shows that the Capto Core 700 chromatography step further reduced the S1 and S multimer levels while the S-protein levels remained the same (see the inset in Figure 5). This chromatography step was critical as it removed the majority of the unwanted S1 subunit and S multimer that was not associated with rVSV. During the UF/DF step, CCP material was concentrated and buffer exchanged (UFP) as illustrated by the elevated level of S protein. UFCP material was the permeate from the UF/DF step which, when analyzed, suggests that additional S1 subunit was removed in this step. BRFP was the product from the bioburden reduction filtration step (0.4 μm) which, expectedly, had similar S-protein levels and a similar profile to UFP. Finally, the last step, SFP, was sterile filtration of the V590 product which generated an identical profile to BRFP but, abnormally in this case, with much lower intensity. Upon further investigation, this reduction in intensity was due to an unexpected loss of 90% S protein between BRFP and SFP (∼10 to 20% loss is normally observed). The μplaque assay did detect this as a loss in potency but with a much slower data turnaround time compared to the S-protein assay. Therefore, the ability of this S-protein mass assay to simultaneously provide both S-protein concentration, which correlates to potency, and a qualitative profile of the S protein, which the potency assay cannot measure, in a faster time frame demonstrates the importance of this assay as an at-line PAT for developing the V590 vaccine.
Figure 5.
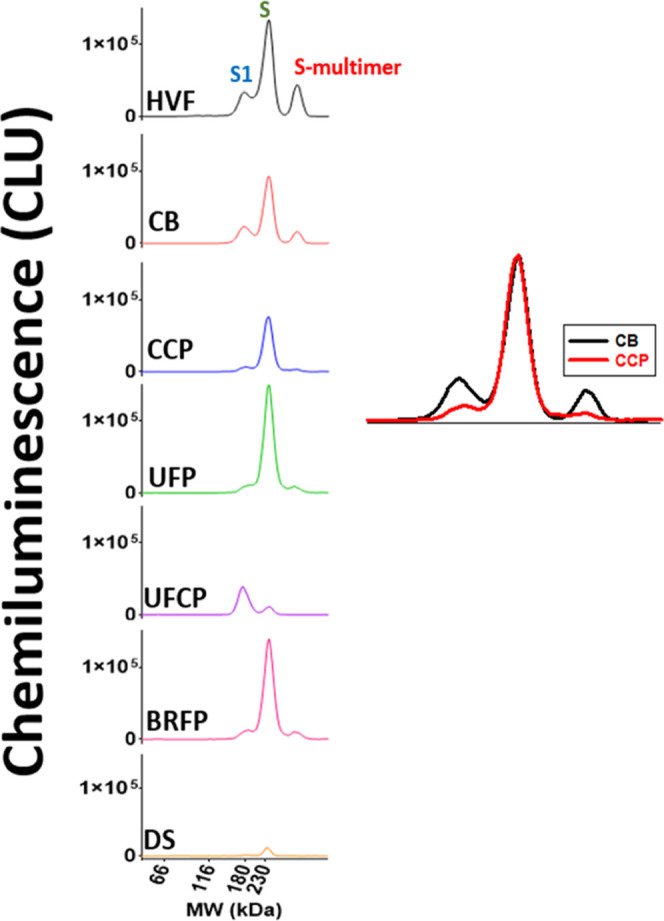
Electropherograms of S-protein profile across all downstream purification steps (HVF through SFP). Inset: Zoomed-in view of overlayed CB and CCP S-protein profiles. CLU: chemiluminescence units.
3.4. V590 Stability Characterization through S protein
V590 material generated from two processes was put on stability at 25 °C for up to 15 days and the S-protein profile was monitored to better understand the degradation of S protein (Figure 6A,B). We observed S-protein degradation to S1 subunit, but there were different rates of degradation between process 1 and process 2 where process 1 had a faster degradation rate. A similar observation was observed in potency where process 1 had a faster decline in potency over time than process 2 (Figure 6C). This correlation between S protein and potency further supports the importance of S protein in the rVSV infection mechanism. The different rates of S-protein degradation observation were reproducible as similar observations were seen in a 37 °C stability study using three different lots (Figure S7). Since V590 is a live virus vaccine grown in Vero cells, it is hypothesized that these differing rates of S-protein degradation were due to different levels of host cell proteases in each process. An additional stability study was performed at −70, 4, 25, and 45 °C to understand the degradation of S protein over a longer period of time with a wider temperature range (Figure S8). As previously observed, S-protein degradation was accelerated by higher temperatures. But, in addition, this study seems to demonstrate that there are two S-protein degradation mechanisms occurring: S-protein cleavage and S-multimer formation. At lower temperatures (≤25 °C), the mechanism of degradation appears to be shifted toward S-protein cleavage. Whereas, at 45 °C, the mechanism of degradation skewed toward S-multimer formation (Figure S9). It has been demonstrated that S-protein cleavage correlates with poor potency (Figure 6C) and S-multimer formation would likely align with poor potency as well. Therefore, regardless of the S-protein degradation mechanism, both should correlate with poor potency and likely poor immunogenicity, providing valuable insight into the stability of the S protein in the V590 product necessary to support process and product improvements.
Figure 6.

Stability of S protein in V590 BRFP samples generated in two different processes was monitored at 25 °C for 15 days. (A) S-protein profile of V590 using process 1 at t = 0, 3, 7, and 15 days; (B) S-protein profile of V590 using process 2 at t = 0, 3, 7, and 15 days; and (C) plot of S protein and potency normalized to time zero (t = 0) time point result in correlating degradation rates of S-protein levels and potency. CLU: chemiluminescence units.
4. Conclusions
An S-protein mass assay was developed using an automated capillary western blot, Simple Western. The S-protein mass assay was qualified to support the characterization testing of V590 DS, DP, and process intermediate samples. It was demonstrated that there was a strong correlation between the S-protein mass assay and the potency assay; since it had a much faster turnaround time, it can be used as an at-line PAT in manufacturing to further guide the development of the V590 COVID-19 vaccine. The assay was employed to characterize the S-protein content in cell culture, various virus purification steps, and final yield. In addition, the assay was able to provide a quick qualitative S-protein profiling assessment to further our understanding of product stability. Overall, the S-protein mass assay was critical to our characterization of the V590 clinical COVID vaccine.
Acknowledgments
The authors would like to extend their gratitude to Dr. Robert Capen for providing statistical support for the qualification work and Jimmy Devlin, Purvit Patel, and Josh Petersheim for μplaque assay support. The authors also would like to extend their gratitude to their colleagues in the Vaccine Process Research and Development group in MRL for providing vaccine material. The authors would also like to thank Laura Maaske for assistance with the table of contents graphic. Finally, the authors would like to thank Matthew Troutman, Drs. Anne Payne, Josef Vlasak, and Caroline McGregor stimulating scientific discussion and critical review of the manuscript.
Supporting Information Available
The Supporting Information is available free of charge at https://pubs.acs.org/doi/10.1021/acsomega.2c06937.
V590 downstream manufacturing process flowchart; antibodies screened during Simple Western assay development; recombinant S proteins used to confirm peak identities and antibody specificity; PNGase treatment of recombinant S, S1, and S2 proteins to understand glycosylation; additional S-protein mass assay qualification data regarding antibody saturation concentrations and specificity, rVSV protein Simple Western assay development, and V590 S-protein stability (PDF)
Author Present Address
⊥ Research & Technology Organization, Spark Therapeutics, Inc., Philadelphia, Pennsylvania 19104, United States
Author Contributions
P.F.G.: investigation, writing – original draft, writing – review and editing, and visualization. Y.W.: investigation. C.H.: investigation and writing – review and editing. L.E.K.: investigation and resources. M.A.W.: investigation, conceptualization, methodology, writing – review and editing, and resources. J.L.T.: formal analysis. C.M.T.: project administration. K.S.: project administration. N.P.: investigation. R.R.R.: conceptualization, methodology, writing – original draft, writing – review and editing, supervision, and visualization.
The authors declare the following competing financial interest(s): The authors declare no competing non-financial interests but the following competing financial interests: All authors are/were employees of Merck Sharp & Dohme LLC, a subsidiary of Merck & Co., Inc., Rahway, NJ, USA and may potentially own stock and/or hold stock options in Merck & Co., Inc., Rahway, NJ, USA.
Footnotes
The calculation for intermediate precision accounted for total variability (i.e., both repeatability and intermediate precision).
For data processing, the S1- and S-protein total peak areas were added together as they are monomer forms of the S protein and antibody binding to these species has a linear response allowing the standard curve to be used for quantitative purposes. Antibody binding to the multimer species does not generate a linear response so levels of multimer may be overestimated and were not included in the total peak area.
The rVSV protein mass assay was developed similarly to the S-protein mass assay using the Simple Western technology (see Figure S6A,B).
Supplementary Material
References
- WHO Coronavirus (COVID-19) Dashboard. https://covid19.who.int/ (accessed 04 March, 2022).
- Su S.; Wong G.; Shi W.; Liu J.; Lai A. C. K.; Zhou J.; Liu W.; Bi Y.; Gao G. F. Epidemiology, Genetic Recombination, and Pathogenesis of Coronaviruses. Trends Microbiol. 2016, 24, 490–502. 10.1016/j.tim.2016.03.003. [DOI] [PMC free article] [PubMed] [Google Scholar]
- Lu R.; Zhao X.; Li J.; Niu P.; Yang B.; Wu H.; Wang W.; Song H.; Huang B.; Zhu N.; Bi Y.; Ma X.; Zhan F.; Wang L.; Hu T.; Zhou H.; Hu Z.; Zhou W.; Zhao L.; Chen J.; Meng Y.; Wang J.; Lin Y.; Yuan J.; Xie Z.; Ma J.; Liu W. J.; Wang D.; Xu W.; Holmes E. C.; Gao G. F.; Wu G.; Chen W.; Shi W.; Tan W. Genomic characterisation and epidemiology of 2019 novel coronavirus: implications for virus origins and receptor binding. Lancet 2020, 395, 565–574. 10.1016/S0140-6736(20)30251-8. [DOI] [PMC free article] [PubMed] [Google Scholar]
- Zhang Y. Z.; Holmes E. C. A Genomic Perspective on the Origin and Emergence of SARS-CoV-2. Cell 2020, 181, 223–227. 10.1016/j.cell.2020.03.035. [DOI] [PMC free article] [PubMed] [Google Scholar]
- Hu B.; Guo H.; Zhou P.; Shi Z. L. Characteristics of SARS-CoV-2 and COVID-19. Nat. Rev. Microbiol. 2021, 19, 141–154. 10.1038/s41579-020-00459-7. [DOI] [PMC free article] [PubMed] [Google Scholar]
- Walls A. C.; Park Y. J.; Tortorici M. A.; Wall A.; McGuire A. T.; Veesler D. Structure, Function, and Antigenicity of the SARS-CoV-2 Spike Glycoprotein. Cell 2020, 181, 281–292. 10.1016/j.cell.2020.02.058. [DOI] [PMC free article] [PubMed] [Google Scholar]
- Wrapp D.; Wang N.; Corbett K. S.; Goldsmith J. A.; Hsieh C.-L.; Abiona O.; Graham B. S.; McLellan J. S. Cryo-EM structure of the 2019-nCoV spike in the prefusion conformation. Science 2020, 367, 1260–1263. 10.1126/science.abb2507. [DOI] [PMC free article] [PubMed] [Google Scholar]
- Shang J.; Wan Y.; Luo C.; Ye G.; Geng Q.; Auerbach A.; Li F. Cell entry mechanisms of SARS-CoV-2. Proc. Natl. Acad. Sci. U.S.A. 2020, 117, 11727–11734. 10.1073/pnas.2003138117. [DOI] [PMC free article] [PubMed] [Google Scholar]
- Lan J.; Ge J.; Yu J.; Shan S.; Zhou H.; Fan S.; Zhang Q.; Shi X.; Wang Q.; Zhang L.; Wang X. Structure of the SARS-CoV-2 spike receptor-binding domain bound to the ACE2 receptor. Nature 2020, 581, 215–220. 10.1038/s41586-020-2180-5. [DOI] [PubMed] [Google Scholar]
- Yan R.; Zhang Y.; Li Y.; Xia L.; Guo Y.; Zhou Q. Structural basis for the recognition of SARS-CoV-2 by full-length human ACE2. Science 2020, 367, 1444–1448. 10.1126/science.abb2762. [DOI] [PMC free article] [PubMed] [Google Scholar]
- Hoffmann M.; Kleine-Weber H.; Pohlmann S. A Multibasic Cleavage Site in the Spike Protein of SARS-CoV-2 Is Essential for Infection of Human Lung Cells. Mol. Cell 2020, 78, 779–784. 10.1016/j.molcel.2020.04.022. [DOI] [PMC free article] [PubMed] [Google Scholar]
- Zhang Y.; Zhang L.; Wu J.; Yu Y.; Liu S.; Li T.; Li Q.; Ding R.; Wang H.; Nie J.; Cui Z.; Wang Y.; Huang W.; Wang Y. A second functional furin site in the SARS-CoV-2 spike protein. Emerg. Microbes Infect. 2022, 11, 182–194. 10.1080/22221751.2021.2014284. [DOI] [PMC free article] [PubMed] [Google Scholar]
- Bestle D.; Heindl M. R.; Limburg H.; Van Lam van T.; Pilgram O.; Moulton H.; Stein D. A.; Hardes K.; Eickmann M.; Dolnik O.; Rohde C.; Klenk H. D.; Garten W.; Steinmetzer T.; Bottcher-Friebertshauser E. TMPRSS2 and furin are both essential for proteolytic activation of SARS-CoV-2 in human airway cells. Life Sci. Alliance 2020, 3, e202000786 10.26508/lsa.202000786. [DOI] [PMC free article] [PubMed] [Google Scholar]
- Tang T.; Jaimes J. A.; Bidon M. K.; Straus M. R.; Daniel S.; Whittaker G. R. Proteolytic Activation of SARS-CoV-2 Spike at the S1/S2 Boundary: Potential Role of Proteases beyond Furin. ACS Infect. Dis. 2021, 7, 264–272. 10.1021/acsinfecdis.0c00701. [DOI] [PMC free article] [PubMed] [Google Scholar]
- Papa G.; Mallery D. L.; Albecka A.; Welch L. G.; Cattin-Ortola J.; Luptak J.; Paul D.; McMahon H. T.; Goodfellow I. G.; Carter A.; Munro S.; James L. C. Furin cleavage of SARS-CoV-2 Spike promotes but is not essential for infection and cell-cell fusion. PLoS Pathog. 2021, 17, e1009246 10.1371/journal.ppat.1009246. [DOI] [PMC free article] [PubMed] [Google Scholar]
- Wenzhong L.; Hualan L. COVID-19: the CaMKII-like system of S protein drives membrane fusion and induces syncytial multinucleated giant cells. Immunol. Res. 2021, 69, 496–519. 10.1007/s12026-021-09224-1. [DOI] [PMC free article] [PubMed] [Google Scholar]
- Monath T. P.; Fast P. E.; Modjarrad K.; Clarke D. K.; Martin B. K.; Fusco J.; Nichols R.; Heppner D. G.; Simon J. K.; Dubey S.; Troth S. P.; Wolf J.; Singh V.; Coller B. A.; Robertson J. S. rVSVDeltaG-ZEBOV-GP (also designated V920) recombinant vesicular stomatitis virus pseudotyped with Ebola Zaire Glycoprotein: Standardized template with key considerations for a risk/benefit assessment. Vaccine X 2019, 1, 100009 10.1016/j.jvacx.2019.100009. [DOI] [PMC free article] [PubMed] [Google Scholar]
- Espeseth A. S.; Yuan M.; Citron M.; Reiserova L.; Morrow G.; Wilson A.; Horton M.; Rukhman M.; Kinek K.; Hou F.; Li S. L.; Li F.; Choi Y.; Heidecker G.; Luo B.; Wu G.; Zhang L.; Strable E.; DeStefano J.; Secore S.; Mukhopadhyay T. K.; Richardson D. D.; Sayeed E.; Welch L. S.; Bett A. J.; Feinberg M. B.; Gupta S. B.; Cooper C. L.; Parks C. L. Preclinical immunogenicity and efficacy of a candidate COVID-19 vaccine based on a vesicular stomatitis virus-SARS-CoV-2 chimera. EBioMedicine 2022, 82, 104203 10.1016/j.ebiom.2022.104203. [DOI] [PMC free article] [PubMed] [Google Scholar]
- Halperin S. A.; Das R.; Onorato M. T.; Liu K.; Martin J.; Grant-Klein R. J.; Nichols R.; Coller B. A.; Helmond F. A.; Simon J. K.; Team V. S. Immunogenicity, Lot Consistency, and Extended Safety of rVSVDeltaG-ZEBOV-GP Vaccine: A Phase 3 Randomized, Double-Blind, Placebo-Controlled Study in Healthy Adults. J. Infect. Dis. 2019, 220, 1127–1135. 10.1093/infdis/jiz241. [DOI] [PMC free article] [PubMed] [Google Scholar]
- Heppner D. G. Jr.; Kemp T. L.; Martin B. K.; Ramsey W. J.; Nichols R.; Dasen E. J.; Link C. J.; Das R.; Xu Z. J.; Sheldon E. A.; Nowak T. A.; Monath T. P.; et al. Safety and immunogenicity of the rVSVΔG-ZEBOV-GP Ebola virus vaccine candidate in healthy adults: a phase 1b randomised, multicentre, double-blind, placebo-controlled, dose-response study. Lancet Infect. Dis. 2017, 17, 854–866. 10.1016/S1473-3099(17)30313-4. [DOI] [PubMed] [Google Scholar]
- Nguyen U.; Squaglia N.; Boge A.; Fung P. A. The Simple Western: a gel-free, blot-free, hands-free Western blotting reinvention. Nat. Methods 2011, 8, v–vi. 10.1038/nmeth.f.353. [DOI] [Google Scholar]
- Rustandi R. R.; Loughney J. W.; Hamm M.; Hamm C.; Lancaster C.; Mach A.; Ha S. Qualitative and quantitative evaluation of Simon, a new CE-based automated Western blot system as applied to vaccine development. Electrophoresis 2012, 33, 2790–2797. 10.1002/elps.201200095. [DOI] [PubMed] [Google Scholar]
- Rustandi R. R.; Hamm M.; Lancaster C.; Loughney J. W. Applications of an Automated and Quantitative CE-Based Size and Charge Western Blot for Therapeutic Proteins and Vaccines. Methods Mol. Biol. 2016, 1466, 197–217. 10.1007/978-1-4939-4014-1_16. [DOI] [PubMed] [Google Scholar]
- Loughney J. W.; Lancaster C.; Ha S.; Rustandi R. R. Residual bovine serum albumin (BSA) quantitation in vaccines using automated Capillary Western technology. Anal. Biochem. 2014, 461, 49–56. 10.1016/j.ab.2014.05.004. [DOI] [PubMed] [Google Scholar]
- Hamm M.; Ha S.; Rustandi R. R. Automated capillary Western dot blot method for the identity of a 15-valent pneumococcal conjugate vaccine. Anal. Biochem. 2015, 478, 33–39. 10.1016/j.ab.2015.03.021. [DOI] [PubMed] [Google Scholar]
- Minsker K.; Rustandi R. R.; Ha S.; Loughney J. W. Characterization of rVSVDeltaG-ZEBOV-GP glycoproteins using automated capillary western blotting. Vaccine 2020, 38, 7166–7174. 10.1016/j.vaccine.2020.08.001. [DOI] [PubMed] [Google Scholar]
- Edouard S.; Jaafar R.; Orain N.; Parola P.; Colson P.; La Scola B.; Fournier P. E.; Raoult D.; Drancourt M. Automated Western immunoblotting detection of anti-SARS-CoV-2 serum antibodies. Eur. J. Clin. Microbiol. Infect. Dis. 2021, 40, 1309–1317. 10.1007/s10096-021-04203-8. [DOI] [PMC free article] [PubMed] [Google Scholar]
- Konstantinidis S.; R S. R.; Castagna C.; Poplyk M. R.; Rustandi R. R.; Florc K. L.; Acevedo-Skrip J.; Thompson R.; Wang C. J.; Wang S.; Winters M. A. Regeneration of Capto Core 700 Resin through High Throughput and Lab Scale Studies and Impact on Production of SARS-CoV-2 Vaccine Candidate. Biotechnol. J. 2022, 17, e2200191 10.1002/biot.202200191. [DOI] [PMC free article] [PubMed] [Google Scholar]
- ICH H. T. G.Validation of analytical procedures: text and methodology, Q2 (R1). Current Step 4 Version, Parent Guidelines on Methodology Dated November 6 1996. Incorporated in November 2005. International Conference on Harmonisation of Technical Requirements for Registration of Pharmaceuticals for Human Use, Geneva, Switzerland, 2005.
- Scheller C.; Krebs F.; Wiesner R.; Watzig H.; Oltmann-Norden I. A comparative study of CE-SDS, SDS-PAGE, and Simple Western-Precision, repeatability, and apparent molecular mass shifts by glycosylation. Electrophoresis 2021, 42, 1521–1531. 10.1002/elps.202100068. [DOI] [PubMed] [Google Scholar]
- Poduslo J. F. Glycoprotein molecular-weight estimation using sodium dodecyl sulfate-pore gradient electrophoresis: comparison of tris-glycine and tris-borate-EDTA buffer systems. Anal. Biochem. 1981, 114, 131–139. 10.1016/0003-2697(81)90463-2. [DOI] [PubMed] [Google Scholar]
- Frank R. N.; Rodbard D. Precision of sodium dodecyl sulfate-polyacrylamide-gel electrophoresis for the molecular weight estimation of a membrane glycoprotein: studies on bovine rhodopsin. Arch. Biochem. Biophys. 1975, 171, 1–13. 10.1016/0003-9861(75)90001-6. [DOI] [PubMed] [Google Scholar]
- Rath A.; Glibowicka M.; Nadeau V. G.; Chen G.; Deber C. M. Detergent binding explains anomalous SDS-PAGE migration of membrane proteins. Proc. Natl. Acad. Sci. U.S.A. 2009, 106, 1760–1765. 10.1073/pnas.0813167106. [DOI] [PMC free article] [PubMed] [Google Scholar]
- Bateman A.; Martin M. J.; Orchard S.; et al. UniProt: the universal protein knowledgebase in 2021. Nucleic Acids Res. 2021, 49, D480–D489. 10.1093/nar/gkaa1100. [DOI] [PMC free article] [PubMed] [Google Scholar]
- Rustandi R. R.; Loughney J. W.; Shang L.; Wang S.; Pauley C. J.; Christanti S.; Kristopeit A.; Culp T. D. Characterization of gH/gL/pUL128-131 pentameric complex, gH/gL/gO trimeric complex, gB and gM/gN glycoproteins in a human cytomegalovirus using automated capillary western blots. Vaccine 2021, 39, 4705–4715. 10.1016/j.vaccine.2021.06.033. [DOI] [PubMed] [Google Scholar]
- Bioanalytical Method Validation Guidance for Industry; U.S. Department of Health and Human Services Food and Drug Administration Center for Drug Evaluation and Research (CDER) Center for Veterinary Medicine (CVM), 2018; pp 1–44.
Associated Data
This section collects any data citations, data availability statements, or supplementary materials included in this article.