

Abstract
Modern proximity labeling techniques have enabled significant advances in understanding biomolecular interactions. However, current tools primarily utilize activation modes that are incompatible with complex biological environments, limiting our ability to interrogate cell- and tissue-level microenvironments in animal models. Here, we report µMap-Red, a proximity labeling platform that uses a red light-excited SnIV chlorin e6 catalyst to activate a phenyl azide biotin probe. We validate µMap-Red by demonstrating photonically-controlled protein labeling in vitro through several layers of tissue, and we then apply our platform in cellulo to label EGFR microenvironments and validate performance with STED microscopy and quantitative proteomics. Finally, to demonstrate labeling in a complex biological sample, we deploy µMap-Red in whole mouse blood to profile erythrocyte cell-surface proteins. This work represents a significant methodological advance toward light-based proximity labeling in complex tissue environments and animal models.
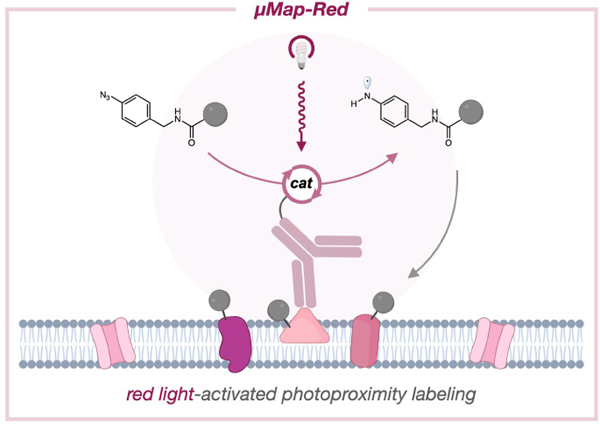
Graphical Abstract
Biological processes are regulated by spatial connections between biomolecules, cells, and tissues.1, 2 Understanding these interfaces is key to elucidating the biochemical mechanics of living systems. Significant progress has been made in simple cellular systems, but few technologies can interrogate more complex tissues or animal models. Notably, modern proximity labeling technologies are widely applied for capturing biomolecular interactions in living cells.3, 4 Peroxidase-based approaches, including SPPLAT,5 EMARS,6 and APEX,7 have proven useful in mapping signal transduction networks,8 tracking subcellular RNA distribution,9 and delineating synaptic communication.10 Despite their in vitro and in simple insect models,11, 12 the use of hydrogen peroxide as a chemical labeling trigger has prohibited their use in more complex systems. Alternatively, biotin ligases13, 14 facilitate labeling in more complex models, including plants15 and mice,16 but still require long labeling times (~18 h) and exhibit poor spatiotemporal control. Protein engineering efforts yielded BASU17 and TurboID18 ligases which display faster labeling kinetics, yet these enzymes still suffer from poor control over labeling and exhibit in vivo toxicity due to sequestration of endogenous biotin.
Light-based proximity labeling methods have emerged as an attractive alternative because they enable high spatiotemporal control over labeling. Along these lines, we recently developed the µMap photocatalytic labeling strategy for microenvironment mapping, wherein an iridium (Ir) photocatalyst is excited by visible blue light (~450 nm) to convert nearby diazirines into reactive carbenes via Dexter energy transfer (Figure 1).19 This platform was successfully employed for a range of applications, including profiling immunosynapse proteins, mapping epigenetic reorganization events,20 and identifying small-molecule protein targets.21 More recently, conceptually similar photocatalytic platforms have enabled profiling of cell–cell interactions and the mitochondrial proteome.22, 23 While µMap and other light-based systems offer significant advantages, in vivo translation remains a substantial challenge. In particular, shorter wavelength light (<500 nm) exhibits poor tissue penetration due to scattering effects and absorption overlap with endogenous chromophores.24 Thus, there remains a significant need to develop labeling platforms that are activated by longer wavelength light (Figure 1).
Figure 1. Proximity labeling by red light photoredox catalysis.
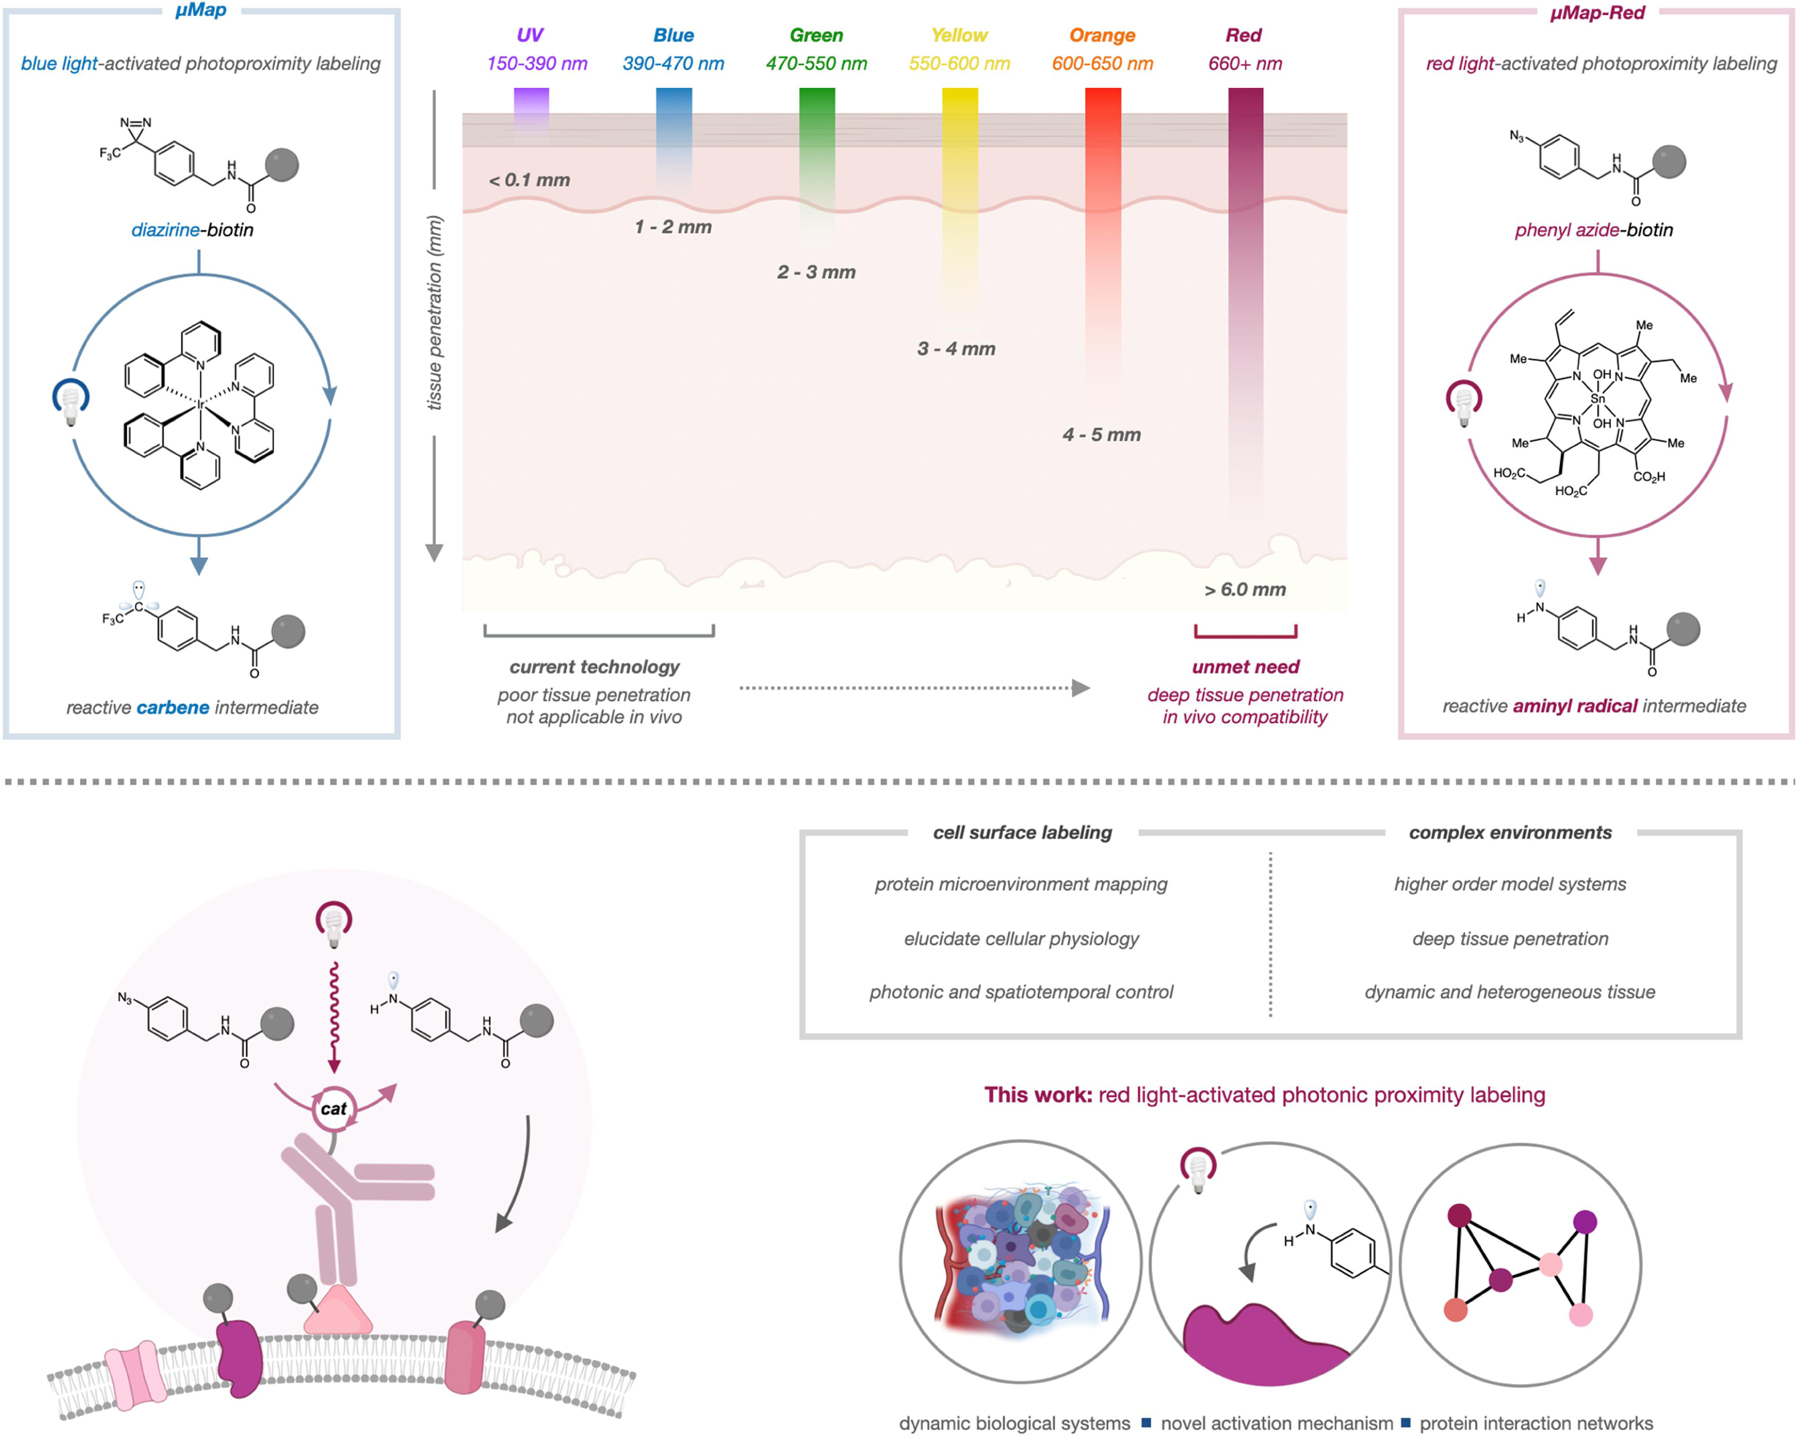
High-energy light is unable to penetrate tissue, while longer wavelength light exhibits better penetration. Red-light excitation of Sn chlorin catalysts can generate reactive aminyl radicals from aryl azides (µMap-Red).
In nature, porphyrin and chlorin scaffolds are ubiquitous photocatalysts that absorb longer wavelength light (>600 nm) and deploy this energy via photoinduced electron transfer. Based upon sporadic reports of azide activation photocatalysts,25 we reasoned that red-light absorbing catalysts might be used to generate reactive proximity labeling intermediates—nitrenes or aminyl radicals—from aryl azide precursors.26 We call this red-light mediated strategy µMap-Red.
To test this idea, we first monitored conversion of 4-azidobenzoic acid (1) against several red-light photocatalysts with varying redox properties (Figure S1). Using a Sn-metallated chlorin e6 catalyst (3), we observed trace conversion (5%) and small quantities of aniline product 2 (2%) (Figure 2a, entry a). Addition of stoichiometric reductants, including glutathione, sodium ascorbate, or NADH led to dramatic yield improvements (Figure 2a, entries b-d), with NADH as the most effective (83% yield). From these data, we propose a mechanistic pathway initiating via reductive quenching of the excited-state photocatalyst (4) with NADH to form a highly reducing organic ground state (E1/2 = −0.69 V vs Ag/AgCl). This reduced species is poised to undergo single electron transfer (SET) to the aryl azide, 1 (Ep/2 = −0.61 V vs Ag/AgCl), thereby regenerating the catalyst (3) (Figure 2b). Mesolytic cleavage of the azide radical anion (6) releases molecular nitrogen, and rapid protonation reveals an aminyl radical species (7) as a reactive intermediate for proximity labeling. Ultrafast transient-absorption spectroscopy revealed that the excited Sn-Chlorin catalyst is quenched by NADH and not by aryl azide 1, providing support for the proposed ground state reductive electron transfer mechanism (Figure 2c).
Figure 2. Reaction optimization, proposed mechanism, and transient absorption spectroscopy.
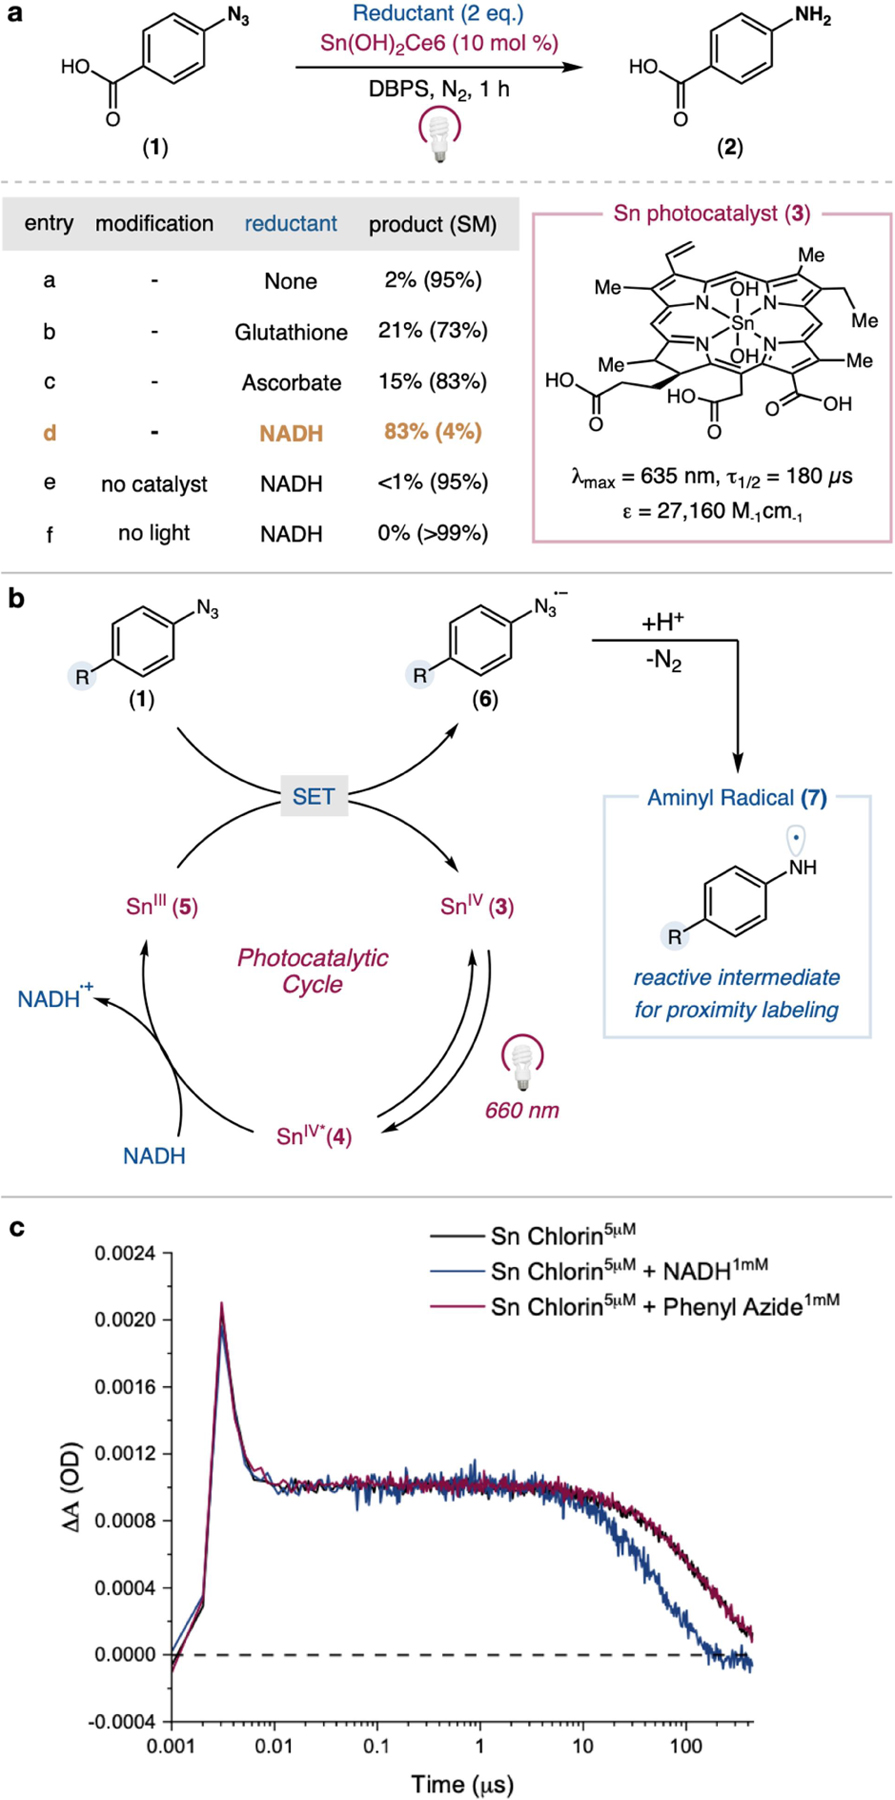
a) Effect of reductant on phenyl azide conversion using catalyst 3, b) Proposed reaction mechanism, c) Time-resolved transient absorption spectroscopy of Sn(OH)2 Chlorin e6 in the presence of phenyl azide 1 or NADH.
Furthermore, electrochemical reduction of the Sn-Chlorin e6 catalyst generated a species with significant spectral overlap with the transient-absorption signal of the photoexcited catalyst in the presence of NADH, supporting the generation of the reduced ground state catalyst (Figure S2).
We next sought to validate our platform in vitro by covalently tagging a recombinant protein in aqueous solution. We subjected carbonic anhydrase to our optimized labeling conditions (10 mol% catalyst 3, 1 mM NADH, 500 µM PhN3-biotin) and were pleased to observe robust protein biotinylation via western blot (Figure 3a,b). No labeling was observed in the absence of photocatalyst, PhN3 probe, or light, and labeling intensity was commensurate with increasing irradiation times (Figure S3). Additionally, light dependence on labeling was observed with discrete increases in biotinylation following 2 minute pulses of light (Figure 3c). Given our long-term goal of applying this technology for proximity labeling in vivo, we probed the efficiency of our system through increasing layers of tissue between the light source and the sample (Figure 3d). Both µMap and µMap-Red protocols achieved robust biotinylation in the absence of tissue obstruction, yet a sharp decrease (~90%) in biotinylation efficiency of µMap was observed with just 1.5 mm of tissue obscuring the light source, confirming poor penetration of blue light through dermal layers.24 Conversely, µMap-Red exhibited detectable labeling through increasing amounts of tissue (>10 mm) (Figure 3d).
Figure 3. µMap-Red enables photonically-controlled protein labeling and penetrates tissue layers.
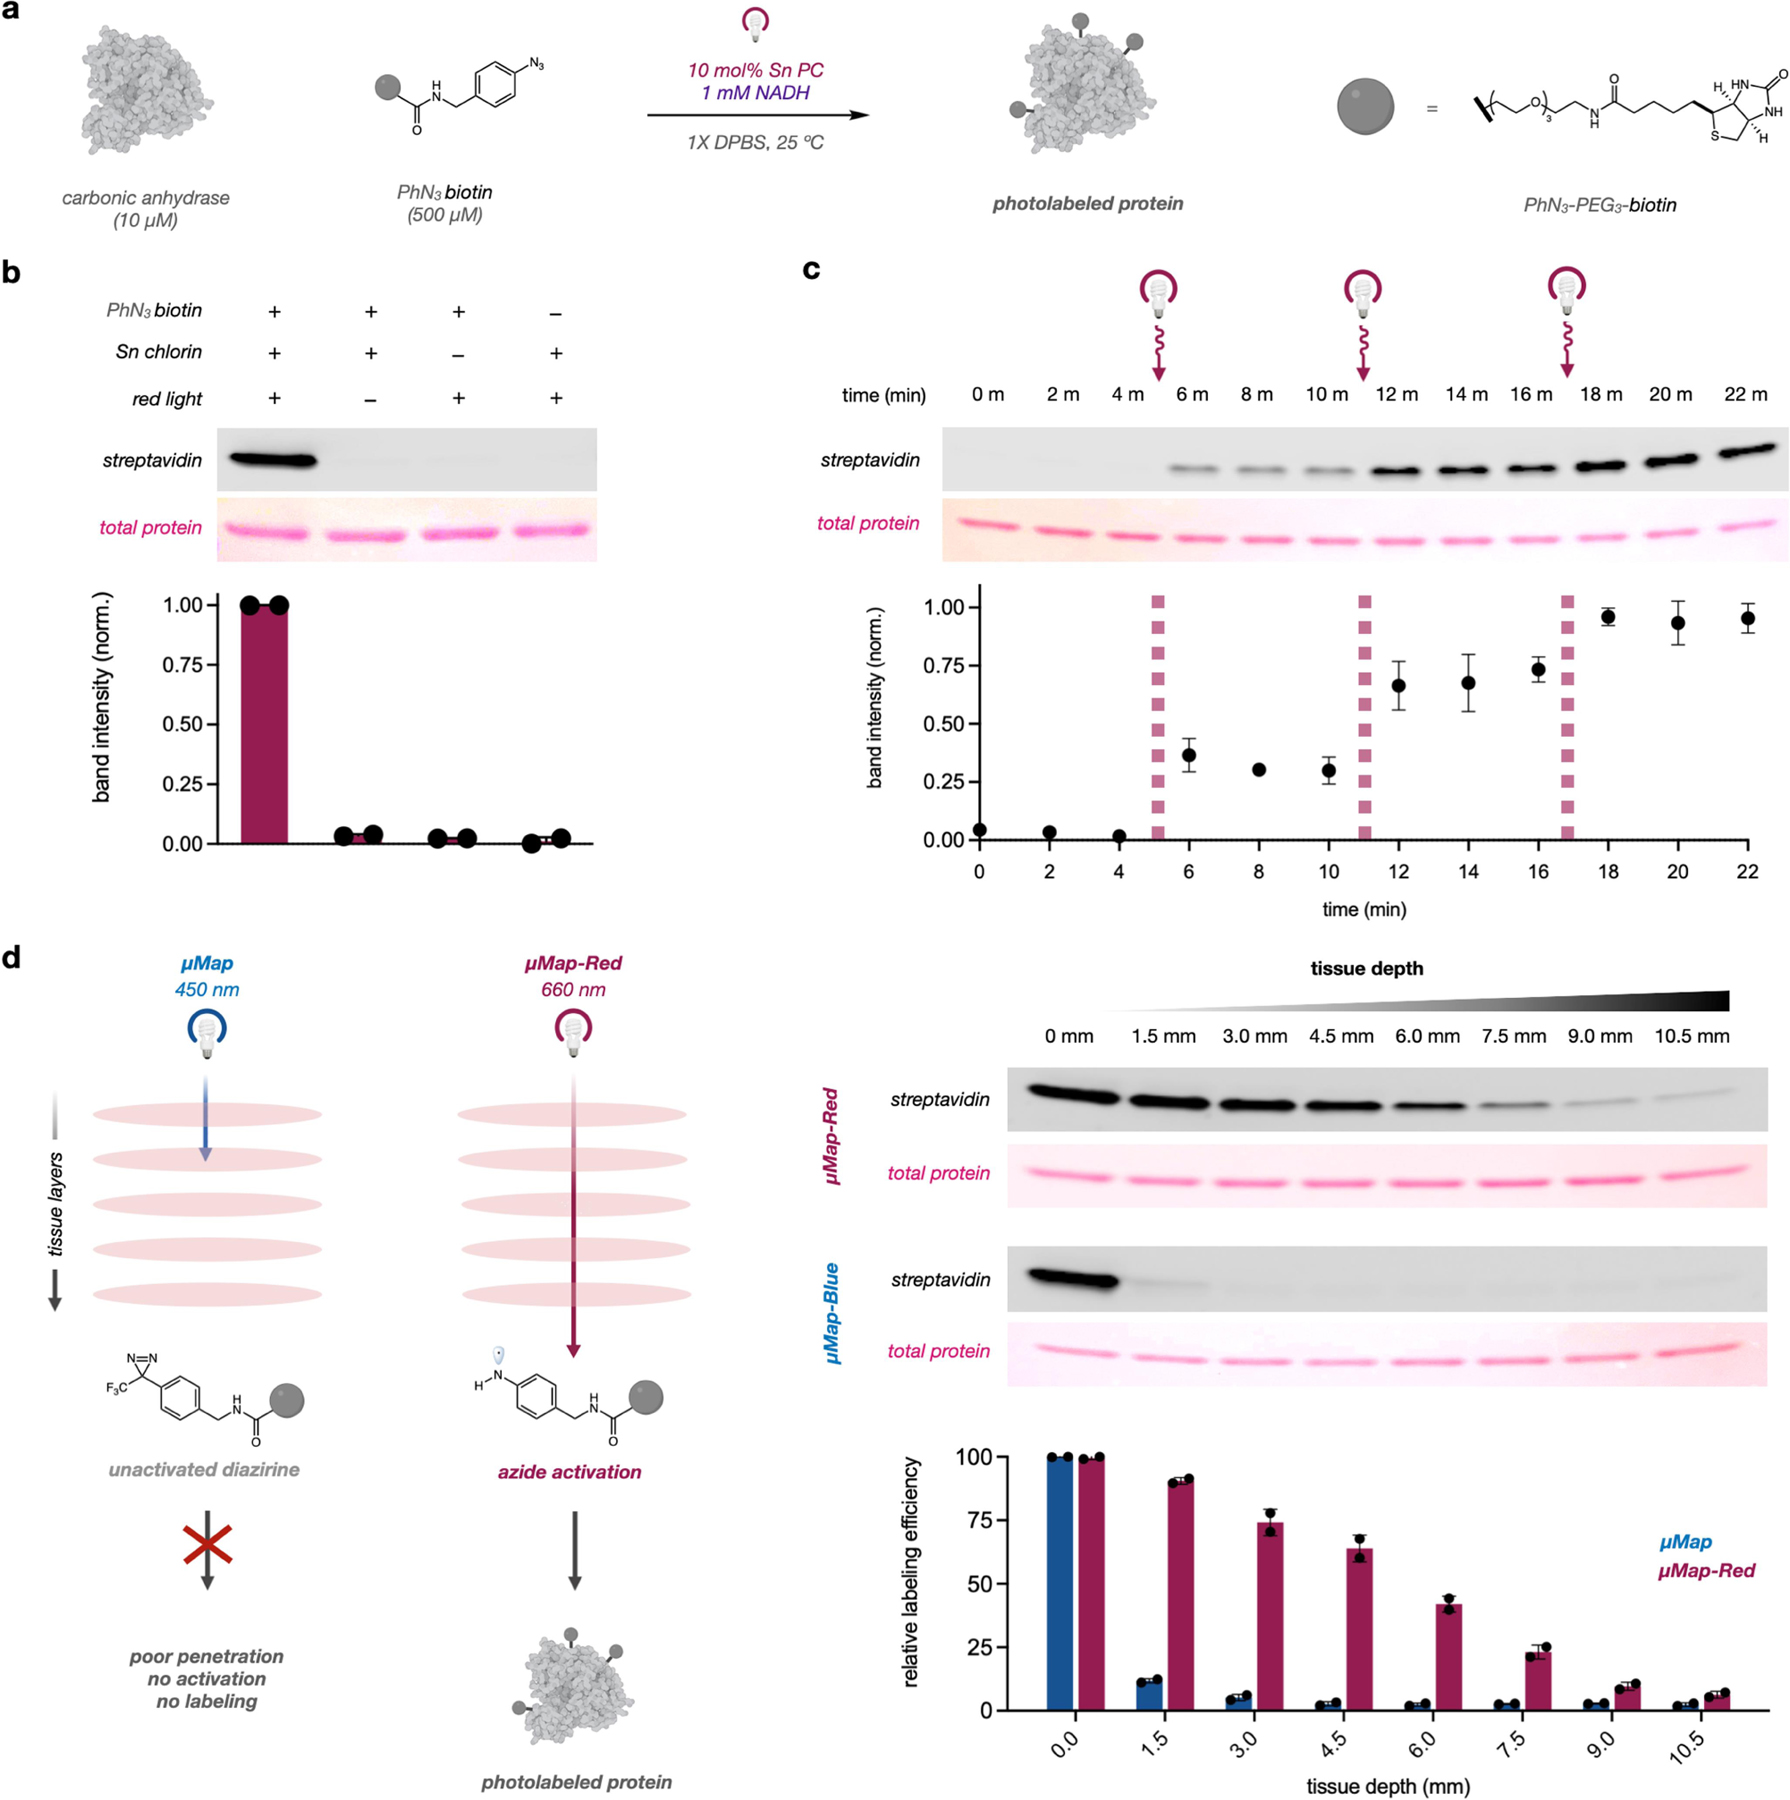
a) Scheme for protein biotinylation and b) relevant reaction controls. Bars and data points represent normalized densitometric measurements from two separate experiments, and error bars denote standard error. c) Photonic control over protein biotinylation. A labeling reaction was prepared and aliquots taken every 2 minutes. Samples were irradiated with red light for two minutes at 4, 10, and 16-minute time points. d) µMap-Red and µMap labeling through tissue. Labeling reactions were illuminated under red or blue light and increasing slices of raw meat were inserted between reactions and light sources. All in vitro reactions were analyzed via western blot.
With a system for red light-activated protein labeling in hand, we next tested µMap-Red in a cellular context. As a model system, we selected epidermal growth factor receptor (EGFR), a cell surface receptor-tyrosine kinase. We first synthesized secondary antibodies conjugated to Sn-chlorin, which could then be directed with primary antibodies to EGFR. (Figure 4a). We subjected A549 cells to immuno-targeted photolabeling (1 mM NADH, 500 µM PhN3-biotin, 30 min irradiation) in the presence or absence of anti-EGFR antibodies. Spatially selective biotinylation was assessed via stimulated emission depletion (STED) super-resolution microscopy. Gratifyingly, µMap-Red exhibited robust cell-surface biotinylation only in the presence of anti-EGFR antibodies, indicating low non-specific binding or off- target labeling (Figure 4b). The high resolution offered by STED microscopy also allowed us to qualitatively assess colocalization of EGFR and labeling. As shown in Figure 4b, we observed a biotinylation signal that strongly overlayed with EGFR staining, signifying confinement of labeling to the EGFR microenvironment. To assess spatial selectivity of labeling, measurement of the full width at half maximum (FWHM) of biotinylation clusters estimated the Gaussian distribution of labeling events to be 87 ± 33 nm (n=50 clusters) (Figure S20). This distribution is in agreement with the known longer lifetime of the aminyl radical intermediate (~50 µs)27 with respect to carbenes (~2 ns) generated using µMap,19 but nonetheless affords µMap-Red with the ability to profile nano-scale events in individual protein microenvironments.
Figure 4. µMap-Red photolabels cell-surface receptor microenvironments on living cells.
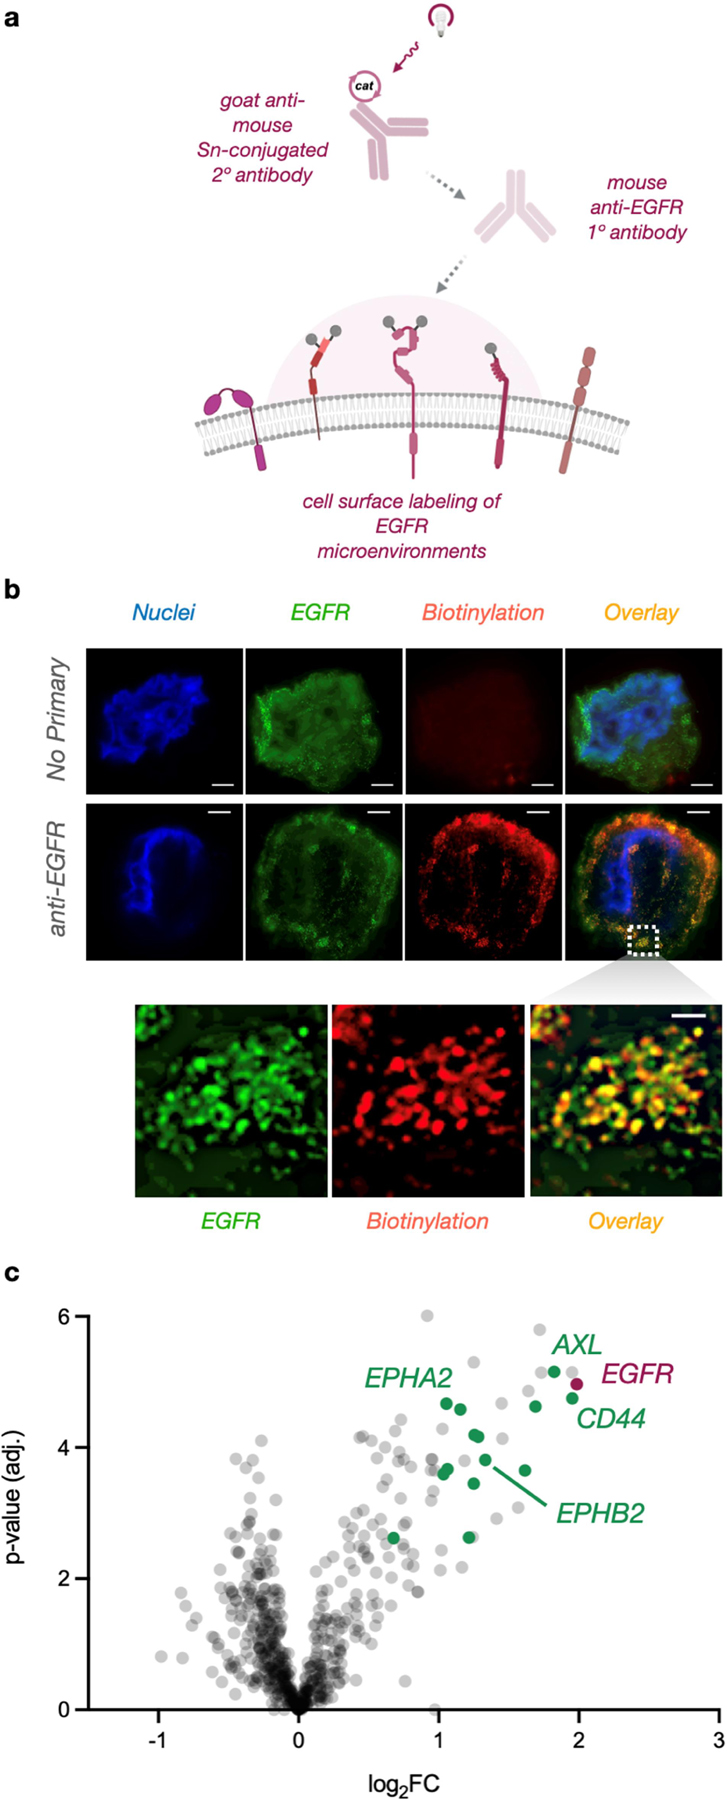
a) primary anti-EGFR antibodies and Sn-conjugated secondary antibodies were used to label microenvironments on living A549 cells. b) STED microscopy of photolabeled cells with and without anti-EGFR primary antibodies. Inset represents a magnified region of interest illustrating radial labeling clusters overlaying with individual EGFR protein microenvironments. Depicted scale bar is 2 µm for no primary, 3 µm for anti-EGFR, and 1 µm for zoomed inset. 3 c) Quantitative proteomics volcano plot of enriched proteins. Green datapoints represent known EGFR interactors from the BioGrid database.28
We next generated membrane lysate fractions from photolabeled cells and subjected them to streptavidin enrichment and quantitative proteomics. Consistent with our STED analysis, we observed EGFR enrichment via western blot only in samples that had been exposed to anti-EGFR antibody (Figure S4). Here, quantitative tandem mass tag (TMT) proteomics revealed 29 enriched proteins with log2(FC) > 1 (Figures 4c). Satisfyingly, EGFR was the most enriched protein in the dataset. Of these enriched proteins, 12 have previously validated physical interactions with EGFR (Figure 4c, green datapoints),28 including CD44, a transmembrane glycoprotein known to regulate EGFR autophosphorylation.29 Additionally, one of the most enriched proteins, AXL, is a known substrate of EGFR phosphorylation.30 EPHA2 and EPHB2, also receptor protein-tyrosine kinases, were highly enriched in our dataset and are known to modulate vesicular trafficking of EGFR.31 Together, these data validate the accuracy of µMap-Red as a proximity labeling platform for profiling spatial connections in signaling pathways.
We next sought to evaluate our platform in a complex setting where blue light activation would not be feasible. Along these lines, whole blood presents high levels of biochemical complexity, and we questioned whether µMap-Red could be used in this setting to achieve selective proximity labeling. We selected TER119, a well-characterized antibody raised against mature erythrocytes,32 as our targeting modality for cell-surface labeling (Figure 5). Interestingly, although TER119 is monoclonal, it has been shown to bind several targets on red blood cells and remains a gold standard erythrocyte marker for flow cytometry analysis of whole blood.33 First, we conjugated Sn chlorin catalysts to both TER119 and a non-targeting isotype control. We then added these conjugates, along with the µMap-Red reaction components—1 mM NADH and 500 µM PhN3-biotin—directly to samples of whole mouse blood. Following a 1-hour incubation period, samples were irradiated for 10 minutes, and membrane lysates were collected. Strikingly, biotinylation via western blot analysis was only observed with the catalyst-conjugated TER119, and minimal signal was observed with isotype conjugates (Figure 5a). Intensity of labeling was proportional to TER119 concentration while no biotinylation was observed with any amount of isotype (Figure 5a, S5). Remarkably, we repeated this experiment using blue light-activated µMap and observed no signal across all conditions (Figure S6), consistent with the observed poor tissue penetration of blue light (Figure 3d). In parallel, we analyzed photolabeled blood via flow cytometry by staining with fluorescent Neutravidin-DyLight® 650. As shown in Figure 5b, minimal signal was observed in the isotype reactions, while a significant (~15-fold) increase in biotinylated cells was seen with TER119 reactions, indicating erythrocyte labeling in whole blood. Finally, we performed quantitative proteomics on enriched membrane lysates (Figure 5c). We observed 24 proteins that were strongly enriched [log2(FC) > 1] in our dataset, the majority of which are known erythrocyte cell surface proteins (Figure 5C, red datapoints). In particular, basigin (Bsg), Cd36, Kel, erythrocyte membrane associated protein (Ermap), 55 kDa erythrocyte membrane protein (Mpp1), band 3 anion transport protein (B3at), and protein 4.2 (Epb42) were among the most enriched. These targets constitute the major mouse erythrocyte membrane proteins and blood antigen group glycoproteins and likely represent the major TER119 antigen ensemble.34 Additionally, we observed enrichment of several cytoskeletal proteins (Figure 5C, green datapoints), including spectrins alpha and beta as well as ankyrin and alpha-adducin.35
Figure 5. µMap-Red profiles erythrocyte surface proteins in whole mouse blood.
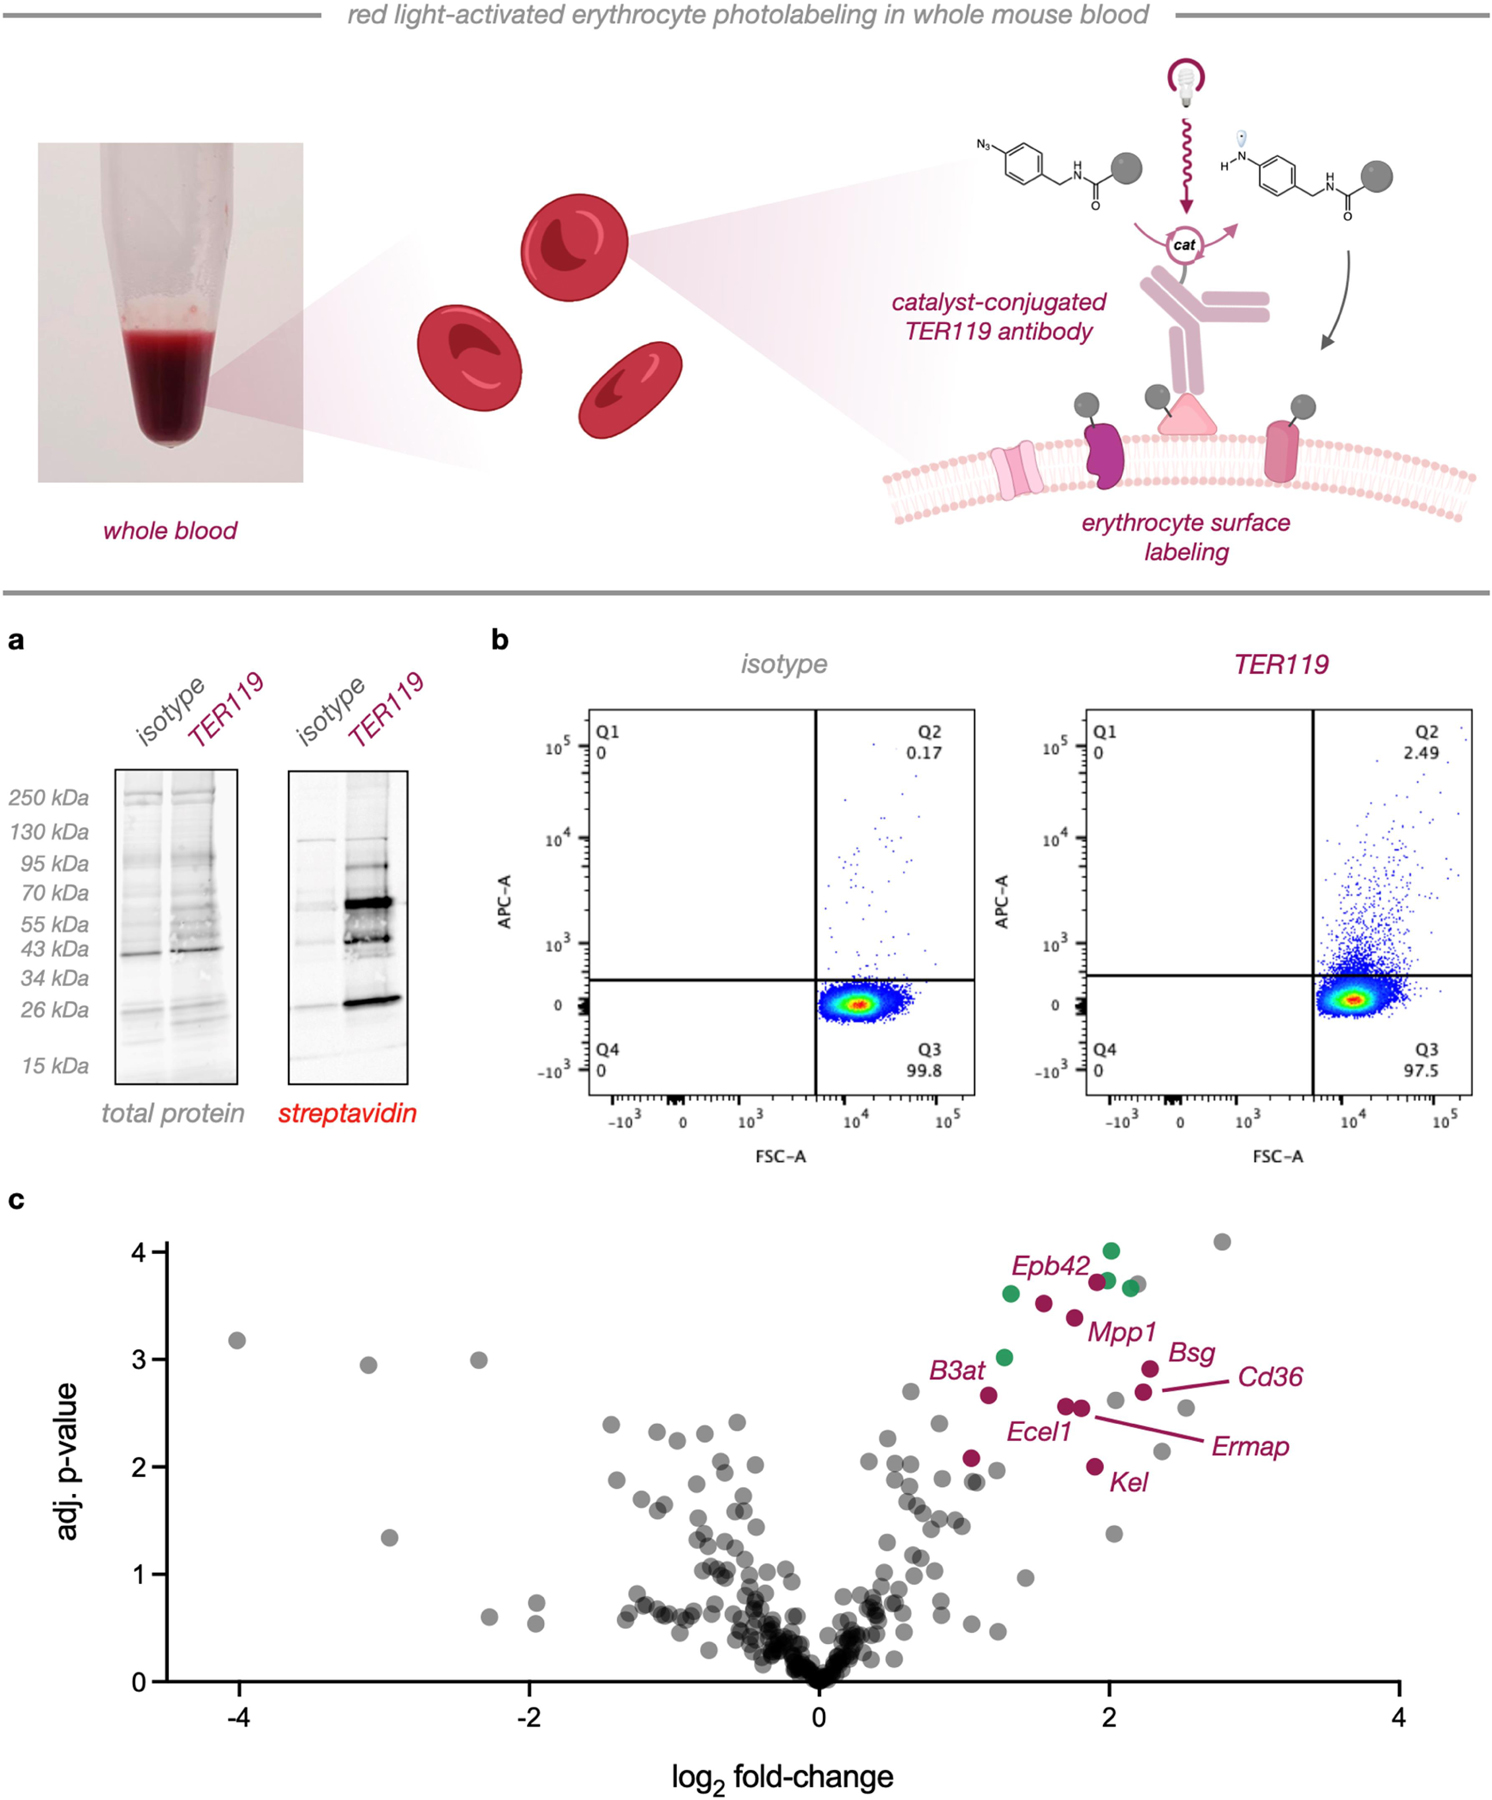
Top, scheme for biotinylation of erythrocyte surfaces in whole blood. a) Western blot analysis of erythrocyte membrane lysate from isotype and TER119-directed photolabeling. b) Flow cytometry of isotype or TER119 photolabeled cells. c) Quantitative proteomics volcano plot of identified proteins after whole blood photolabeling. Red datapoints represent known erythrocyte membrane proteins while green points denote integral membrane-associated proteins.
In conclusion, we disclose here a novel red light-activated proximity labeling platform. We show that this system exhibits phototonic and spatiotemporal control over labeling and can operate in both simple and complex biological environments. Although µMap-Red enables robust photoproximity labeling through tissue and in whole blood, challenges remain for translating this platform into living animals. While azides have been utilized for biorthogonal conjugation in worms, zebrafish, and mice,36, 37 significant pharmacokinetic optimization of photocatalyst, probe, and reductant delivery is required for translation into organismal contexts. Additionally, minimizing reactive oxygen species generation, phototoxicity, and local tissue heating will be key parameters for successful in vivo applications. Together, this methodology represents a significant advance toward developing red light-activated labeling platforms for elucidating spatial interactomes in animal models.
Supplementary Material
Experimental procedures, characterization data, and supplementary figures (PDF)
Tables S1-S2 (proteomic datasets) (.xls)
ACKNOWLEDGMENT
This work was funded by the NIH National Institute of General Medical Sciences (R35-GM134897-02) and kind gifts from Merck, BMS, Pfizer, Janssen, Genentech, and Eli Lilly. We also acknowledge the Princeton Catalysis Initiative for supporting this work. S.D.K. acknowledges the NIH for a postdoctoral fellowship (1F32GM142206-01). J.V.O. acknowledges the National Science Foundation Graduate Research Fellowship Program (DGE-1656466). Mechanistic experiments, including and transient absorption and UV-Vis spectroscopy was supported by the Division of Chemical Sciences, Geosciences, and Biosciences, Office of Basic Energy Sciences of the U.S. Department of Energy (DOE) through grant DE-SC0019370. M.P.S. is supported by the NIGMS of the National Institutes of Health under grant number T32GM007388 and a HMEI-STEP fellowship from the from the High Meadows Environmental Institute at Princeton University. Imaging was performed with support from the Confocal Imaging Facility, a Nikon Center of Excellence, in the Department of Molecular Biology at Princeton University. The authors thank Saw Kyin and Henry H. Shwe at the Princeton Proteomics Facility. We thank Christina DeCoste and Katherine Rittenbach and the Princeton University Molecular Biology Flow Cytometry Resource Facility which is partially supported by the Cancer Institute of New Jersey Cancer Center Support Grant (P30CA072720). Generalized schemes were created using Biorender.
Footnotes
ASSOCIATED CONTENT
Supporting Information
The Supporting Information is available free of charge on the ACS Publications website.
REFERENCES
- 1.Keskin O; Tuncbag N; Gursoy A, Predicting protein–protein interactions from the molecular to the proteome level. Chem. Rev, 2016, 116 (8), 4884–4909. [DOI] [PubMed] [Google Scholar]
- 2.Hentze MW; Castello A; Schwarzl T; Preiss T, A brave new world of RNA-binding proteins. Nat. Rev. Mol. Cell. Biol, 2018, 19 (5), 327–341. [DOI] [PubMed] [Google Scholar]
- 3.Qin W; Cho KF; Cavanagh PE; Ting AY, Deciphering molecular interactions by proximity labeling. Nat. Methods, 2021, 18 (2), 133–143. [DOI] [PMC free article] [PubMed] [Google Scholar]
- 4.Seath CP; Trowbridge AD; Muir TW; MacMillan DW, Reactive intermediates for interactome mapping. Chem. Soc. Rev, 2021, 50,2911–2926. [DOI] [PubMed] [Google Scholar]
- 5.Rees JS; Li XW; Perrett S; Lilley KS; Jackson AP, Selective proteomic proximity labeling assay using tyramide (SPPLAT): a quantitative method for the proteomic analysis of localized membrane‐bound protein clusters. Curr. Protoc. Protein Sci, 2017, 88 (1), 19.27. 1–19.27. 18. [DOI] [PubMed] [Google Scholar]
- 6.Honke K; Kotani N, The enzyme‐mediated activation of radical source reaction: a new approach to identify partners of a given molecule in membrane microdomains. J. Neurochem, 2011, 116 (5), 690–695. [DOI] [PubMed] [Google Scholar]
- 7.Lam SS; Martell JD; Kamer KJ; Deerinck TJ; Ellisman MH; Mootha VK; Ting AY, Directed evolution of APEX2 for electron microscopy and proximity labeling. Nat. Methods, 2015, 12 (1), 51–54. [DOI] [PMC free article] [PubMed] [Google Scholar]
- 8.Liu G; Papa A; Katchman AN; Zakharov SI; Roybal D; Hennessey JA; Kushner J; Yang L; Chen B-X; Kushnir A, Mechanism of adrenergic Ca V 1.2 stimulation revealed by proximity proteomics. Nature, 2020, 577 (7792), 695–700. [DOI] [PMC free article] [PubMed] [Google Scholar]
- 9.Fazal FM; Han S; Parker KR; Kaewsapsak P; Xu J; Boettiger AN; Chang HY; Ting AY, Atlas of subcellular RNA localization revealed by APEX-seq. Cell, 2019, 178 (2), 473–490. e26. [DOI] [PMC free article] [PubMed] [Google Scholar]
- 10.Martell JD; Yamagata M; Deerinck TJ; Phan S; Kwa CG; Ellisman MH; Sanes JR; Ting AY, A split horseradish peroxidase for the detection of intercellular protein–protein interactions and sensitive visualization of synapses. Nat. Biotech, 2016, 34 (7), 774–780. [DOI] [PMC free article] [PubMed] [Google Scholar]
- 11.Reinke AW; Mak R; Troemel ER; Bennett EJ, In vivo mapping of tissue-and subcellular-specific proteomes in Caenorhabditis elegans. Sci. Adv, 2017, 3 (5), e1602426. [DOI] [PMC free article] [PubMed] [Google Scholar]
- 12.Mannix KM; Starble RM; Kaufman RS; Cooley L, Proximity labeling reveals novel interactomes in live Drosophila tissue. Development, 2019, 146 (14), dev176644. [DOI] [PMC free article] [PubMed] [Google Scholar]
- 13.Choi‐Rhee E; Schulman H; Cronan JE, Promiscuous protein biotinylation by Escherichia coli biotin protein ligase. Protein Sci, 2004, 13 (11), 3043–3050. [DOI] [PMC free article] [PubMed] [Google Scholar]
- 14.Roux KJ; Kim DI; Raida M; Burke B, A promiscuous biotin ligase fusion protein identifies proximal and interacting proteins in mammalian cells. J. Cell Biol, 2012, 196 (6), 801–810. [DOI] [PMC free article] [PubMed] [Google Scholar]
- 15.Khan M; Youn J-Y; Gingras A-C; Subramaniam R; Desveaux D, In planta proximity dependent biotin identification (BioID). Sci. Rep, 2018, 8 (1), 1–8. [DOI] [PMC free article] [PubMed] [Google Scholar]
- 16.Uezu A; Kanak DJ; Bradshaw TW; Soderblom EJ; Catavero CM; Burette AC; Weinberg RJ; Soderling SH, Identification of an elaborate complex mediating postsynaptic inhibition. Science, 2016, 353 (6304), 1123–1129. [DOI] [PMC free article] [PubMed] [Google Scholar]
- 17.Ramanathan M; Majzoub K; Rao DS; Neela PH; Zarnegar BJ; Mondal S; Roth JG; Gai H; Kovalski JR; Siprashvili Z, RNA–protein interaction detection in living cells. Nat. Methods, 2018, 15 (3), 207. [DOI] [PMC free article] [PubMed] [Google Scholar]
- 18.Branon TC; Bosch JA; Sanchez AD; Udeshi ND; Svinkina T; Carr SA; Feldman JL; Perrimon N; Ting AY, Efficient proximity labeling in living cells and organisms with TurboID. Nat. Biotech, 2018, 36 (9), 880–887. [DOI] [PMC free article] [PubMed] [Google Scholar]
- 19.Geri JB; Oakley JV; Reyes-Robles T; Wang T; McCarver SJ; White CH; Rodriguez-Rivera FP; Parker DL; Hett EC; Fadeyi OO; Oslund RC; MacMillan DW, Microenvironment mapping via Dexter energy transfer on immune cells. Science, 2020, 367 (6482), 1091–1097. [DOI] [PMC free article] [PubMed] [Google Scholar]
- 20.Seath CP; Burton AJ; MacMillan DW; Muir TW, Tracking chromatin state changes using μMap photo-proximity labeling. bioRxiv, 2021. DOI: 10.1101/2021.09.28.462236. (accessed 2022-03-24). [DOI] [PMC free article] [PubMed] [Google Scholar]
- 21.Trowbridge AD; Seath CP; Rodriguez-Rivera FP; Li BX; Dul BE; Schwaid AG; Geri JB; Oakley JV; Fadeyi OO; Oslund RC, et al. Small molecule photocatalysis enables drug target identification via energy transfer. bioRxiv, 2021. DOI: 10.1101/2021.08.02.454797. (accessed 2022-03-24). [DOI] [PMC free article] [PubMed] [Google Scholar]
- 22.Oslund RC; Reyes-Robles T; White CH; Tomlinson JH; Crotty KA; Bowman EP; Chang D; Peterson VM; Li L; Frutos S, et al. Detection of Cell-Cell Interactions via Photocatalytic Cell Tagging. bioRxiv, 2021. DOI: 10.1101/2021.10.04.463039. (accessed 2022-03-24). [DOI] [PubMed] [Google Scholar]
- 23.Wang H; Zhang Y; Zeng K; Qiang J; Cao Y; Li Y; Fang Y; Zhang Y; Chen Y, Selective Mitochondrial Protein Labeling Enabled by Biocompatible Photocatalytic Reactions inside Live Cells. JACS Au, 2021, 1, 1066–1075. [DOI] [PMC free article] [PubMed] [Google Scholar]
- 24.Ash C; Dubec M; Donne K; Bashford T, Effect of wavelength and beam width on penetration in light-tissue interaction using computational methods. Lasers Medical Sci, 2017, 32 (8), 1909–1918. [DOI] [PMC free article] [PubMed] [Google Scholar]
- 25.Leyshon LJ; Reiser A, Sensitized photodecomposition of phenyl azide and α-naphthyl azide. J. Chem. Soc., Faraday Trans. 2, 1972, 68 (0), 1918–1927. [Google Scholar]
- 26.Our group submitted a provisional patent (No. 63/076,099) on this technology on 09/09/2020. Later, during the preparation of this manuscript, a conceptually similar technology was published as a pre-print. Tay N; Ryu KA; Weber J; Olow A; Reichman D; Oslund R; Fadeyi O; Rovis T, Targeted Activation in Localized Protein Environments via Deep Red Photoredox Catalysis. chemRxiv, 2021, DOI: 10.26434/chemrxiv-2021-x9bjv. (accessed 2022-03-24). [DOI] [PMC free article] [PubMed] [Google Scholar]
- 27.Wagner BD; Ruel G; Lusztyk J, Absolute Kinetics of Aminium Radical Reactions with Olefins in Acetonitrile Solution1. J. Am. Chem. Soc, 1996, 118 (1), 13–19. [Google Scholar]
- 28.Stark C; Breitkreutz B-J; Reguly T; Boucher L; Breitkreutz A; Tyers M, BioGRID: a general repository for interaction datasets. Nucleic Acids Res, 2006, 34 (1), D535–D539. [DOI] [PMC free article] [PubMed] [Google Scholar]
- 29.Perez A; Neskey DM; Wen J; Pereira L; Reategui EP; Goodwin WJ; Carraway KL; Franzmann EJ, CD44 interacts with EGFR and promotes head and neck squamous cell carcinoma initiation and progression. Oral Oncol, 2013, 49 (4), 306–313. [DOI] [PMC free article] [PubMed] [Google Scholar]
- 30.Vouri M; Croucher D; Kennedy S; An Q; Pilkington G; Hafizi S, Axl-EGFR receptor tyrosine kinase hetero-interaction provides EGFR with access to pro-invasive signalling in cancer cells. Oncogenesis, 2016, 5 (10), e266–e266. [DOI] [PMC free article] [PubMed] [Google Scholar]
- 31.Stallaert W; Brüggemann Y; Sabet O; Baak L; Gattiglio M; Bastiaens PI, Contact inhibitory Eph signaling suppresses EGF-promoted cell migration by decoupling EGFR activity from vesicular recycling. Sci. Signal, 2018, 11 (541). eaat0114. [DOI] [PubMed] [Google Scholar]
- 32.Ikuta K; Kina T; MacNeil I; Uchida N; Peault B; Chien Y -h.; Weissman, I. L., A developmental switch in thymic lymphocyte maturation potential occurs at the level of hematopoietic stem cells. Cell, 1990, 62 (5), 863–874. [DOI] [PubMed] [Google Scholar]
- 33.Kina T; Ikuta K; Takayama E; Wada K; Majumdar AS; Weissman IL; Katsura Y, The monoclonal antibody TER‐119 recognizes a molecule associated with glycophorin A and specifically marks the late stages of murine erythroid lineage. Br. J. Haematol, 2000, 109 (2), 280–287. [DOI] [PubMed] [Google Scholar]
- 34.Pasini EM; Kirkegaard M; Salerno D; Mortensen P; Mann M; Thomas AW, Deep coverage mouse red blood cell proteome. Mol. Cell. Proteomics, 2008, 7 (7), 1317–1330. [DOI] [PubMed] [Google Scholar]
- 35.Peng Z; Li X; Pivkin IV; Dao M; Karniadakis GE; Suresh S, Lipid bilayer and cytoskeletal interactions in a red blood cell. Proc. Natl. Acad. Sci, 2013, 110 (33), 13356–13361. [DOI] [PMC free article] [PubMed] [Google Scholar]
- 36.Sletten EM; Bertozzi CR, From mechanism to mouse: a tale of two bioorthogonal reactions. Acc. Chem. Res, 2011, 44 (9), 666–676. [DOI] [PMC free article] [PubMed] [Google Scholar]
- 37.Chang PV; Prescher JA; Sletten EM; Baskin JM; Miller IA; Agard NJ; Lo A; Bertozzi CR, Copper-free click chemistry in living animals. Proc. Natl. Acad. Sci, 2010, 107 (5), 1821–1826. [DOI] [PMC free article] [PubMed] [Google Scholar]
Associated Data
This section collects any data citations, data availability statements, or supplementary materials included in this article.
Supplementary Materials
Experimental procedures, characterization data, and supplementary figures (PDF)
Tables S1-S2 (proteomic datasets) (.xls)